english - la mesa-spring valley school
TRANSCRIPT

1
La Mesa Middle School Accountability Report Card
Reported Using Data from the 2010–11 School Year
Published During 2011–12
Every school in California is required by state law to publish a School Accountability Report Card (SARC), by
February 1 of each year. The SARC contains information about the condition and performance of each California
public school.
For more information about SARC requirements, see the California Department of Education (CDE) SARC
Web page at http://www.cde.ca.gov/ta/ac/sa/.
For additional information about the school, parents and community members should contact the school
principal or the district office.
I. Data and Access
Ed-Data Partnership Web Site
Ed-Data is a partnership of the CDE, EdSource, and the Fiscal Crisis and Management Assistance Team (FCMAT)
that provides extensive financial, demographic, and performance information about California’s public kindergarten
through grade twelve school districts and schools.
DataQuest
DataQuest is an online data tool located on the CDE DataQuest Web page at http://dq.cde.ca.gov/dataquest/ that
contains additional information about this school and comparisons of the school to the district, the county, and the
state. Specifically, DataQuest is a dynamic system that provides reports for accountability (e.g., state Academic
Performance Index [API], federal Adequate Yearly Progress [AYP]), test data, enrollment, high school graduates,
dropouts, course enrollments, staffing, and data regarding English learners.
Internet Access
Internet access is available at public libraries and other locations that are publicly accessible (e.g., the California
State Library). Access to the Internet at libraries and public locations is generally provided on a first-come, first-
served basis. Other use restrictions may include the hours of operation, the length of time that a workstation may
be used (depending on availability), the types of software programs available on a workstation, and the ability to
print documents.

2
II. About This School
Contact Information (School Year 2011–12)
School District
School Name
La Mesa Middle District Name La Mesa-Spring Valley
Street 4200 Parks Ave. Phone Number (619) 668-5700
City, State, Zip
La Mesa, CA, 91941 Web Site www.lmsvsd.k12.ca.us
Phone Number
(619) 668-5730 Superintendent Brian Marshall
Principal Beth Thomas, Principal E-mail Address [email protected]
E-mail Address
[email protected] CDS Code 37681976038491
School Description and Mission Statement (School Year 2010–11)
La Mesa Middle School was built in 1951 with an initial capacity of 1,050. It has continually been modernized as the need came about and the funds were available. The school is modernized and it has all of the environmental updates needed to meet the needs of students and staff. We now house approximately 1,050 students divided into three grade-level Professional Learning Communities (PLCs). A dean of students provides basic student management structure, and two counselors provide services including individual counseling as well as scheduling students. A Principal oversees the on-site direction of all school processes. Mission Statement The LMMS community exists to ensure learning for all students and to help them grow into productive members of our society. Vision Statement
If LMMS is to be a community of learners striving for mastery of the state’s academic standards then we must commit to
providing clear learning objectives to the school community, as well as a safe environment where learning can take place, and a process of assessment that affords access for students who do not show mastery and enrichment for the ones who do.
Opportunities for Parental Involvement (School Year 2010–11)
La Mesa Middle School has an active School Site Council (SSC). The SSC is an elected group of parents, students and school staff who meet quarterly to oversee the implementation of the Single Plan for Student Achievement (SPSA).
Each PLC has parent leads who support the PLCs by selecting and coordinating parent volunteers.
All parents are welcome and encouraged to volunteer at La Mesa Middle School in the classrooms and elsewhere.
The PTSA board is active at La Mesa Middle School. They provide invaluable school support within the parameter of PTSA involvement.
We also invite our parents of our English Learners to become involved in our English Language Advisory Council (ELAC).
Please contact our office manager, Valerie Armstrong, at 668-5730 ext. 2197 if you are interested in participating in any of these groups.

3
Student Enrollment by Grade Level (School Year 2010–11)
Grade Level Number of Students
GRADE 6 322
Grade 7 326
Grade 8 381
Total Enrollment 1,029
Student Enrollment by Subgroup (School Year 2010–11)
Group Percent of Total Enrollment
Black or African American 15.5%
American Indian or Alaska Native 0.6%
Asian 6.2%
Filipino 1.7%
Hispanic or Latino 39.9%
Native Hawaiian or Pacific Islander 0.5%
White 32.6%
Two or More Races 3.0%
Socioeconomically Disadvantaged 53.4%
English Learners 20.9%
Students with Disabilities 8.8%

4
Average Class Size and Class Size Distribution (Secondary)
Subject Avg.
Class Size
2008–09 Number of Classes*
Avg. Clas
s
Size
2009–10 Number of Classes*
Avg.
Class Size
2010–11 Number of Classes*
1-22 23-32 33+ 1-22 23-32 33+ 1-22 23-32 33+
English 29.7 1 15 9 27.0 6 27 6 27.3 9 4 16
Mathematics 30.3 1 14 9 27.5 8 22 6 29.2 6 9 11
Science 30.5 0 18 6 29.4 4 17 12 33.2 0 6 14
Social Science 30.7 2 13 11 29.2 1 26 6 32.8 1 6 14
* Number of classes indicates how many classrooms fall into each size category (a range of total students per
classroom). At the secondary school level, this information is reported by subject area rather than grade level.
III. School Climate
School Safety Plan (School Year 2010–11)
Current site Comprehensive School Safety Plans (CSSP) are received by the District each year and are approved by the La Mesa-Spring Valley School Board of Education. Each site's plan outlines systems, programs, and practices in place to ensure a safe school environment including, but not limited to, child abuse reporting, disaster preparedness, campus access, and drug and alcohol education and cessation. Each site has one teacher appointed as the school's Health and Safety Officer. This person and the site principal presented their School Safety Plans to their respective School Site Counsel for review and acceptance prior to submission to the Board of Education.
CSSP presented to School Site Council: December 2011
Suspensions and Expulsions
Rate* School
2008–09 School
2009–10 School
2010–11 District
2008–09 District
2009–10 District
2010–11
Suspensions 352 672 203 1,676 2,753 1,275
Expulsions 0 3 1 0 7 2
* The rate of suspensions and expulsions is calculated by dividing the total number of incidents by the total
enrollment.

5
IV. School Facilities
School Facility Conditions and Planned Improvements (School Year 2011–12)
This school was the recipient of significant renovation/remodeling as a result of the District receiving local bond funds and
state modernization. Improvements included new HVAC systems, schoolwide electrical and data infrastructure upgrades and ADA improvements.
School Facility Good Repair Status (School Year 2011–12)
System Inspected Repair Status Repair Needed and Action Taken
or Planned Exemplary Good Fair Poor
Systems: Gas Leaks, Mechanical/HVAC, Sewer
X
Interior: Interior Surfaces
X Ceiling tiles repaired or replaced. Plaster repaired and painted.
Cleanliness: Overall Cleanliness, Pest/ Vermin Infestation
X
Electrical: Electrical
X
Restrooms/Fountains: Restrooms, Sinks/ Fountains
X
Safety: Fire Safety, Hazardous Materials
X
Structural: Structural Damage, Roofs
X
External: Playground/School
Grounds, Windows/ Doors/Gates/Fences
X
Overall Rating
Note: Cells shaded in black do not require data.

6
V. Teachers
Teacher Credentials
Teachers School
2008–09
School
2009–10
School
2010–11
District
2010–11
With Full Credential 55 44 41 565
Without Full Credential 0 0 0 0
Teaching Outside Subject Area of Competence (with full credential)
0 0 0 0
Teacher Misassignments and Vacant Teacher Positions
Indicator 2009–10 2010–11 2011–12
Misassignments of Teachers of English Learners 0 0 0
Total Teacher Misassignments* 0 0 0
Vacant Teacher Positions 0 0 0
Note: “Misassignments” refers to the number of positions filled by teachers who lack legal authorization to teach
that grade level, subject area, student group, etc.
* Total Teacher Misassignments includes the number of Misassignments of Teachers of English Learners.
Core Academic Classes Taught by Highly Qualified Teachers (School Year 2010–11)
The Federal Elementary and Secondary Education Act (ESEA), also known as No Child Left Behind (NCLB), requires
that core academic subjects be taught by Highly Qualified Teachers, defined as having at least a bachelor’s degree,
an appropriate California teaching credential, and demonstrated core academic subject area competence. For more
information, see the CDE Improving Teacher and Principal Quality Web page at: http://www.cde.ca.gov/nclb/sr/tq/
Location of Classes
Percent of Classes In Core Academic
Subjects Taught by Highly Qualified Teachers
Percent of Classes In Core Academic
Subjects Not Taught by Highly Qualified Teachers
This School 100.00% 0.00%
All Schools in District 100.00% 0.00%
High-Poverty Schools in District
100.00% 0.00%
Low-Poverty
Schools in District
100.00% 0.00%
Note: High-poverty schools are defined as those schools with student eligibility of approximately 40 percent or
more in the free and reduced price meals program. Low-poverty schools are those with student eligibility of
approximately 25 percent or less in the free and reduced price meals program.

7
VI. Support Staff
Academic Counselors and Other Support Staff (School Year 2010–11)
Title Number of FTE* Assigned
to School
Average Number of Students
per Academic Counselor
Academic Counselor 0 0
Counselor (Social/Behavioral or Career Development)
1.0
Library Media Teacher (librarian) 0
Library Media Services Staff (paraprofessional)
1.0
Psychologist .40
Social Worker 0
Nurse .17
Speech/Language/Hearing Specialist .30
Resource Specialist (non-teaching) .10
Other 0
Note: Cells shaded in black do not require data.
* One Full-Time Equivalent (FTE) equals one staff member working full-time; one FTE could also represent two
staff members who each work 50 percent of full-time.

8
VII. Curriculum and Instructional Materials
Quality, Currency, Availability of Textbooks and Instructional Materials (School Year 2011–12)
This section describes whether the textbooks and instructional materials used at the school are from the most
recent adoption; whether there are sufficient textbooks and instruction materials for each student; and information
about the school’s use of any supplemental curriculum or non-adopted textbooks or instructional materials.
Year and month in which data were collected: January 2012
All materials were selected from the most recent list of standards-based materials adopted by the State Board of Education, and are consistent with the content and cycles of the curriculum frameworks adopted by the State Board of Education.
Core Curriculum Area
Textbooks and instructional materials/year of adoption
From most recent adoption?
Percent students
lacking own assigned copy
Reading/Language Arts
Holt Rinehart Winston— Literature & Language Arts
2003/no 0%
Mathematics
Pre-Algebra: Glencoe—California Mathematics: Concepts, Skills, and Problem Solving Algebra: Holt—Algebra 1; Algebra Readiness: McDougall Littell—Algebra Readiness Geometry: Holt—Geometry
2008/yes
0%
Science/Health Holt Rinehart Winston— Holt California Science
2007/yes 0%
History-Social Science
Glencoe McGraw-Hill— 7th: Discovering Our Past, Medieval and Early Modern Times 8th: Discovering Our Past: The American Journey to World War I
2006/yes 0%
Foreign Language Prentice Hall— Realidades
2004/yes 0%
English Language Development
National Geographic—Inside Hampton-Brown - High Point
2009/yes 0%

9
VIII. School Finances
Expenditures Per Pupil and School Site Teacher Salaries (Fiscal Year 2009–10)
Level
Total
Expenditures Per Pupil
Expenditures Per Pupil
(Supplemental / Restricted)
Expenditures Per
Pupil (Basic / Unrestricted)
Average Teacher
Salary
School Site $5,343 $783 $4,560 $75,702
District
$5,112 $72,443
Percent
Difference – School Site and District
89% 104%
State
$5,455 $69,419
Percent
Difference – School Site and State
84% 109%
Note: Cells shaded in black do not require data.
Supplemental/Restricted expenditures come from money whose use is controlled by law or by a donor. Money
that is designated for specific purposes by the district or governing board is not considered restricted.
Basic/unrestricted expenditures are from money whose use, except for general guidelines, is not controlled by
law or by a donor.
For detailed information on school expenditures for all districts in California, see the CDE Current Expense of
Education & Per-pupil Spending Web page at http://www.cde.ca.gov/ds/fd/ec/. For information on teacher salaries
for all districts in California, see the CDE Certificated Salaries & Benefits Web page at
http://www.cde.ca.gov/ds/fd/cs/. To look up expenditures and salaries for a specific school district, see the Ed-
Data Web site at: http://www.ed-data.org.
Types of Services Funded (Fiscal Year 2010–11)
ARRA Title I Part A – Basic Grants, Low Income and Neglected
ARRA – State Fiscal Stabilization Funds
Title IV – Safe and Drug Free Schools and Communities
Title II Part A – Improving Teacher Quality
Title II Part A – Principal Training
Title II Part D – Technology
Title III – Immigrant Education
Title III Part A – Limited English
ELAP – English Language Acquisition Program
LOTTERY – Instructional Materials
TUPE – Tobacco Use Prevention Education
Transportation Home to School
Special Education
Workability Special Education
Transportation Home to School
EIA – Economic Impact Aid

10
Teacher and Administrative Salaries (Fiscal Year 2009–10)
Category District Amount State Average For Districts In
Same Category
Beginning Teacher Salary $42,704 $41,692
Mid-Range Teacher Salary $63,607 $68,251
Highest Teacher Salary $87,174 $86,582
Average Principal Salary (Elementary) $114,589 $108,334
Average Principal Salary (Middle) $112,743 $111,791
Average Principal Salary (High) $0 $113,648
Superintendent Salary $171,000 $180,492
Percent of Budget for Teacher Salaries 46.00% 42.00%
Percent of Budget for Administrative Salaries 5.00% 6.00%
Note: For detailed information on salaries, see the CDE Certificated Salaries & Benefits Web page at
http://www.cde.ca.gov/ds/fd/cs/.
IX. Student Performance
Standardized Testing and Reporting Program
The Standardized Testing and Reporting (STAR) Program consists of several key components, including:
California Standards Tests (CSTs), which include English-language arts (ELA) and mathematics in
grades two through eleven; science in grades five, eight, and nine through eleven; and history-social
science in grades eight, and nine through eleven.
California Modified Assessment (CMA), an alternate assessment that is based on modified
achievement standards in ELA for grades three through eleven; mathematics for grades three through
seven, Algebra I, and Geometry; and science in grades five and eight, and Life Science in grade ten. The
CMA is designed to assess those students whose disabilities preclude them from achieving grade-level
proficiency on an assessment of the California content standards with or without accommodations.
California Alternate Performance Assessment (CAPA), includes ELA and mathematics in grades two
through eleven, and science for grades five, eight, and ten. The CAPA is given to those students with
significant cognitive disabilities whose disabilities prevent them from taking either the CSTs with
accommodations or modifications or the CMA with accommodations.

11
The assessments under the STAR Program show how well students are doing in relation to the state content
standards. On each of these assessments, student scores are reported as performance levels.
For detailed information regarding the STAR Program results for each grade and performance level, including the
percent of students not tested, see the CDE STAR Results Web site at http://star.cde.ca.gov.
Standardized Testing and Reporting Results for All Students – Three-Year Comparison
Subject
Percent of Students Scoring at Proficient or Advanced (meeting or exceeding the state standards)
School District State
2008–
09
2009–
10
2010–
11
2008–
09
2009–
10
2010–
11
2008–
09
2009–
10
2010–
11
English-Language Arts 55% 55% 55% 55% 56% 57% 49% 52% 54%
Mathematics 43% 49% 47% 55% 57% 58% 46% 48% 50%
Science 61% 70% 68% 60% 64% 65% 50% 54% 57%
History-Social Science 42% 47% 48% 43% 49% 52% 41% 44% 48%
Note: Scores are not shown when the number of students tested is ten or less, either because the
number of students in this category is too small for statistical accuracy or to protect student privacy.
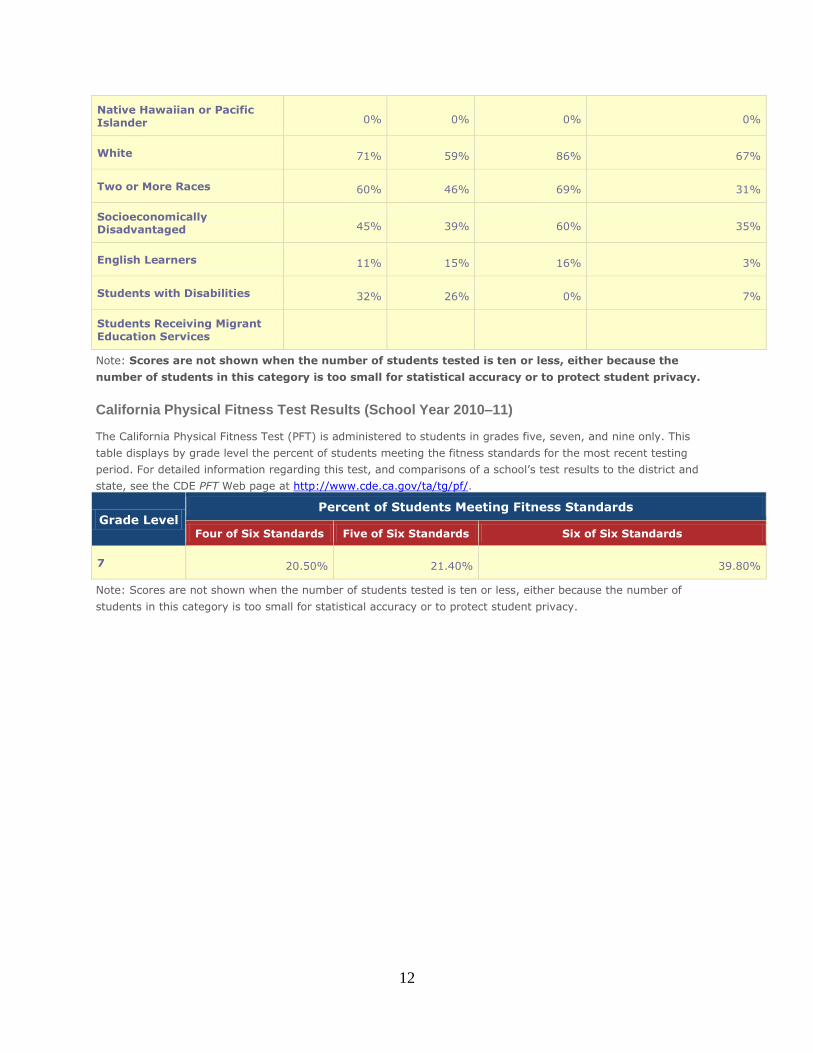
Standardized Testing and Reporting Results by Student Group – Most Recent Year
Group
Percent of Students Scoring at Proficient or Advanced
English-
Language Arts Mathematics Science History- Social Science
All Students in the LEA 57% 58% 65% 52%
All Students at the School 55% 47% 68% 48%
Male 51% 45% 68% 49%
Female 60% 49% 68% 47%
Black or African American 40% 34% 60% 38%
American Indian or Alaska Native 0% 0% 0% 0%
Asian 68% 67% 84% 69%
Filipino 60% 35% 0% 0%
Hispanic or Latino 46% 40% 53% 33%
12
Native Hawaiian or Pacific Islander 0% 0% 0% 0%
White 71% 59% 86% 67%
Two or More Races 60% 46% 69% 31%
Socioeconomically Disadvantaged 45% 39% 60% 35%
English Learners 11% 15% 16% 3%
Students with Disabilities 32% 26% 0% 7%
Students Receiving Migrant Education Services
Note: Scores are not shown when the number of students tested is ten or less, either because the
number of students in this category is too small for statistical accuracy or to protect student privacy.
California Physical Fitness Test Results (School Year 2010–11)
The California Physical Fitness Test (PFT) is administered to students in grades five, seven, and nine only. This
table displays by grade level the percent of students meeting the fitness standards for the most recent testing
period. For detailed information regarding this test, and comparisons of a school’s test results to the district and
state, see the CDE PFT Web page at http://www.cde.ca.gov/ta/tg/pf/.
Grade Level Percent of Students Meeting Fitness Standards
Four of Six Standards Five of Six Standards Six of Six Standards
7 20.50% 21.40% 39.80%
Note: Scores are not shown when the number of students tested is ten or less, either because the number of
students in this category is too small for statistical accuracy or to protect student privacy.

13
X. Accountability
Academic Performance Index
The Academic Performance Index (API) is an annual measure of state academic performance and progress of
schools in California. API scores range from 200 to 1,000, with a statewide target of 800. For detailed information
about the API, see the CDE API Web page at http://www.cde.ca.gov/ta/ac/ap/.
Academic Performance Index Ranks – Three-Year Comparison
This table displays the school’s statewide and similar schools’ API ranks. The statewide API rank ranges from 1
to 10. A statewide rank of 1 means that the school has an API score in the lowest ten percent of all schools in the
state, while a statewide rank of 10 means that the school has an API score in the highest ten percent of all schools
in the state.
The similar schools API rank reflects how a school compares to 100 statistically matched “similar schools.” A
similar schools rank of 1 means that the school’s academic performance is comparable to the lowest performing ten
schools of the 100 similar schools, while a similar schools rank of 10 means that the school’s academic
performance is better than at least 90 of the 100 similar schools.
API Rank 2008 2009 2010
Statewide 7 6 6
Similar Schools 7 6 3

14
Academic Performance Index Growth by Student Group – Three-Year Comparison
Group Actual API Change
2008–09 Actual API Change
2009–10 Actual API Change
2010–11
All Students at the School 8 5 10
Black or African American 5 7 -10
American Indian or Alaska Native
Asian
Filipino
Hispanic or Latino 18 3 10
Native Hawaiian or Pacific Islander
White 8 -4 27
Two or More Races N/D
Socioeconomically Disadvantaged 4 5 19
English Learners 7 10 1
Students with Disabilities -13 -7
Note: “N/D” means that no data were available to the CDE or LEA to report. “B” means the school did not have a
valid API Base and there is no Growth or target information. “C” means the school had significant demographic
changes and there is no Growth or target information.
15
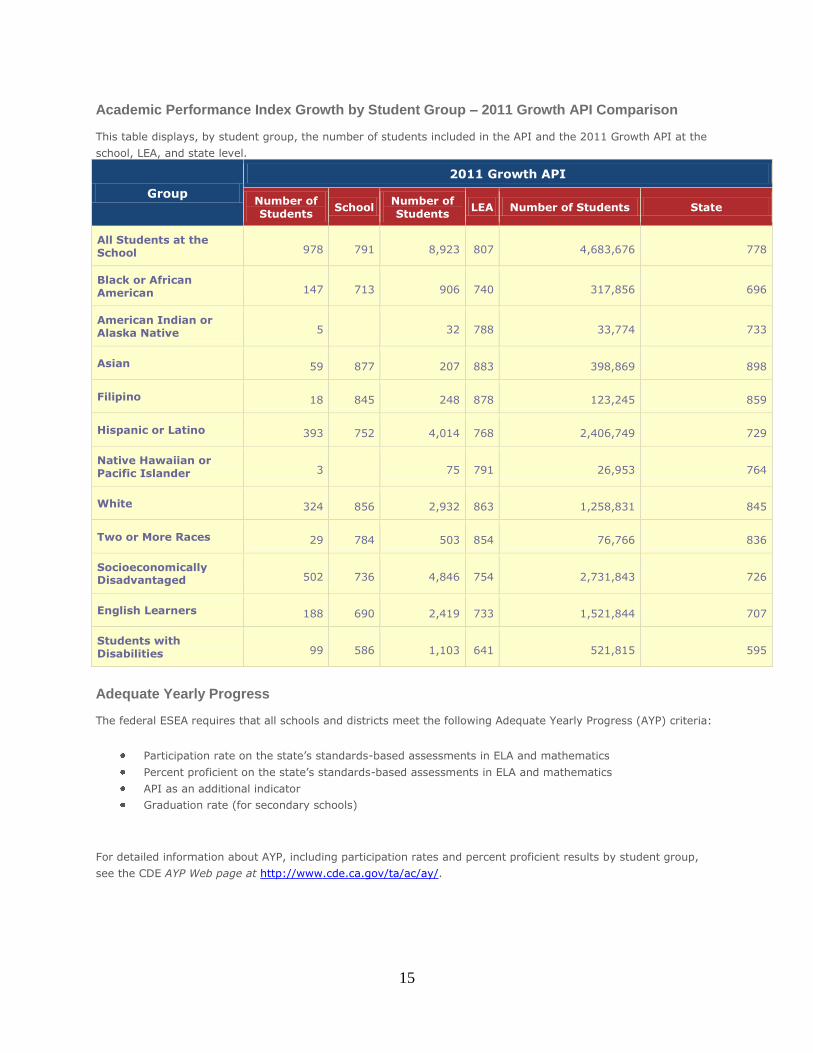
Academic Performance Index Growth by Student Group – 2011 Growth API Comparison
This table displays, by student group, the number of students included in the API and the 2011 Growth API at the
school, LEA, and state level.
Group
2011 Growth API
Number of
Students School
Number of
Students LEA Number of Students State
All Students at the School 978 791 8,923 807 4,683,676 778
Black or African American 147 713 906 740 317,856 696
American Indian or Alaska Native 5
32 788 33,774 733
Asian 59 877 207 883 398,869 898
Filipino 18 845 248 878 123,245 859
Hispanic or Latino 393 752 4,014 768 2,406,749 729
Native Hawaiian or Pacific Islander 3
75 791 26,953 764
White 324 856 2,932 863 1,258,831 845
Two or More Races 29 784 503 854 76,766 836
Socioeconomically Disadvantaged 502 736 4,846 754 2,731,843 726
English Learners 188 690 2,419 733 1,521,844 707
Students with Disabilities 99 586 1,103 641 521,815 595
Adequate Yearly Progress
The federal ESEA requires that all schools and districts meet the following Adequate Yearly Progress (AYP) criteria:
Participation rate on the state’s standards-based assessments in ELA and mathematics
Percent proficient on the state’s standards-based assessments in ELA and mathematics
API as an additional indicator
Graduation rate (for secondary schools)
For detailed information about AYP, including participation rates and percent proficient results by student group,
see the CDE AYP Web page at http://www.cde.ca.gov/ta/ac/ay/.

16
Adequate Yearly Progress Overall and by Criteria (School Year 2010–11)
AYP Criteria School District
Made AYP Overall No No
Met Participation Rate - English-Language Arts Yes Yes
Met Participation Rate - Mathematics Yes Yes
Met Percent Proficient - English-Language Arts No No
Met Percent Proficient - Mathematics No No
Met API Criteria Yes Yes
Met Graduation Rate N/A N/A
Federal Intervention Program (School Year 2011–12)
Schools and districts receiving federal Title I funding enter Program Improvement (PI) if they do not make AYP for
two consecutive years in the same content area (ELA or mathematics) or on the same indicator (API or graduation
rate). After entering PI, schools and districts advance to the next level of intervention with each additional year
that they do not make AYP. For detailed information about PI identification, see the CDE PI Status Determinations
Web page: http://www.cde.ca.gov/ta/ac/ay/tidetermine.asp.
Indicator School District
Program Improvement Status
In PI
First Year of Program Improvement
2008-2009
Year in Program Improvement
Year 3
Number of Schools Currently in Program Improvement
8
Percent of Schools Currently in Program Improvement
36.4%
Note: Cells shaded in black do not require data.

17
XII. Instructional Planning and Scheduling
Professional Development
This section provides information on the annual number of school days dedicated to staff development for the most
recent three-year period.
Professional Development is not a one-time event in La Mesa-Spring Valley. Specific professional development takes place
during approximately half of the 175 days students are in school. Teacher training is also offered during student breaks and summer. The District Instructional Focus Areas include:
1. Professional Learning Communities (PLCs) and Data Analysis 2. Student Engagement: Learning Targets, Descriptive Feedback, Marzano Strategies of summarizing and note
taking, similarities and differences, and recognition, and Technology Innovations 3. Nonfiction Writing: Writing to Learn strategies 4. English Learners: ELD, Listen and Sketch, Think-Pair-Share, and Cognitive Content Dictionary 5. Students with Disabilities
Professional Development focuses on these areas, as well as fidelity to the adopted curricular programs. PLCs: Professional learning communities of teachers at the same grade level and content area work collaboratively every Tuesday afternoon (modified student days) focusing on improving student learning. This includes a study of Essential Standards, writing SMART goals (strategic, measurable, attainable, results oriented, time bound), analyzing student assessment data, and planning interventions and enrichment for students. Student Engagement: Ten of the modified Tuesdays are dedicated as Site Learning Days, with principals providing staff development for teachers in the areas of Learning Targets, descriptive feedback, and Marzano Strategies. Many sites in the district have purchased new technology, (e.g. iPads, iPods, SMART Boards, etc.) to increase student engagement and fluency of English learners. In addition to initial training for teachers, monthly meetings are being held for “user groups” to come together and learn new applications and strategies for using the technologies in the classroom.
Nonfiction Writing: Increased nonfiction writing has consistently been shown to have a positive effect on student learning in all content areas. During the 2011-12 and 2012-13 school years, teachers will be given the opportunity to attend Writing to Learn workshops focusing 1) processes and products, 2) instructional strategies for nonfiction writing, and 3) assessing nonfiction writing.
English Learners: During the 2011-12 and 2012-13 school year, the district is focusing much of the professional development on increasing learning for English learners. This includes a three-day training on ELD and SDAIE strategies.
Students with disabilities: Intervention materials for students two or more years below grade level have been adopted for both special education and general education students. Teachers providing interventions (both general education and special education) are receiving training in the use of these materials. Special education paraprofessionals are also being trained in the new materials in order to allow them to support students in their learning. Principals are receiving training in each of these programs used at their sites as well.
Fidelity to adopted curricular programs: The district adopted new English language arts and mathematics programs for the 2009-2010 school year. Due to this and the district Program Improvement status, professional development for the 09-10 and 10-11 school year focused on the implementation of these programs. All teachers attended the five day SB 472 training in both language arts and mathematics. Principals have attended the AB 430 training aligned to the adopted programs as well.
Additionally, new teachers are supported by the Beginning Teacher Support and Assessment (BTSA)/Induction program
through support providers. The Peer Assistance and Review program supports teachers experiencing difficulty. Classified staff, including clerical and custodial, are given training and workshops related to the needs of their jobs.
La Mesa Middle School Accountability Report Card, 2010-2011
La Mesa-Spring Valley Provided by the Ed-Data Partnership
For more information visit www.ed-data.org