engineers salary survey - apegnb
TRANSCRIPT

Atlantic Canada Engineering Salary Survey 2018 Report
Prepared for:
Engineers Nova Scotia
Engineers and Geoscientists New Brunswick
Professional Engineers and Geoscientists Newfoundland & Labrador
Engineers PEI
Prepared by:
Version 1.2
November 05, 2018

Member Salary Survey 2018
2
Table of Contents
Amendments ……….................................................................................................................... 3
Survey Background ................................................................................................................... 4
Salary by Membership Status .................................................................................................... 5
Salary by Membership Status: Comparison Between 2015 and 2018 ....................................... 6
Salary by Year of Graduation .................................................................................................. 7-8
Salary by Year of Graduation and Gender ............................................................................. 8-10
Salary by Post-Graduate Studies .............................................................................................. 11
Salary by Post-Graduate Degree............................................................................................... 12
Salary by Discipline.............................................................................................................. 13-16
Salary by Years of Experience Professional Engineers......................................................... 17-18
Salary by Years of Experience Engineers-in-Training…........................................................ 19-20
Salary by Job Position............................................................................................................... 21
Salary by Sector of Employment ......................................................................................... 22-23
Salary by Sector of Employment: Comparison Between 2015 and 2018............................. 24-25
Vacation by Employment Sector ......................................................................................... 26-29
Overtime Compensation .......................................................................................................... 30
Benefits ................................................................................................................................ 31-32
Overall Satisfaction with Remuneration ................................................................................... 33

Member Salary Survey 2018
3
AMENDMENTS Version 1.1 - October 2018
Updated table seven to display the 2018 data.
Fixed the column labels on the chart on page 32 to accurately reflect Cost
Shared and Non Cost Shared.
Changed table four to display 1983 to 2018 instead of the last decade of
data.
Version 1.2 - November 2018
Updated table thirteen and the chart on page 24 due to suppression
Updated a display issue on Vacation by Sector of Employment on page 28
Moved amendments page to beginning of report

Member Salary Survey 2018
4
This year the Professional Engineers and Geoscientists of Newfoundland and
Labrador (PEGNL), Engineers Nova Scotia, the Association of Professional
Engineers and Geoscientists of New Brunswick (APEGNB), and Engineers PEI
agreed to jointly complete an engineering salary survey. Many members,
employers, and those considering a career in engineering have expressed an
interest in obtaining current statistics on engineering salaries in the Atlantic
region. It has been three years since members were asked to participate in the
last survey.
The 2018 salary survey was conducted and compiled by ClearPicture Corp. This
year 10,776 members were asked to participate in the survey, with 3246
responding for a 30% participation rate. Only the aggregated data has been
presented in this report. Individual members data will be kept confidential and
ClearPicture Corp. will not share that data with anyone.
The mean, median, lower and upper quartiles were calculated using the midpoint
of each of the salary ranges. Where the mean is the average, median is the 50th
percentile, lower quartile is the 25th percentile and the upper quartile is the 75th
percentile.

Member Salary Survey 2018
5
Salary by Membership Status
$59,260 $60,974
$74,194
$58,598 $55,000 $55,000
$65,000
$55,000
$0
$20,000
$40,000
$60,000
$80,000
$100,000
$120,000
APEGNB Engineers NS PEGNL Engineers PEI
1 - Engineer-in-Training Mean Median
$102,131 $101,964
$121,434
$92,899 $95,000 $95,000
$112,500
$95,000
$0
$20,000
$40,000
$60,000
$80,000
$100,000
$120,000
$140,000
APEGNB Engineers NS PEGNL Engineers PEI
2 - Professional Engineer Mean Median

Member Salary Survey 2018
6
Salary by Membership Status: Comparison Between 2015 and 2018
2018 2015
# Mean Median Lower Quartile
Upper Quartile
# Mean Median Lower Quartile
Upper Quartile
Engineer-in-Training
All Associations 553 $62,486 $55,000 $55,000 $65,000 585 $62,867 $55,000 $55,000 $75,000
APEGNB 177 $59,260 $55,000 $37,500 $65,000 152 $58,980 $55,000 $45,000 $65,000
Engineers NS 241 $60,974 $55,000 $55,000 $65,000 256 $59,550 $55,000 $55,000 $65,000
PEGNL 94 $74,194 $65,000 $55,000 $85,000 124 $77,721 $75,000 $65,000 $85,000
Engineers PEI 41 $58,598 $55,000 $55,000 $65,000 53 $55,283 $55,000 $45,000 $55,000
Professional Engineer
All Associations 2577 $106,043 $95,000 $75,000 $112,500 2804 $104,211 $95,000 $75,000 $110,000
APEGNB 773 $102,131 $95,000 $75,000 $112,500 836 $96,913 $95,000 $75,000 $110,000
Engineers NS 1139 $101,964 $95,000 $75,000 $112,500 1259 $101,955 $95,000 $75,000 $110,000
PEGNL 568 $121,434 $112,500 $85,000 $137,500 590 $121,919 $110,000 $95,000 $130,000
Engineers PEI 97 $92,899 $95,000 $75,000 $112,500 118 $90,211 $85,000 $75,000 $110,000

Member Salary Survey 2018
7
Salary by Year of Graduation
$-
$20,000
$40,000
$60,000
$80,000
$100,000
$120,000
$140,000
$160,000
$180,000
$200,000
3 - Salary by Year of Graduation (All Associations)
Mean

Member Salary Survey 2018
8
Graduation Year # of Responses Mean Median Lower Quartile Upper Quartile
1978 12 $123,750 $90,000 $0 $112,500
1979 20 $125,156 $112,500 $77,500 $137,500
1980 25 $124,063 $95,000 $0 $137,500
1981 28 $126,522 $112,500 $90,000 $137,500
1982 44 $125,338 $112,500 $92,500 $137,500
1983 45 $121,474 $112,500 $75,000 $137,500
1984 41 $120,764 $112,500 $85,000 $137,500
1985 41 $120,000 $112,500 $112,500 $137,500
1986 47 $124,886 $112,500 $95,000 $137,500
1987 74 $119,896 $112,500 $95,000 $137,500
1988 48 $119,043 $112,500 $92,500 $137,500
1989 49 $122,234 $112,500 $112,500 $137,500
1990 54 $121,898 $112,500 $87,500 $137,500
1991 57 $118,318 $112,500 $95,000 $137,500
1992 40 $117,500 $112,500 $85,000 $137,500
1993 57 $112,807 $112,500 $85,000 $112,500
1994 60 $125,302 $112,500 $95,000 $143,750
1995 69 $114,258 $112,500 $85,000 $112,500
1996 48 $110,904 $112,500 $92,500 $137,500
1997 80 $113,558 $112,500 $85,000 $137,500
1998 79 $116,875 $112,500 $95,000 $137,500
1999 73 $112,049 $112,500 $85,000 $137,500
2000 65 $110,192 $95,000 $85,000 $137,500
2001 65 $105,363 $112,500 $85,000 $112,500
2002 65 $107,984 $112,500 $85,000 $112,500
2003 88 $106,765 $112,500 $85,000 $112,500
2004 78 $108,026 $103,750 $85,000 $112,500
2005 97 $99,731 $95,000 $75,000 $112,500
2006 91 $96,420 $95,000 $80,000 $112,500
2007 85 $99,719 $95,000 $75,000 $112,500
2008 129 $94,078 $85,000 $75,000 $112,500
2009 110 $88,302 $85,000 $75,000 $95,000
2010 123 $83,196 $75,000 $65,000 $95,000
2011 113 $81,101 $75,000 $65,000 $85,000
2012 93 $75,528 $75,000 $65,000 $85,000
2013 134 $72,386 $75,000 $65,000 $85,000
2014 125 $68,361 $65,000 $55,000 $75,000
2015 121 $61,441 $55,000 $55,000 $65,000
2016 109 $56,651 $55,000 $55,000 $65,000
2017 89 $57,560 $55,000 $55,000 $65,000
2018 11 $57,045 $55,000 $37,500 $55,000

Member Salary Survey 2018
9
Salary by Year of Graduation and Gender
$0
$20,000
$40,000
$60,000
$80,000
$100,000
$120,000
$140,000
$160,000
4 - Salary by Year of Graduation and Gender (Mean)
All Associations
Male
Female

Member Salary Survey 2018
10
Year Male Female
1983 $123,897 $105,000
1984 $120,764
1985 $122,500 $106,250
1986 $123,963 $137,500
1987 $120,198 $119,286
1988 $122,209 $85,000
1989 $125,244 $101,667
1990 $123,750 $111,250
1991 $119,712 $94,167
1992 $117,714 $115,625
1993 $110,833 $128,125
1994 $128,098 $120,500
1995 $115,750 $108,929
1996 $113,625 $95,357
1997 $116,909 $106,023
1998 $118,170 $114,306
1999 $110,727 $116,324
2000 $111,650 $105,333
2001 $107,616 $100,263
2002 $110,208 $100,357
2003 $108,475 $102,885
2004 $106,607 $113,947
2005 $100,000 $99,444
2006 $96,655 $96,094
2007 $102,000 $89,833
2008 $94,333 $92,500
2009 $89,744 $84,286
2010 $83,016 $83,913
2011 $81,694 $78,289
2012 $76,000 $73,875
2013 $72,083 $73,417
2014 $68,283 $68,095
2015 $61,034 $62,581
2016 $56,972 $55,132
2017 $56,992 $58,900
2018 $57,500 $55,000
Member Salary Survey 2018
11
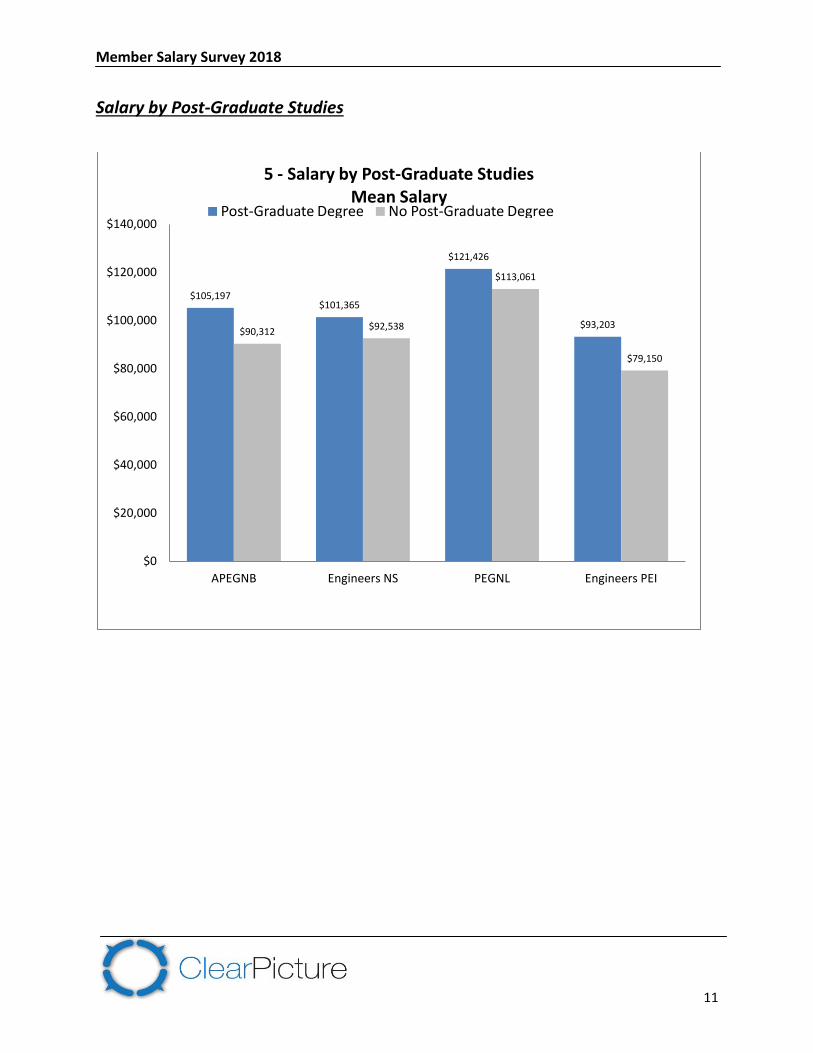
Salary by Post-Graduate Studies
$105,197 $101,365
$121,426
$93,203 $90,312
$92,538
$113,061
$79,150
$0
$20,000
$40,000
$60,000
$80,000
$100,000
$120,000
$140,000
APEGNB Engineers NS PEGNL Engineers PEI
5 - Salary by Post-Graduate Studies Mean Salary
Post-Graduate Degree No Post-Graduate Degree

Member Salary Survey 2018
12
Salary by Post-Graduate Degree
$99,286
$125,912
$193,750
$143,438
$0
$20,000
$40,000
$60,000
$80,000
$100,000
$120,000
$140,000
$160,000
$180,000
$200,000
Engineering MBA Law Computer/Software engineering
6 - Salary by Post-Graduate Degree (All Associations)

Member Salary Survey 2018
13
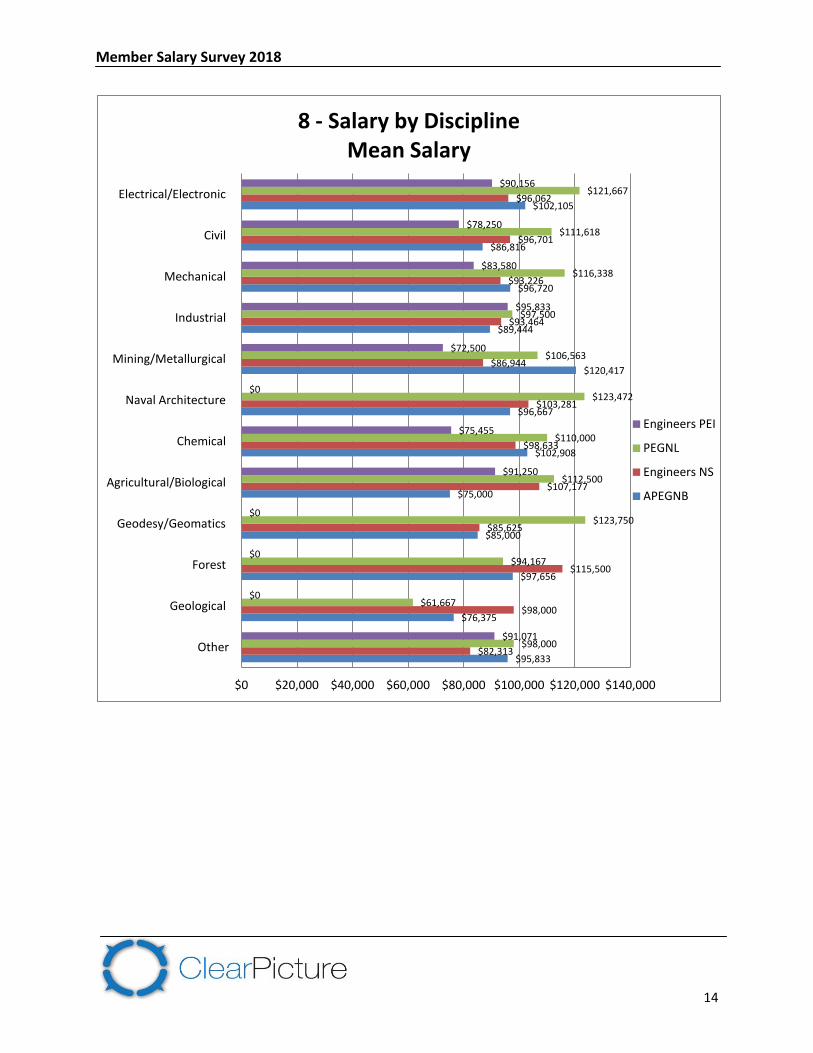
Salary by Discipline
$88,363
$78,879
$100,938
$86,968
$100,581
$100,257
$116,136
$95,292
$93,045
$99,470
$95,825
$104,162
$85,000
$75,000
$95,000
$80,000
$95,000
$95,000
$112,500
$85,000
$85,000
$95,000
$85,000
$95,000
$0 $20,000 $40,000 $60,000 $80,000 $100,000 $120,000 $140,000
Other
Geological
Forest
Geodesy/Geomatics
Agricultural/Biological
Chemical
Naval Architecture
Mining/Metallurgical
Industrial
Mechanical
Civil
Electrical/Electronic
7 - Salary by Discipline (All Associations)
Median
Mean
Member Salary Survey 2018
14
$95,833
$76,375
$97,656
$85,000
$75,000
$102,908
$96,667
$120,417
$89,444
$96,720
$86,816
$102,105
$82,313
$98,000
$115,500
$85,625
$107,177
$98,633
$103,281
$86,944
$93,464
$93,226
$96,701
$96,062
$98,000
$61,667
$94,167
$123,750
$112,500
$110,000
$123,472
$106,563
$97,500
$116,338
$111,618
$121,667
$91,071
$0
$0
$0
$91,250
$75,455
$0
$72,500
$95,833
$83,580
$78,250
$90,156
$0 $20,000 $40,000 $60,000 $80,000 $100,000 $120,000 $140,000
Other
Geological
Forest
Geodesy/Geomatics
Agricultural/Biological
Chemical
Naval Architecture
Mining/Metallurgical
Industrial
Mechanical
Civil
Electrical/Electronic
8 - Salary by Discipline Mean Salary
Engineers PEI
PEGNL
Engineers NS
APEGNB

Member Salary Survey 2018
15
Discipline Association # of Responses
Mean Median Lower Quartile
Upper Quartile
Electrical/ Electronic All Associations 552 $104,162 $95,000 $75,000 $112,500
APEGNB 159 $102,105 $95,000 $75,000 $112,500
Engineers NS 239 $96,062 $85,000 $65,000 $112,500
PEGNL 137 $121,667 $112,500 $85,000 $137,500
Engineers PEI 17 $90,156 $85,000 $55,000 $112,500
Civil All Associations 986 $95,825 $85,000 $65,000 $112,500
APEGNB 340 $86,816 $85,000 $55,000 $112,500
Engineers NS 388 $96,701 $85,000 $65,000 $112,500
PEGNL 217 $111,618 $112,500 $85,000 $137,500
Engineers PEI 41 $78,250 $75,000 $55,000 $95,000
Mechanical All Associations 835 $99,470 $95,000 $65,000 $112,500
APEGNB 215 $96,720 $95,000 $75,000 $112,500
Engineers NS 364 $93,226 $85,000 $65,000 $112,500
PEGNL 211 $116,338 $112,500 $85,000 $137,500
Engineers PEI 45 $83,580 $75,000 $65,000 $95,000
Industrial All Associations 115 $93,045 $85,000 $75,000 $112,500
APEGNB 18 $89,444 $95,000 $77,500 $95,000
Engineers NS 88 $93,464 $85,000 $65,000 $112,500
PEGNL 3 $97,500 $95,000 $90,000 $103,750
Engineers PEI 6 $95,833 $95,000 $87,500 $108,125
Mining/ Metallurgical All Associations 65 $95,292 $85,000 $65,000 $112,500
APEGNB 12 $120,417 $112,500 $82,500 $162,500
Engineers NS 40 $86,944 $75,000 $65,000 $112,500
PEGNL 9 $106,563 $95,000 $75,000 $112,500
Engineers PEI 4 $72,500 $70,000 $65,000 $77,500
Naval Architecture
All Associations 56 $116,136 $112,500 $85,000 $137,500
APEGNB 3 $96,667 $112,500 $88,750 $112,500
Engineers NS 16 $103,281 $103,750 $80,000 $118,750
PEGNL 37 $123,472 $112,500 $85,000 $162,500
Engineers PEI 0 - - - -
Chemical All Associations 199 $100,257 $95,000 $65,000 $112,500
APEGNB 99 $102,908 $95,000 $75,000 $125,000
Engineers NS 75 $98,633 $85,000 $55,000 $112,500
PEGNL 14 $110,000 $95,000 $85,000 $112,500
Engineers PEI 11 $75,455 $65,000 $60,000 $90,000
Agricultural/ Biological All Associations 48 $100,581 $95,000 $72,500 $112,500
APEGNB 8 $75,000 $80,000 $47,500 $95,000
Engineers NS 34 $107,177 $103,750 $85,000 $112,500
PEGNL 2 $112,500 $56,250 $28,125 $84,375
Engineers PEI 4 $91,250 $93,750 $72,500 $112,500
Geodesy/Geomatics All Associations 50 $86,968 $80,000 $57,500 $95,000
APEGNB 23 $85,000 $75,000 $60,000 $90,000
Engineers NS 25 $85,625 $85,000 $55,000 $112,500
PEGNL 2 $123,750 $123,750 $104,375 $143,125

Member Salary Survey 2018
16
Engineers PEI 0 - - - -
Forest All Associations 26 $100,938 $95,000 $67,500 $112,500
APEGNB 16 $97,656 $95,000 $72,500 $112,500
Engineers NS 7 $115,500 $75,000 $32,500 $125,000
PEGNL 3 $94,167 $95,000 $85,000 $103,750
Engineers PEI 0 - - - -
Geological All Associations 32 $78,879 $75,000 $55,000 $87,500
APEGNB 21 $76,375 $75,000 $55,000 $85,000
Engineers NS 7 $98,000 $65,000 $18,750 $125,000
PEGNL 3 $61,667 $55,000 $55,000 $65,000
Engineers PEI 1 - - - -
Other All Associations 148 $88,363 $85,000 $65,000 $112,500
APEGNB 31 $95,833 $85,000 $65,000 $112,500
Engineers NS 83 $82,313 $75,000 $65,000 $95,000
PEGNL 27 $98,000 $95,000 $75,000 $112,500
Engineers PEI 7 $91,071 $65,000 $60,000 $98,750

Member Salary Survey 2018
17
Salary by Years of Experience
$115,833
$106,559
$108,202
$99,180
$91,531
$84,471
$80,893
$75,769
$74,141
$121,390
$110,123
$107,261
$100,475
$92,290
$85,093
$82,467
$71,683
$69,386
$142,194
$137,500
$130,202
$123,245
$111,232
$100,364
$95,833
$90,227
$89,167
$101,212
$112,857
$95,714
$81,591
$84,500
$83,333
$66,667
$65,000
$61,667
$0 $20,000 $40,000 $60,000 $80,000 $100,000 $120,000 $140,000 $160,000
More than 20
16 - 20
12 - <16
9 - <12
6 - <9
4 - <6
2 - <4
1 - <2
Less than 1 year
9 - Salary by Years of Experience Professional Engineers
Mean Salary
Engineers PEI PEGNL Engineers NS APEGNB

Member Salary Survey 2018
18
Professional Engineers Years of Experience
Association # of Responses
Mean Median Lower Quartile
Upper Quartile
Less than 1 All Associations 121 $74,591 $75,000 $65,000 $85,000
APEGNB 33 $74,141 $65,000 $55,000 $85,000
Engineers NS 59 $69,386 $65,000 $65,000 $75,000
PEGNL 26 $89,167 $85,000 $75,000 $95,000
Engineers PEI 3 $61,667 $65,000 $60,000 $65,000
1 - <2 All Associations 103 $76,708 $75,000 $65,000 $85,000
APEGNB 26 $75,769 $75,000 $57,500 $85,000
Engineers NS 54 $71,683 $75,000 $65,000 $75,000
PEGNL 22 $90,227 $90,000 $77,500 $95,000
Engineers PEI 1 $65,000 $65,000 $65,000 $65,000
2 - <4 All Associations 181 $85,460 $85,000 $65,000 $95,000
APEGNB 44 $80,893 $75,000 $65,000 $95,000
Engineers NS 78 $82,467 $75,000 $65,000 $85,000
PEGNL 52 $95,833 $90,000 $82,500 $112,500
Engineers PEI 7 $66,667 $65,000 $55,000 $70,000
4 - <6 All Associations 231 $88,643 $85,000 $75,000 $95,000
APEGNB 52 $84,471 $85,000 $75,000 $95,000
Engineers NS 111 $85,093 $85,000 $75,000 $85,000
PEGNL 58 $100,364 $95,000 $85,000 $112,500
Engineers PEI 10 $83,333 $75,000 $65,000 $92,500
6 - <9 All Associations 276 $96,791 $95,000 $75,000 $112,500
APEGNB 82 $91,531 $85,000 $75,000 $112,500
Engineers NS 112 $92,290 $85,000 $75,000 $112,500
PEGNL 72 $111,232 $112,500 $85,000 $112,500
Engineers PEI 10 $84,500 $85,000 $67,500 $95,000
9 - <12 All Associations 235 $103,986 $95,000 $85,000 $112,500
APEGNB 66 $99,180 $95,000 $75,000 $112,500
Engineers NS 108 $100,475 $95,000 $85,000 $112,500
PEGNL 50 $123,245 $112,500 $99,375 $137,500
Engineers PEI 11 $81,591 $85,000 $70,000 $95,000
12 - <16 All Associations 259 $112,917 $112,500 $90,000 $112,500
APEGNB 90 $108,202 $112,500 $87,500 $112,500
Engineers NS 99 $107,261 $95,000 $85,000 $112,500
PEGNL 63 $130,202 $112,500 $112,500 $150,000
Engineers PEI 7 $95,714 $85,000 $80,000 $112,500
16 - 20 All Associations 238 $114,924 $112,500 $85,000 $137,500
APEGNB 87 $106,559 $95,000 $85,000 $112,500
Engineers NS 86 $110,123 $112,500 $85,000 $112,500
PEGNL 51 $137,500 $137,500 $112,500 $162,500
Engineers PEI 14 $112,857 $112,500 $95,000 $112,500
More than 20 All Associations 930 $122,783 $112,500 $85,000 $137,500
APEGNB 292 $115,833 $112,500 $85,000 $137,500
Engineers NS 430 $121,390 $112,500 $85,000 $137,500
PEGNL 174 $142,194 $137,500 $112,500 $162,500
Engineers PEI 34 $101,212 $112,500 $85,000 $112,500
Member Salary Survey 2018
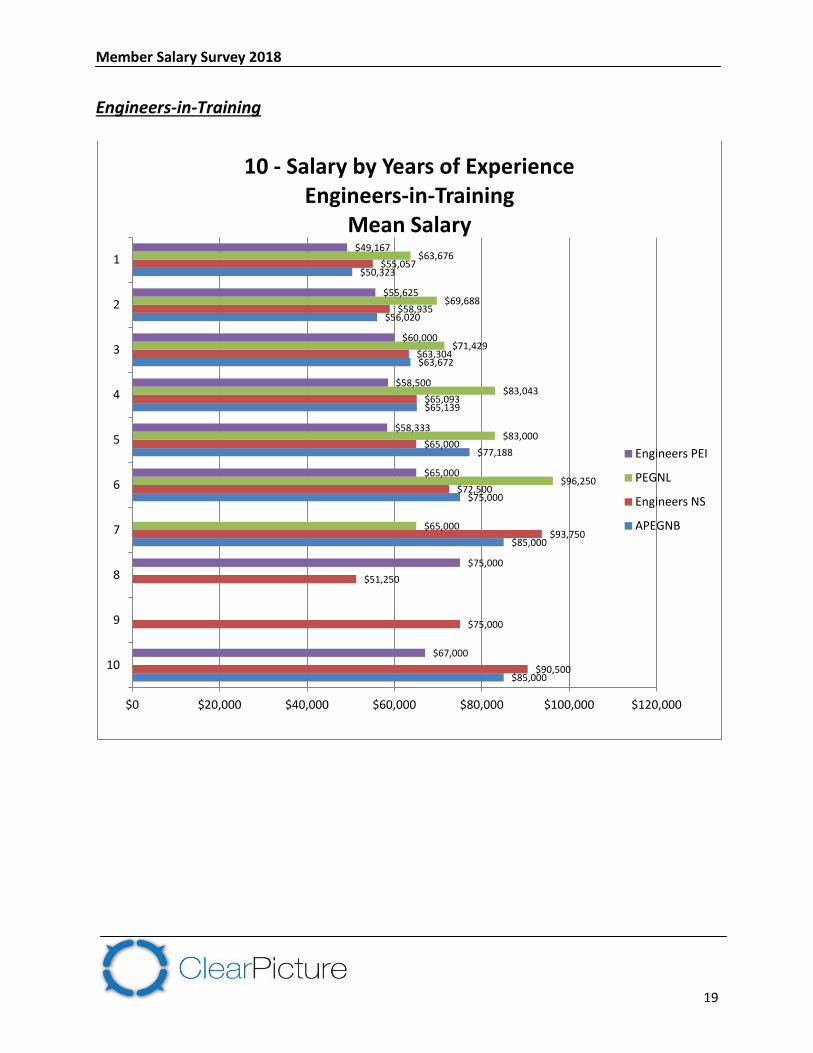
19
Engineers-in-Training
$85,000
$85,000
$75,000
$77,188
$65,139
$63,672
$56,020
$50,323
$90,500
$75,000
$51,250
$93,750
$72,500
$65,000
$65,093
$63,304
$58,935
$55,057
$65,000
$96,250
$83,000
$83,043
$71,429
$69,688
$63,676
$67,000
$75,000
$65,000
$58,333
$58,500
$60,000
$55,625
$49,167
$0 $20,000 $40,000 $60,000 $80,000 $100,000 $120,000
10
9
8
7
6
5
4
3
2
1
10 - Salary by Years of Experience Engineers-in-Training
Mean Salary
Engineers PEI
PEGNL
Engineers NS
APEGNB

Member Salary Survey 2018
20
Years APEGNB Engineers NS
PEGNL Engineers PEI
10 $85,000 $90,500 $67,000
9 $75,000
8 $51,250 $75,000
7 $85,000 $93,750 $65,000
6 $75,000 $72,500 $96,250 $65,000
5 $77,188 $65,000 $83,000 $58,333
4 $65,139 $65,093 $83,043 $58,500
3 $63,672 $63,304 $71,429 $60,000
2 $56,020 $58,935 $69,688 $55,625
1 $50,323 $55,057 $63,676 $49,167

Member Salary Survey 2018
21
Salary by Job Position
Job Position Association # of Responses
Mean Median Lower Quartile
Upper Quartile
Non- Management All Associations 1464 $83,909 $85,000 $65,000 $95,000
APEGNB 433 $82,240 $75,000 $55,000 $112,500
Engineers NS 623 $78,186 $75,000 $65,000 $85,000
PEGNL 347 $98,725 $95,000 $80,000 $112,500
Engineers PEI 61 $69,918 $65,000 $55,000 $75,000
Manager All Associations 992 $106,403 $112,500 $85,000 $112,500
APEGNB 312 $98,838 $95,000 $75,000 $112,500
Engineers NS 427 $103,402 $112,500 $85,000 $112,500
PEGNL 204 $128,830 $112,500 $95,000 $162,500
Engineers PEI 49 $87,806 $85,000 $75,000 $112,500
Executive/ Principal All Associations 375 $129,725 $112,500 $112,500 $162,500
APEGNB 120 $120,441 $112,500 $95,000 $137,500
Engineers NS 164 $131,242 $137,500 $112,500 $162,500
PEGNL 66 $152,955 $162,500 $112,500 $187,500
Engineers PEI 25 $102,700 $112,500 $95,000 $112,500
Other All Associations 84 $107,351 $95,000 $75,000 $137,500
APEGNB 36 $107,292 $95,000 $85,000 $137,500
Engineers NS 32 $95,781 $85,000 $72,500 $112,500
PEGNL 16 $130,625 $125,000 $105,625 $162,500
Engineers PEI 0
$107,292
$120,441
$98,838
$82,240
$95,781
$131,242
$103,402
$78,186
$130,625
$152,955
$128,830
$98,725
$102,700
$87,806
$69,918
$0 $20,000 $40,000 $60,000 $80,000 $100,000 $120,000 $140,000 $160,000 $180,000
Other
Executive/Principal
Manager
Non-Management
11 - Salary by Job Position Mean Salary
Engineers PEI
PEGNL
Engineers NS
APEGNB
Member Salary Survey 2018
22
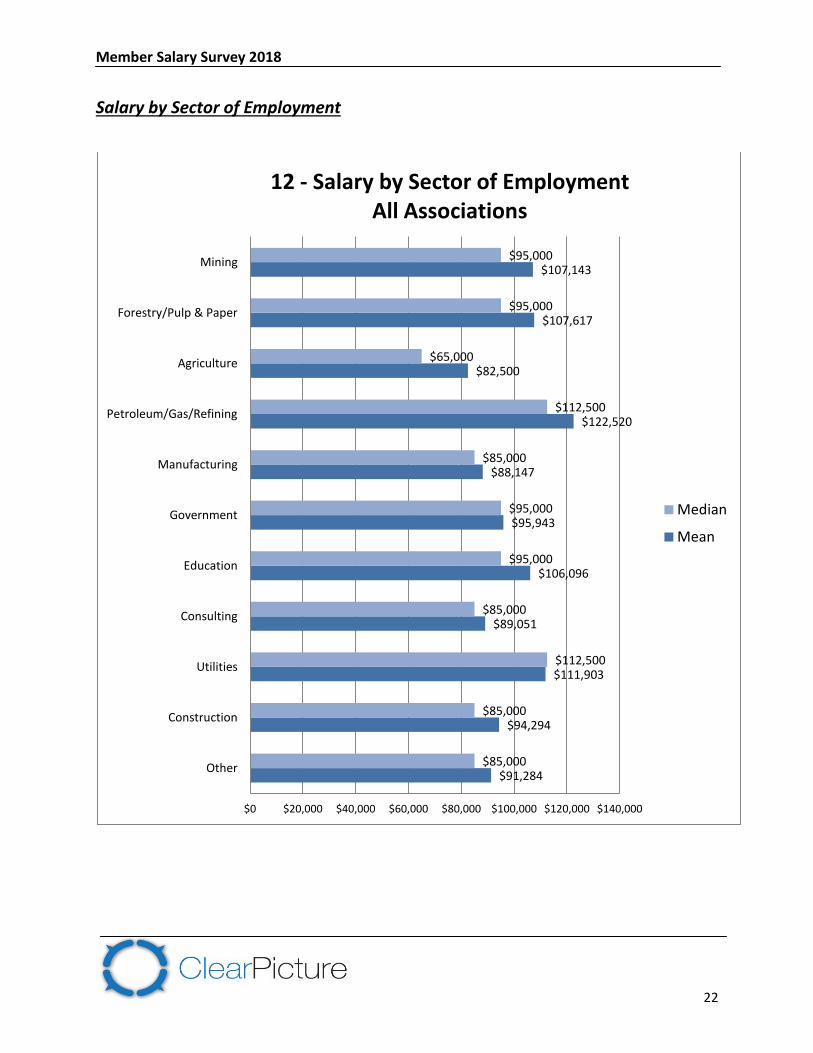
Salary by Sector of Employment
$91,284
$94,294
$111,903
$89,051
$106,096
$95,943
$88,147
$122,520
$82,500
$107,617
$107,143
$85,000
$85,000
$112,500
$85,000
$95,000
$95,000
$85,000
$112,500
$65,000
$95,000
$95,000
$0 $20,000 $40,000 $60,000 $80,000 $100,000 $120,000 $140,000
Other
Construction
Utilities
Consulting
Education
Government
Manufacturing
Petroleum/Gas/Refining
Agriculture
Forestry/Pulp & Paper
Mining
12 - Salary by Sector of Employment All Associations
Median
Mean

Member Salary Survey 2018
23
$83,269
$86,867
$112,980
$80,887
$116,136
$92,546
$83,257
$106,181
$55,000
$106,531
$115,833
$93,448
$93,453
$101,898
$90,449
$89,196
$97,489
$90,045
$119,435
$100,000
$113,958
$93,056
$100,592
$107,591
$124,136
$104,736
$112,903
$100,795
$108,958
$131,543
$0
$93,750
$110,875
$80,781
$60,227
$100,385
$62,237
$89,773
$92,353
$80,104
$0
$85,625
$0
$0
$0 $20,000 $40,000 $60,000 $80,000 $100,000 $120,000 $140,000
Other
Construction
Utilities
Consulting
Education
Government
Manufacturing
Petroleum/Gas/Refining
Agriculture
Forestry/Pulp & Paper
Mining
13 - Salary by Sector of Employment Mean Salary
Engineers PEI PEGNL Engineers NS APEGNB

Member Salary Survey 2018
24
Salary by Sector of Employment: Comparison Between 2015 and 2018 2018 2015
Sector of Employment
Association # Mean Median Lower Quartile
Upper Quartile
# Mean Median Lower Quartile
Upper Quartile
Mining All Associations
70 $107,143 $95,000 $85,000 $112,500 78 $104,230 $95,000 $75,000 $110,000
APEGNB 12 $115,833 $103,750 $85,000 $125,000 26 $104,615 $110,000 $75,000 $125,000
Engineers NS 18 $93,056 $90,000 $65,000 $112,500 17 $94,411 $75,000 $75,000 $110,000
PEGNL 40 $110,875 $95,000 $95,000 $112,500 35 $108,714 $95,000 $85,000 $120,000
Engineers PEI 0 - - - - 0 - - - -
Forestry/Pulp & Paper All Associations
64 $107,617 $95,000 $75,000 $137,500 80 $108,218 $110,000 $75,000 $130,000
APEGNB 49 $106,531 $95,000 $75,000 $137,500 52 $103,101 $95,000 $75,000 $130,000
Engineers NS 12 $113,958 $112,500 $90,000 $137,500 22 $114,772 $110,000 $95,000 $130,000
PEGNL 2 $93,750 $93,750 $84,375 $103,125 3 $105,000 $110,000 $102,500 $110,000
Engineers PEI 1 - - - - 0 - - - -
Agriculture All Associations
11 $82,500 $65,000 $60,000 $98,750 10 $75,000 $75,000 $57,500 $92,500
APEGNB 3 $55,000 $55,000 $55,000 $55,000 4 $80,000 $85,000 $77,500 $87,500
Engineers NS 4 $100,000 $98,750 $80,000 $118,750 5 $73,000 $65,000 $40,000 $110,000
PEGNL 0 - - - - 0 - - - -
Engineers PEI 4 $85,625 $70,000 $65,000 $90,625 1 $65,000 $65,000 $65,000 $65,000
Petroleum/Gas/Refining All Associations
244 $122,520 $112,500 $85,000 $162,500 391 $126,256 $110,000 $85,000 $150,000
APEGNB 72 $106,181 $95,000 $82,500 $137,500 80 $111,687 $110,000 $75,000 $130,000
Engineers NS 31 $119,435 $112,500 $75,000 $162,500 91 $126,785 $130,000 $85,000 $170,000
PEGNL 141 $131,543 $137,500 $95,000 $162,500 214 $132,430 $130,000 $95,000 $160,000
Engineers PEI 0 - - - - 4 $73,750 $55,000 $55,000 $73,750
Manufacturing All Associations
279 $88,147 $85,000 $65,000 $112,500 319 $86,747 $85,000 $65,000 $110,000
APEGNB 76 $83,257 $75,000 $62,500 $95,000 55 $77,240 $65,000 $55,000 $85,000
Engineers NS 167 $90,045 $85,000 $65,000 $112,500 199 $90,577 $85,000 $65,000 $110,000
PEGNL 12 $108,958 $112,500 $65,000 $143,750 11 $114,545 $110,000 $95,000 $140,000
Engineers PEI 24 $80,104 $70,000 $65,000 $99,375 31 $76,250 $65,000 $55,000 $95,000
Government All Associations
493 $95,943 $95,000 $85,000 $112,500 506 $92,252 $90,000 $75,000 $110,000
APEGNB 163 $92,546 $85,000 $85,000 $112,500 152 $88,683 $85,000 $75,000 $95,000
Engineers NS 230 $97,489 $95,000 $85,000 $112,500 236 $92,531 $95,000 $75,000 $110,000
PEGNL 66 $100,795 $95,000 $85,000 $112,500 66 $102,769 $95,000 $85,000 $110,000
Engineers PEI 34 $92,353 $95,000 $75,000 $112,500 34 $87,941 $85,000 $75,000 $95,000
Education All Associations
114 $106,096 $95,000 $75,000 $137,500 139 $106,906 $95,000 $75,000 $130,000
APEGNB 44 $116,136 $112,500 $85,000 $162,500 45 $98,222 $95,000 $75,000 $110,000
Engineers NS 28 $89,196 $85,000 $72,500 $99,375 64 $111,445 $95,000 $85,000 $135,000
PEGNL 31 $112,903 $112,500 $85,000 $137,500 22 $118,068 $130,000 $77,500 $150,000
Engineers PEI 11 $89,773 $85,000 $80,000 $103,750 8 $88,750 $90,000 $72,500 $110,000

Member Salary Survey 2018
25
2018 2015
Sector of Employment
Association # Mean Median Lower Quartile
Upper Quartile
# Mean Median Lower Quartile
Upper Quartile
Consulting All Associations 594 $89,051 $85,000 $65,000 $112,500 753 $87,556 $85,000 $65,000 $110,000
APEGNB 187 $80,887 $75,000 $55,000 $95,000 212 $84,587 $75,000 $65,000 $95,000
Engineers NS 284 $90,449 $85,000 $65,000 $112,500 383 $87,840 $85,000 $65,000 $110,000
PEGNL 104 $104,736 $103,750 $75,000 $137,500 125 $96,400 $95,000 $75,000 $110,000
Engineers PEI 19 $62,237 $55,000 $37,500 $75,000 33 $69,848 $65,000 $55,000 $75,000
Utilities All Associations 382 $111,903 $112,500 $85,000 $131,250 394 $103,422 $95,000 $85,000 $110,000
APEGNB 125 $112,980 $112,500 $95,000 $112,500 119 $101,470 $95,000 $85,000 $110,000
Engineers NS 133 $101,898 $95,000 $75,000 $112,500 157 $96,233 $85,000 $75,000 $110,000
PEGNL 111 $124,136 $112,500 $95,000 $137,500 101 $116,856 $110,000 $85,000 $130,000
Engineers PEI 13 $100,385 $95,000 $85,000 $112,500 17 $103,235 $95,000 $85,000 $110,000
Construction All Associations 295 $94,294 $85,000 $65,000 $112,500 364 $94,407 $85,000 $65,000 $110,000
APEGNB 83 $86,867 $75,000 $55,000 $112,500 106 $82,723 $75,000 $65,000 $95,000
Engineers NS 119 $93,453 $85,000 $65,000 $112,500 134 $96,175 $85,000 $65,000 $110,000
PEGNL 82 $107,591 $95,000 $75,000 $137,500 79 $114,725 $110,000 $85,000 $130,000
Engineers PEI 11 $60,227 $55,000 $46,250 $75,000 13 $68,461 $65,000 $55,000 $85,000
Other All Associations 335 $91,284 $85,000 $65,000 $112,500 354 $89,197 $85,000 $65,000 $110,000
APEGNB 78 $83,269 $75,000 $55,000 $95,000 68 $88,161 $85,000 $62,500 $110,000
Engineers NS 203 $93,448 $85,000 $65,000 $112,500 204 $90,581 $85,000 $65,000 $110,000
PEGNL 38 $100,592 $95,000 $77,500 $112,500 53 $93,962 $85,000 $75,000 $110,000
Engineers PEI 16 $80,781 $65,000 $65,000 $87,500 29 $73,275 $65,000 $55,000 $85,000

Member Salary Survey 2018
26
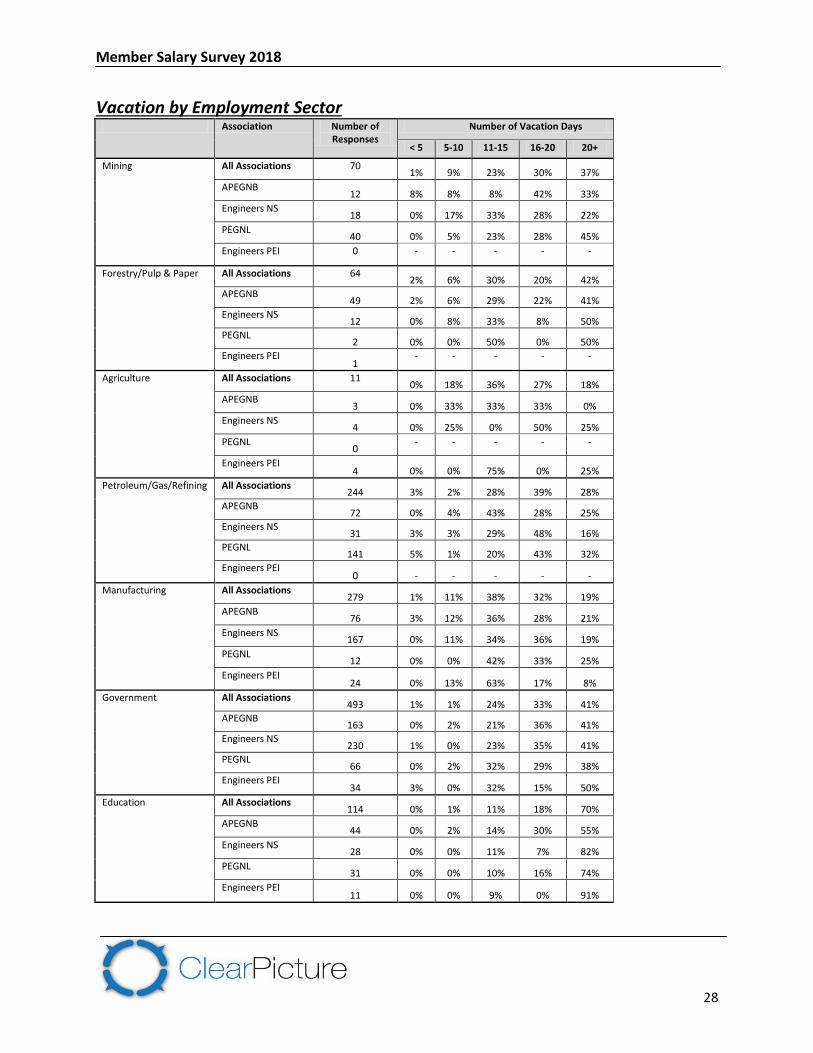
Vacation by Employment Sector
16
14
17
16
19
18
15
17
15
17
17
0 5 10 15 20 25
Other
Construction
Utilities
Consulting
Education
Government
Manufacturing
Petroleum/Gas/Refining
Agriculture
Forestry/Pulp & Paper
Mining
14 - Vacation by Employment Sector (Mean) All Associations
Mean

Member Salary Survey 2018
27
Vacation by Employment Sector
Sector # of Responses
Mean Median Number of Vacation Days
< 5 5-10 11-15 16-20 20+
Mining 70 17 18 1% 9% 23% 30% 37%
Forestry/Pulp & Paper 64 17 18 2% 6% 30% 20% 42%
Agriculture 11 15 13 0% 18% 36% 27% 18%
Petroleum/Gas/Refining 244 17 18 3% 2% 28% 39% 28%
Manufacturing 279 15 18 1% 11% 38% 32% 19%
Government 493 18 18 1% 1% 24% 33% 41%
Education 114 19 21 0% 1% 11% 18% 70%
Consulting 594 16 18 3% 6% 39% 35% 18%
Utilities 382 17 18 2% 1% 28% 31% 39%
Construction 295 14 13 8% 12% 41% 29% 11%
Other 335 16 18 1% 5% 35% 35% 23%
Member Salary Survey 2018
28
Vacation by Employment Sector Association Number of
Responses Number of Vacation Days
< 5 5-10 11-15 16-20 20+
Mining All Associations 70 1% 9% 23% 30% 37%
APEGNB 12 8% 8% 8% 42% 33%
Engineers NS 18 0% 17% 33% 28% 22%
PEGNL 40 0% 5% 23% 28% 45%
Engineers PEI 0 - - - - -
Forestry/Pulp & Paper All Associations 64 2% 6% 30% 20% 42%
APEGNB 49 2% 6% 29% 22% 41%
Engineers NS 12 0% 8% 33% 8% 50%
PEGNL 2 0% 0% 50% 0% 50%
Engineers PEI 1
- - - - -
Agriculture All Associations 11 0% 18% 36% 27% 18%
APEGNB 3 0% 33% 33% 33% 0%
Engineers NS 4 0% 25% 0% 50% 25%
PEGNL 0
- - - - -
Engineers PEI 4 0% 0% 75% 0% 25%
Petroleum/Gas/Refining All Associations 244 3% 2% 28% 39% 28%
APEGNB 72 0% 4% 43% 28% 25%
Engineers NS 31 3% 3% 29% 48% 16%
PEGNL 141 5% 1% 20% 43% 32%
Engineers PEI 0 - - - - -
Manufacturing All Associations 279 1% 11% 38% 32% 19%
APEGNB 76 3% 12% 36% 28% 21%
Engineers NS 167 0% 11% 34% 36% 19%
PEGNL 12 0% 0% 42% 33% 25%
Engineers PEI 24 0% 13% 63% 17% 8%
Government All Associations 493 1% 1% 24% 33% 41%
APEGNB 163 0% 2% 21% 36% 41%
Engineers NS 230 1% 0% 23% 35% 41%
PEGNL 66 0% 2% 32% 29% 38%
Engineers PEI 34 3% 0% 32% 15% 50%
Education All Associations 114 0% 1% 11% 18% 70%
APEGNB 44 0% 2% 14% 30% 55%
Engineers NS 28 0% 0% 11% 7% 82%
PEGNL 31 0% 0% 10% 16% 74%
Engineers PEI 11 0% 0% 9% 0% 91%

Member Salary Survey 2018
29
Association Number of Responses
Number of Vacation Days
< 5 5-10 11-15 16-20 20+
Consulting All Associations 594
3% 6% 39% 35% 18%
APEGNB 187 4% 6% 39% 36% 15%
Engineers NS 284 2% 6% 43% 32% 18%
PEGNL 104 4% 5% 26% 42% 23%
Engineers PEI 19 5% 26% 37% 21% 11%
Utilities All Associations 382
2% 1% 28% 31% 39%
APEGNB 125 2% 2% 21% 30% 46%
Engineers NS 133 0% 1% 48% 32% 19%
PEGNL 111 5% 0% 12% 27% 57%
Engineers PEI 13 0% 0% 31% 54% 15%
Construction All Associations 295
8% 12% 41% 29% 11%
APEGNB 83 10% 7% 41% 32% 10%
Engineers NS 119 4% 10% 41% 31% 14%
PEGNL 82 11% 13% 39% 27% 10%
Engineers PEI 11 0% 45% 45% 9% 0%
Other All Associations 335
1% 5% 35% 35% 23%
APEGNB 78 0% 12% 25% 34% 30%
Engineers NS 203 2% 4% 37% 36% 20%
PEGNL 38 0% 3% 34% 34% 29%
Engineers PEI 16 0% 0% 63% 25% 13%

Member Salary Survey 2018
30
Overtime Compensation
17% 17%
28%
35%
3%
15% 14%
29%
36%
4%
18%
15%
25%
39%
4%
7%
12%
44%
34%
4%
0%
5%
10%
15%
20%
25%
30%
35%
40%
45%
50%
Pay normal rate Pay higher overtime rate
Give time off Does not compensate for
overtime
Other
15 - Compensation Provided for Overtime
APEGNB
Engineers NS
PEGNL
Engineers PEI

Member Salary Survey 2018
31
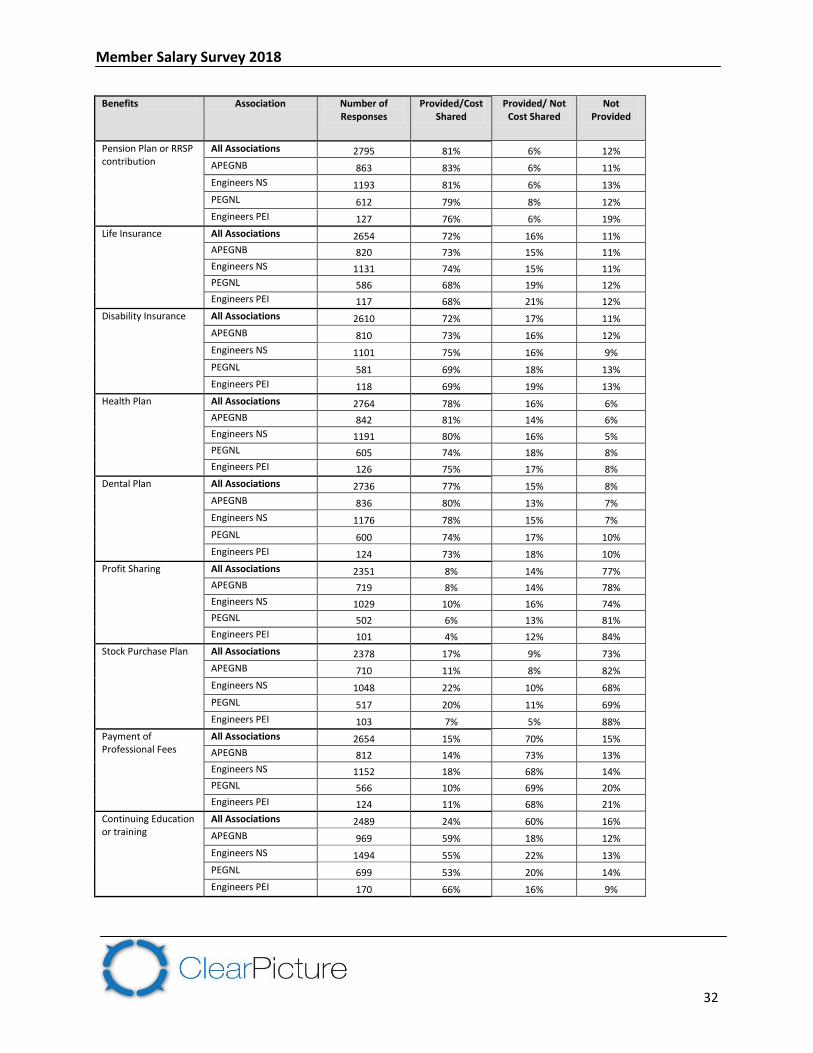
Benefits
77%
80%
15%
20%
87%
89%
82%
82%
84%
73%
75%
26%
22%
84%
86%
79%
78%
78%
67%
72%
26%
16%
84%
87%
79%
81%
83%
80%
74%
11%
16%
86%
88%
80%
80%
78%
0% 10% 20% 30% 40% 50% 60% 70% 80% 90% 100%
Continuing Education or training
Payment of Professional Fees
Stock Purchase Plan
Profit Sharing
Dental Plan
Health Plan
Disability Insurance
Life Insurance
Pension Plan or RRSP contribution
16 - Benefits Provided by Employer Engineers PEI PEGNL Engineers NS APEGNB
Member Salary Survey 2018
32
Benefits Association Number of Responses
Provided/Cost Shared
Provided/ Not Cost Shared
Not Provided
Pension Plan or RRSP contribution
All Associations 2795 81% 6% 12%
APEGNB 863 83% 6% 11%
Engineers NS 1193 81% 6% 13%
PEGNL 612 79% 8% 12%
Engineers PEI 127 76% 6% 19%
Life Insurance All Associations 2654 72% 16% 11%
APEGNB 820 73% 15% 11%
Engineers NS 1131 74% 15% 11%
PEGNL 586 68% 19% 12%
Engineers PEI 117 68% 21% 12%
Disability Insurance All Associations 2610 72% 17% 11%
APEGNB 810 73% 16% 12%
Engineers NS 1101 75% 16% 9%
PEGNL 581 69% 18% 13%
Engineers PEI 118 69% 19% 13%
Health Plan All Associations 2764 78% 16% 6%
APEGNB 842 81% 14% 6%
Engineers NS 1191 80% 16% 5%
PEGNL 605 74% 18% 8%
Engineers PEI 126 75% 17% 8%
Dental Plan All Associations 2736 77% 15% 8%
APEGNB 836 80% 13% 7%
Engineers NS 1176 78% 15% 7%
PEGNL 600 74% 17% 10%
Engineers PEI 124 73% 18% 10%
Profit Sharing All Associations 2351 8% 14% 77%
APEGNB 719 8% 14% 78%
Engineers NS 1029 10% 16% 74%
PEGNL 502 6% 13% 81%
Engineers PEI 101 4% 12% 84%
Stock Purchase Plan All Associations 2378 17% 9% 73%
APEGNB 710 11% 8% 82%
Engineers NS 1048 22% 10% 68%
PEGNL 517 20% 11% 69%
Engineers PEI 103 7% 5% 88%
Payment of Professional Fees
All Associations 2654 15% 70% 15%
APEGNB 812 14% 73% 13%
Engineers NS 1152 18% 68% 14%
PEGNL 566 10% 69% 20%
Engineers PEI 124 11% 68% 21%
Continuing Education or training
All Associations 2489 24% 60% 16%
APEGNB 969 59% 18% 12%
Engineers NS 1494 55% 22% 13%
PEGNL 699 53% 20% 14%
Engineers PEI 170 66% 16% 9%

Member Salary Survey 2018
33
OVERALL SATISFACTION WITH REMUNERATION
35%
27%
28%
21%
46%
50%
50%
59%
14%
18%
17%
14%
4%
4%
4%
2%
1%
1%
1%
2%
0%
0%
0%
1%
0% 10% 20% 30% 40% 50% 60% 70% 80% 90% 100%
APEGNB
Engineers NS
PEGNL
Engineers PEI
17 - Level of Satisfaction with Remuneration
Very satisfied Somewhat satisfied Somewhat dissatisfied
Very dissatisfied Neither Don’t know