engineering insurance statistics 2009 - 2011€¦ · engineering insurance premium and loss...
TRANSCRIPT

Engineering InsurancePremium and Loss
Statistics 2009 - 2011
The International Association of Engineering Insurers TM
Presented by Allianz Global Corporate & Specialty
22 – 26 September 2012Rio de Janeiro, Brazil
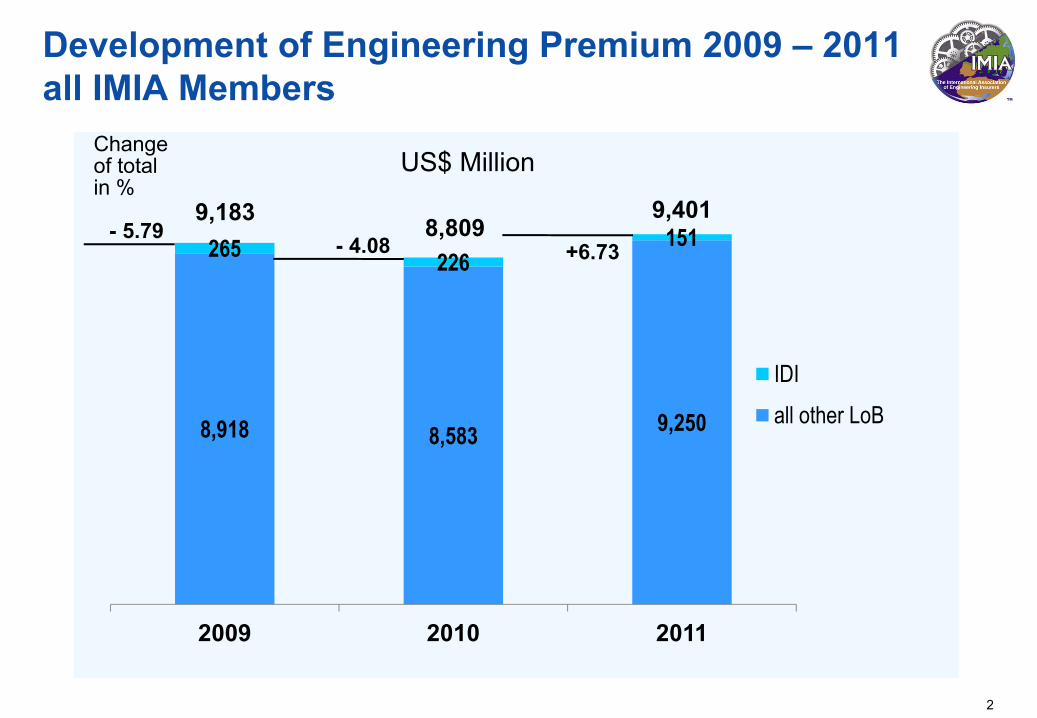
8,918 8,583 9,250
265 226151
2009 2010 2011
IDIall other LoB
Development of Engineering Premium 2009 – 2011all IMIA Members
2
US$ Million
- 4.08 +6.73- 5.79
Change of total in %
9,183 8,8099,401
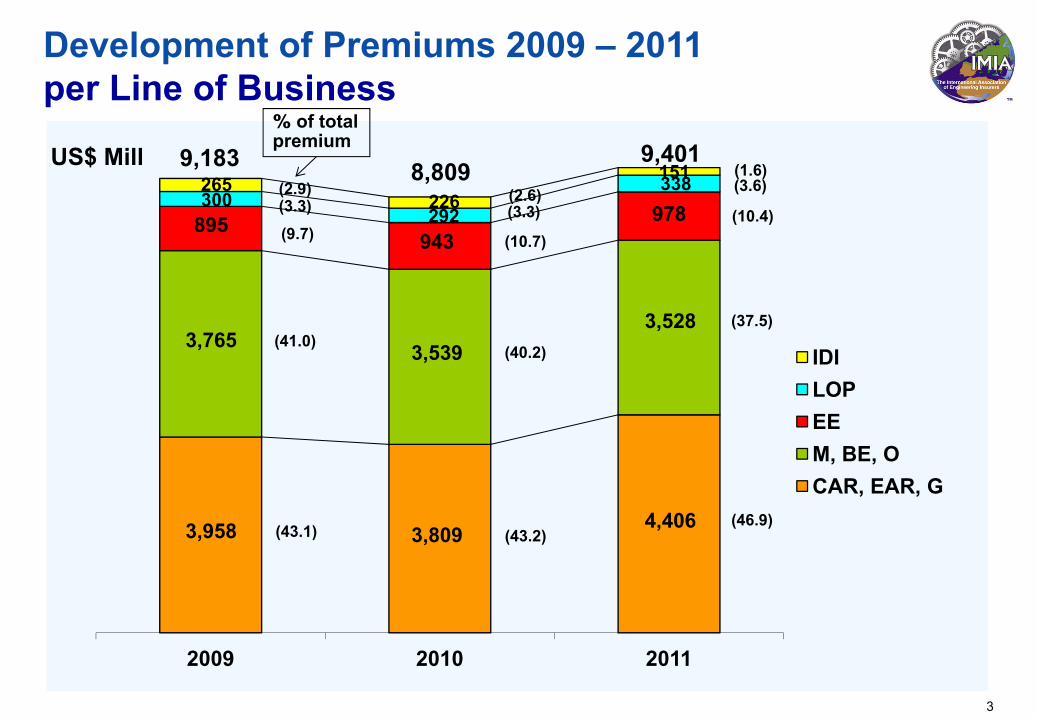
3,958 3,8094,406
3,765 3,5393,528
895943
978300
292
338265226
151
2009 2010 2011
IDILOPEEM, BE, OCAR, EAR, G
9,183 8,8099,401
Development of Premiums 2009 – 2011per Line of Business
% of total premium
(43.1)
(41.0)
(43.2)(46.9)
(40.2)
(37.5)
(9.7) (10.7)(10.4)(3.3)
(2.9)(3.3)(2.6) (3.6)
(1.6)
3
US$ Mill

0 500 1000 1500 2000
Finland
Sweden
Taiwan
Austria
Mexico
Netherlands
Spain
Switzerland
Australia
Turkey
Brazil
Canada
Italy
USA
Japan
Russia
Germany
Premiums and Claims 2011 per Country (excl. IDI)US$ Mill Loss Ratio (%)
2009 2010 2011
107
474165
86
50
18452945
115
73526756
50
2223492646
101
533266
73
45 53 50
2529443150
43 47 4164 91 101
58
60 38 39
23
ClaimsPremiums
7472 741316 12
4

0 20 40 60 80 100
Finland
Sweden
Taiwan
Austria
Netherlands
Mexico
Spain
Switzerland
Australia
Turkey
Brazil
Canada
Italy
USA
Japan
Russia
Germany
14
15
6
32
29
63
IDI - Premiums and Claims 2011 per Country US$ Mill
Loss Ratio (%)2009 2010 2011
ClaimsPremiums
20 68
8252
5
Note:Only two countries reported IDI premium and losses
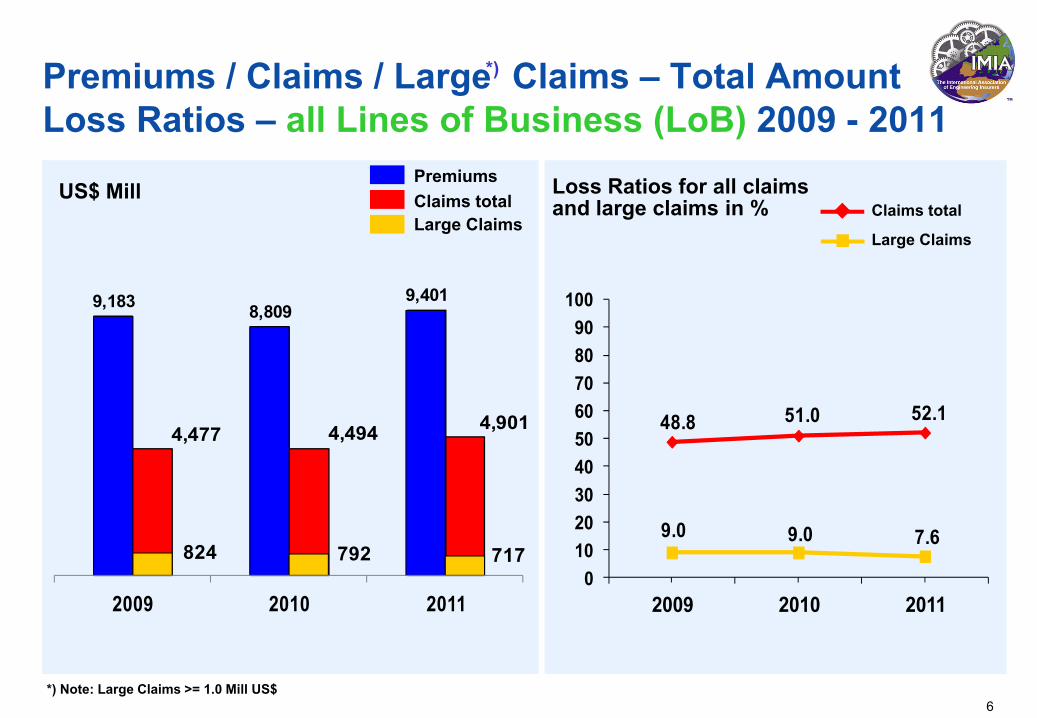
4,477 4,494 4,901
9,183 8,8099,401
824 792 717
2009 2010 2011
48.8 51.0 52.1
9.0 9.0 7.6
0102030405060708090
100
2009 2010 2011
6
Premiums / Claims / Large Claims – Total Amount Loss Ratios – all Lines of Business (LoB) 2009 - 2011
US$ MillClaims total
Large Claims
Claims totalPremiums
Large Claims
*)
*) Note: Large Claims >= 1.0 Mill US$
Loss Ratios for all claims and large claims in %
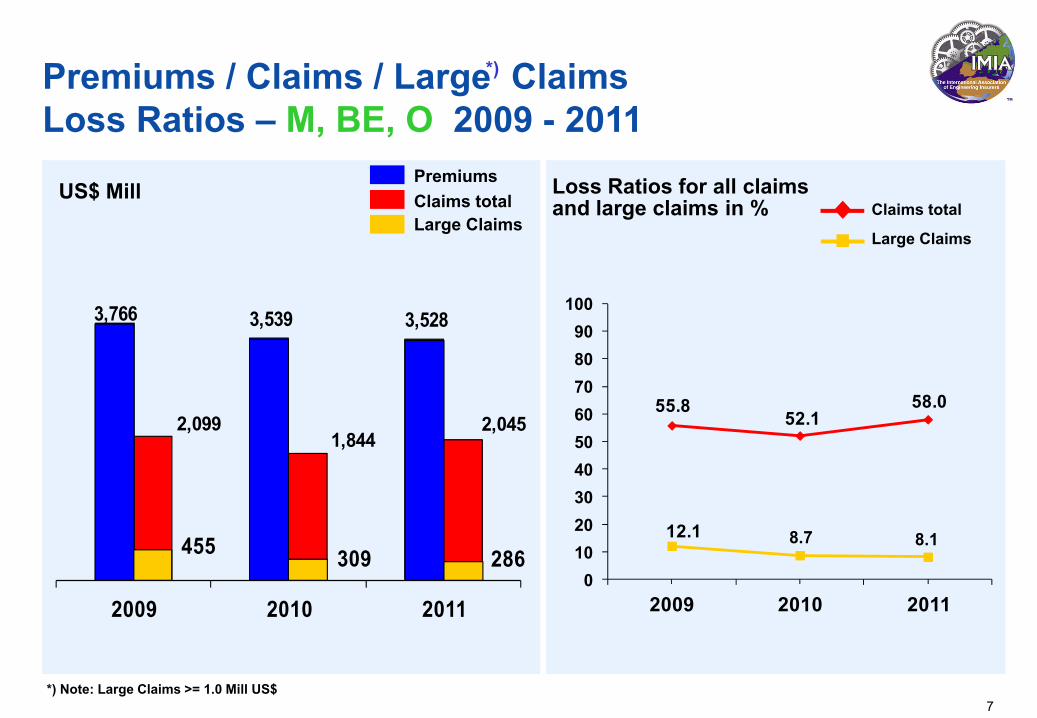
2,0991,844
2,045
3,766 3,539 3,528
455 309 286
2009 2010 2011
55.852.1
58.0
12.1 8.7 8.1
0102030405060708090
100
2009 2010 2011
7
US$ Mill
Premiums / Claims / Large Claims Loss Ratios – M, BE, O 2009 - 2011
Claims totalPremiums
Large ClaimsClaims total
Large Claims
Loss Ratios for all claims and large claims in %
*)
*) Note: Large Claims >= 1.0 Mill US$

191 209 230
299 292338
16 1235
2009 2010 2011
8
Premiums / Claims / Large Claims Loss Ratios – LoP 2009 - 2011
US$ Mill
63.771.6 68.0
5.4 3.910.5
0102030405060708090
100110
2009 2010 2011
Claims totalPremiums
Large ClaimsClaims total
Large Claims
Loss Ratios for all claims and large claims in %
*)
*) Note: Large Claims >= 1.0 Mill US$
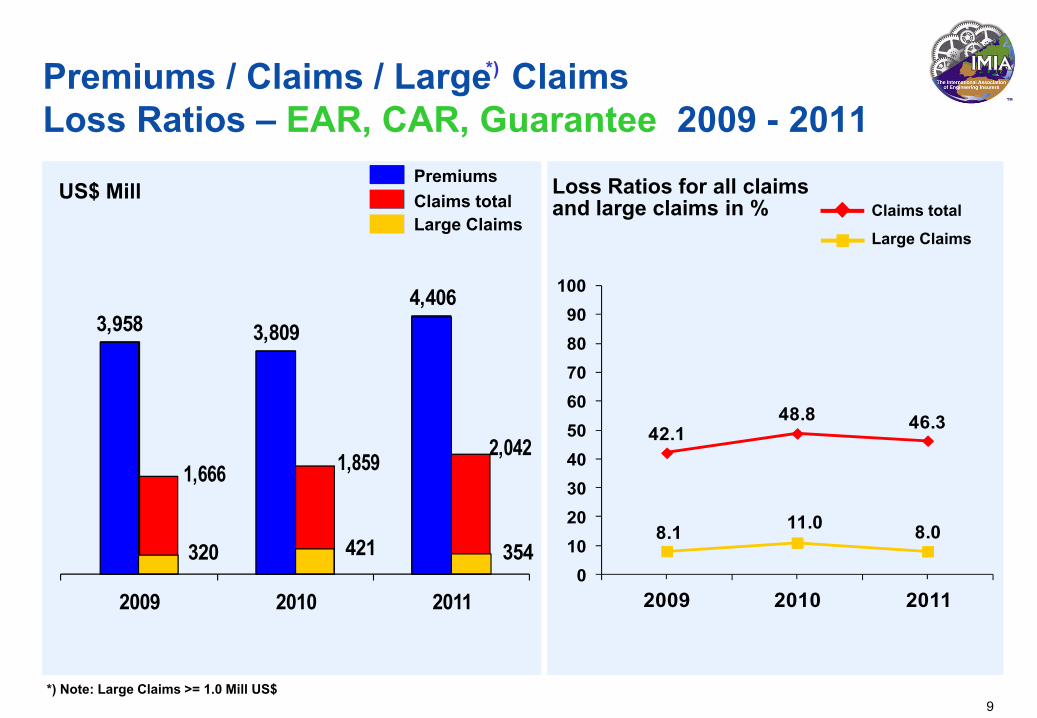
1,666 1,859 2,042
3,958 3,8094,406
320 421 354
2009 2010 2011
9
Premiums / Claims / Large Claims Loss Ratios – EAR, CAR, Guarantee 2009 - 2011
US$ Mill
42.148.8 46.3
8.1 11.0 8.0
0102030405060708090
100
2009 2010 2011
Claims totalPremiums
Large ClaimsClaims total
Large Claims
Loss Ratios for all claims and large claims in %
*)
*) Note: Large Claims >= 1.0 Mill US$
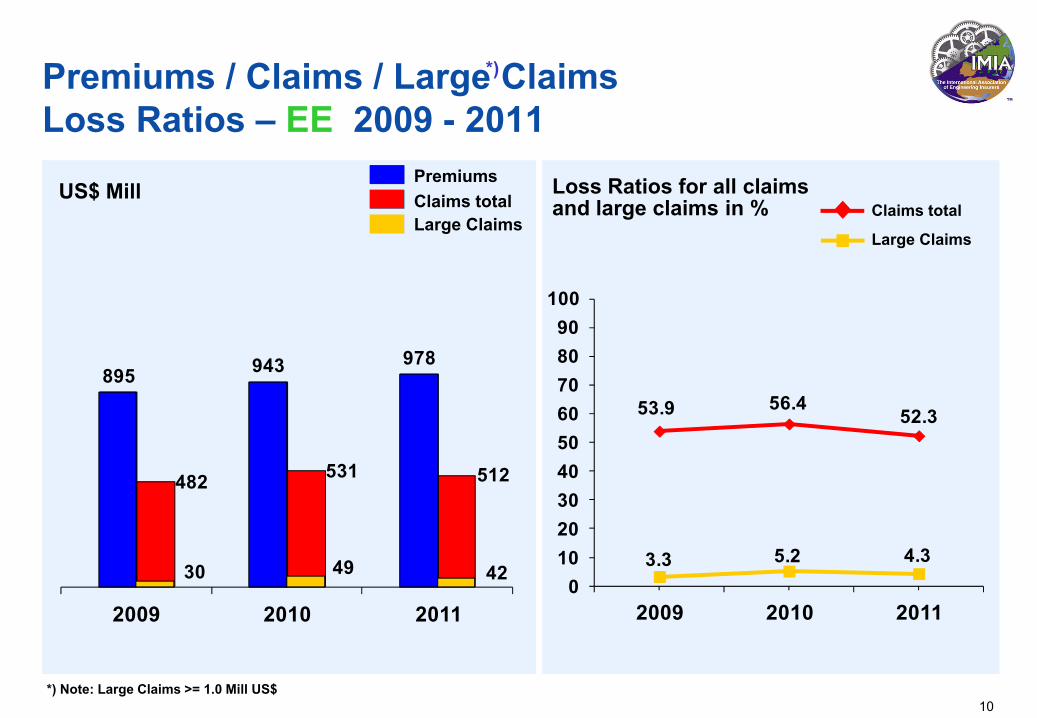
482 531 512
895 943 978
30 49 42
2009 2010 2011
10
Premiums / Claims / Large Claims Loss Ratios – EE 2009 - 2011
US$ Mill
53.9 56.452.3
3.3 5.2 4.30
102030405060708090
100
2009 2010 2011
Claims totalPremiums
Large ClaimsClaims total
Large Claims
Loss Ratios for all claims and large claims in %
*)
*) Note: Large Claims >= 1.0 Mill US$
11
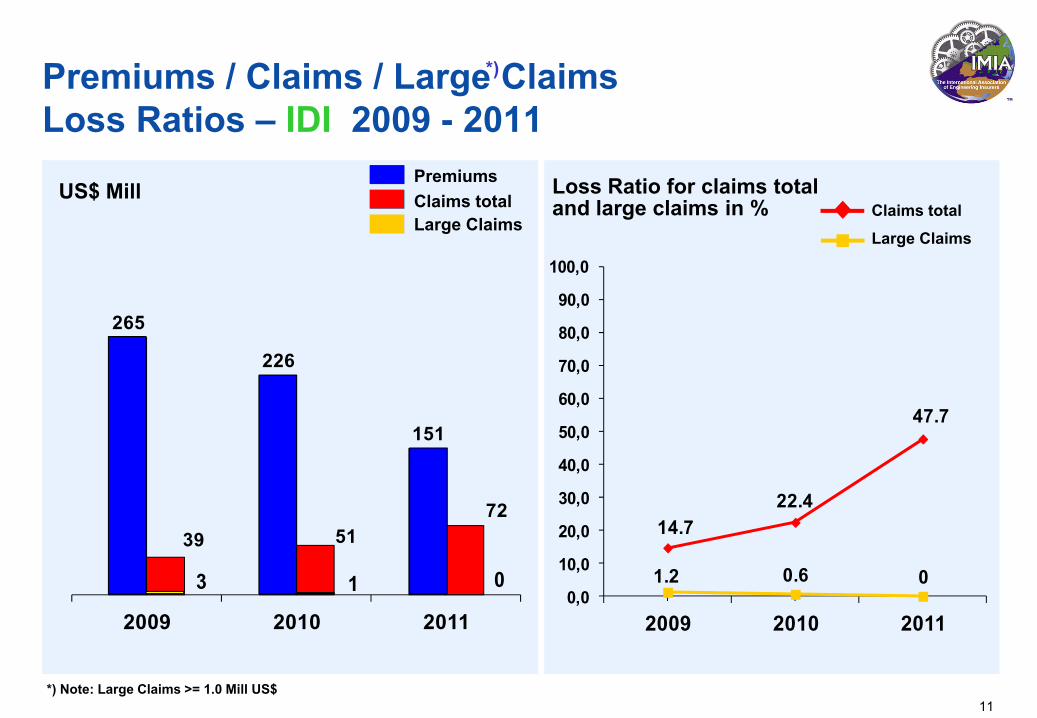
Premiums / Claims / Large Claims Loss Ratios – IDI 2009 - 2011
14.722.4
47.7
1.2 0.6 00,0
10,0
20,0
30,0
40,0
50,0
60,0
70,0
80,0
90,0
100,0
2009 2010 2011
US$ Mill Claims totalPremiums
Large ClaimsClaims total
Large Claims
Loss Ratio for claims total and large claims in %
*)
*) Note: Large Claims >= 1.0 Mill US$
265
226
151
39 5172
2009 2010 2011
3 1 0

5888 91 79 75
52
12286 96 10216
14
6 5 15
1
17
17 17172 1
0
50
100
150
200
250
2007 2008 2009 2010 2011
12
Number of Large Claims per LoB 2007 - 2011
IDI EELoPCAR. EAR. GM.BE.O
Total Engineering209
127
241
198202

A) Faulty OperationB) Faulty Material and
Workmanship
C) Faulty DesignD) Fire
E) ExplosionF) Natural Hazards
US$ Mill
0
50
100
150
200
250
300
350
2007 2008 2009 2010 2011A B C D E F G A B C D E F G A B C D E F G A B C D E F G A B C D E F G
Large Claims - Cause of Loss: all LoB 2007 - 2011
13
G) Other Causes

14
US$ Mill
93
60
12 114
78
0 0
27
0 10 20 30 40 50 60 70 80 90
100
A B C D E F G H I
A) Faulty OperationB) Faulty Material and
Workmanship
C) Faulty DesignD) Fire
E) ExplosionF) Storm
G) Flood and InundationH) EarthquakeI) Others
Large Claims - Cause of Loss: M, BE, Others 2011

15
119
0 01
0
4
0
10
0
5
10
15
20
25
30
A B C D E F G H I
US$ Mill
B) Faulty Material andWorkmanship
Large Claims - Cause of Loss: LoP 2011
A) Faulty Operation C) Faulty DesignD) Fire
E) ExplosionF) Storm
G) Flood and InundationH) EarthquakeI) Others
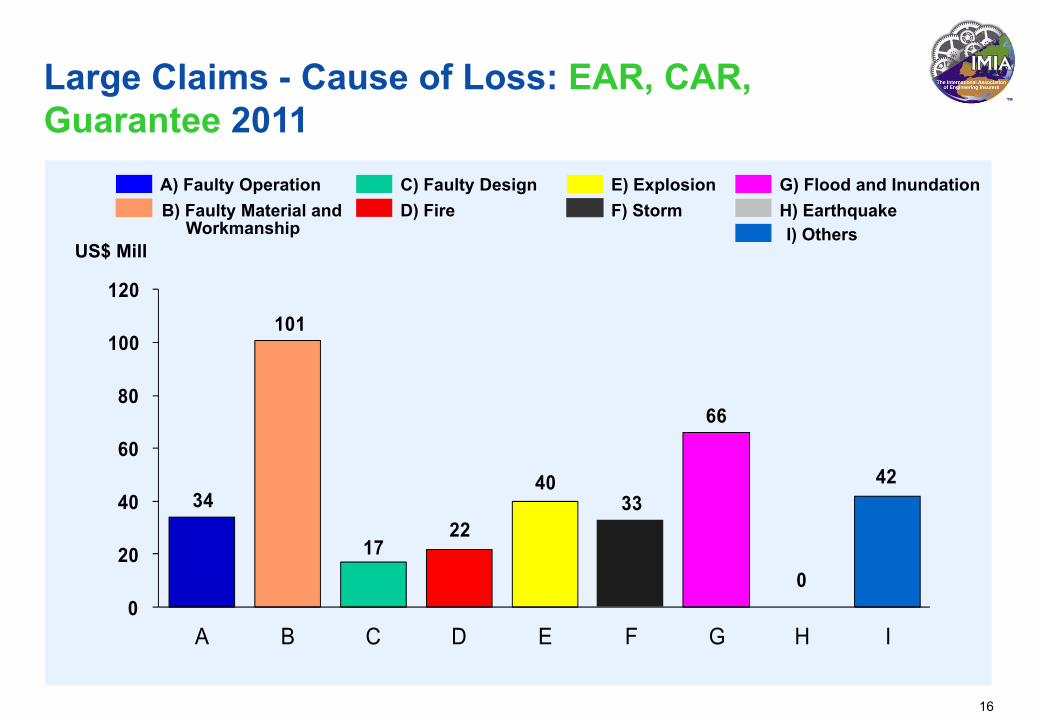
34
101
1722
4033
66
0
42
0
20
40
60
80
100
120
A B C D E F G H I
16
US$ Mill
Large Claims - Cause of Loss: EAR, CAR, Guarantee 2011
A) Faulty Operation C) Faulty DesignD) Fire
E) ExplosionF) Storm
G) Flood and InundationH) EarthquakeI) Others
B) Faulty Material andWorkmanship

17
32
30
7
0 0 0 0 00 5
10 15 20 25 30 35 40 45 50
A B C D E F G H I
US$ Mill
Large Claims - Cause of Loss: EE 2011
A) Faulty Operation C) Faulty DesignD) Fire
E) ExplosionF) Storm
G) Flood and InundationH) EarthquakeI) Others
B) Faulty Material andWorkmanship

18
0 0 0 0 0 0 0 0 00 5
10 15 20 25 30 35 40 45 50
US$ Mill
BA C D E F G H I
Large Claims - Cause of Loss: IDI 2011
A) Faulty Operation C) Faulty DesignD) Fire
E) ExplosionF) Storm
G) Flood and InundationH) EarthquakeI) Others
B) Faulty Material andWorkmanship
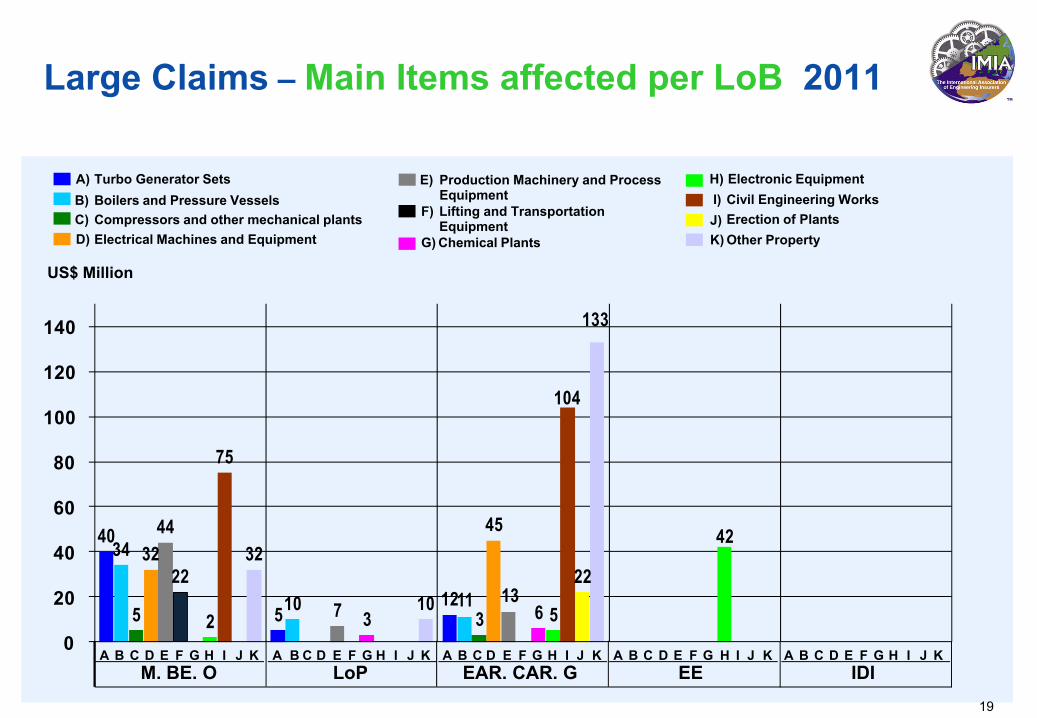
Large Claims – Main Items affected per LoB 2011
40
512
34
10 115 3
324544
713
22
3 62 5
42
75
104
2232
10
133
0
20
40
60
80
100
120
140
A) Turbo Generator SetsB) Boilers and Pressure VesselsC) Compressors and other mechanical plantsD) Electrical Machines and Equipment
F) Lifting and TransportationEquipment
G) Chemical Plants
H) Electronic EquipmentI) Civil Engineering WorksJ) Erection of Plants
E) Production Machinery and Process Equipment
K) Other Property
US$ Million
A B C D E F G H I J KM. BE. O
A B C D E F G H I J KLoP
A B C D E F G H I J KEAR. CAR. G
A B C D E F G H I J KEE
A B C D E F G H I J KIDI
19

20
Key to the abbreviationsBE Boiler ExplosionCAR Contractor‘s All RisksEAR Erection All RisksEE Electronic EquipmentG GuaranteeIDI Inherent Defects (Decennial) InsuranceLoB Line of BusinessLoP Loss of Profits (MLoP & ALoP) M Machinery BreakdownO Others
Please noteAll figures are based on information supplied to IMIA by its Member countries. It should be borne in mind that these figures may not always contain IBNR provisions, and that premium patterns may vary between reporting member countries and companies.Inherent Defects Insurance (IDI), also called Decennial Insurance in French speaking countries, is written only in a few countries. It is a compulsory class of business in some of these. Due to the different legal situation and others specifics, the scope of cover varies greatly from country to country. Therefore any attempt to make comparisons is very difficult and may lead to wrong conclusions. Since IDI contracts grant cover for material damage caused by latent defects for a period of (usually) ten years as from completion of the contract works, special attention needs to be given to the issue of premium earning patterns during the policy duration. These patterns vary considerably from country to country and are even regulated in some of them by the insurance supervisory body. IMIA is not in a position to reflect the various regulations governing the administration of this line of business in the various countries nor can IMIA validate the method used by its members in establishing their figures.Therefore IMIA recommends to adopt particular care when drawing conclusions from premiums, claims figures and loss ratios reported herein especially in respect of IDI. For further details it is recommended to contact the IMIA-delegate from a particular member country to obtain more accurate information on the particulars of a specific line of business in his country.