engineering fracture mechanics calibration procedures … · author's personal copy that...
TRANSCRIPT
Author's personal copy
Calibration procedures for a computational model of ductile fracture
Z. Xue a,1, M.G. Pontin b,2, F.W. Zok b, J.W. Hutchinson a,*
a School of Engineering and Applied Sciences, Harvard University, Cambridge, MA, United Statesb Materials Department, University of California, Santa Barbara, CA, United States
a r t i c l e i n f o
Article history:Received 18 August 2009Received in revised form 22 October 2009Accepted 29 October 2009Available online 1 November 2009
Keywords:Ductile fractureComputational fractureShear fractureDamage parameters
a b s t r a c t
A recent extension of the Gurson constitutive model of damage and failure of ductile struc-tural alloys accounts for localization and crack formation under shearing as well as tension.When properly calibrated against a basic set of experiments, this model has the potential topredict the emergence and propagation of cracks over a wide range of stress states. Thispaper addresses procedures for calibrating the damage parameters of the extended consti-tutive model. The procedures are demonstrated for DH36 steel using data from three tests:(i) tension of a round bar, (ii) mode I cracking in a compact tension specimen, and (iii) shearlocalization and mode II cracking in a shear-off specimen. The computational model is thenused to study the emergence of the cup-cone fracture mode in the neck of a round tensilebar. Ductility of a notched round bar provides additional validation.
� 2009 Elsevier Ltd. All rights reserved.
1. Introduction
Progress in computational fracture mechanics has paralleled advances in constitutive models that incorporate damagemechanisms. For many ductile structural alloys the mechanism governing failure is void nucleation, growth and coalescence.The grand challenge for these alloys is the development of a computational capability for predicting localization, crack for-mation and crack propagation under all states of stress. Capturing both tensile (mode I) and shear (mode II) fractures hasbeen particularly challenging. When properly calibrated for a specific structural alloy, the Gurson model [1] and some ofits close relatives, such as the Rousselier model [2], have shown considerable promise for characterizing mode I crack growth[3–8]. In addition, the models have been used to simulate transitions from mode I crack growth to mixed mode shear crack-ing in the cup-cone fracture process of round tensile bars [9,10] and in three-dimensional through-cracks in thin plates [11].Such transition problems are generally more challenging because the constitutive models have not been developed to explic-itly address damage under shear dominated conditions.
A recent extension of the Gurson model [12] specifically incorporates damage in shear, adding the flexibility to addressshear ruptures as well as tension dominated failures. This extension will be employed here in conjunction with a suite ofthree tests (round bar tension, mode I compact tension, and mode II shear-off) to calibrate the constitutive parametersfor the structural steel, DH36. For verification, the calibrated model is then used to study the failure details of several otherproblems.
To put the overall objectives of this work into some perspective, it is noted that three parameters are required to calibratethe extended Gurson model: the initial void volume fraction, f0, a shear damage coefficient, kx (defined below) and the finiteelement size, D. To accurately characterize localization and fracture, D must be on the order of the spacing between the voids
0013-7944/$ - see front matter � 2009 Elsevier Ltd. All rights reserved.doi:10.1016/j.engfracmech.2009.10.007
* Corresponding author.E-mail address: [email protected] (J.W. Hutchinson).
1 Present address: Schlumberger Reservoir Completions, Rosharon, TX, United States.2 Present address: Ceradyne, Costa Mesa, CA, United States.
Engineering Fracture Mechanics 77 (2010) 492–509
Contents lists available at ScienceDirect
Engineering Fracture Mechanics
journal homepage: www.elsevier .com/locate /engfracmech
Author's personal copy
that dominate the fracture process, typically from tens to hundreds- of microns. With mesh requirements this fine, it is onlypossible to predict the onset and propagation of cracks in relatively small components or in larger structures where the loca-tion of the failure can be anticipated in advance. In contrast, it would not be feasible to employ a fracture model of this typeto analyze fractures in large structures where the failure locations cannot be anticipated. Under such circumstances, becausethe finite element size for a large structure is necessarily orders of magnitude greater than void spacing and often larger thanplate thickness, coarser criteria based on a critical effective plastic strain or a through-thickness cohesive zone must be em-ployed. These criteria must also be calibrated for each material, but against tests that make no attempt to resolve the finescale fracture processes relevant for the present class of models. The two classes of fracture models complement each other.In principle, computations based on a fine scale model could be used to calibrate a coarse scale model.
2. The extended Gurson model
The Gurson model is an isotropic formulation that employs the mean stress, rm = rkk/3, and the effective stress,
re �ffiffiffiffiffiffiffi3J2
p¼
ffiffiffiffiffiffiffiffiffiffiffiffiffiffiffiffiffi3sijsij=2
p, where sij ¼ rij � 1
3 rkkdij is the stress deviator. The extended model [12] employs, in addition, the thirdstress invariant
J3 ¼ detðsÞ ¼ 13
sijsiksjk ¼ ðrI � rmÞðrII � rmÞðrIII � rmÞ ð1Þ
where the expression on the right is couched in terms of principal stresses, assumed to be ordered as rI P rII P rIII . Thenon-dimensional metric
xðrÞ ¼ 1� 27J3
2r3e
� �2
ð2Þ
lies in the range, 0 6 x 6 1, with x ¼ 0 for all axisymmetric stress states,
rI P rII ¼ rIII or rI ¼ rII P rIII; ð3Þ
and x ¼ 1 for all states comprised of a pure shear stress plus a hydrostatic contribution,
rI ¼ sþ rm; rII ¼ rm; rIII ¼ �sþ rmðs > 0Þ ð4Þ
The original Gurson model was formulated and calibrated based on the mechanics of void growth under axisymmetricstress states. The extension [12] does not alter the model for these states. The extension modifies the predictions for stateswith non-zero xðrÞ. In particular, a contribution to damage growth under pure shear stress states is accounted for in theextension whereas the original Gurson model predicts no change in damage for states having rm ¼ 0.
Nomenclature
A0;A cross-sectional area of neck: initial, currentD characteristic element sizeDP
ij plastic strain rateE Young’s modulusf0; f ; fc; ff void volume fraction: initial, current, onset of coalescence, failureH plate thicknessJ3 stress invariantkx shear damage coefficientN strain hardening exponentq1; q2; q3 fitting parameters in Gurson modelR punch radiussij stress deviatord punch displacementef ductility—true strain in neck at failure
ePM;rM intrinsic true plastic strain and stress in tension (damage-free)
epeakT ;rpeak
T true strain and stress at maximum nominal stressrij;re;rm true stress, effective stress, mean stressrI P rII P rIII true principal stressesx measure of shearing relative to axisymmetric stressing
Z. Xue et al. / Engineering Fracture Mechanics 77 (2010) 492–509 493
Author's personal copy
The yield surface of the extended Gurson model is the same as the original. Including the fitting parameters, q1, q2 and q3,
introduced by Tvergaard [13], it is given in terms of the effective and mean stress measures by
Fðre;rm; f Þ ¼re
rM
� �2
þ 2q1f cos h3q2
2rm
rM
� �� ð1þ q3f 2Þ ð5Þ
The current state is characterized by f , the ‘‘apparent” void volume fraction, and rM , the current effective stress governingflow of the damage-free matrix material. All quantities not labeled with the subscript M represent overall quantities asso-ciated with the bulk material. Normality implies that the plastic strain rate, DP
ij, is given by
DPij ¼
1h
PijPkl _rkl ð6Þ
where
Pij ¼@F@rij¼ 3sij
r2M
þ fq1q2
rMsin h
3q2rm
2rM
� �dij ð7Þ
In finite strain formulations, _rij is identified with the Jaumann rate of stress. The hardening modulus, h, is identified in theAppendix A. If rm ¼ 0, Pkk ¼ 0 and the rate of plastic volume change vanishes, i.e., DP
kk ¼ 0; this feature persists in the exten-sion. In the absence of nucleation, the extension of the Gurson model posits
_f ¼ ð1� f ÞDpkk þ kxfxðrÞ
sijDpij
reð8Þ
The first contribution is that incorporated in the original model while the second is the crux of the extension. As previ-ously noted, the modification leaves the constitutive relation unaltered for axisymmetric stress states. In a state of pureshear, however, (8) gives _f ¼ kxf _cP=
ffiffiffi3p
, where _cP is the plastic shear strain rate and kx is the shear damage coefficient,the sole new parameter in the extended model. The inclusion of the second term in (8) rests on the notion that the volumeof voids undergoing shear may not increase, but void deformation and reorientation contribute to softening and constitutean effective increase in damage [14–16]. In addition, the second term can model damage generated by the nucleation inshear of tiny secondary voids in void sheets linking larger voids. Thus, in the extension, f is no longer directly tied to theplastic volume change. Instead, it must be regarded either as an effective void volume fraction or simply as a damage param-eter, as it is for example when the Gurson model is applied to materials with distinctly non-spherical voids. Further discus-sion and illustrations of the extension are given in [12], where the emphasis is on its role in shear localization. The remainingequations specifying the entire description of the model are listed in the Appendix A. Included is the specification of thewidely used technique [13] that accelerates damage from f ¼ fc to f ¼ ff , at which point the material element is deleted. De-tails of the numerical algorithm used to implement the constitutive model in the finite element code ABAQUS Explicit [16]are also presented in the Appendix A.
3. Outline of the calibration protocol
The elastic–plastic inputs into the extended Gurson Model are the Young’s modulus, E, the Poisson’s ratio, m, and theintrinsic stress–strain response of the damage-free material (f0 ¼ 0). The two damage-related input parameters are the initial
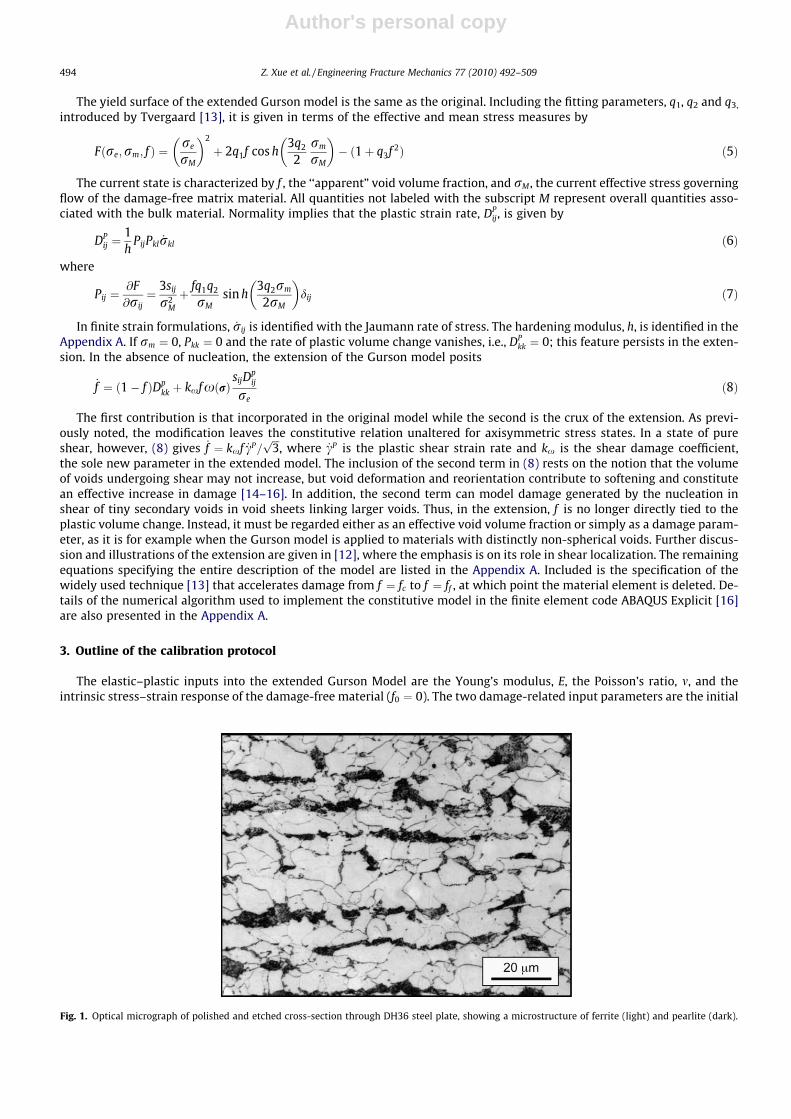
Fig. 1. Optical micrograph of polished and etched cross-section through DH36 steel plate, showing a microstructure of ferrite (light) and pearlite (dark).
494 Z. Xue et al. / Engineering Fracture Mechanics 77 (2010) 492–509
Author's personal copy
effective void volume fraction, f0, and the shear damage coefficient, kx. Additionally, because the constitutive model containsno material length scale, the size of the finite element mesh, D, is calibrated through crack growth predictions, employingwell-established procedures [4,7].
This paper addresses the general task of calibrating the three fracture-related parameters: f0, kx and D. The procedures aredemonstrated through experiments and analyses of DH36 steel (Fig. 1): a high strength alloy commonly used in ship con-struction. Following extensive prior work on calibration procedures for the standard Gurson model (e.g., [4,7]), the presentstudy employs data from a mode I fracture test and a round bar tensile test to identify intrinsic uniaxial stress–strain behav-ior, f0 and D. Additionally, a shear-off test is added to the suite of tests to determine the shear damage coefficient, kx. Thepaper is organized following closely the steps in the calibration protocol:
Section 4: Determination of the intrinsic stress–strain response of the undamaged material from round bar tensile testsand establishing that f0, kx and D have little influence on the plastic response until neck development is quite advanced.Section 5: Determination of f0 and D from compact tension mode I fracture tests and establishing that kx has little influ-ence on crack growth prediction when the crack is planar.Section 6: Determination of kx using data from shear-off tests and the previously determined f0 and D.Section 7: Discussion of the applicability of the calibrated constitutive model to the cup-cone failure mode as one illus-tration and the ductility of notched round bars as another. Possible variations in the identification protocol for othermaterials are also discussed.
The three calibration tests were conducted under quasi-static loading, while all simulations were carried out using thedynamic code ABAQUS Explicit. In order to minimize inertial effects and efficiently simulate the quasi-static tests in the ex-plicit code, a preliminary series of calculations with different fixed applied loading rates was performed for each test con-figuration. At some loading rate, as the rates decrease, the simulations converge to a quasi-static limit. That loading ratewas then employed in all subsequent calculations. Material strain rate dependence is ignored in the present computations.
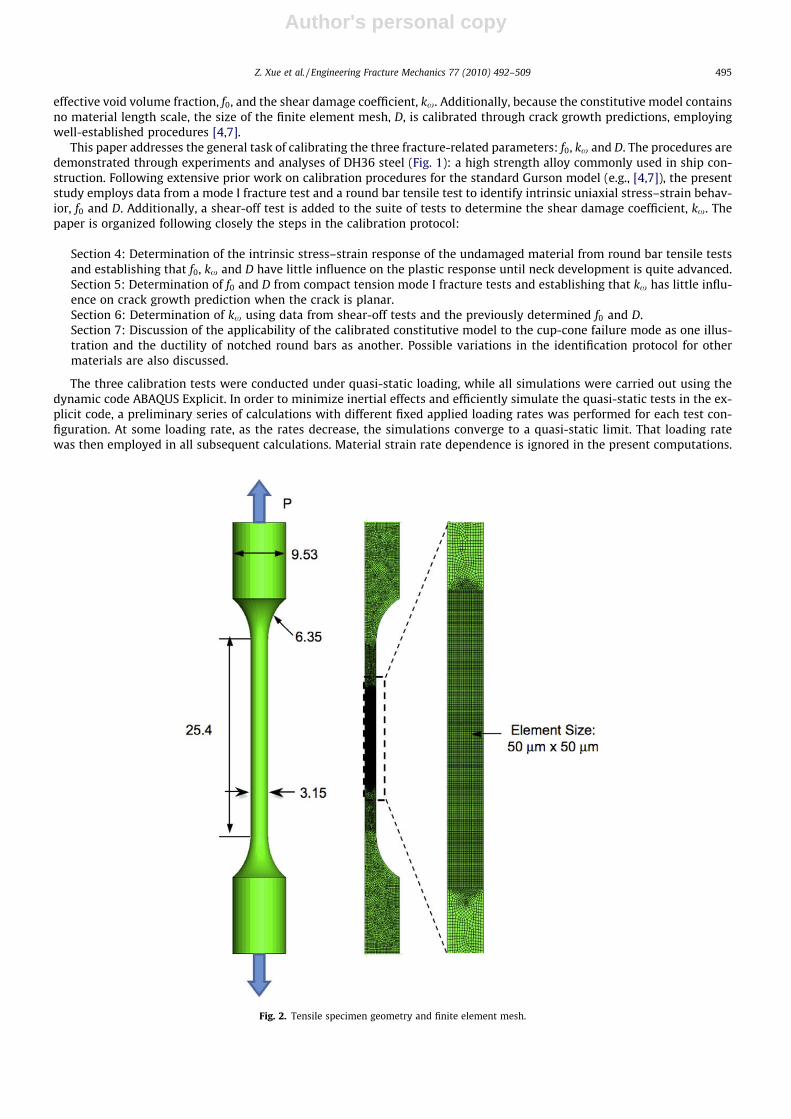
Fig. 2. Tensile specimen geometry and finite element mesh.
Z. Xue et al. / Engineering Fracture Mechanics 77 (2010) 492–509 495
Author's personal copy
4. Intrinsic plastic response of the undamaged material
The plastic response of the undamaged material (f0 ¼ 0) was obtained from quasi-static uniaxial tensile tests on roundbars coupled with elastic–plastic finite element computations. The test geometry and finite element mesh are shown inFig. 2. The nominal axial strain eN was measured using a non-contacting laser extensometer over a central 12.7 mm lengthwithin the gauge section. Prior to necking, the true (logarithmic) strain is given by eT ¼ lnð1þ eNÞ and the true stress byrT ¼ rNð1þ eNÞ, where rN is the nominal stress (load/initial area). To ascertain the true response in the post-necking regime,computations were performed using an assumed form of the stress–strain relation (detailed below) and matching the pre-dicted nominal stress–strain curves with those obtained experimentally. To accurately capture strain localization, a finitestrain formulation of elasto-plastic theory was employed in the finite element model. Four-node axisymmetric elements
0 0.1 0.2 0.3 0.4 0.5
900
800
700
600
500
400
300
200
100
0
N=0.200.185
0.16
Experimental
True strain, εT
True
stre
ss, σ
T
a
0 0.1 0.2 0.3 0.4
700
600
500
400
300
200
100
0
N=0.200.185
0.16
Experimental
Nom
inal
stre
ss, σ
N
Nominal strain, εN
b
ε σTpeak
Tpeak,( )
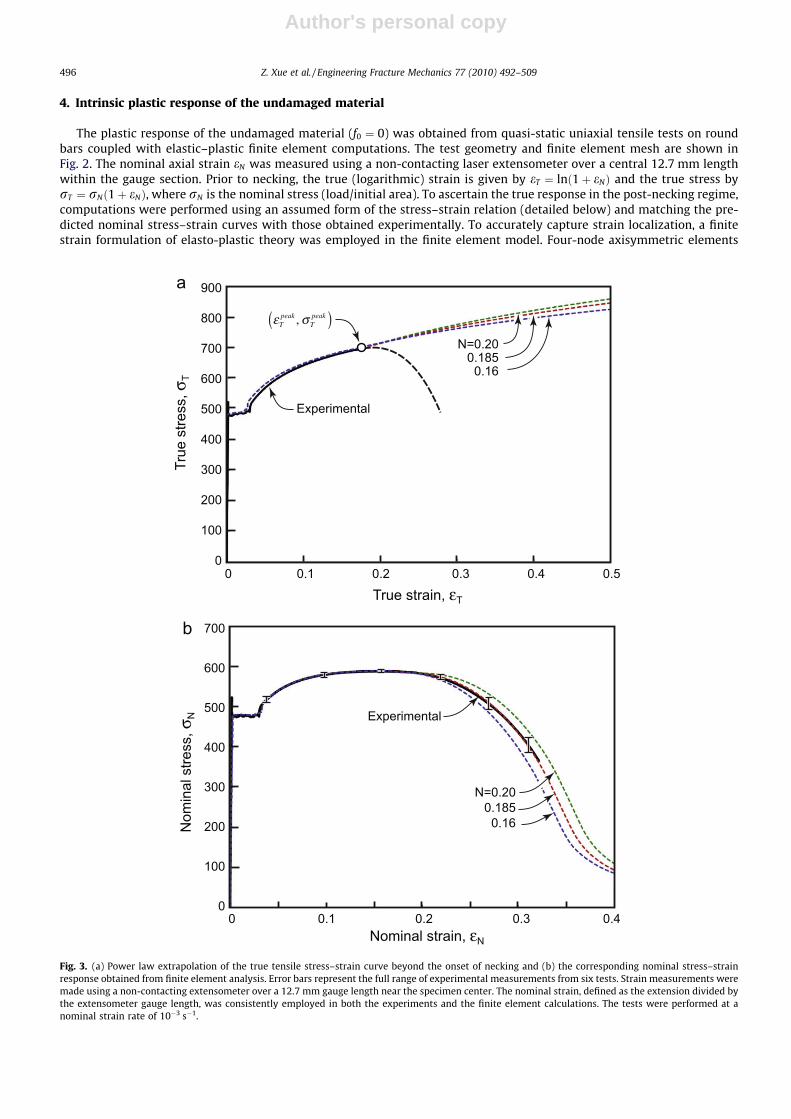
Fig. 3. (a) Power law extrapolation of the true tensile stress–strain curve beyond the onset of necking and (b) the corresponding nominal stress–strainresponse obtained from finite element analysis. Error bars represent the full range of experimental measurements from six tests. Strain measurements weremade using a non-contacting extensometer over a 12.7 mm gauge length near the specimen center. The nominal strain, defined as the extension divided bythe extensometer gauge length, was consistently employed in both the experiments and the finite element calculations. The tests were performed at anominal strain rate of 10�3 s�1.
496 Z. Xue et al. / Engineering Fracture Mechanics 77 (2010) 492–509

Author's personal copy
with reduced Gaussian integration (CAX4R in ABAQUS/Explicit [16]) were used. The model was based on an axisymmetricmesh comprised of square section elements with size, D = 50 lm, providing more than 30 elements across the gauge radius.The element size was selected to be consistent with the value emerging from the calibration of the mode I fracture data, pre-sented in the next section. Nevertheless, since the selected element size is already very much smaller than the macroscopicspecimen dimensions and hence the strains are adequately resolved, further reductions in element size would have essen-tially no effect on the intrinsic (damage-free) stress–strain response. Additional computations were performed to demon-strate that f0 and kx do not affect the identification of the true stress–strain curve even up to strains approaching that forrupture.
The average true stress–strain curve from five tensile tests is plotted in Fig. 3a. This curve was subsequently used to char-acterize the stress–strain response for stresses below that corresponding to the load maximum, denoted rpeak
T . To extrapolate
beyond rpeakT , a true stress–strain curve of the form rT ¼ rpeak
T ðeT=epeakT ÞN was assumed. A preliminary estimate of the strain
hardening exponent N was obtained by a least squares fit of the small strain data. A series of finite element computationswas then performed to ascertain the full nominal tensile stress–strain curve, using a range of values of N, guided by the pre-ceding curve fitting. As shown in Fig. 3b, the results for N ¼ 0:185 (and f0 ¼ 0) accurately replicate the experimental mea-surements up to the onset of rupture (at a nominal strain of eN ¼ 0:32). In summary, the true stress–strain curve used tocharacterize the damage-free material (f0 ¼ 0) is given by the experimental curve below rpeak
T and the power law extrapo-lation at stresses above rpeak
T .For eN < 0:3, void growth has almost no effect on the tensile behavior of DH36. This result is demonstrated in Fig. 4 by
comparing the experimental data with finite element computations based on a hardening exponent N ¼ 0:185 and severalrepresentative initial void volume fractions (including the Mises limit, wherein f0 ¼ 0). Other than f0, kx and D, the basicparameters characterizing the constitutive model that are used in all simulations in this paper are:
E ¼ 210 MPa; m ¼ 0:3; N ¼ 0:185; q1 ¼ 1:5; q2 ¼ 1; q3 ¼ 2:25; f c ¼ 0:15 and f f ¼ 0:25 ð9Þ
The comparisons show that the effects of void growth, manifested in a divergence in the stress–strain response from thatof a Mises material, are important only very near the point of final rupture for the DH36 tensile specimen. Their effect is toaccelerate the softening of the material such that the load drops more rapidly than that predicted for the damage-free mate-rial. Further details of the failure process in the neck, including formation of a cup-cone fracture surface, are presented inSection 7.
5. Determination of f0 and D from compact tension test
Compact tension tests were performed on specimens with the geometry shown in Fig. 5a. Crack mouth opening displace-ment was measured using a non-contacting extensometer and a pair of fiducial tapes mounted on the specimen edge, sep-arated by a distance of 14 mm. Optical images of the broad sample surface were periodically recorded. The experimental
0 0.1 0.2 0.3 0.4
700
600
500
400
300
200
100
0
fo = 0.0010.0020.003
Experimental
Nom
inal
stre
ss, σ
N
Nominal strain, εN
fo=0(Mises)
kω = 0
Fig. 4. Effects of initial void volume fraction fo on the computed nominal tensile stress–strain response. Over the pertinent range of fo, the computed resultsare indistinguishable from the experimental measurements up to the onset of fracture.
Z. Xue et al. / Engineering Fracture Mechanics 77 (2010) 492–509 497

Author's personal copy
measurements and observations are summarized in Figs. 6 and 7. Significant nonlinearity due to plasticity is evident in boththe load–displacement response and in the optical images at displacements above 0.5 mm. Following an initial rising por-tion, the load–displacement curve reaches a maximum, at a displacement of about 3–4 mm. This point corresponds to theemergence of a crack on the external surface of the sample (Fig. 7d–f). Further growth both at the surface and in the interioroccurs under decreasing load.
The corresponding finite element model is shown in Fig. 5b. In the present analysis, deformations are restricted to besymmetric with respect to the mid-plane such that a symmetry boundary condition is applied to the mid-plane. Conse-quently, the region meshed is only one half of the full specimen. Eight-node brick elements with reduced Gaussian integra-tion (C3D8R in ABAQUS/Explicit [16]) were used. Iterations on element size and meshing details were made prior to arrivingat the mesh used to carry out the final analysis. The smallest elements at the mid-plane in the vicinity of the crack tip havedimensions 30 � 30 � 50 lm with 50 lm in the through-thickness direction. Near the surface of the specimen and near thetip the element dimensions are 30 � 30 � 80 lm. Approximately 100 elements extend from the mid-plane to the surface inthe vicinity of the crack tip. The 30 lm in-plane mesh at the tip allows accurate resolution of the initial tip notch. Furtheraway from the notch tip in the region of crack propagation, the in-plane dimensions of the mesh are approximately50 � 50 lm. Relatively small differences in results were found from a series of computations with different meshes with ele-ment dimensions in the range from 30 lm to 50 lm. The mesh in Fig. 5b is regarded as having a nominal (characteristic) sizeD = 50 lm. In order to improve computational efficiency, only the material in the region of crack propagation, which starts
Fig. 5. (a) Compact tension test geometry employed in the experimental study and (b) corresponding finite element model. Specimen thickness is 12.5 mm.Crack mouth opening displacements were measured using a non-contacting extensometer and a pair of fiducial tapes mounted on the specimen edge,separated by a distance of 14 mm. The same definition was used in the subsequent finite element calculations.
498 Z. Xue et al. / Engineering Fracture Mechanics 77 (2010) 492–509
Author's personal copy
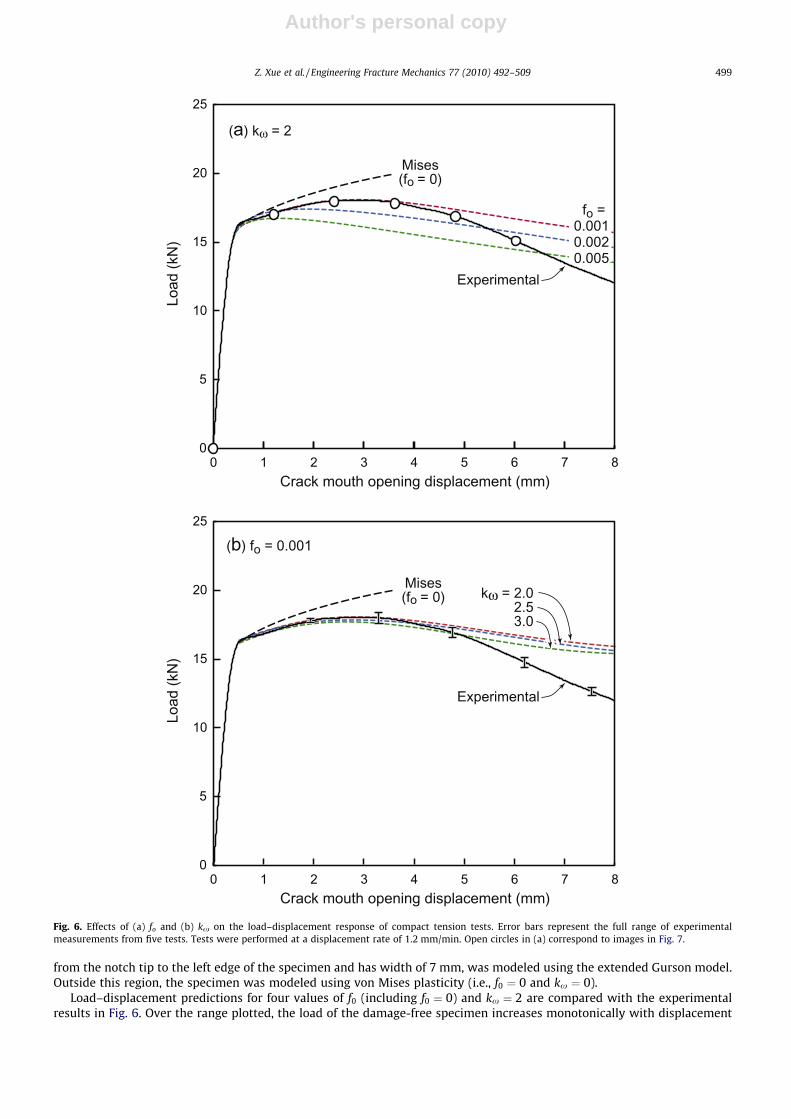
from the notch tip to the left edge of the specimen and has width of 7 mm, was modeled using the extended Gurson model.Outside this region, the specimen was modeled using von Mises plasticity (i.e., f0 ¼ 0 and kx ¼ 0).
Load–displacement predictions for four values of f0 (including f0 ¼ 0) and kx ¼ 2 are compared with the experimentalresults in Fig. 6. Over the range plotted, the load of the damage-free specimen increases monotonically with displacement
0
5
10
15
20
25
0 1 2 3 4 5 6 7 8Crack mouth opening displacement (mm)
Load
(kN
)
Mises(fo = 0)
Experimental
(b) fo = 0.001
kω = 2.02.53.0
0
5
10
15
20
25
0 1 2 3 4 5 6 7 8Crack mouth opening displacement (mm)
Load
(kN
)
Experimental
fo = 0.0010.0020.005
(a) kω = 2
Mises(fo = 0)
Fig. 6. Effects of (a) fo and (b) kx on the load–displacement response of compact tension tests. Error bars represent the full range of experimentalmeasurements from five tests. Tests were performed at a displacement rate of 1.2 mm/min. Open circles in (a) correspond to images in Fig. 7.
Z. Xue et al. / Engineering Fracture Mechanics 77 (2010) 492–509 499
Author's personal copy
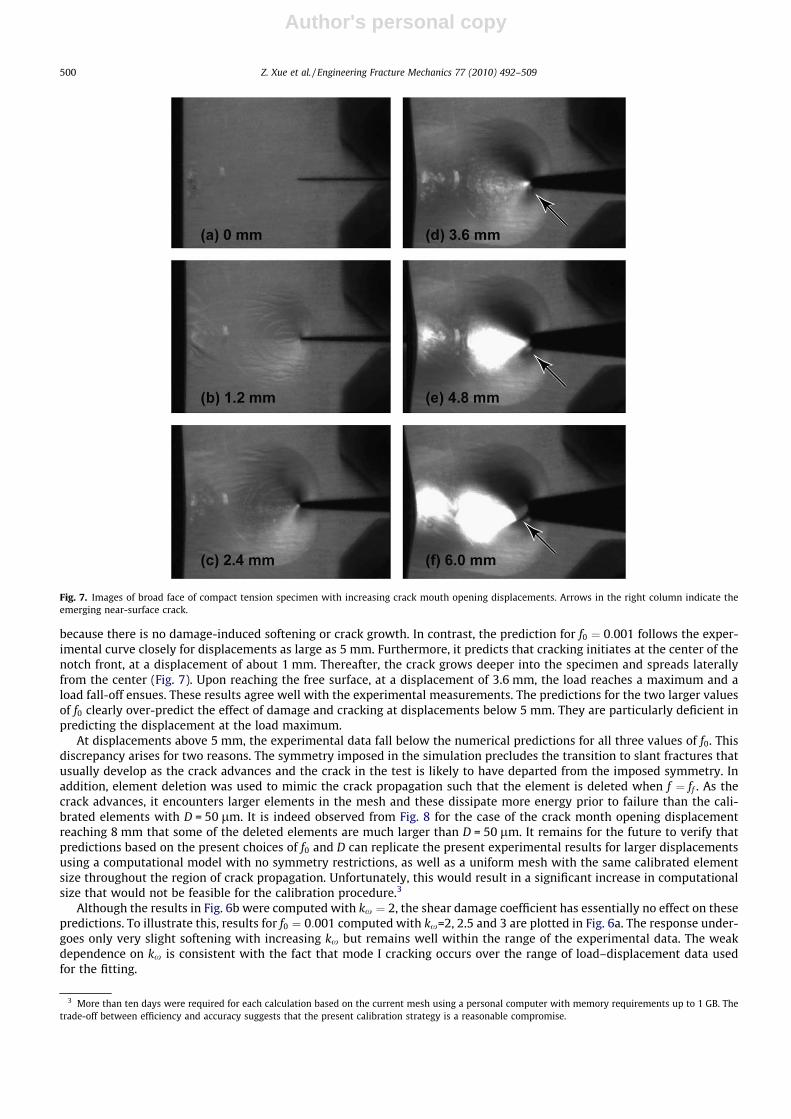
because there is no damage-induced softening or crack growth. In contrast, the prediction for f0 ¼ 0:001 follows the exper-imental curve closely for displacements as large as 5 mm. Furthermore, it predicts that cracking initiates at the center of thenotch front, at a displacement of about 1 mm. Thereafter, the crack grows deeper into the specimen and spreads laterallyfrom the center (Fig. 7). Upon reaching the free surface, at a displacement of 3.6 mm, the load reaches a maximum and aload fall-off ensues. These results agree well with the experimental measurements. The predictions for the two larger valuesof f0 clearly over-predict the effect of damage and cracking at displacements below 5 mm. They are particularly deficient inpredicting the displacement at the load maximum.
At displacements above 5 mm, the experimental data fall below the numerical predictions for all three values of f0. Thisdiscrepancy arises for two reasons. The symmetry imposed in the simulation precludes the transition to slant fractures thatusually develop as the crack advances and the crack in the test is likely to have departed from the imposed symmetry. Inaddition, element deletion was used to mimic the crack propagation such that the element is deleted when f ¼ ff . As thecrack advances, it encounters larger elements in the mesh and these dissipate more energy prior to failure than the cali-brated elements with D = 50 lm. It is indeed observed from Fig. 8 for the case of the crack month opening displacementreaching 8 mm that some of the deleted elements are much larger than D = 50 lm. It remains for the future to verify thatpredictions based on the present choices of f0 and D can replicate the present experimental results for larger displacementsusing a computational model with no symmetry restrictions, as well as a uniform mesh with the same calibrated elementsize throughout the region of crack propagation. Unfortunately, this would result in a significant increase in computationalsize that would not be feasible for the calibration procedure.3
Although the results in Fig. 6b were computed with kx ¼ 2, the shear damage coefficient has essentially no effect on thesepredictions. To illustrate this, results for f0 ¼ 0:001 computed with kx=2, 2.5 and 3 are plotted in Fig. 6a. The response under-goes only very slight softening with increasing kx but remains well within the range of the experimental data. The weakdependence on kx is consistent with the fact that mode I cracking occurs over the range of load–displacement data usedfor the fitting.
Fig. 7. Images of broad face of compact tension specimen with increasing crack mouth opening displacements. Arrows in the right column indicate theemerging near-surface crack.
3 More than ten days were required for each calculation based on the current mesh using a personal computer with memory requirements up to 1 GB. Thetrade-off between efficiency and accuracy suggests that the present calibration strategy is a reasonable compromise.
500 Z. Xue et al. / Engineering Fracture Mechanics 77 (2010) 492–509
Author's personal copy
In summary, based on the agreement between prediction and experiment for displacements below 5 mm, the choicesf0 ¼ 0:001 with D � 50 lm are made for DH36.
6. Determination of kx from a shear-off test
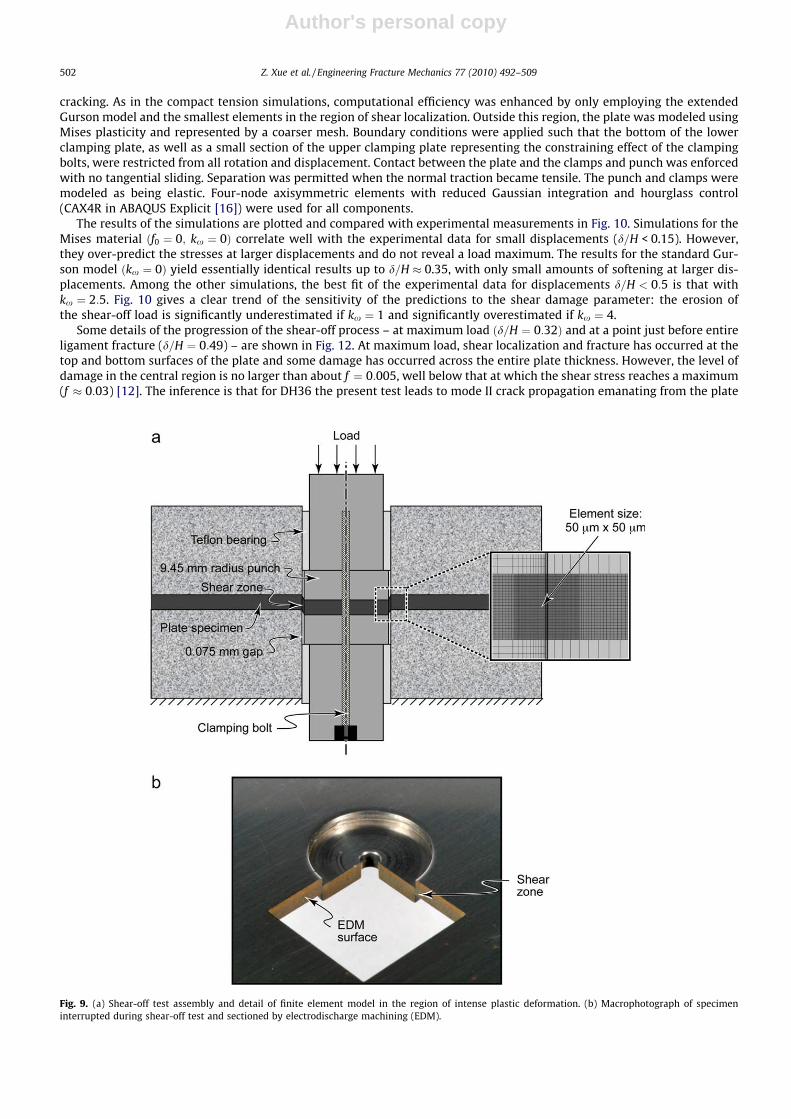
The fixture in Fig. 9 was designed to create a controlled test in which shear localization gives way to mode II fracture [17].The corresponding load–displacement curve is used to infer the shear damage coefficient, kx. In the test, a plate specimen(3 mm thick) is clamped between two thick steel platens, each with a through-hole of diameter 19.2 mm. Cylindrical steelplungers, 19.05 mm in diameter, are inserted into each of the two holes, leaving a narrow (0.075 mm) radial gap between theplunger surface and the hole. An additional pair of plungers with slightly reduced diameter (to accommodate Teflon bear-ings) is then inserted into the holes. The four plungers and the test specimen are then clamped together with a single boltpassing through open holes in each of three of the plungers and the test specimen and a threaded hole in the last plunger, asshown in Fig. 9. With one side of the assembly placed on a stiff supporting base, the plunger on the opposite side is loadaxially in compression. The movement of the plungers induces shear deformation within a narrow cylindrical ring in thespecimen. Failure starts as shear localizations near the upper and lower surfaces of the plate which subsequently developinto mode II cracks as the deformation progresses into the plate.
The experimental measurements are summarized in Fig. 10. The coordinate axes are the nominal applied shear stress,s � P=ð2pRHÞ (R being the plunger radius and H the plate thickness) and the normalized displacement, d=H. The resultingcurves exhibit features reminiscent of those obtained in tension tests. That is, the initial linear region gives way to plasticityat a shear stress of rO=2 � 240 MPa (rO being the tensile yield stress, obtained from Fig. 3). Following a period of strain hard-ening, the load reaches a peak, at a displacement of d=H � 0.3–0.4, and subsequently diminishes with increasing displace-ment. Scanning electron micrographs of a cross-section through a test specimen that had been interrupted followingloading to a displacement d=H � 0.5 are presented in Fig. 11. They reveal a diffuse damage zone within the region of intenseshear as well as well-defined shear cracks emanating from the specimen surface in the vicinity of the plunger periphery.
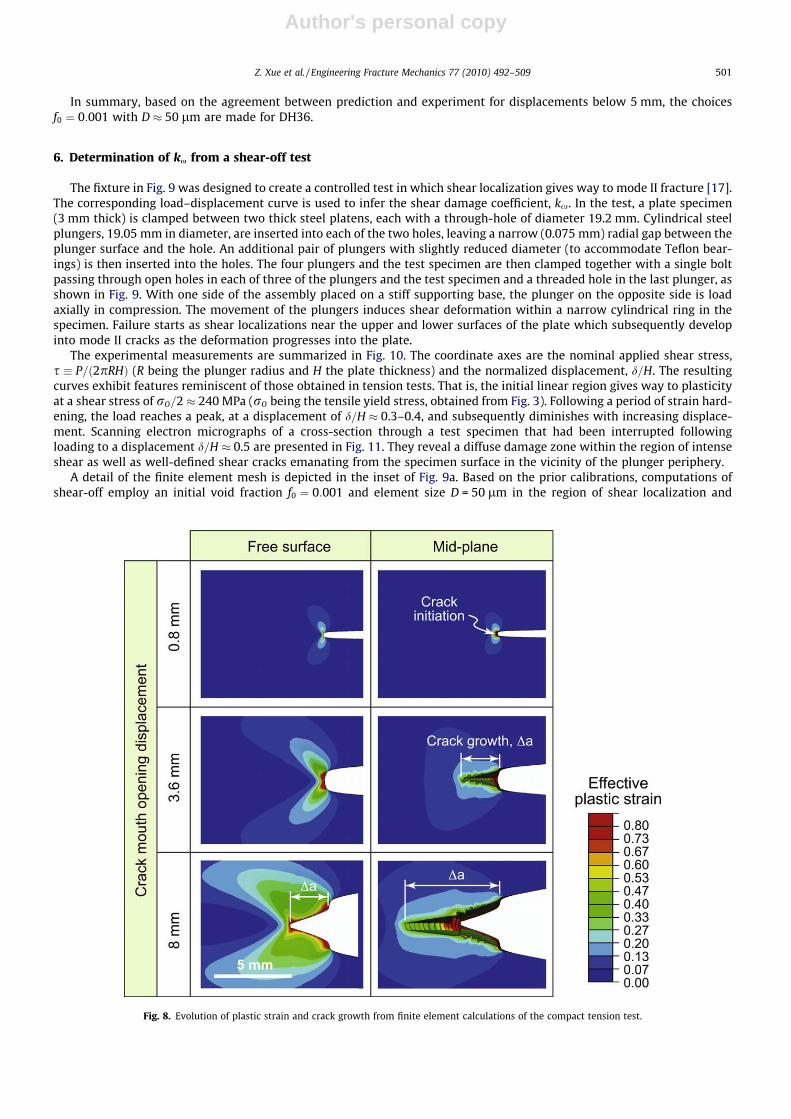
A detail of the finite element mesh is depicted in the inset of Fig. 9a. Based on the prior calibrations, computations ofshear-off employ an initial void fraction f0 ¼ 0:001 and element size D = 50 lm in the region of shear localization and
Fig. 8. Evolution of plastic strain and crack growth from finite element calculations of the compact tension test.
Z. Xue et al. / Engineering Fracture Mechanics 77 (2010) 492–509 501
Author's personal copy
cracking. As in the compact tension simulations, computational efficiency was enhanced by only employing the extendedGurson model and the smallest elements in the region of shear localization. Outside this region, the plate was modeled usingMises plasticity and represented by a coarser mesh. Boundary conditions were applied such that the bottom of the lowerclamping plate, as well as a small section of the upper clamping plate representing the constraining effect of the clampingbolts, were restricted from all rotation and displacement. Contact between the plate and the clamps and punch was enforcedwith no tangential sliding. Separation was permitted when the normal traction became tensile. The punch and clamps weremodeled as being elastic. Four-node axisymmetric elements with reduced Gaussian integration and hourglass control(CAX4R in ABAQUS Explicit [16]) were used for all components.
The results of the simulations are plotted and compared with experimental measurements in Fig. 10. Simulations for theMises material ðf0 ¼ 0; kx ¼ 0Þ correlate well with the experimental data for small displacements (d=H < 0.15). However,they over-predict the stresses at larger displacements and do not reveal a load maximum. The results for the standard Gur-son model ðkx ¼ 0Þ yield essentially identical results up to d=H � 0.35, with only small amounts of softening at larger dis-placements. Among the other simulations, the best fit of the experimental data for displacements d=H < 0:5 is that withkx ¼ 2:5. Fig. 10 gives a clear trend of the sensitivity of the predictions to the shear damage parameter: the erosion ofthe shear-off load is significantly underestimated if kx ¼ 1 and significantly overestimated if kx ¼ 4.
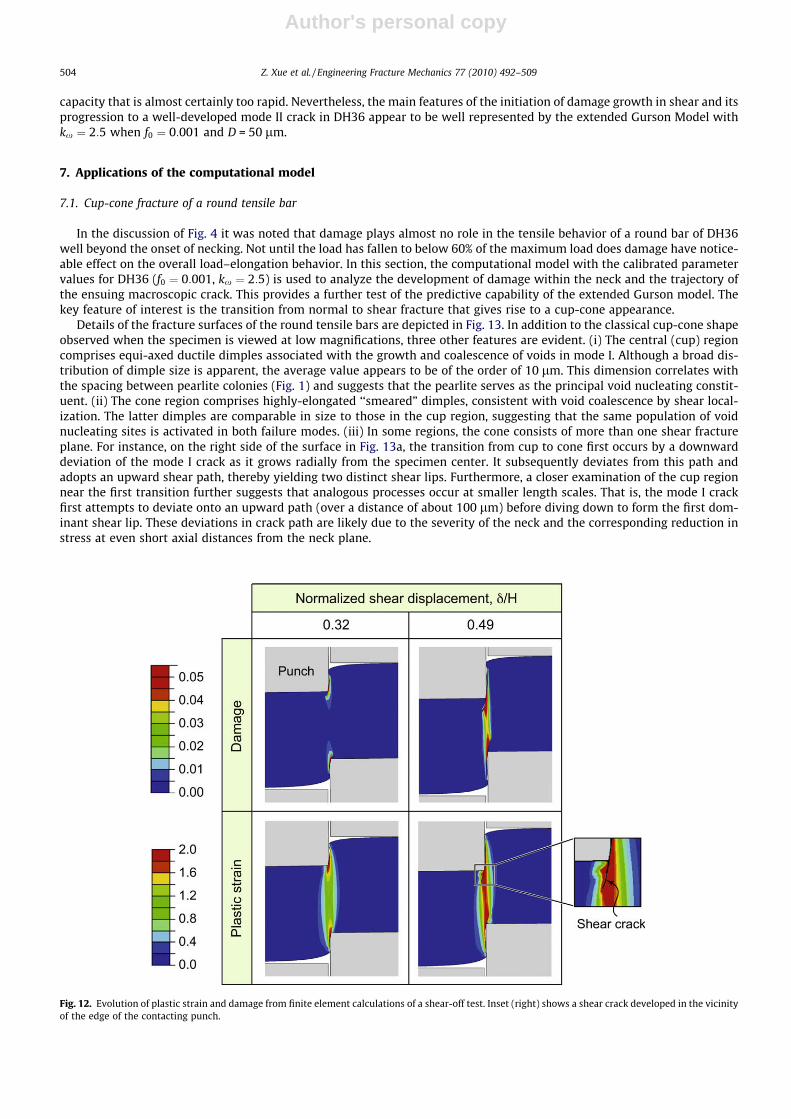
Some details of the progression of the shear-off process – at maximum load ðd=H ¼ 0:32Þ and at a point just before entireligament fracture (d=H ¼ 0:49) – are shown in Fig. 12. At maximum load, shear localization and fracture has occurred at thetop and bottom surfaces of the plate and some damage has occurred across the entire plate thickness. However, the level ofdamage in the central region is no larger than about f ¼ 0:005, well below that at which the shear stress reaches a maximum(f � 0:03) [12]. The inference is that for DH36 the present test leads to mode II crack propagation emanating from the plate
Fig. 9. (a) Shear-off test assembly and detail of finite element model in the region of intense plastic deformation. (b) Macrophotograph of specimeninterrupted during shear-off test and sectioned by electrodischarge machining (EDM).
502 Z. Xue et al. / Engineering Fracture Mechanics 77 (2010) 492–509

Author's personal copy
surfaces rather than global (net-section) rupture. In the second case, for d=H ¼ 0:49, the ring cracks have extended well intothe plate interior and the damage parameter in the center has almost reached the failure level, f � fF ¼ 0:25. The ligamentundergoes complete fracture in the next increment and the load drops abruptly to zero. The final stages of the failure processare not accurately captured because the simulation does not account for friction between contacting crack surfaces. Elementdeletion also plays a role. In the narrow region of shear-off, the plastic strain and damage is almost uniform before the shear-off fracture occurs. Multiple elements are predicted to fail almost simultaneously predicting of a loss of load carrying
0
100
200
300
400
500
600
0 0.1 0.2 0.3 0.4 0.5 0.6
kω = 2.5
Mises
kω = 2
kω = 1
Normalized displacement, δ/H
Nom
inal
she
ar s
tress
, P/2
πRH
(MPa
) kω = 0fo = 0.001
kω = 3kω = 4
Experimental
Fig. 10. Measured and computed shear-off response.
Fig. 11. Scanning electron micrographs of polished cross-sections through shear-out specimen, interrupted at displacement d/H = 0.5.
Z. Xue et al. / Engineering Fracture Mechanics 77 (2010) 492–509 503
Author's personal copy
capacity that is almost certainly too rapid. Nevertheless, the main features of the initiation of damage growth in shear and itsprogression to a well-developed mode II crack in DH36 appear to be well represented by the extended Gurson Model withkx ¼ 2:5 when f0 ¼ 0:001 and D = 50 lm.
7. Applications of the computational model
7.1. Cup-cone fracture of a round tensile bar
In the discussion of Fig. 4 it was noted that damage plays almost no role in the tensile behavior of a round bar of DH36well beyond the onset of necking. Not until the load has fallen to below 60% of the maximum load does damage have notice-able effect on the overall load–elongation behavior. In this section, the computational model with the calibrated parametervalues for DH36 (f0 ¼ 0:001, kx ¼ 2:5) is used to analyze the development of damage within the neck and the trajectory ofthe ensuing macroscopic crack. This provides a further test of the predictive capability of the extended Gurson model. Thekey feature of interest is the transition from normal to shear fracture that gives rise to a cup-cone appearance.
Details of the fracture surfaces of the round tensile bars are depicted in Fig. 13. In addition to the classical cup-cone shapeobserved when the specimen is viewed at low magnifications, three other features are evident. (i) The central (cup) regioncomprises equi-axed ductile dimples associated with the growth and coalescence of voids in mode I. Although a broad dis-tribution of dimple size is apparent, the average value appears to be of the order of 10 lm. This dimension correlates withthe spacing between pearlite colonies (Fig. 1) and suggests that the pearlite serves as the principal void nucleating constit-uent. (ii) The cone region comprises highly-elongated ‘‘smeared” dimples, consistent with void coalescence by shear local-ization. The latter dimples are comparable in size to those in the cup region, suggesting that the same population of voidnucleating sites is activated in both failure modes. (iii) In some regions, the cone consists of more than one shear fractureplane. For instance, on the right side of the surface in Fig. 13a, the transition from cup to cone first occurs by a downwarddeviation of the mode I crack as it grows radially from the specimen center. It subsequently deviates from this path andadopts an upward shear path, thereby yielding two distinct shear lips. Furthermore, a closer examination of the cup regionnear the first transition further suggests that analogous processes occur at smaller length scales. That is, the mode I crackfirst attempts to deviate onto an upward path (over a distance of about 100 lm) before diving down to form the first dom-inant shear lip. These deviations in crack path are likely due to the severity of the neck and the corresponding reduction instress at even short axial distances from the neck plane.
Fig. 12. Evolution of plastic strain and damage from finite element calculations of a shear-off test. Inset (right) shows a shear crack developed in the vicinityof the edge of the contacting punch.
504 Z. Xue et al. / Engineering Fracture Mechanics 77 (2010) 492–509

Author's personal copy
Tvergaard and Needleman [9] carried out the first detailed computational study of the failure mode in the neck of a roundtensile bar based on the unmodified Gurson model. Their work demonstrated that a transition from the planar mode I cracknucleated in the center of the neck to a conical mixed mode shear crack can occur for this constitutive model if a sufficiently
Fig. 13. Fracture surface of DH36 tensile bar showing: (a) cup-cone failure mode; (b, c) equi-axed dimples caused by void growth and coalescence in thecentral region; and (c, d) elongated dimples formed by void coalescence during shear lip formation.
Fig. 14. Effects of initial element size and kx on the crack trajectory in an initially unnotched round tensile bar.
Z. Xue et al. / Engineering Fracture Mechanics 77 (2010) 492–509 505

Author's personal copy
fine mesh is used and if a relatively large damage level is invoked. These authors took f0 ¼ 0 and assumed that a 4% volumefraction of voids would be nucleated under increasing strain. Thus, the total void volume fraction nucleated in their simu-lations far exceeds the void fraction considered to be representative for materials such as DH36. The present calculationssuggest that, for realistic void volume fractions (of order 10�3), the transition to conical shear cracking does not occur whenthe unmodified Gurson model is employed. This finding is borne out by an extensive study of fracture modes in round tensilebars and in-plane strain specimens by Besson et al. [10] using several damage-based constitutive models. More recently, Le-blond [18] has pursued these issues further by considering the extended Gurson Model with findings similar to those re-ported below.
Even when shear damage is included (kx ¼ 2:5), simulations with a square mesh in the neck (50 � 50 lm) do not predicta transition to a conical crack. Reducing the initial element height such that the element aspect ratio at the onset of fractureis approximately unity at the onset of fracture accommodates a mixed mode conical crack propagating at roughly 45� to theaxis of the specimen. Although this modification does not lead to a transition when the initial element width is set at
0 0.1 0.2 0.3 0.4
700
600
500
400
300
200
100
0
Experimental
Nom
inal
stre
ss, σ
N
Nominal strain, εN
kω = 2.5
50 μm x 7 μm
40 μm x 6 μm
35 μm x 5 μm
30 μm x 5 μm
Fig. 15. Effects of initial element size on the computed tensile stress–strain curve.
Fig. 16. Notched tensile geometry and corresponding finite element mesh.
506 Z. Xue et al. / Engineering Fracture Mechanics 77 (2010) 492–509
Author's personal copy
D = 50 lm, a well-defined cup-and-cone fracture mode is predicted for slightly smaller element widths (Fig. 14). The fracturepatterns in Fig. 14 were computed using the mesh just described for deformations restricted to be axisymmetric but with nosymmetry imposed with respect to the plane through the center of the neck. The mesh (40 � 6 lm) in Fig. 14c gives rise to anear-planar crack in the center of the specimen followed by the transition to a conical crack after a hesitating start in theopposite direction, broadly consistent with the experimental observations.
7.2. Ductility of straight and notched round bars
The standard definition of the ductility of a metal alloy is the logarithmic strain at failure of a round tensile bar as deter-mined by ef ¼ lnðA0=AÞwith A0=A being the ratio of initial to final cross-sectional areas at the neck. The ductility predicted forthe round bar of DH35 with f0 ¼ 0:001, kx ¼ 2:5 and the 40 � 6 lm mesh is ef ¼ 1:38. This value is in close agreement withthat measured experimentally: ef ¼ 1:35� 0:04 (from five specimens). The ductility prediction is not nearly as sensitive tomeshing as the prediction of the transition to the slanted fracture path. For example, the ductility predictions for the othermeshes in Fig. 13 are ef ¼ 1:41 for (a), ef ¼ 1:44 for (b) and ef ¼ 1:36 for (d). The fact that ductility predictions are less sen-sitive to meshing details than crack path transition is consistent with the fact that the overall load–elongation behavior isalso relatively insensitive to meshing details. This can be seen in Fig. 15 where nominal stress–strain curves are presentedcorresponding to some of the same meshes used in the mode transition study in Fig. 14. The cross-sectional area of the neckbecomes nearly ‘‘frozen” as soon as a normal localization band forms in the center of the neck much before the mode tran-sition. Thus, an accurate ductility prediction relies primarily on the ability of the constitutive model to capture the onset of anormal localization since the onset itself is not very sensitive to mesh size, assuming the mesh is adequate to accurately re-solve the stresses and strains in the neck.
As a final validation of the calibrated computational model, the ductility of a notched round bar of DH36 has been com-puted. The specimen geometry and the mesh in the critical region are shown in Fig. 16. The predicted ductility is ef ¼ 0:98.By comparison, the experimentally measured values from three test specimens fall in the range ef ¼ 0:91—0:93. Thus themodel correctly predicts the reduction in ductility due to the increased stress triaxiality arising from the notch geometry.
8. Concluding remarks
This paper has demonstrated that, when properly calibrated, the extended Gurson model has considerable promise as acomputational tool for predicting the formation of cracks and their subsequent propagation in ductile structural alloys undera wide range of stress states. By incorporating a parameter to characterize damage in shear, the extended model widens thescope of applications to failure modes with a heavy component of shear. The calibration protocol employed here uses threetypes of tests: (i) uniaxial tension of a round bar, to infer the intrinsic stress–strain behavior of the undamaged material; (ii)mode I cracking in a compact tension specimen, to calibrate the initial void volume fraction and the element size; and (iii)mode II cracking in a newly-designed shear-off test, to determine the shear damage coefficient. For the alloy in the presentstudy, DH36, it was established that these three calibration steps can be conducted independently, assuming that thesequential order listed above is followed. The calibration process might turn out to be more complicated for other materials,e.g., the shear damage coefficient might influence the calibration of the other two parameters in step (ii). It is worth notingthat a variation on the procedure employed here in step (ii) would be to choose f0 and D to fit resistance curve data in theform of the J-integral vs. crack growth, JRðDaÞ, extracted from a side-grooved compact tension specimen designed to sustain astraight crack front. The work of Xia and Shih [4] reveals that JIC ¼ CrY D where C lies in the range from 2 to 5 depending on Nand f0. For DH36 with N ¼ 0:185 and f0 ¼ 0:001, C ffi 5 such that the formula gives JIC ffi 120kJ m�2 with D = 50 lm. This var-iation based on JRðDaÞ has the attraction that the calibration is directly tied to the mode I toughness of the material.
As noted in Section 1, it is not feasible to use the fine scale computational model developed here for failure analysis oflarge structures, except possibly when the precise location of the crack path can be anticipated. The element size in the re-gion of fracture for relatively tough structural alloys will be in the range from tens to hundreds of microns. Thus, applicationof damage models of the present type will usually be restricted to the study of basic aspects of crack formation and to crack-ing in structural components and in metal forming and joining processes. A method being developed [19] that is capable ofanalyzing the failure of large plate and shell structures is the extended finite element method (XFEM) wherein localizationsand cracks occur within large elements (compared to plate thickness, for example) and aligned in any direction. In suchcoarse scale formulations the fracture process is usually represented by a cohesive zone representing the overall trac-tion–separation behavior averaged through the thickness of the plate or shell. The present fine scale computational modelcan be used to generate the criterion for the propagation direction and the overall traction–separation relation required forimplementing the XFEM model.
The extended Gurson model can also be used to study detailed aspects of crack formation and growth as illustrated by thecup-cone failure mode of the round tensile bar. However, to properly capture the transition from mode I to shear cracking,the finite element mesh must be designed to produce elements with nearly unit aspect ratio at failure in the rupture-criticallocations. To satisfy this criterion with rectangular elements, the initial element aspect ratio (width to height) must be takento be about e3ef =2. For DH36, with ef � 1.4, the required aspect ratio is about 8. This value is consistent with that used for themesh designs that most accurately predicted the transition in failure modes (Figs. 14c and d). Even more challenging are the
Z. Xue et al. / Engineering Fracture Mechanics 77 (2010) 492–509 507

Author's personal copy
three-dimensional aspects of the transition of a mode I through-crack in a plate to the mixed mode slant crack that emergeswhen the crack advance is extensive. As the crack advances, a neck forms ahead of the current crack tip, localizing the plasticdeformation and developing into a slanted shear crack in the final stages of separation. As noted in connection with the cup-cone simulations, the prediction of a change in direction of crack path involving a transition from a mode I to a mixed modeseparation process is quite sensitive to mesh design [10,18]. Further effort is needed to create more robust predictive capa-bilities. A fine scale XFEM formulation using the extended Gurson model to generate the details of the cohesive zone behav-ior would be worth exploring.
Acknowledgment
This work was supported in part by an ONR MURI through grants to the School of Engineering and Applied Sciences atHarvard University and the Materials Department at the University of California, Santa Barbara.
Appendix A. The remaining equations governing the modified Gurson model and details of the numerical algorithm
The remaining equations governing increments in the modified model are now listed. Void nucleation is not included butit can readily be incorporated [13,20]. The consistency condition for continued plastic loading,
_F ¼ @F@rij
_rij þ@F@rM
_rM þ@F@f
_f ¼ 0; ð10Þ
provides the expression for the hardening modulus,
h ¼ � ð1� f ÞPkk þ kxfxre
Pijsij
� �@F@fþ hM
ð1� f ÞrM
@F@rM
Pijrij
� �ð11Þ
Here,
@F@rM
¼ �2r2e
r3M
þ 3q1q2frm
r2M
sin h3q2rm
2rM
� �ð12Þ
@F@f¼ 2q1 cos h
3q2rm
2rM
� �� 2q3f ð13Þ
and hM is the modulus of the matrix material defined in terms of the logarithmic plastic strain and true stress in uniaxialtension as
1hM¼ deP
M
drMð14Þ
The matrix material (i.e., the undamaged material with f ¼ 0) is defined by its Young’s modulus, E, Poisson’s ratio, m, andrelation between logarithmic plastic strain and true stress in uniaxial tension, eP
MðrMÞ, also considered as the relation be-tween effective plastic strain and effective stress. These are inputs to the modified Gurson Model along with the new param-eter kx and the initial value of f . As in the original model, plastic work in the matrix is equated to macroscopic plastic workaccording to
ð1� f ÞrM _ePM ¼ rijD
Pij; ð15Þ
such that increments in matrix flow stress can be computed from
_rM ¼hMrijD
Pij
ð1� f ÞrMð16Þ
The final step is to identify the stress rate for finite strain applications and to combine the elastic and plastic strain incre-ments. The stress increments, _rij, in the above development are identified with objective Jaumann increments, whose Carte-sian components coincide with true stress increments for straining in axes parallel to principal stress axes. Void damagediminishes the overall elastic moduli of the material. However, this is a small effect compared to void influence on plasticbehavior and the effect on elasticity is neglected, as usually done in this type of model. Isotropic elastic behavior is assumed.Combining elastic strain rates, De
ij, and plastic strain rates from (6) gives the total strain rate as
Dij ¼ Mijkl _rkl ð17Þ
with instantaneous compliances
Mijkl ¼1þ m
2Eðdikdjl þ dildjkÞ �
mE
dijdkl þ1h
PijPkl
508 Z. Xue et al. / Engineering Fracture Mechanics 77 (2010) 492–509
Author's personal copy
The inverse is
_rij ¼ LijklDkl ð18Þ
with instantaneous moduli
Lijkl ¼ Leijkl �
LeijmnPmnPrsL
erskl
hþ PrsLersmnPmn
where the elastic moduli are
Leijkl ¼
E1þ m
12ðdikdjl þ dildjkÞ þ
m1� 2m
dijdkl
� �
Plastic loading has been assumed in writing both (17) and (18); if the increment is elastic, only the elastic moduli andcompliances are used. The effective plastic strain rate is defined in terms of the logarithmic strain rates in the usual way as
_ePe ¼
ffiffiffiffiffiffiffiffiffiffiffiffiffiffiffiffiffiffiffi2DP
ijDPij=3
qð19Þ
The final failure process beginning with the onset of coalescence and terminated by element deletion is modeled in themanner that has been commonly adopted [13] wherein the growth of the effective void volume fraction is accelerated whenf > fc according to
f �ðf Þ ¼f ; f 6 fc
fc þ 1=q1�fcff�fc
ðf � fcÞ fc < f 6 ff
(ð20Þ
As detailed in [13], f is replaced by f � in the yield function (5) and in all the other equations except that _f in (8) remainsunchanged. The material fails when f ¼ ff .
A variety of numerical algorithms for the integration of elasto-plastic constitutive equations have been proposed in theliterature [21–23]. A class of backward Euler method has proven to lead to accurate and stable results [24] and is now widelyused. Aravas [25] established the backward Euler scheme for pressure-dependent plasticity. Within the same framework, theintegration algorithm for the present extended Gurson model has been derived. An alternative integration method recentlydeveloped in [26] employed all six stress components as independent variables to be solved simultaneously using Newton’smethod. In contrast, the algorithm was refined in this work such that it is more efficient by employing only two independentvariables, the increment of mean strain and the increment of effective strain. The algorithm was implemented into ABAQUS/Explicit [16] through its user material subroutine interface (VUMAT). Several benchmark tests described in [26] have beenperformed to verify the code.
References
[1] Gurson A. Continuum theory of ductile rupture by void nucleation and growth. Part I—Yield criteria and flow rules for porous ductile media. J EngngMater Technol 1977;99:2–15.
[2] Rousselier G. Ductile fracture models and their potential in local approach of fracture. Nucl Engng Des 1987;105:97–111.[3] Howard IC, Li ZH, Bilby BA. Ductile crack growth predictions for large center cracked panels by damage modeling using 3-D finite element analysis.
Fatigue Fract Engng Mater Struct 1994;17:959–69.[4] Xia L, Shih CF. Ductile crack growth-I a numerical study using computational cells with microstructurally-based length scales. J Mech Phys Solids
1995;43:233–59.[5] Xia L, Shih CF, Hutchinson JW. A computational approach to ductile crack growth under large scale yielding conditions. J Mech Phys Solids
1995;43(3):389–413.[6] Steglich D, Brocks W. Micromechanical modelling of damage and fracture of ductile materials. Fatigue Fract Engng Mater Struct 1998;21(10):1175–88.[7] Gullerud AS, Xiaosheng G, Dodds RH, Haj-Ali R. Simulation of ductile crack growth using computational cells: numerical aspects. Engng Fract Mech
2000;66:65–92.[8] Xue L, Wierzbicki T. Ductile fracture initiation and propagation modeling using damage plasticity theory. Engng Fract Mech 2008;75:3276–93.[9] Tvergaard V, Needleman A. Analysis of the cup-cone fracture in a round bar tensile bar. Acta Metall 1984;32:157–69.
[10] Besson J, Steglich D, Brocks W. Modeling of crack growth in round bars and plane strain specimens. Int J Solids Struct 2001;38:8259–84.[11] Bron F, Besson J. Simulation of the ductile tearing for two grades of 2024 aluminum alloy thin sheets. Engng Fract Mech 2006;73:1531–52.[12] Nahshon K, Hutchinson JW. Modification of the Gurson model for shear failure. Eur J Mech A/Solids 2008;27:1–17.[13] Tvergaard V. Material failure by void growth to coalescence. Adv Appl Mech 1990;27:83–151.[14] Bao Y, Wierzbicki T. On fracture locus in the equivalent strain and stress triaxiality space. Int J Mech Sci 2004;46:81–98.[15] Barsoum I, Faleskog J. Rupture in combined tension and shear: experiments. Int J Sol Struct 2007;44:1768–86.[16] Tvergaard V. Shear deformation of voids with contact modeled by internal pressure. Int J Mech Sci 2008;50:1459–65.[17] Nahshon K, Pontin MG, Evans AG, Hutchinson JW, Zok FW. Dynamic shear rupture of plates. J Mech Mater Struct 2007;2:2049–66.[18] Leblond J-B. Studies of the cup-cone fracture mode. Work in progress. Private communication; 2009.[19] Moes N, Dolbow J, Belytschko T. A finite element method for crack growth without remeshing. Int J Numer Meth Engng 1999;46:131–50.[20] Chu CC, Needleman A. Void nucleation in biaxially stretched sheets. J Engng Mater Technol 1980;102:249–56.[21] Crisfield MA. Non-linear finite element analysis of solids and structures, vol. 1. West Sussex (UK): Wiley; 1991.[22] Simo JC, Hughes TJR. Computational inelasticity. New York (USA): Prentice-Hall; 1998.[23] Belytschko T, Liu WK, Moran B. Nonlinear finite elements for continua and structures. West Sussex (UK): John Wiley and Sons Ltd.; 2000.[24] Ortiz M, Popov EP. Accuracy and stability of integration algorithms for elastoplastic constitutive relations. Int J Numer Meth Engng 1985;21:1561–76.[25] Aravas N. On the numerical integration of a class of pressure-dependent plasticity models. Int J Numer Meth Engng 1987;24:1395–416.[26] Nahshon K, Xue Z. A modified Gurson model and its application to punch-out experiments. Engng Fract Mech 2009;76–8:997–1009.
Z. Xue et al. / Engineering Fracture Mechanics 77 (2010) 492–509 509