engineering development board - amazon s3s3.amazonaws.com/zanran_storage/ · very large number of...
TRANSCRIPT

Final Report
Sponsored By
ENGINEERING DEVELOPMENT BOARD Ministry of Industries & Production
Government of Pakistan SEDC Building (STP) 5-A, Constitution Avenue
Islamabad Tele: (051) 9205595, 9223734 Fax: (051) 9206161
Prepared By Technology Management International (Pvt) Ltd
(TECHMA) 31/11-A, Abu Bakr Block New Garden Town, Lahore
Tele: (042) 5881460 Fax-Cum-Tel: (042) 5881718 E-Mail: [email protected]
2010

TABLE OF CONTENTS
Description Page Nos. Acknowledgement Team of Experts Executive Summary. i-vii CHAPTER 1 Scope Of The World’s Chemical Industry 1 1.1 Scope of the chemical industry. 1 1.2 Category wise breakdown of the chemical industry. 1 1.3 Research and development in the chemical industry. 4 1.4 Classification of the chemical industry development of Pakistan –
Vision 2030. 5
CHAPTER 2 Potential for the development of secondary chemical industries based on feedstocks derived from primary industries.
1
2.1 Feedstocks derived from primary industries for the potential development of secondary chemical industries.
1
• Crude oil based petroleum and petrochemical refineries. 1 • Olefin petrochemical complex. 3 • Aromatic petrochemical complex. 5
2.2 Natural gas based chemicals. 7 2.3 Alternative feedstocks for the production of commodity chemicals. 10 2.4. Feedstocks derived from metallurgical plants and polymers,
materials technology and metallurgical processes. 13
2.5 Other mineral based projects consisting of acid and alkali industries, cement and glass plants based on limestone, gypsum, rock salt, sulphur and silica.
17
2.6 Agro based feed stocks. 17 2.7 Sources of raw materials and process technologies for chemical
industry development in Pakistan. 20
2.8 Categorization of secondary chemical industries in Pakistan. 21 CHAPTER 3 The present status of the chemical industry in Pakistan. 1 3.1 General 1 3.2 The structure of Pakistan’s imports and exports. 3 3.3 The role of government in industrial development. 8 3.4 Limitations of Pakistan’s industrial policies for chemical industry
development. 12
Continued…….
Page 1 of 2

Page 2 of 2
CHAPTER 4 4.1 Modernization of the national innovation system for chemical
industry development in Pakistan. 1
• Limitations of Pakistan’s N.I.S. 2 • The scope of Engineering Development Board with additional
responsibility for technology development and proposed structure of Technology Development Board.
4 & 5
4.2 The role of the national committee in research and technology development.
5
4.2.1 The current status of R&D in Pakistan. 6 4.2.2 National committee for research and technology
development. 7
4.3 National committee for the development of software and hardware for the commercialization of technologies.
10
4.4 National committee for the development of technology policy and investment planning.
13
4.5 Human resource development. 15 4.6 Integrated plan for the development of a national innovation
system. 16
4.7 Industrial master plan. 20 CHAPTER 5 Profiles of Present Secondary Chemical Industries of Pakistan.
(Section 1) Caustic soda 1-11 (Section 2) Soda ash & sodium bicarbonate 12-19 Section -3) Petrochemicals 20-37 CHAPTER – 6
Proposal For The Future Development Of Secondary Industries In Pakistan 1-5 CHAPTER – 7
Industrial Trade Policies 7.1 Imports, tariff and custom duties. 1 7.2 Tariff escalation, description and peaks. 2 7.3 Other imports duties/taxes. 3 7.4 Competitiveness of exports from Pakistan. 4 CHAPTER 8 Conclusions and Recommendations. 1-5 Attachments Annexure “A” References 1-3

ACKNOWLEDGEMENTS
I am grateful to Mr Asad Ilahi, Chief Executive Officer of the Engineering Development Board, and his dedicated staff, Mr. M. Farooq Khan, General Manager (Policy); and Mr Yasir Qurban, Project Engineer. They gave their full support in the conception of the project for “Chemical Industry Development – Vision 2030” and provided invaluable information and data, which were essential for the successful development of the project. My thanks to my colleagues and associated consultants: Mr Muhammad Sadiq Chaudhry, Dr M. Khalid Farooq and Mr Pervaiz A. Khan. They were a source of inspiration and played an active role in discussions for the development of the strategy. Thank you to my daughter, Leila Butt, for editing this report. Dr Waheed M. Butt


EXECUTIVE SUMMARY
The global chemical industry forms the fabric of the modern world. It converts basic raw
materials into more than 70,000 different products, not only for industry, but also for all
the consumer goods that people rely on in their daily life. The modern chemical industry
is divided into four broad categories, comprising basic chemicals, life sciences, specialty
chemicals and consumer products. Its outstanding success is largely due to unceasing
scientific and technological breakthroughs and advances, which have led to the
development of new products and processes.
Chemical industry development in Pakistan has been classified into (i) the primary sector
chemical industry and (ii) the secondary sector chemical industry. Primary sector
industries are large-scale, capital intensive industries comprising refineries,
petrochemicals, natural gas, metallurgical and mineral based projects. They also provide
feedstocks for the secondary chemical industry. Secondary industries are based on
feedstocks either derived from primary sector industries, or other alternative sources of
raw materials. These are less capital intensive and are based on high, medium or less
sophisticated technologies. The secondary sector industries form the basis for the
proposed “Chemical Industry Development - Vision 2030”.
Primary sector industries which provide feedstocks for the development of secondary
sector chemical industries, as well as other alternative sources of feedstocks consist of:
(i) Petroleum and petrochemical refineries. These provide petrochemical intermediate chemicals, which form the building blocks for the production of a very large number of secondary chemicals, such as polymers, fibers, pharmaceuticals, drugs, dyes and colours, insecticides, pesticides, resins, paints, pigments, specialty chemicals, and a very large number of consumer and construction materials and products.
(ii) Natural gas based chemicals, which consist of methanol and ammonia. These can also be used for the production of a large number of secondary chemicals.
(iii) Metallurgical metals and non-metals based secondary chemicals and products.
Executive Summary Page i of vii

(iv) Alternative renewable feedstocks for the production of secondary chemicals consist of bio-mass, agricultural wastes, oils and fats, molasses and power alcohol.
(v) Unconventional natural gas.
(vi) Mineral based secondary chemical industries derived from coal, limestone, gypsum, rocksalt, silica sand and sulphur.
(vii) Vegetable and herbal plants used in the production of secondary chemicals, such as dyes, medicines, drugs, cosmetics and associated products.
The development of secondary chemical industries are divided between projects based on
sophisticated technologies, and those based on medium and less sophisticated
technologies.
Development of the chemical industry in Pakistan is lagging behind those of other
emerging markets. The various factors which have hampered the development of this
industry in Pakistan are:
(i) An underdeveloped industrial infrastructure.
(ii) Reliance on foreign engineering and construction companies for the commercialization of locally developed or imported technologies.
(iii) Imports of second-hand highly energy intensive plants based on antiquated technologies.
(iv) Reliance on the development of resource based, low technology, labour intensive products for export.
The objective of “Chemical Industry Development - Vision 2030” is for:
(i) Pakistan to create its own capability and achieve self-reliance in project design, engineering and the construction management required for the commercialization of technologies.
(ii) To develop capability in the production of medium and high technology based chemicals for export, alongside to the present industrial structure based on low technology resource based products.
(iii) To provide suitable incentives to entrepreneurs for the development of an export-oriented chemical industry.
Executive Summary Page ii of vii
The development of the chemical industry in Pakistan started in the 1950s and is based
on five year plans, with the first plan covering the 1955-60 period. Economic growth was
based on a policy of import substitution, resulting in varying rates of growth of between
3.1-6.8% over 1950-70. However, this masks a highly variable performance: the rate of
growth slowed in the early 1970s to an annual average of 4.4%, but the economy was
revitalized in the late 1970s and 1980s, before weakening again. However, in view of the
inconsistencies in the development of trade policies geared towards export-led growth,
Pakistan has failed to boost exports of its manufactured goods.
By comparison, economic growth in Southeast Asian countries from the 1960s onwards,
and in India, China and other late comers from the 1980s, was driven by their export-
oriented industrialization policies. All these countries introduced market reforms and
provided various incentives and subsidies in order to enhance their exports of
manufactured goods. In addition, these countries also developed their own technology
and engineering infrastructure by virtue of which they achieved self-sufficiency in the
utilization and commercialization of their technologies. As a result, they have achieved
strong annual average growth rates of between 8-11% over the past three decades.
Traditionally, exports from Pakistan have been dominated by goods produced with low
technology, resource based feed stocks, such as textiles, cotton, readymade garments and
leather. These comprise about 60% of total exports. The composition and share in exports
of medium and high technology based products, comprising chemicals, petrochemicals
and other manufactured products is very small and has fluctuated between 8-10% of total
exports from Pakistan. Conversely, Pakistan has a very high dependence of imports of
high value-added goods, which are more expensive. Chemicals, drugs, medicines and
dyes, as well as capital plant, equipment and machinery, together account for about 40%
of total imports with an estimated value of US$16.3 billion for the year 2007/08. As a
result, the trade balance has been continually increasing and stood at US$20.9 billion in
2007/08.
Present trends in Pakistan’s exports of lower technology goods indicate that it is facing
increasing competition from India, China and Bangladesh. In addition, global demand for
Executive Summary Page iii of vii

these products is declining, and the need for higher technology products is rapidly
growing. This situation calls for a concerted effort towards the development of a
chemical industry based on medium and highly sophisticated technologies.
Pakistan has only developed its basic industries, consisting of refineries, fertilizers,
cement, sugar, polyester fibers and some other petrochemical based polymer industries,
to fulfill local demand. These industries have been predominantly developed by foreign
engineering corporations, which were awarded contracts on turnkey basis. However,
Pakistan has failed to assimilate these imported technologies, or use them either for the
replication of these plants or in the development of associated chemical projects. This
dependence on the production and exports of low-valued added goods has held back
Pakistan’s economic performance and revenue-earning potential. By comparison, South
and Southeast Asian countries put special emphasis on the development of high
technology goods for export. They achieved this through trade liberalization, but their
governments’ also introduced industrial policies that focused on the maintenance of
macroeconomic stability, the provision of industrial and technology infrastructure,
improvements to market institutions and high levels of public investment. These
countries established public organizations which supported production activities, but they
also relied on private firms for the success of their industrial policies.
For example, China, which retains its socialist form of governance, introduced market
reforms and advocated the so-called Open Door Policy. It also created two large public
sector corporations: China National Petroleum Corporation (CNPC), for the production
and exploration of oil and gas; and China Petrochemical Corporation (SINOPEC) for the
development of its petrochemical industry. China also created Petro-China as a Holding
Company, which offered its shares on international markets. The value of this company
was estimated at US$100 billion in 1999, but has since risen to US$1.1 trillion in 2008.
The salient features of China’s public private partnerships (PPPs) is that the public sector
is the major shareholder in the development of its capital intensive industries, whereas the
private sector is the majority equity partner in the development of secondary projects.
Executive Summary Page iv of vii

Rapid industrialization in Japan and South Korea was driven by multinational
conglomerates—Keiretsus and Chaebols—which created vertical and horizontal
diversification of their businesses, with the active support of their respective
governments. This pattern, in many cases has been followed by newly industrialized
countries (NICs).
Pakistan’s industrial infrastructure is limited and it relies primarily on foreign design and
engineering companies for the commercialization of local and imported technologies.
Therefore, there is immediate need for enhancing and modernizing its national innovation
system (NIS). This is the framework by which a country brings about technological
change, and consists of research and development (R&D) institutions, the infrastructure
for commercialization of technologies, the structure of educational and technical
institutions, regulatory agencies, information networks, financial institutions and
marketing.
Process science and engineering technology (PS&ET) is an important component of a
NIS and is the foundation for the development of the chemical industry. It integrates
various elements of the processes of commercialization, from R&D to process design,
project engineering, construction, operations and marketing management. Taken together,
these provide the basis for manufacturing excellence and sustainable competitive
advantage. In order to meet the goals of “Chemical Industry Development - Vision
2030”, it is essential for Pakistan to enhance its PS&ET capability.
We propose that the scope of the Engineering Development Board should be enhanced
and given the additional responsibility to modernize and strengthen the NIS as the basis
for technology development. In order to achieve this objective, three committees should
be established under the direction of a Technology Development Board (which will be an
enhanced Engineering Development Board):
(i) A National Committee for research and technology development,
(ii) A National Committee for the development of software and hardware for the commercialization of technologies.
Executive Summary Page v of vii

(iii) A National Committee for the development of technology policy and investment planning.
The role of the National Committee for research and technology development will be to
foster linkages between universities, R&D institutions and the chemical industry. Various
tasks to be undertaken by this committee will include the formation of sub-committees
for different sectors of the chemical industry; identification of problems of each sector;
selection of R&D teams from universities, industry and R&D institutes for
multidisciplinary research; continual appraisal and economic evaluation of laboratory and
pilot scale work; and selection and adoption of technologies for commercialization.
The processes of commercialization of local or imported technologies depends on the
application of science, engineering, design, instrumentation and control, safety and
environment, and many other aspects of capital plant manufacturing, construction,
operations and marketing management. In order to develop local capability in various
areas of project management, we propose the formation of a National Committee for the
development of software and hardware as PPP projects. The functions of this Committee
will be to support the development of existing or new engineering companies for various
tasks. These include the identification of new projects; the preparation of investment
studies on international criteria; the formation of financial packages; the development of
software and hardware and its application in design and engineering; the development of
engineering specifications for capital plant manufacturing; construction; management;
and many other functions such as revamping and modernization of old plants, and
facilities for reverse engineering.
The successful utilization of various components of technology will depend on the ability
of the government to foster PPPs with the involvement of industrial and venture capital
institutions and a vibrant entrepreneurial class.
We suggest that a National Committee for the development of technology policy and
investment Planning should be established for:
(i) The provision of suitable incentives to potential investors, in order to accelerate the processes of chemical industry development and the revision of industrial policies on continual basis.
Executive Summary Page vi of vii

Executive Summary Page vii of vii
(ii) The development of investment policies and infrastructure for capital formation.
In order to facilitate the formation of investment, we recommend that a Holding
Company should be established with the participation of the financial sector, international
donors, friends of Pakistan, overseas Pakistanis and other investors, who would be
invited to subscribe as share holders in this company.
Profiles of various sectors of existing chemical industries in Pakistan have been prepared.
These consist of World’s present and projected production, World trade, local production
in Pakistan, local market size, local demand, imports, future prospects for each sector of
industry, SWOT analysis with special references to weaknesses, threats and opportunities
as well as present tariff structure on Pakistan.
Proposals for the future developments of Secondary Industries in Pakistan have been
prepared and suggestions for the development of secondary chemical projects based on
locally available as well as imported materials have been made. The proposed industries
have been divided into various sectors consisting of minerals, metallurgical, agro-based
alternate sources of energy, oils and fats and petrochemicals based projects. A number of
potential projects in each sector have been proposed and it is suggested that EDB initiate
the development of feasibility studies on each of these projects for their future
implementation.
An integrated plan for development of NIS has been proposed and various other
requirements consisting of the application of computational technologies, human resource
requirements, and the development of coherent industrial policy are also considered
necessary. An Industrial Master Plan must be prepared for the implementation of various
elements of the NIS, which should identify Pakistan’s capabilities and limitations in
various priority sub-sectors of the chemical industry. It should develop policy measures
and provide fiscal incentives in order to promote investment in various sectors of
chemical industry. The development of a NIS on international standards will provide tens
of thousands of job to Pakistan’s highly qualified manpower.

___________________________________________________________________________ Chapter – 1 Page 1 of 1
CHAPTER 1
1. SCOPE OF THE WORLD’S CHEMICAL INDUSTRY
1.1 Scope of the Chemical Industry
The chemical industry comprises the companies that produce industrial chemicals. It is
central to the modern world economy, as it converts raw materials into more than 70,000
different products.
The chemical industry is more diverse than virtually any other industry in the world. Its
products are omnipresent. Chemicals are the building blocks for products that meet our
most fundamental needs for food, shelter and health, as well as products vital to the high
technology world of computing, telecommunications and biotechnology. They are used to
make a wide variety of consumer goods, and are also inputs in agriculture,
manufacturing, construction and services industries. In particular, chemicals are a
keystone of world manufacturing, as they are an integral component of all manufacturing
sub-sectors, including pharmaceuticals, automobiles, textiles, furniture, paint, paper,
electronics, construction and appliances. It is difficult to fully enumerate the uses of
chemical products and processes, but the following nomenclature gives some indication
of the level of diversity:
Polymers and plastics--especially polyethylene, polypropylene, polyvinyl chloride,
polyethylene terephthalate, polystyrene and polycarbonate--comprise about 80% of the
chemical industry’s output worldwide. The chemical industry itself consumes 26% of its
own output. Major industrial products include rubber and plastics, textiles, apparel,
polymers, pulp and paper, and primary metals. Chemicals are nearly a US$3 trillion
global enterprise, with chemical companies in the EU, US and Japan being the world’s
largest producers.
1.2 Category Breakdown of the Chemical Industry
The marketing of the chemical business can be divided into a few broad categories,
including basic chemicals (about 35-37% of US dollar output), life sciences (30%),
specialty chemicals (20-25%) and consumer products (about 10%).

___________________________________________________________________________ Chapter – 1 Page 2 of 2
BASIC CHEMICALS or “commodity chemicals” are a broad chemical category,
which include polymers, bulk petrochemicals and intermediates, other derivatives
and basic industrials, inorganic chemicals and fertilizers. Polymers--the largest
revenue segment, at about 33% of the basic chemicals US dollar value--include
all categories of plastics and man-made fibers. The major markets for plastics are
packaging, followed by home construction, containers, appliances, pipe,
transportation, toys and games. The largest volume polymer product, polyethylene
(PE), is used mainly in packaging films and other products, such as milk bottles,
containers and pipes. Polyvinyl chloride (PVC), another large volume product, is
principally used to make pipes for construction markets, as well as siding and, to a
much smaller extent, transport and packaging materials. Polypropylene (PP),
which is similar in volume to PVC, is used in markets ranging from packaging,
appliances and containers, to clothing and carpeting. Polystyrene (PS), another
large-volume plastic, is used principally for appliances and packaging, as well as
toys and recreation. The leading man-made fibers include polyester, nylon,
polypropylene and acrylics, with applications including apparel, home
furnishings, and other industrial and consumer use. The principal raw materials
for polymers are bulk petrochemicals.
Chemicals in the bulk petrochemicals and intermediates category are primarily
made from liquefied petroleum gas (LPG), natural gas and naphtha. Their sales
volume is close to 30% of total basic chemicals. Typical large-volume products
include ethylene, propylene, benzene, toluene, xylenes, methanol, vinyl chloride
monomer (VCM), styrene, butadiene and ethylene oxide. These chemicals are the
starting materials for most polymers and other organic chemicals, as well as much
of the specialty chemicals category.
Other derivatives and basic industrials include synthetic rubber, surfactants, dyes
and pigments, resins, carbon black, explosives and rubber products. They
contribute about 20% to basic chemicals’ external sales.

___________________________________________________________________________ Chapter – 1 Page 3 of 3
Inorganic chemicals (about 12% of revenue output) are the oldest of the chemical
categories. Products include salt, chlorine, caustic soda, soda ash, acids (such as
nitric, phosphoric and sulfuric), titanium dioxide and hydrogen peroxide.
Fertilizers are the smallest category (about 6%) and include phosphates, ammonia,
urea and potash chemicals.
LIFE SCIENCES (about 30% of the dollar output of the chemical business),
include differentiated chemical and biological substances, pharmaceuticals,
diagnostics, animal health products, vitamins and crop protection chemicals.
While much smaller in volume than other chemical sectors, their products tend to
have very high prices--over US$10 per pound--with research and development
(R&D) spending at 15-25% of sales. Life science products are usually produced
to very high specifications and are closely scrutinized by government agencies
such as the US Food and Drug Administration (FDA). Crop protection chemicals,
about 10% of this category, include herbicides, insecticides and fungicides.
SPECIALTY CHEMICALS are a category of relatively high value-added,
rapidly growing, chemicals with diverse end-product markets. They are generally
characterized by their innovative aspects--products are sold for what they can do
rather than for what chemicals they contain. Products include electronic
chemicals, industrial gases, adhesives and sealants, as well as coatings, industrial
and institutional cleaning chemicals, and catalysts. Coatings comprise about 15%
of specialty chemicals sales, with other products ranging from 10-13%.
Specialty Chemicals are sometimes referred to as “fine chemicals”.
CONSUMER PRODUCTS include direct product sales of chemicals such as
soaps, detergents, and cosmetics.
The chemical industry has shown rapid growth for more than fifty years. The fastest
growing areas have been in the manufacture of synthetic organic polymers used as
plastics, fibres and elastomers. Historically and currently the chemical industry has been
concentrated in three areas of the world: Western Europe, North America and Japan (the
so-called Triad). The EU remains the largest producer, followed by the US and Japan.

___________________________________________________________________________ Chapter – 1 Page 4 of 4
The traditional dominance of chemical production by the Triad is now being challenged
by changes in feedstock availability and price, labour and energy costs, differential rates
of economic growth and environmental pressures. Instrumental in the changing structure
of the global chemical industry has been recent rapid economic growth in China, India,
Korea, the Middle East, Southeast Asia, Nigeria, Trinidad, Thailand, Brazil, Venezuela,
and Indonesia.
1.3 Research and Development in the Chemical Industry
The outstanding success of the global chemical industry is largely due to scientific and
technological breakthroughs and advances, facilitating the development of new products
and processes. The US chemical industry now spends about US$17.6 billion annually on
R&D. In fact, according to study by the Institute for the Future (IFTF), the chemical
industry is one of the eight most research-intensive industries. The scientific and
technical research of these industries makes our lives safer, longer, easier and more
productive. When one reviews the contributions of the chemical industry to our
civilization, it becomes clear that rather than any single individual invention or
technological breakthrough, it has been the industry’s overall commitment to R&D that
has been its most significant legacy.
Investment in R&D is the single greatest driver of productivity increases, accounting for
half or more of all increases in output per person. R&D is the source of new products that
improve our quality of life, and new processes that enable firms to reduce costs and
increase competitiveness. As we look to the future, it is apparent that continued
investment in technology is necessary for industry to meet the needs and expectations of
future generations.
Reaching the goals of “Chemical Industry Development - Vision 2030” will require
Pakistan to build its technology infrastructure, consisting of investment in technology
development, computer aided design, engineering, plant and equipment manufacturing,
construction and marketing management. These areas of development have been grossly
neglected in the past and are the major reasons for the present plight of the chemical
industry in the country.

___________________________________________________________________________ Chapter – 1 Page 5 of 5
The industrial sector drives the global economy, collectively transacting almost US$3
trillion per annum. An industry is a collection of companies that perform similar
functions. Industry can be used to refer to all company groups, or as being a set of entities
that utilize productive forces to convert a simple input into a processed final product. The
size of various industries varies by country, level of development and external demand.
1.4 Classification of the Chemical Industry Development of Pakistan – Vision 2030
For the purpose of the “Chemical Industry Development – Vision 2030”, this industry is divided into:
• Primary sector industries and
• Secondary sector industries.
Primary Sector Industries The Primary sector industry generally involves the conversion of natural resources into
primary products. These are large, highly sophisticated, technology-based, capital
intensive projects consisting of:
(i) Petroleum refining and petrochemical industries for the production of petrochemical intermediates, olefins (ethylene, propylene, butylenes) and BTX (benzene, toluene, xylene), all of which form the basis for the development of monomers, polymers and plastic industries.
(ii) Natural gas based projects for the production of ammonia, methanol, fertilizers and associated products.
(iii) Mineral based industries consisting of cement, limestone, gypsum, sand and salt. (iv) Smelting and refining of ferrous and non-ferrous metals. They also produce raw materials for Secondary industries.
(v) Agriculture and Farming Industries
These constitute naturally occurring, renewable sources of raw materials, such as
cotton, oils and fats, sugar, agricultural wastes (bio-mass) and raw materials for a large number of downstream industries.

___________________________________________________________________________ Chapter – 1 Page 6 of 6
Secondary Sector Industries
The principal objective of Secondary sector industries is to provide the connective link
between products and materials produced by Primary industries, which are of practical
use to the national economy. This implies that the Secondary industries rely on the
Primary industries for feedstocks and raw materials for use in manufacturing, processing,
blending, fabricating plants for petrochemical intermediates, polymers, plastics, steel,
non-ferrous metals, minerals, agricultural and miscellaneous products. These industries
use medium- to high-sophisticated technology, and range from light to medium
categories.
THE SECONDARY SECTOR INDUSTRIES WILL FORM THE BASIS FOR
“CHEMICAL INDUSTRY DEVELOPMENT IN PAKISTAN - VISION 2030”.

________________________________________________________________________________________ Chapter – 2 Page 1 of 23
CHAPTER 2
2. POTENTIAL FOR THE DEVELOPMENT OF SECONDARY CHEMICAL INDUSTRIES BASED ON FEEDSTOCKS DERIVED FROM PRIMARY
INDUSTRIES
2.1 Feedstocks Derived from Primary Industries for the Potential Development of Secondary Chemical Industries
Primary chemical industries, which are manufactured through the utilization of
various feedstocks, consist of large-scale, highly capital intensive plants, based on
sophisticated technologies. These projects also provide raw materials for the
development of secondary chemical industries and consist of:
• Crude oil based refineries and petrochemical complexes.
• Natural gas based chemicals and fertilizer projects.
• Alternative renewable feedstocks for the production of commodity chemicals
• Metallurgical plants for the production of iron, steel, and non-ferrous metals.
• Other mineral projects consisting of acid and alkali industries, and cement and glass plants based on limestone, gypsum, rock salt, sulphur and silica.
• Projects based on agro feedstocks.
Crude Oil Based Petroleum and Petrochemical Refineries
Petroleum refineries are designed to produce a limited number of products, which
are primarily used as a source of energy in road, rail and air transport; power
plants; steam generation; and heating media in the chemical industry. They do not
produce high value-added chemicals unless they are integrated with
petrochemical plants--generally designated as Petrochemical Refineries--which
are highly energy efficient and produce diversified feedstocks and raw materials
for a large number of secondary chemicals.
A petrochemical is any chemical compound obtained from petroleum or natural
gas, or derived from petroleum or natural gas hydrocarbons and utilized in the
production of a large variety of secondary chemicals and products. The definition
has been broadened to include the whole range of aliphatic, aromatic and organic

________________________________________________________________________________________ Chapter – 2 Page 2 of 23
chemicals, as well as carbon black and such inorganic materials as sulphur and
ammonia. In many instances, a specific chemical included among the
petrochemicals may also be obtained from other sources, such as coal, coke or
bio-mass.
Petrochemical based secondary chemicals include such items as plastics, soaps
and detergents, solvents, drugs, fertilizers, pesticides, explosives, synthetic fibers
and rubbers, paints, epoxy resins, and flooring and insulating materials.
Petrochemicals are found in products as diverse as aspirin, boats, automobiles,
aircraft, polyester and acrylic fibers, recording discs and tapes.
Natural gas and crude oil are referred to collectively as petroleum. Crude oil
consists of the heavier constituents that naturally occur in liquid form. Natural gas
refers to the lighter constituents of petroleum that naturally occur in gaseous form,
either on its own as free gas, or in association with crude oil.
The production of petrochemical based intermediate chemicals form the
feedstocks for secondary industries as part of a two stage process. In the first
stage, crude oil is distilled and fractionated to produce a number of products
consisting of gasoline, naphthas, and light and heavy gas oils, which are used as a
source of energy for road and air transport, and power generation. Simultaneously
the off gases, light and heavy naphthas, and gas oils are predominantly used as the
starting materials for petrochemical projects. This is illustrated in Fig 2.1.
In the second stage the off gases and naphthas are further processed into two
separate operations to produce Petrochemical intermediate chemicals or
monomers as follows:

Crude OilTo
Petroleum Refinery
AtmosphericDistillation
GasolineAnd
Motor SpiritLight and
Heavy Gas Oil
Light andHeavy
Naphtha
Methane &Off Gases Residue
PetrochemicalFeedstock
Off Gases/Naphtha/Gas Oil
Aromatics Olefins
Catalyst Cracking Steam Cracking
Petrochemical Feedstocks
Fig 2.1
Olefin Petrochemical Complex
Refinery off gases, naphthas or gas oils are reformed at high temperatures in the
presence of steam to produce monomers (ethylene, propylene and butylenes).
These are gases at ordinary temperatures and pressures and can only be
transported at high pressures and low temperatures as liquids under refrigerated
condition. These are preferably processed further at site to produce secondary
petrochemical products or polymerized into polymers, such as polyethylene,
polyvinylchloride, polystyrene, ethylene glycol and many other secondary
chemicals as illustrated in Fig 2.2 and 2.3.
________________________________________________________________________________________ Chapter – 2 Page 3 of 23

STEAM CRACKING OFSTEAM CRACKING OFNAPHTHA / GAS OILNAPHTHA / GAS OIL
NAPHTHA /ASSOCIATED GAS /
GAS OIL
STEAM
REACTORSteam to Feed ratio 0.25 to 0.9Temperatures820 to 840oC
Ethylene
Propylene
Butylenes
Fig 2.2
OLEFINS AND PETROCHEMICAL INTERMEDIATES BASED SECONDARY CHEMICAL INDUSTRIES
ASSOCIATED GASESOR
NAPHTHA
ETHYLENEPROPYLENEBUTYLENES
POLYETHYLENES LDPE,HDPEPOLYPROPYLENEPOLY VINYL CHLORIDEPOLYSTYRENESBRETHYLENE GLYCOLPOLY VINYL ACETATE
PLASTICS FILMSCONTAINERSPIPES,CABLES, BAGSSYNTHETIC RUBBER & LEATHER PRODUCTSTYRESTOYSELECTRICAL EQUIPMENTRADIO, TV, AIR CONDITIONERS, REFRIGERATORSFURNITURE, TABLEWARE
BA
CKW
ARD
INTE
GR
ATI
ON
FOR
WA
RD
CR
EA
TIO
N
STAGE I
THERMAL CRACKING OF NAPHTHA FOR THE PRODUCTION OF
PRIMARY CHEMICALS
(HIGHLY SOPHISTICATED, CAPITAL INTENSIVE PROCESS)
STAGE II
POLYMERIZATION OF PRIMARY CHEMICALS FOR THE PRODUCTION OF SECONDARY CHEMICALS
AND POLYMERS.
(MEDIUM TECHNOLOGY BASED PROCESSES).
STAGE III
FABRICATION OF SECONDARY CHEMICALS FOR THE PRODUCTION
OF CONSUMER PRODUCTS.
(LOW/MEDIUM TECHNOLOGY BASED PRODUCTS)
Fig 2.3
________________________________________________________________________________________ Chapter – 2 Page 4 of 23
NaphthaSteam Cracker
(Olefins)
Propylene& Derivates
Butadiene& Derivatives
Ethylene& Derivatives
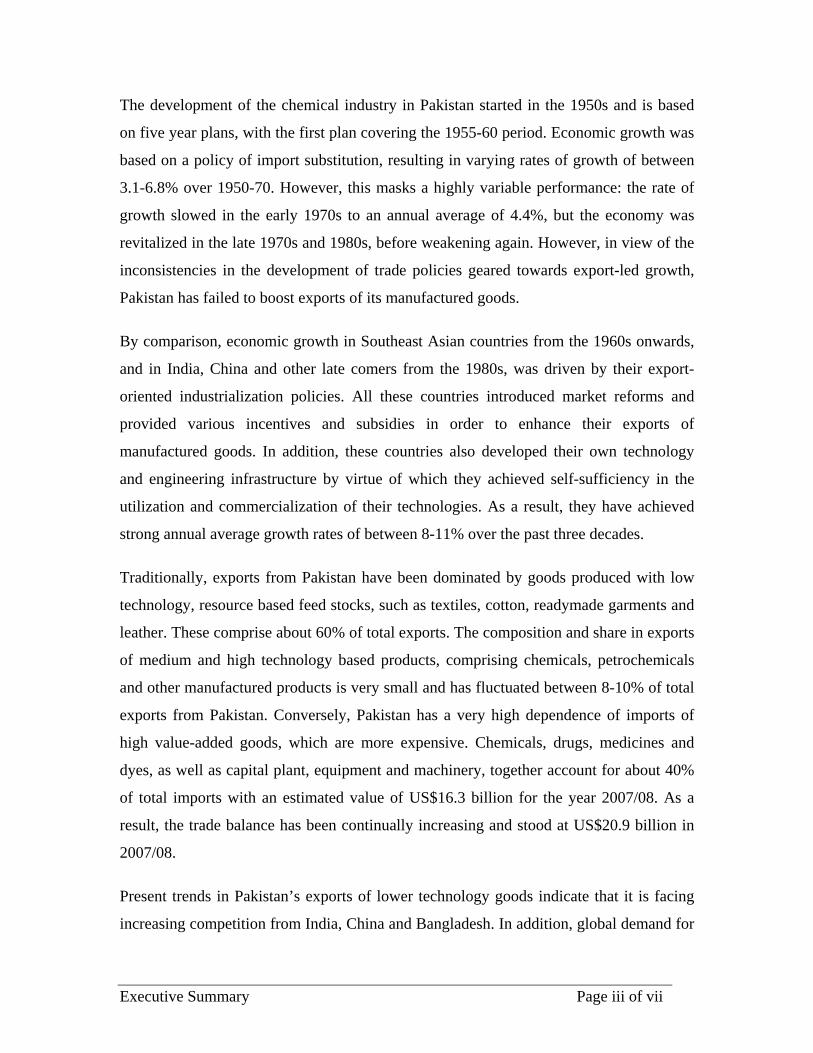
Other Olefins Based SecondaryChemicals
EthyleneEDCEthylene Glycol Ethylene OxideHDPELDPELLDPEEPDMEthanolAlpha OlefinsVinyl AcetateEthyl Chloride / Ethyl Benzene
PropyleneAcrylonitrileCumenePolypropyleneAcrylic AcidButanol2-Ethyl HexanolIso-PropanolNoneneDodecenePropylene OxideAcetoneAcrylic Fiber
ButadieneABSAdiponitrile /HMDANitrile RubberPoly-ButadienePoly chloropreneSB LatexSB Rubber
Fig- 2.3(a)
Aromatic Petrochemical Complex
Naphtha and gas oil is also catalytically reformed at high temperatures in the
presence of catalysts to yield aromatic intermediate chemicals, such as benzene,
toluene and xylenes (Fig 2.4). These are liquids at ordinary temperatures and
pressures and can be easily transported to desired locations where they are used as
raw materials in the production of a variety of secondary chemical products as
shown in Fig. 2.5.
________________________________________________________________________________________ Chapter – 2 Page 5 of 23

CATALYTIC REFORMING OF NAPHTHACATALYTIC REFORMING OF NAPHTHA(AROMATIZATION REACTION)(AROMATIZATION REACTION)
NAPHTHA /ASSOCIATED GAS /
GAS OIL
STEAM
CATALYTICREACTOR
Benzene
Toluene
Xylenes
Fig-2.4
`
Naphtha CatalyticReformer (Aromatics)
Xylenes &Derivates
Toluene &Derivatives
Benzene & Derivatives
Aromatics Based Secondary Chemicals
Benzene ) Cumene )Phenol )Cyclo Hexane )Ethyl Benzene )Adiplc Acid )Alkyl Benzene )Aniline )Alkyl Phenol ) Chloro Benzene )Maleic Anhydride )Nylon Fiber/Resin )
OrthoxyleneParaxyleneMetaxyleneDMTTPABottle ResinPolyester FiberFiber ChipFilm Resin Phthalic AnhydridePET
BenzeneTDICaprolactamBenzoic AcidTNT
Production of Primary/Inter-mediate Chemicals (Highly Sophisticated Capital Intensive)
Production of Secondary Chemicals Medium / High Technology Chemicals and Products
Fig 2.5
________________________________________________________________________________________ Chapter – 2 Page 6 of 23
________________________________________________________________________________________ Chapter – 2 Page 7 of 23
2.2 Natural Gas Based Chemicals
Natural gas is a very valuable resource, not only for use as energy, but also for the
production of chemicals. It has been used commercially as a fuel for hundreds of
years. The production, processing and distribution of natural gas has become an
important segment of the world economy and is a major factor in the production
of chemicals in global markets.
The composition of natural gas depends on its source. It predominantly consists of
methane, but in many cases contains higher hydrocarbons such as ethane and
propane.
Natural gas processing plants are designed to produce certain valuable products
over and above those needed to make the gas marketable. Plants are also designed
to recover elemental sulphur which is the starting raw material for the production
of many secondary chemicals.
Natural gas has created multifarious opportunities and challenges as it is now
utilized in the production of fertilizers and petrochemicals, in addition to its
earlier use as a source of energy. This is illustrated in Fig 2.6.

Household Gas
Fig -2. 6
________________________________________________________________________________________ Chapter – 2 Page 8 of 23

FIG-2.7
________________________________________________________________________________________ Chapter – 2 Page 9 of 23

________________________________________________________________________________________ Chapter – 2 Page 10 of 23
2.3 Alternative Feedstocks for the Production of Commodity Chemicals
The uncertainties about the peaking of available reserves of fossil fuels, and rising
prices of petroleum and natural gas, have spurred the chemical industry to
examine alternative feedstocks for the production of commodity chemicals. Over
the last two decades alternatives to conventional petroleum and natural gas
feedstocks have been developed. These feedstocks include coal based gasification
and liquefaction processes; and renewable resources such as bio-mass, stranded
natural gas from unconventional reserves, heavy oil from Tar sands or oil shale.
These sources of alternative feedstocks are in the process of development for
highest volume production of commodity chemicals in Europe and the US. The
technology for their utilization is in the process of development, in order to make
these processes more efficient and economically compatible with petroleum based
technologies. The status of various available feedstocks and the technological
development for their exploitation for the production of secondary chemicals is as
follows:
Coal
Substantial world coal reserves make it an attractive alternative to natural gas and
petroleum. The technologies for large scale processing of coal are at present
available in South Africa and China. However, a major concern about the
utilization of these technologies is the variability in feedstock composition and the
presence of impurities which poison the catalysts used in the processing of coal.
Coal Gasification
Commodity chemicals can be produced through the gasification of coal. Because
of the large domestic reserves of coal in Pakistan, this feedstock option needs to
be exploited. Coal gasification for application, including the production of
chemical feedstocks, is already widely practiced worldwide. These plants
generate feedstocks for chemical production, closely followed by the Fischer
Tropsch process for the production of organic chemicals.

________________________________________________________________________________________ Chapter – 2 Page 11 of 23
The gasification process starts with the production of synthesis gas in a gasifier,
followed by the production of a mixture of carbon oxides and hydrogen.
Ammonia, methanol, alcohols and aldehydes are produced by Oxo Synthesis. The
Fisher Tropsch process is used to produce a variety of secondary chemicals.
Different coal types (lignite, bituminous, sub-bituminous) affect the efficiencies
and economies of the gasification process, since gasification efficiencies are
lower for sub-bituminous coals due to higher moisture and ash content. However,
since essentially any organic material can be gasified, existing gasifier designs
can be adopted to use different types of coal as gasifier feed.
Coal Liquefaction
Coal can also be liquefied directly, without going through a Syngas step. This
process is called the “Coal to Liquid” or CTL process and is well proven.
Liquefaction uses liquid distillation and hydrogenation, where hydrogen is added
to coal and water slurry. The slurry increases the Hydrogen/Carbon (H/C) ratio to
a crude oil level and removes impurities such as sulphur.
Coal Liquefaction technology is of particular interest for the utilization of Thar
Coal, which has a high moisture content. A full scale production facility is being
built in China for the direct liquefaction of coal into transportation fuels to
produce 50,000 bbl/day of fuel oil. A similar project could be developed for Thar
Coal with the participation of Chinese Process Licensors.
Bio-Refinery
A major thrust towards the development of renewable feedstocks as a resource for
energy and secondary chemicals is by a process called bio-refining.
Bio-refining feedstocks consist of crops residues; waste plants or animal material
and recycled fibers; municipal sewage sludge; agricultural and forest residues;
household waste; agro-feed effluents; and residues of paper and wood working
industry. These plants absorb solar energy from the sun through photosynthesis,
and the energy stored within it is recovered by bio-refining processes.

________________________________________________________________________________________ Chapter – 2 Page 12 of 23
The bio-refining concept generally involves feeding bio-feedstocks into steam or
catalyst crackers to produce chemicals. Some technologies are in the process of
development for the processing of carbohydrates, oils, lignin and fuels.
In addition to their utilization for energy production, some bio based chemicals
that have potential for large scale manufacture include carboxylic acids and
glycols. Other areas of development include fermentation of sugars,
decomposition of cellulose, high temperature pyrolysis, and bio-refining of wood
and waste materials. However widespread use of feedstocks will require sustained
research and development(R&D) in a variety of fields such as plant science,
microbiology, genomics and catalysis. In view of the impurities, variability of
feedstock composition, distributed supply, scalability and pathways for the
breakdown of cellulose, the development of process technology will have to be
undertaken and / or adapted to local conditions by each country, in order to
exploit the utilization of bio-mass feedstocks for economic advantage.
Unconventional Natural Gas
Methane from anaerobic fermentation can be generated from animal manure and
sewage treatment, as well as from landfills. The potential for anaerobic
fermentation as a source for useable methane, rather than a source of pollution,
will require development work leading to improvements in process control,
operating efficiencies and rate of digestion, targeting small scale technologies.
Renewable energy sources are indigenous and can, therefore, contribute to
reducing dependence on energy imports, such as crude oil, resulting in increasing
security of supply as well as resources for the production of commodity
chemicals. Developments in renewable energy resources can actively contribute
to job creation, predominantly in small- and medium-sized industries which are so
central to economic performance. The deployment of renewable resources can be
a key feature in regional development, with the aim of achieving greater social
and economic cohesion, largely for environmental reasons.

________________________________________________________________________________________ Chapter – 2 Page 13 of 23
2.4. Feedstocks Derived from Metallurgical Plants and Polymers, Materials Technology and Metallurgical Processes
Materials technology is one of the many areas targeted by the chemical industry.
Materials play a critical role in the economic development and growth of
chemical process industries. New materials technology is an essential part of the
industry’s strategy for achieving its vision. Materials contribute a large amount to
industry revenue, and represent a high growth potential for industry.
Ferrous and non-ferrous metallurgical processes consisting of iron, steel, copper,
aluminium, magnesium and associated alloys have been used traditionally as
feedstocks for the development of secondary chemical industries. Tremendous
advances in the twentieth century in the development of new synthetic materials
have also fueled the growth of the chemical industry. Replacement of traditional
materials with synthetic polymers and composite materials has resulted in
products with lower weight, better energy efficiency, higher performance and
durability, and increased design and manufacturing flexibility.
Metallurgical Industry
The traditional iron, steel and non-ferrous metallurgical industries produce
valuable primary products which are important starting materials for the
production of secondary chemical products. They are used by almost every
manufacturing industry for the fabrication of capital plants and equipment; the
manufacture of automobiles, railways, agricultural and construction equipment;
and components and spare parts for operating plants in the chemical and allied
industries.
The iron and steel industry is classified into three important primary products
according to the order of processing from iron ore to the finished products. The
iron ore is calcined and mixed with limestone and coke and introduced into a
Blast furnace. The preheated air is fed to the bottom of the furnace. The ore is
reduced to iron to produce Pig iron.
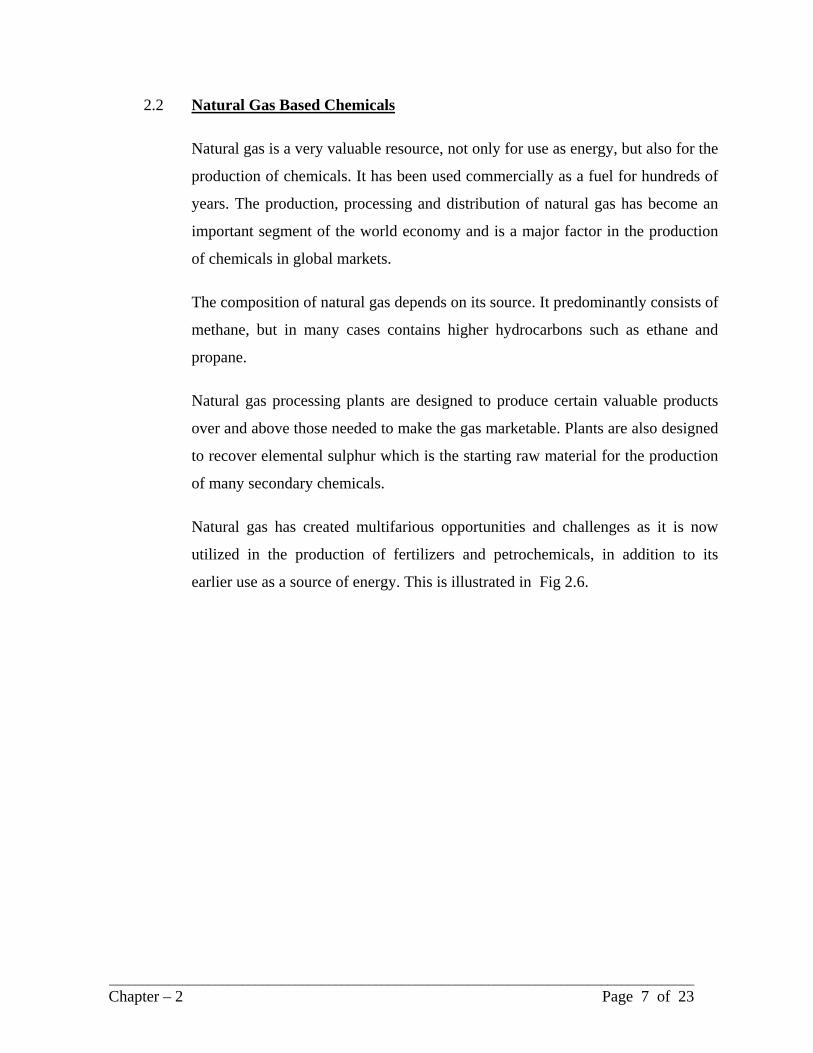
Pig iron is refined by different processes to produce iron castings or billets, rolled
wrought iron and rolled/forged steel by three different processes as illustrated in
Fig 2.8.
Fig-2.8
The primary products of the iron and steel industry, which consist of iron
castings, rolled wrought iron, and rolled and forged steel, are the feedstock for a
very large number of downstream secondary industries.
________________________________________________________________________________________ Chapter – 2 Page 14 of 23

________________________________________________________________________________________ Chapter – 2 Page 15 of 23
Non-Ferrous Metals
Non-ferrous metals are produced through two basic operations. In the first
operation, the ores are subjected to metallurgical processes to produce basic
metals consisting of large blocs or bars. In the second operation, the metal is
smelted and refined. The secondary smelting and refining of nonferrous metals
lead to the production of aluminium, copper, lead, nickel, silver, gold, tin and
zinc. These metals are used in wide variety of secondary chemical manufacturing
industries, such as ammunition, beverage cans, coins, automobiles and household
appliances.
Copper possesses superior electrical conductivity, and is a strong, durable metal
used in a variety of structural applications, as well as for power, lighting and
communication transmissions. Domestically, the major markets for copper are
construction, electronics, and industrial machinery and equipment.
Aluminium, the most widely used nonferrous metal, possesses several positive
attributes, such as a light weight, corrosion resistance, and high electrical and
thermal conductivity, which makes the metal suitable for a variety of applications.
Container and packaging manufacturers use aluminium, while other major end-
use products include the transportation sector, the building and construction
sector, and the electrical sector.
Lead is primarily used for the manufacture of storage batteries, which in turn are
incorporated into automobile ignition starters, un-interruptible power supplies for
computer systems, and standby power supplies for emergency lighting systems
and telephones. Other market sectors that purchase lead include paint and glass
manufacturers, and building products manufacturers.
Zinc is primarily used to galvanize products found in the automobile, steel and
construction industries, but a greater percentage of secondary zinc is used to
produce brass and bronze, as well as assorted chemicals. Additional applications
include the blending of zinc-based die-cast and brass alloys.

________________________________________________________________________________________ Chapter – 2 Page 16 of 23
Composite Materials
Over the past few years, advances in the production of composite materials,
including mixtures of polymers, fibers, metals and ceramics, have extended the
range, performance and applications of these materials. These are made up of
individual materials referred to as constituent materials. There are two categories
of constituent materials designated as matrix and reinforcement.
The matrix surrounds and supports the reinforcement materials by maintaining
their relative positions. The reinforcements impart their special mechanical and
physical properties to enhance the matrix properties. A synergism produces
material properties unavailable from the individual constituent materials. A wide
variety of matrix and strengthening materials allows the designer of the product or
structure to choose any optimum combination.
Most commercially produced composites use a polymer matrix material often
called a resin solution. There are many different polymers available depending
upon the starting ingredients. The most common are known as polyesters, vinyl
ester, epoxy, phenol, poly amides, amongst others. The reinforcement materials
are often fibers and fiber glass, but also commonly ground materials. The average
composition in a product contains 60% resin and 40% fiber.
Various process technologies consisting of vacuum moulding, pressure moulding,
autoclave moulding and resin transfer moulding are employed in order to give the
required properties and strength to the relevant final product.
Composite materials have gained popularity in high performance products that
need to be lightweight, yet strong enough to take harsh loading conditions.
Examples of these include aerospace components, boat and scull hulls, and car
bodies. The new Boeing 787 aircraft, including its wings and fuselage, is
composed largely of composite materials.
________________________________________________________________________________________ Chapter – 2 Page 17 of 23
2.5 Other Mineral Based Projects Consisting of Acid and Alkali Industries, Cement and Glass Plants Based on Limestone, Gypsum, Rock Salt, Sulphur and Silica
The mineral potential of Pakistan, although considered excellent, is not
adequately exploited as its contribution to GNP at present stands at only 2.4%.
The main sources of locally available feedstocks for the production of the acid
and alkali industry (soda ash, sodium bicarbonate, caustic soda, chlorine), sulphur
and other inorganic acids, glass and cement, consist of rocksalt, sulphur,
limestone, gypsum and silica sand. The manufactured products are predominantly
marketed for local use, although there are some exports to Afghanistan and the
Central Asian states.
In view of the long history of development of industries in this sector, the process
technologies are well-known locally. However, the design, engineering and
procurement of critical plant and equipment are predominantly carried out by
foreign engineering companies.
2.6. Agro Based Feedstocks
Cotton and Other Natural Fibers
Agriculture is the largest sector of the economy and is the source of livelihood of
almost 45% of the total employed labour force in the country.
Cotton is the most important non-food crop and feedstock for the production of
natural fiber for the manufacture of textile products. Cotton fiber is also blended
with polyester and viscose fibers. The textile and clothing industry has been the
main driver of Pakistani exports for the last sixty years, in terms of both foreign
currency earnings and job creation. The textile industry flourished under official
patronage, but lost its advantages in the post quota regime. Its share in exports has
declined from 66% in 2005 to 53.7% in the current 2008-09 financial year.
The textile industry is based on relatively low to medium technology, but in spite
of this Pakistan has spent US$7.5 billion on the import of textile machinery over
the past ten years (1999-2009). Pakistan did not make any effort to adopt

________________________________________________________________________________________ Chapter – 2 Page 18 of 23
imported technologies for the manufacture of textile machinery by reverse
engineering. In view of these shortcomings, the textile industry has continuously
suffered productivity losses due to machinery breakdowns and its inability to cope
with operational problems. Pakistan is now facing competition from China, India
and Bangladesh, in view of their better quality products, higher productivity and
other economic advantages.
Sugarcane, Molasses, Power Alcohol and Associated Industries
Sugarcane is an important cash crop and is a valuable feedstock for the production
of sugar and other downstream industries, such as industrial alcohol, chip board
and paper.
Molasses is a by product of the sugar industry and is the starting raw material for
the production of industrial alcohol, which is used as a source of energy for
automobiles, as well as the production of organic chemicals, such as aldehydes,
acetone, acetic acid, acetic anhydride, isophoron, citric acid, glycerol, yeast and
many other derivatives for pharmaceutical and plastic industries.
Fruit and Vegetables
The various varieties of fruit produced in Pakistan consist of citrus, mango,
apples, banana, apricot, guava, grapes and tomatoes. Annual production is
estimated at 5.6 million tons per year.
The fruit industry is very diversified and consist of juices, soups and sauces, baby
food, bakery products, confectionary and tomato products. The technology for the
processing of fruit is becoming more sophisticated because of the high demand
for quality products. The industry is required to produce food products both
economically and profitably, and this depends upon efficient processes. At the
same time, these processes must handle the material in such a way that the final
product is attractive to the consumer.
The fruit industry and its downstream products have considerable export
potential.

________________________________________________________________________________________ Chapter – 2 Page 19 of 23
Natural Dyes
Vegetable dyes are eco-friendly and their use is increasing, especially for dyeing
wool, carpets, silk and cotton.
The common sources of vegetable dyes are parts of plants, such as leaves,
flowers, fruit, seeds, barks, and the roots of dye yielding plants. The cultivation of
certain trees also yield dye material. Therefore, the utilization of dye yielding
plants and trees will boost the agro-based industry especially in rural areas,
leading to rural development and employment creation. Pakistan imports
vegetable dyes from India despite the fact that the raw materials for their
production are available in Pakistan. Dyes and pigments constitute the largest
segment of the industry, with the world’s present value estimated at about US$16
billion per year.
Herbal Medicines and Associated products
The Indian / Pakistani system of medicines--generally known as the Ayurvedic
System of Medicine--is considered a perfect science of life which has evolved
from wisdom, experience and logic. Based on scientific observations, it has its
origin in the Vedas--the oldest recorded wisdom circa 6000 BC. Ayurvedic herbal
medicines are considered ideal treatments, as they cure the diseases without
causing any side effects.
Herbal medicines and products now include medicines, health supplements,
herbal beauty and toiletry products.
Major developments in herbal medicines and beauty products are now taking
place in China, South Korea, Canada and the US, in addition to India. It is
estimated that the global market for herbal products now stands at US$62 billion
per annum.
Pakistan has a vast variety of flora and fauna especially in the northern areas,
Azad Kashmir and the foothills of the Himalayas, which need to be explored for
beneficial exploitation of these resources.

________________________________________________________________________________________ Chapter – 2 Page 20 of 23
India has established a Technology Development Board which provides financial
assistance to R&D establishments concerned with the development and
commercialization of indigenous technology for herbal products for wider
domestic applications.
There is considerable potential for the development of this sector and
collaboration with well known companies such as Hamdard and Qarshi can be
sought for joint partnerships for the development of herbal projects.
Oils and Fats Industry
Conventional oils derived from cotton seed, rapeseed and corn are now processed
and utilized for the production of bio-fuels in the US and other countries.
An alternative source of vegetable oil called Jetropha is now widely cultivated in
South and Southeast Asia, especially in Japan, Thailand, China and India. It is a
woody and hardy plant, and grows to a height of 3-8 meters. It grows quickly
even in poor soils and is not affected by drought and disease. The Macro
engineering society of Pakistan, in collaboration with Big Bird (Pvt.) Ltd. has
initiated a project for the plantation of Jatropha in Layyah, West Punjab. The
Jetropha oil seed contains about 40% of vegetable fat/oil and some toxic
materials, which makes it inedible for human and livestock consumption. The
process technology for the conversion of Jetropha oil into bio-fuels is well proven
and can be adopted in Pakistan.
2.7 Sources of Raw Materials and Process Technologies for Chemical Industry Development in Pakistan
The sector wise classification of chemical industry in Pakistan is as follows:
PRIMARY INDUSTRIES SOURCES OF RAW MATERIAL
i) Petroleum Refineries Imported Crude Oil ii) Fertilizers Local Natural Gas,
iii) Cement Local Materials, Limestone, Clay iv) Iron & Steel Imported/Local Ore v) Copper Locally available ore vi) Textiles Local Agricultural Raw Material

________________________________________________________________________________________ Chapter – 2 Page 21 of 23
SECONDARY INDUSTRIES Petrochemical Intermediates Based Industries
Sources of Raw Materials
i) Synthetic Fibers ii) Polyvinyl chloride iii) Various Polymers iv) Pesticides v) Pure phthalic acid vi) Plastics and Resins vii) Paints and Varnishes viii) Organic Chemicals ix) Dyes and Pigments
x) Textiles and Tannery Chemicals xi) Drugs, pharmaceutical chemicals,
fine and specialty chemicals
Imported Petrochemical Intermediates, Locally available Coal, and Renewable Feedstocks consisting of Bio-mass and molasses.
2.2.3 OTHER SECONDARY INDSTRIES Acids and Alkali Industries.
Sources of Raw Materials
Soda Ash and Sodium Bicarbonate Caustic Soda and Chlorine Sulphuric and Other Inorganic Acids.
Local Raw Materials.
Paper and Paper Board Part local/part imported.
Glass and Ceramics Local Raw Materials
Crude Oil and Natural Gas are the feedstocks for the primary industries,
consisting of petroleum refining; fertilizers; iron, steel, and other metallurgical
projects; cement; and textile industries. The development of these industries is
predominantly based on imported technologies. The design and detailed
engineering, and supply of critical plant and equipment, is carried out by foreign
engineering corporations, which also assist in the construction of facilities,
training of operating staff, and the commissioning of process plant and
equipment.
2.8 Categorization of Secondary Chemical Industries in Pakistan
The secondary industries may be divided into two categories:

________________________________________________________________________________________ Chapter – 2 Page 22 of 23
Projects based on high / medium sophisticated technologies
These consist of polyesters, polyvinylchloride, polymers, pure phthalic acid
(PTA), plastics, organic chemicals, dyes and pigments etc. These projects are
based on imported technologies and the process and engineering of these projects
are predominantly carried out by foreign engineering corporations. The critical
plant and equipment is mostly supplied by foreign plant manufacturing
companies, which were also responsible for the commissioning and fulfillment of
performance guarantees.
Projects based on Medium and Less Sophisticated Technologies
Projects based on medium or less sophisticated technologies consist of the acid
and alkali industry, hydrogen peroxide, paper, board and packaging plants, glass
and ceramics and many downstream small consumer projects based on polymers,
ferrous, non-ferrous and allied fields. There have been some process technology
inputs, as well as engineering support from foreign consulting and engineering
companies, in the development of these projects.
In many cases second-hand plant and equipment has been imported by
industrialists. These plants were highly energy intensive and based on antiquated
technologies. As a result, these plants were uneconomic to operate, and required
government support in terms of subsidies and exemption from import duties and
taxes. In spite of these facilities/concessions many of these plants failed to operate
and were ultimately shut down, resulting in colossal losses to the country. Many
plants have also been shut down because of competition from China and other
countries, which have flooded the Pakistani market with cheap and better quality
products, especially in the fields of construction materials and household
consumer goods.
Pakistan has not been able to create its own capability for technological and
engineering infrastructure for the exploitation and commercialization of local or
imported technologies.

________________________________________________________________________________________ Chapter – 2 Page 23 of 23
The face and scope of the world’s chemical industry is changing. There is
continual emphasis on the development of new materials and processes based on
cheap, renewable feedstocks, consisting of coal, bio-mass and composite
materials, in addition to conventional feedstocks. The objective of the
“Development of Chemical Industry - Vision 2030” is for Pakistan to create its
own technological and engineering capability in order to make itself self-
sufficient by progressively reducing its dependence on foreign engineering
corporations, which are at present involved in the commercialization of chemical
and industrial projects. Such strategies were pursued by ASEAN, India and China
during the initial stages of their development, by virtue of which these countries
have already achieved the status of newly developed economies (NIC).
It should also be acknowledged that the creation of these facilities will create
employment opportunities for highly qualified manpower (engineers, scientists,
technologists, economists etc.). Currently, the lack of such opportunities is
responsible for the continual “brain drain” from Pakistan to other countries.

Chapter – 3 Page 1 of 1
CHAPTER 3
THE PRESENT STATUS OF THE CHEMICAL INDUSTRY
3.1 Pakistan Scenario
Historical Background
The development of the chemical industry in Pakistan started in the early 1950’s.
Since Pakistan did not have an industrial base, governments gave preference to
import substitution over export-oriented policies in their strategic plans for future
development. In spite of rather poor available resources, Pakistan made a
significant start and was considered a promising developing country in 1960’s.
Pakistan continued to follow an inward-oriented import-substitution policy until
the end of 1990’s, which hampered the development of export-oriented industries.
Pakistan did not appreciate the advantages associated with trade liberalization
until late in 1990s and supported highly protectionist trade policies. It delayed
trade liberalization and tariff rationalization until the end of 1990’s. The chemical
and the manufacturing sectors have also been adversely affected by various
factors, such as acute energy shortages and poor structural policies. Their present
share in 2008/09 GDP is estimated at 18.4%, compared with a contribution of
23% in 2006-07.
Existing Status
Chemical industry in Pakistan is widespread, in organized & unorganized sector. It is not possible to have an exact figure for investment in this sector; however a close approximation of investment in chemical sectors ranges between Rs. 550 - 600 billion. The chemical related imports constitute about 17% of the total import bill. There are three general classes of products in this Sector:
Basic chemicals both inorganic and organic such as acids, alkalies, salts,
ethylene, propylene, benzene, toluene, xylene etc.;

Chapter – 3 Page 2 of 2
Chemical products used in further manufacturing i.e. intermediates such as
pure Terephthalic acid, phthalic anhydride,
Finished chemical products for end use or ultimate consumption; synthetic
fibers i.e. polyester, PVC, polyethylene, polypropylene, polystyrene etc.
Pakistan made a considerable progress in basic inorganic chemicals like Soda Ash, Caustic Soda, Sulphuric Acid & Chlorine and sufficient production capacity of these chemicals is available not only to cater the needs of the local industry while surplus is being exported, imports of these products are negligible. However Pakistan’s organic chemical industry could not flourish due to unavailability of basic building blocks such as Ethylene, Propylene, Butylenes & BTX (Benzene, Toluene, Xylene) used for the production of most of the organic chemicals that are employed as a raw material for a number of chemical sub-sectors such as;
Pharmaceuticals
Pesticides
Dyes & Pigments
Soaps & Detergents
Paints & Varnishes
Synthetic Fiber
Plastics & Resins
Rubber Tyres & Tubes
Textiles Auxiliaries
Essential Oils & Perfumes
These petrochemical building blocks can be derived from a Petrochemical complex, which generally consist of a Naphtha Cracker, whereas naphtha is a product of oil refineries and currently its production in the country is around 1,000, 000 M.Ton per annum which is being exported. The investors have remained shy away from this project due to the following reasons;

Chapter – 3 Page 3 of 3
Highly Cost Intensive project
Sophisticated technology involved
Export market limitations
Insufficient current tariff spread
Pakistan Industrial Development Company (PIDC) has recently developed feasibility study of this mega project through an international firm of Singapore. However there are some alternate routes to produce basic petrochemical building blocks, these are;
Gasification of Coal
Dehydrogenation of Associated Gases
Cracking of Natural Gas
Each route has its own limitation, however recently some developments are taking
place to produce synthesis gas and ethylene from natural gas cracking. This
project surely opens the gateway for the development of Petrochemical industry
in Pakistan, which will support the local chemical & allied products industries in
meeting their raw materials requirements and to save the valuable foreign
exchange.
Besides the imports of most of the raw material & intermediate for these sectors,
Pakistan succeeded to develop the downstream allied chemical industries to meet
most of the local demands. The example of this development is obvious in
synthetic fibres, soaps & detergent, dyes & pigments, Paints & Varnishes, while
amongst intermediates Pakistan has sufficient capacity for Pure Terephathalic
Acid (PTA) and Poly Vinyl Chloride (PVC). However still the imports of
chemicals and allied industries stood around 20%, which is significant for a small
economy of Pakistan.

Chapter – 3 Page 4 of 4
3.2 Regional Scenario
By comparison, economic growth in Southeast Asia started in Japan in the 1960s
and was followed by newly developing countries, such as South Korea,
Singapore, Hong Kong and Taiwan. The “four little dragons” grew rapidly, owing
to their export-orientated industrialization policies. These countries provided
export incentives, such as subsidized export credits, duty free imports for
feedstocks of manufactured export products, encouraged foreign direct investment
(FDI), and also developed their science, technology and engineering infrastructure
to support their industrial base.
Trailing behind the “four little dragons” are four ASEAN countries--Indonesia,
Malaysia, Thailand and the Philippines. These four countries have also been
successfully increased their exports of high value-added goods by following a
policy of trade liberalization and technology development.
However, the most spectacular developments in the production and export of
manufactured products consisting of primary as well secondary chemicals have
taken place in China and India. China’s GDP has grown at an annual average rate
of 9-11% over the past two decades. China simultaneously developed a
technology and engineering infrastructure, by virtue of which it is now exporting
its chemical and manufactured products to developed countries, as well as its
process and project engineering systems to Asia and Africa.
There is widespread understanding that economies with liberal trade policies and
openness have higher economic growth rates. Trade liberalization, together with
complimentary policies and structural reforms, results in substantial
improvements to the business environment, fosters market competition and helps
technology improvement and upgrading. These strategies boost productivity and
the optimum utilization of resources which are absolutely essential for increasing
exports and supporting economic performance.
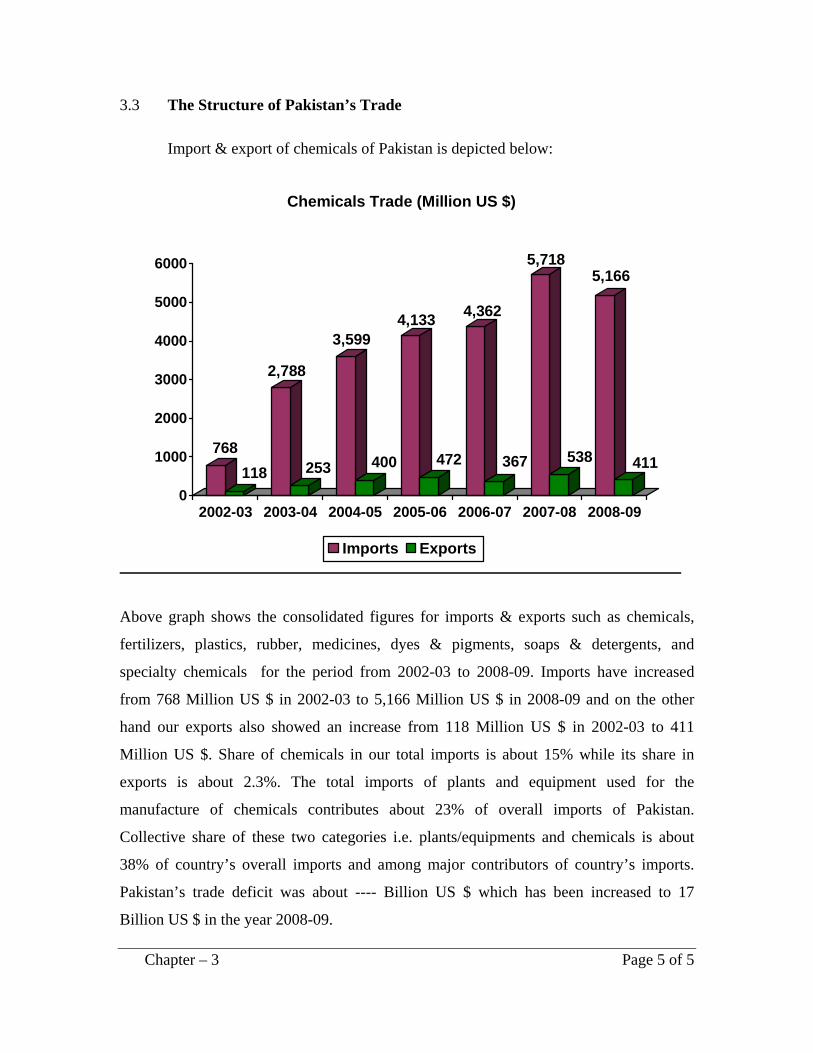
3.3 The Structure of Pakistan’s Trade
Import & export of chemicals of Pakistan is depicted below:
768118
2,788
253
3,599
400
4,133
472
4,362
367
5,718
538
5,166
411
0
1000
2000
3000
4000
5000
6000
2002-03 2003-04 2004-05 2005-06 2006-07 2007-08 2008-09
Chemicals Trade (Million US $)
Imports Exports
Above graph shows the consolidated figures for imports & exports such as chemicals,
fertilizers, plastics, rubber, medicines, dyes & pigments, soaps & detergents, and
specialty chemicals for the period from 2002-03 to 2008-09. Imports have increased
from 768 Million US $ in 2002-03 to 5,166 Million US $ in 2008-09 and on the other
hand our exports also showed an increase from 118 Million US $ in 2002-03 to 411
Million US $. Share of chemicals in our total imports is about 15% while its share in
exports is about 2.3%. The total imports of plants and equipment used for the
manufacture of chemicals contributes about 23% of overall imports of Pakistan.
Collective share of these two categories i.e. plants/equipments and chemicals is about
38% of country’s overall imports and among major contributors of country’s imports.
Pakistan’s trade deficit was about ---- Billion US $ which has been increased to 17
Billion US $ in the year 2008-09.
Chapter – 3 Page 5 of 5

The structure/composition of Pakistan’s exports of chemicals for the year 2008-09 is
depicted below:
Chemical Exports of Pakistan ‐ 2008‐09Total Exports = 513 Million US $
Petrochemicals4.0% Pharmaceuticals
28.3%
Plastics41.6%
Perfumes & Cosmetics2.6%
Other Specialty Chemicals10.7%
Inorganic Chemicals4.5%
Fertilizers0.1%
Dyes & Pigments1.4%
Coatings & Inks3.5% Soaps & Detergents
3.4%
Plastics stand top export with a share of 41.6%. Second is pharmaceutical with a healthy
share of 28.3%. Third largest one is of specialty chemicals contributes about 18.2% of
which perfumes & cosmetics 2.6%, coatings & inks 3.5%, dyes & pigments 1.4% and
other specialty chemicals share is around 10.7%. Inorganic chemicals have comparatively
very low exports of 4.5% while Pakistan have significant surplus available for exports
most promising products in this sub-sector are soda ash, caustic soda, chlorine, calcium
chloride, bleaching powder etc. need be encouraged. Petrochemicals share is about 4% in
which major contributors are phthalic anhydride, dioctyl orthophthalate etc. soap &
detergents contributing about 3.4% while share of fertilizers is negligibly small i.e. 0.1%.
Traditionally, exports from Pakistan have been dominated by textiles, cotton, ready-made
garments and leather products. These comprise about 60% of total exports from Pakistan,
and are predominantly manufactured by low technology and labour intensive processes.
Chapter – 3 Page 6 of 6
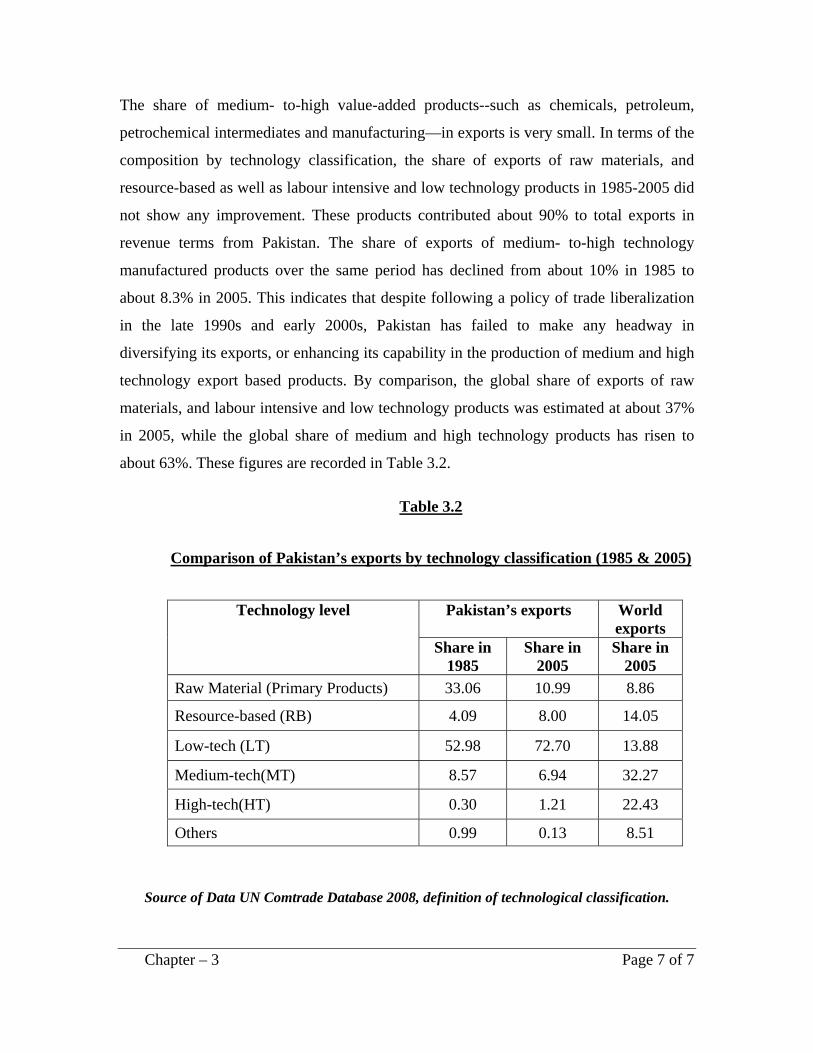
Chapter – 3 Page 7 of 7
The share of medium- to-high value-added products--such as chemicals, petroleum,
petrochemical intermediates and manufacturing—in exports is very small. In terms of the
composition by technology classification, the share of exports of raw materials, and
resource-based as well as labour intensive and low technology products in 1985-2005 did
not show any improvement. These products contributed about 90% to total exports in
revenue terms from Pakistan. The share of exports of medium- to-high technology
manufactured products over the same period has declined from about 10% in 1985 to
about 8.3% in 2005. This indicates that despite following a policy of trade liberalization
in the late 1990s and early 2000s, Pakistan has failed to make any headway in
diversifying its exports, or enhancing its capability in the production of medium and high
technology export based products. By comparison, the global share of exports of raw
materials, and labour intensive and low technology products was estimated at about 37%
in 2005, while the global share of medium and high technology products has risen to
about 63%. These figures are recorded in Table 3.2.
Table 3.2
Comparison of Pakistan’s exports by technology classification (1985 & 2005)
Technology level Pakistan’s exports World exports
Share in 1985
Share in 2005
Share in 2005
Raw Material (Primary Products) 33.06 10.99 8.86
Resource-based (RB) 4.09 8.00 14.05
Low-tech (LT) 52.98 72.70 13.88
Medium-tech(MT) 8.57 6.94 32.27
High-tech(HT) 0.30 1.21 22.43
Others 0.99 0.13 8.51
Source of Data UN Comtrade Database 2008, definition of technological classification.
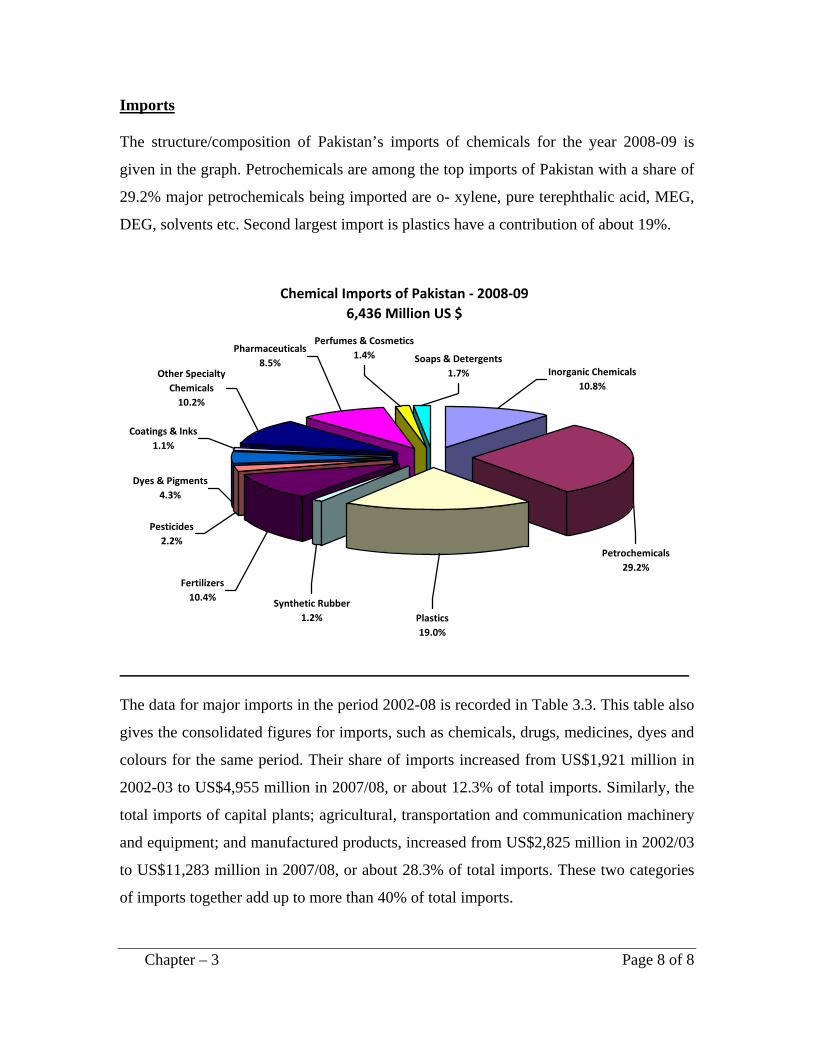
Imports The structure/composition of Pakistan’s imports of chemicals for the year 2008-09 is
given in the graph. Petrochemicals are among the top imports of Pakistan with a share of
29.2% major petrochemicals being imported are o- xylene, pure terephthalic acid, MEG,
DEG, solvents etc. Second largest import is plastics have a contribution of about 19%.
Chemical Imports of Pakistan ‐ 2008‐096,436 Million US $
Soaps & Detergents1.7%
Dyes & Pigments4.3%
Coatings & Inks1.1%
Other Specialty Chemicals10.2%
Pesticides2.2%
Fertilizers10.4% Synthetic Rubber
1.2% Plastics19.0%
Petrochemicals29.2%
Inorganic Chemicals10.8%
Pharmaceuticals8.5%
Perfumes & Cosmetics1.4%
The data for major imports in the period 2002-08 is recorded in Table 3.3. This table also
gives the consolidated figures for imports, such as chemicals, drugs, medicines, dyes and
colours for the same period. Their share of imports increased from US$1,921 million in
2002-03 to US$4,955 million in 2007/08, or about 12.3% of total imports. Similarly, the
total imports of capital plants; agricultural, transportation and communication machinery
and equipment; and manufactured products, increased from US$2,825 million in 2002/03
to US$11,283 million in 2007/08, or about 28.3% of total imports. These two categories
of imports together add up to more than 40% of total imports.
Chapter – 3 Page 8 of 8

Chapter – 3 Page 9 of 9
Table – 3.3 MAJOR IMPORTS OF PAKISTAN
US$ (Million) 2002-03 2003-04 2004-05 2005-06 2006-07 2007-08
1 Chemicals & Related Product 1,555 2,078 2,709 2,990 3,194 4,181
2 Drugs and Medicines 222 275 292 331 354 4633 Dyes & Colours 144 160 187 223 238 3114 Chemical Fertilizers 240 285 417 652 696 9125 Electrical goods 217 258 356 502 536 7026 Machinery 2,224 3,309 4,494 6,245 6,673 8,7327 Transport Equipments 501 653 1,069 1,602 1,712 2,2408 Iron and Steel 402 512 890 1,373 1,467 1,9209 Iron and Steel Scrap 48 94 222 424 453 593
10 Manufacture of Metal 100 124 175 223 238 31111 Tea 173 193 223 225 240 315
12 Synthetic & Artificial -Silk yarn 92 118 130 546 583 763
13 Non-ferrous metal 30 34 40 123 131 17214 Crude Petroleum 1,367 1,765 2,149 3,804 4,065 5,32015 Petroleum Products 1,700 1,401 1,851 2,848 3,043 3,98216 Edible Oils 539 613 703 746 797 1,04317 Grains, Pulses & Flours 116 75 123 164 175 22918 Other Imports 2,551 3,646 4,569 5,560 5,941 7,775
Total Imports 12,221 15,593 20,599 28,581 30,536 39,964Source : Export Promotion Bureau
Chemicals (1+2+3+4) 2,161 2,798 3,605 4,196 4,482 5,867
Percentage of Chemicals Group to Total Imports
17.7% 17.9% 17.5% 14.7% 14.7% 14.7%
Capital Plant & Equipment (6+10) 2,324 3,433 4,669 6,468 6,911 9,043
Percentage of Machinery Group to Total Imports
19.0% 22.0% 22.7% 22.6% 22.6% 22.6%
There have been major increases in the imports of chemicals, pharmaceuticals, drugs,
dyes and colors, as well as manufactured products, such as capital plants, equipment and
associated machinery. These products have been responsible for the widening gap
between imports and exports, indicating that Pakistan has not been able to diversify its
production of consumer and industrial products in spite of the adoption of liberal policies
by governments. Domestic production of consumer goods is based on labour intensive,
low value-added products.

Chapter – 3 Page 10 of 10
In the past, medium and high intensive technology based chemical plants, such as
petroleum, cement, sugar, polyester fibers and other petrochemical based polymer
products were developed in Pakistan with the help of foreign engineering and
construction companies. However, Pakistan has failed to assimilate these technologies,
and use these either for the replication of these plants or in the development of associated
projects.
3.4 The Role of the Government in Industrial Development
Rapid industrial development in Japan and the newly industrialized economics (NICs) of
South and Southeast Asia has resulted in these countries recording very high economic
growth rates since the 1960s. This was made facilitated by the development of industrial
policies designed to shift the industrial structure away from primary economic activities,
such as agriculture and textile manufacturing, to advanced chemical and manufacturing
industries.
Economists in the late 1970s and 1980s portrayed the industrial policies of NIC’s as a
new perspective on development and defined the role of the state to maintain
macroeconomic stability, provide industrial and technology infrastructure, improve
market institutions to enhance development, and redistribute the generated wealth. One of
the major reasons for the success of industrial policies in NIC’s was productive
investment--which formed a large percentage of GDP--with much of this investment
funding made by the public sector. The introduction of incentives and subsidies were also
used as an effective tool for resource allocation. The governments of NIC’s established
public organizations to support production activities, but relied primarily on private firms
for the success of their industrial policies. These governments, however, realized that the
industries whose development were deemed necessary for rapid industrialization could
only be nurtured with the intervention of the public sector. This is because most of the
industries they were developing—such as chemicals, petrochemicals and polymers etc--
required large scale investments which the private sector could not afford.

In China, market reforms were introduced by Deng Xiaoping in 1978, along with its
Open Door Policy. Deng stated that if capitalism had something positive to offer, then
China should accept and exploit it to the best of its advantage.
T
he structure of China’s petroleum and petrochemical industry is shown in Fig 3.1. China
created two Public Sector Corporations: China National Petroleum Corporation (CNPC)
for the production and exploration of Oil and Gas; and the China Petrochemical
Corporation (SINOPEC) for the development of its petrochemical industry. China created
Petro-China as a Holding Company which offered shares on the international market,
with its value estimated at US$100 million in 1999. Petro-China’s value has now reached
US$1.1 trillion over a ten-year period. CNPC is now ranked one of the top petroleum
companies globally, as shown in Table 3.5.
Chapter – 3 Page 11 of 11

CNPC ranked as World’s Top 50 Petroleum Companies
Total assets US Dollars 1.1 trillion.13 Giant Oil and Gas Fields16 Large Scale Refining and Petrochemical Companies 19 Marketing Companies.Large Group of R&D Units For Technical Services.Capital Plant Manufacturing Enterprises in Northeast, Northwest, North and Southwest China.30 Oil and Gas exploration, development and production projects in Middle East, North Africa, Middle Asia, Russia and South America.
The salient feature of China’s industrial policy is that the public sector has a large share
holding, while the private sector is given a small share in the equity, when developing
primary large-scale projects. Conversely, in the downstream secondary industries the
public sector has a minor shareholding, while private companies have a large equity
share. This is a good example of the importance and success of public-private
partnerships (PPAs) in the successful industrialization of the country. This is illustrated in
Table 3.6.
Chapter – 3 Page 12 of 12
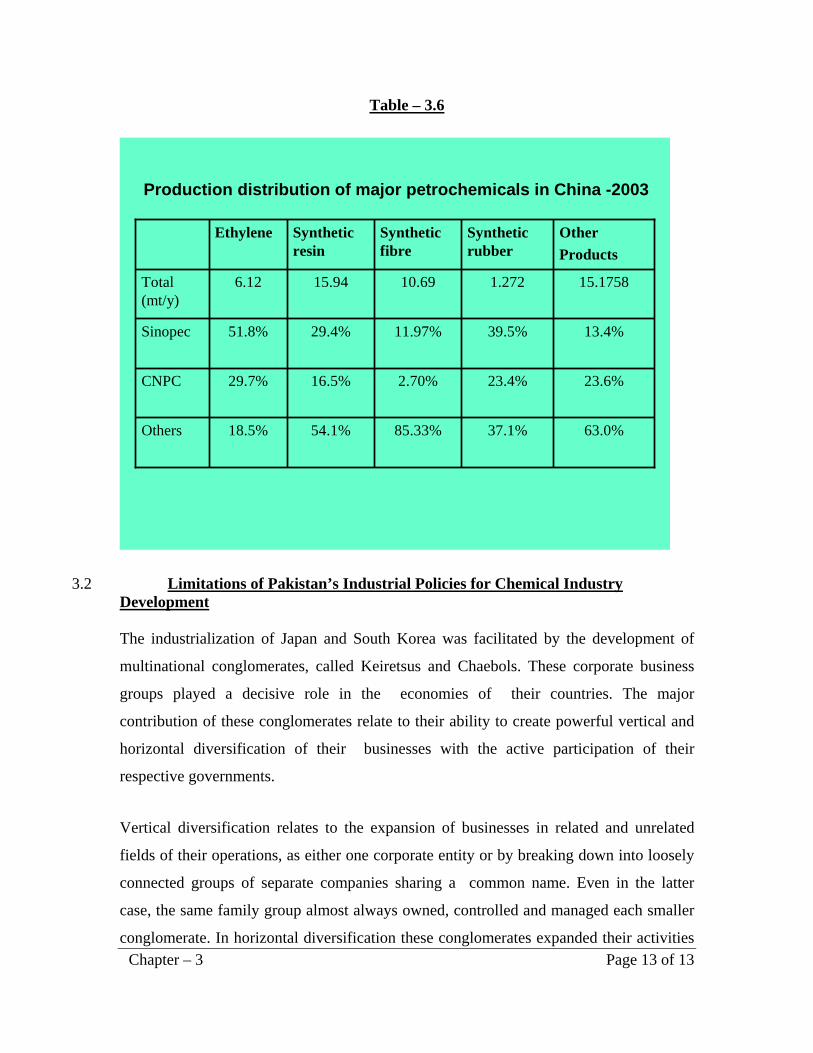
Table – 3.6
Production distribution of major petrochemicals in China -2003
63.0%37.1%85.33%54.1%18.5%Others
23.6%23.4%2.70%16.5%29.7%CNPC
13.4%39.5%11.97%29.4%51.8%Sinopec
15.17581.27210.6915.946.12Total (mt/y)
Other Products
Synthetic rubber
Synthetic fibre
Synthetic resin
Ethylene
3.2 Limitations of Pakistan’s Industrial Policies for Chemical Industry Development The industrialization of Japan and South Korea was facilitated by the development of
multinational conglomerates, called Keiretsus and Chaebols. These corporate business
groups played a decisive role in the economies of their countries. The major
contribution of these conglomerates relate to their ability to create powerful vertical and
horizontal diversification of their businesses with the active participation of their
respective governments.
Vertical diversification relates to the expansion of businesses in related and unrelated
fields of their operations, as either one corporate entity or by breaking down into loosely
connected groups of separate companies sharing a common name. Even in the latter
case, the same family group almost always owned, controlled and managed each smaller
conglomerate. In horizontal diversification these conglomerates expanded their activities Chapter – 3 Page 13 of 13

Chapter – 3 Page 14 of 14
into banking, investment and other related ventures. This pattern, in many cases, was also
followed later by NICs.
Under the present political climate in Pakistan, it is very difficult to attract foreign direct
investment, from not only developed countries, such as the US, Japan and Europe, but
also from the Middle-East. In view of these constraints, it is necessary for the government
of Pakistan to devise suitable policies to develop PPPs, in order to spur the development
of the chemical industry, which will cater to both domestic demand and exports. In this
endeavour large industrial groups such as Fauji Foundation, Dawoods, Engro and other
well known textile, cement and sugar groups should be invited to reinvest their proceeds
for the vertical or horizontal diversification of their businesses.

CHAPTER 4
4.1 Modernization of the National Innovation System for Chemical Industry Development in Pakistan
Pakistan’s industry is facing pressures from globally competitive markets. It has
become extremely difficult for Pakistan’s economy to sustain growth by
continually relying on cheap labour, limited technological infrastructure and the
high cost of imported technologies. In view of these limitations the challenges of
enhancing, as well as modernizing, a National Innovation System (NIS) has
become very important.
The NIS of any country is defined as the framework by which a country brings
about technological change. It includes many diversified elements and
participants involved in the development of the chemical industry. These consist
of research and development (R&D) and technology development institutions; the
infrastructure responsible for the commercialization of locally developed and
imported technologies; the structure of universities and educational and technical
institutions for human resource development; the government and regulatory
agencies; information networks; financial institutions; and domestic and
international markets. It emphasizes the synergistic strategies and complex
interactions between various stakeholders in an economic environment. The
development and enhancement of a NIS is therefore critical for the formation of
national technological policies and is also important for strategic technology
planning in Pakistan.
The past history of industrial development has shown that the highly
industrialized countries of the UK, France, Germany and the US, achieved their
status as industrialized nations after several centuries of continual endeavour.
Successive countries have, however, achieved their development goals in shorter
periods than those immediately preceding them.
Japan took a shorter time than the Europeans to achieve its status as an
industrialized country. But while Japan’s technological miracle spans over half a
Chapter - 4 Page 1 of 21

century, South Korea, which followed the Japanese model, achieved its
industrialized status in about 25-30 years, while other newly industrialized
countries (NIC’s) of Southeast Asia, such as Singapore, Taiwan and Hong Kong,
have also shown similarly remarkable progress in an even shorter time span.
Other countries like Indonesia, Malaysia and Thailand, as well as China, India
and Brazil, have exhibited what is termed as miracles. Their achievements have
also been spectacular and unparalleled in history.
Limitations of Pakistan’s N.I.S
It would be appropriate to consider the limitations of Pakistan’s Innovation
System and determine why it has lagged behind in its race towards the
development of its chemical industry and whether it can replicate the experiences
of its neighbouring countries--especially China and India--in order to achieve the
desired goals.
The leap-frogging experience of China and many other NIC’s was not the result
of the so-called “invisible hand”. Their leaders took strategic decisions that were
at the time at variance with their comparative advantages (given their then levels
of economic development), but eventually led to the desired transformation.
These countries paid special attention to the development of their NIS, which
formed an important aspect of their economic structure and institutional setups,
which had a positive impact on human resource development, and also enhanced
and improved their systems of production, marketing and associated sub-systems.
These factors formed the basis of these countries’ innovative technologies.
The centerpiece of NIS is a country’s industrial organizations and it is their
responsibility to co-ordinate with research and development institutions in the
utilization of inventions for the commercialization of the results of this research.
The process of commercialization depends on the integration of technology with
prototyping, production, marketing and creating effective linkages with
consumers. In Pakistan, R&D institutions, universities and industry work in
Chapter - 4 Page 2 of 21

isolation and are completely divorced from each other’s activities. Unfortunately,
no effort has so far been made by the public or private sector to develop public-
private partnership in order to integrate the activities of various sectors of
economy.
Various models for the utilization of local or imported technologies for
commercialization have been proposed. However, the diffusion model is
considered the most appropriate first step for development, given the present
situation in Pakistan.
One aspect of this model is designed to facilitate learning, train the labour force to
high technical standards, absorb locally developed or imported technology, and to
solve production problems related to energy and productivity improvements in the
chemical industry, by introducing reverse engineering techniques as a first step
towards the development of a NIS. This is a well-known technique through which
foreign technology may be acquired and assimilated by importing sophisticated
capital equipment. Machinery and equipment that have been designed and
manufactured by foreign engineering companies are based on modern technology
and have technological information embedded in them. These technology imports
have been used by NIC’s to produce high quality products through the application
of reverse engineering. Unfortunately, Pakistan has not been able to develop this
capability.
The textile industry is a prime example of this shortcoming, since it has been
importing textile machinery worth billions of US dollars every year without
taking any initiative to enhance its capability for modernization, or revamping its
textile machinery through the adoption of imported technologies by reverse
engineering techniques. Large industrial companies, such as refineries, fertilizer
and cement have also not taken any initiative to exploit these techniques.
For an economy competing at the global frontiers, its innovation strategy requires
a well developed infrastructure, a set of capability focused technology policies, as
well as an industrial environment that stimulates innovation and entrepreneurship.
Chapter - 4 Page 3 of 21
It is therefore, necessary to examine the role played by science and technology
policies in a country’s transition to an innovation based growth strategy, and
discuss the challenges Pakistan faces in restructuring its economic institutions in
order to improve R&D capabilities so as to encourage technology creation.
Process science and engineering technology (PS&ET) is the foundation for the
development of the chemical industry. It embodies the integration of facilities for
technology development, process design, detailed engineering, manufacturing of
capital plants and equipment, chemical plant construction and management.
Taken together, these provide the basis for manufacturing excellence and
sustainable competitive advantage, as well as employment opportunities for
highly qualified manpower. The development and application of PS&ET is rather
fragmented in Pakistan at present. In order to meet the goals of “Chemical
Industry Development - Vision 2030”, it is absolutely essential for Pakistan to
enhance its PS&ET capabilities, as this is an important component of a NIS. The
performance of various elements of this system in Pakistan have been critically
examined, and a coherent strategy for the integration of available facilities has
been proposed, in order to achieve the objectives of “Chemical Industry
Development - Vision 2030”.
Pakistan’s technological infrastructure is weak and is not suitably developed. Its
scope to be widened, modernized and strengthened. The objective is to make
Pakistan self-reliant, thereby limiting its dependence on foreign technology,
licensing and engineering organizations for the acquisition of technology and
process know-how. This will require collaborative efforts in the form of Public
Private Partnerships (PPP) and considerable improvements in the present structure
of R&D institutions, as these are the major components of process science and
engineering technology systems.
It is proposed that the scope of the Engineering Development Board should
be widened, with an additional responsibility for Technology Development.
Chapter - 4 Page 4 of 21

The structure of the proposed Technology Development Board is illustrated
in Fig 4.1
Structure of Technology Development Board
Strategy for the Development Strategy for the Development of National Innovation of National Innovation
SystemSystem
National Committee National Committee CounsilCounsil for for Research and Technology Research and Technology
DevelopmentDevelopment
National Committee National Committee CounsilCounsil for the for the Development of Development of
Soft/Hardware for the Soft/Hardware for the Commercialization of Commercialization of
Technologies.Technologies.
National Committee National Committee CounsilCounsil for the for the Development of Technology Policy and Development of Technology Policy and
Investment PlanningInvestment Planning
Fig 4.1
4.2 The Role of the National Committee in Research and Technology Development
R&D institutions are an important part of the national innovation system of any
country. These institutions make a vital contribution to technological
transformation and enhance a country’s capacity to invent, absorb, adopt and
deploy technology through laboratory and pilot plant development work. An
interdisciplinary approach is invariably adopted and the work is carried out by
scientists, engineers, technologists, economists and technicians, who are suitably
trained and conversant with modern research and development methods and
equipment. In many cases these institutions also provide consultative services and
help to solve product and process problems of firms, such as the processes of
Chapter - 4 Page 5 of 21

decoding, trouble-shooting problems of transferred technology and improving
productivity and energy efficiency. The extent to which R&D effort are involved
in the productive sectors of an economy determines its contribution to
technological transformation and development. In addition, performance is judged
by the number of scientific publications in recognized international journals; the
number of product and process inventions, whether patented or not; and other
measures such as the utilization of their work for commercialization.
4.2.1 The Current Status of R&D in Pakistan
Research and development is divided into
(i) Basic research
(ii) Applied research and
(iii) Development
The objective of basic research is to gain more comprehensive knowledge and
understanding of a problem, without specific application or immediate
commercial application. The objective of applied research is to gain knowledge to
meet specific needs resulting in invention. It is also called goal-oriented research.
Development is the systematic application of knowledge gained from R&D and
utilized towards the production of useful products, systems, and materials
including design and system development, which lead to the commercialization of
technology.
R&D plays a decisive role for innovative solutions which are generated in
dialogue between users and developers. This dialogue is the central concern for
developing linkages between universities, industry and R&D institutions.
Unfortunately, these linkages are not well developed in Pakistan’s scientific
culture. Universities, R&D institutions and industry work in complete isolation
and there is little concern about a multi-disciplinary approach to research, as
practiced in NIC’s and scientific institutions in other countries. In addition, there
Chapter - 4 Page 6 of 21

is hardly any provision or facility for pilot plant work in Pakistan’s technological
institutions. Expenditure on R&D is limited and these institutions get little
funding from industry.
4.2.2 National Committee for Research And Technology Development
In order to advance technology, universities, R&D institutions and industry must
foster linkages as a first step towards the streamlining of available resources for
development.
The task of the National Committee for Research and Technology
Development will be:
(i) To establish subcommittees for each sector of chemical industry concerned with the utilization of available feedstocks. The members of the sub-committees will be drawn jointly from industry, universities and R&D institutes relevant to each sector.
(ii) To appoint industrial liaison officers and research fellows to the conduct industrial surveys in order to identify and select industrial problems for R&D.
(iii) To create research teams drawn jointly from universities, industry and R&D institutes for interdisciplinary technology development for the identified projects.
(iv) To allocate resources for the execution of R&D and set targets for the completion of work.
(v) Continually appraise the project progress, with special reference to techno-economic evaluation of the results of R&D.
(vi) To determine the suitability of the projects for pilot plant study after the completion of laboratory work.
(vii) To allocate resources for pilot plant study for the selected projects.
(viii) To continually appraise the results of pilot plant studies and determine their techno-economic feasibility for commercialization, and
(ix) To develop process design parameters for the commercialization of technology and make recommendations for the registration of patents.
Chapter - 4 Page 7 of 21

Chapter - 4 Page 8 of 21
To execute this programme for technology development, the role of the public
sector is absolutely essential and its responsibility should be clearly defined in
order to obtain tangible results. The structure of the National Committee for
Research and Technology Development is illustrated in Fig 4.2.

Structure of National Committee For Research and Technology Development
`
National Committee for Research and Technology
Development
Sub-committees for Various Sectors of the Chemical Industry
Industrial Surveys for the Identification and Selection
R&D Problems.
Selection of R&D Teams from Universities/R&D institutions/ Industry for
R&D Work and the Allocation of
Selection of Projects for Pilot Plant Work and the Allocation of Resources
Selection and Adoption of Technology for Commercialization.
Techno-economic Evaluation
Design of Parameters
Techno-economic Evaluation
Marketing Evaluation
Approval and Evaluation
Evaluation & Approval
Registration of Patents
Fig 4.2
Chapter - 4 Page 9 of 21

4.3 National Committee for the Development of Software and Hardware for the Commercialization of Technologies
The development of Industrial infrastructure consisting of the software and
hardware required for the commercialization of locally developed or imported
technologies, depends on the availability and continual development of local
capability for process design, project engineering, design of instrumentation and
control, safety and environment, construction and project management. It also
requires the development of facilities for the manufacture of capital plant and
equipment and associated hardware necessary for the construction and
operation of the project. When integrated in the technological infrastructure,
these resources permit the economic utilization of capital, improved application
of human resources, reductions in the cost of production and help in building an
industrial base for the effective development of the chemical industry.
At present Pakistan has limited capacity for the development of the hardware and / or
software necessary for the technology transfer processes. The development of
industrial projects has been assigned in most cases to foreign engineering companies,
which are given the responsibility for the design, engineering and supply of critical
plants, and the construction of plants on an EPC basis (Engineering, procurement and
construction).
During the initial stages of industrial development, the government of newly
developed countries (NIC’s), including India, China and Brazil, encouraged local
companies to form joint ventures with foreign engineering corporations, whereby
local resources were also used through a learning process in the technology transfer
processes for the commercialization of technologies. These countries have now
developed their own industrial infrastructure for software and hardware and are self-
reliant. In many cases they also export their know-how and project management
expertise to other countries.
It is essential that Pakistan develop its own capability and technological infrastructure
for providing hardware and software services for the implementation and construction
Chapter - 4 Page 10 of 21

management of chemical projects. This can be accomplished by the formation of
engineering companies or by enhancing the capability of existing engineering
companies either as PPPs or as joint ventures with Chinese/Malaysian companies or
other foreign companies.
It should be recognized that the development of facilities for the commercialization of
technologies will require tens of thousands of highly qualified scientists, engineers,
technologists, economists, social scientists and marketing experts. Unfortunately,
these areas of manpower utilization have been completely neglected in the past,
which has resulted in the “brain drain” of Pakistan’s highly qualified manpower to
other countries.
The functions of an engineering company will consist of:
(i) Identification of new projects
Identification of potential projects within the framework of the development plan and based on locally available and/or imported raw materials.
(ii) Feasibility and Investment Studies
Undertaking comprehensive feasibility and investment studies based on international standards for the establishment of chemical industries.
(iii) Financial Packages
Arrangement of local and foreign financing for clients/investors/entrepreneurs.
(iv) Design and Engineering
To undertake the design and engineering of projects with a view to optimizing the use of indigenous resources and facilities, thereby reducing overall investment costs.
(v) Local Fabrication of Equipment and Machinery
Establishment of manufacturing companies for the fabrication of high pressure plants and equipment in collaboration with foreign engineering companies is considered desirable.
Chapter - 4 Page 11 of 21

(vi) Construction of Plants
To provide planning and scheduling, supervision, monitoring and control of
the construction of plants. In this area, local companies are available, which
have the capability to undertake the construction of complete plants.
(vii) Commissioning, operation and maintenance
To undertake the commissioning of plants, and provide guarantees for quality
assurance and production capacities.
In addition it will be necessary to develop capability in operational and
maintenance management and provide this facility to projects on a contractual
basis.
To arrange training of the client’s managerial and operational personnel in
Pakistan or abroad.
(viii) Modernization and Revamping (BMR) of Existing Plants
To undertake BMR studies with a view to improving the performance of
existing plants and to bring them to the optimum level of productivity and
efficiency. This will include technical and financial auditing; management
reviews; the preparation of BMR proposals; design and detailed engineering;
fabrication or upgrading of equipment for the replacement of old equipment;
and the construction and integration of facilities with the main plant.
(ix) Acquisition of Technology Packages
The know-how and technology required for the development of projects will
be acquired from local resources or imported as process packages.
Chapter - 4 Page 12 of 21

Chapter - 4 Page 13 of 21
(x) Reverse Technology Transfer
In view of the high cost of manpower in the developed world, engineering
companies in these countries are using available resources in emerging
markets where software design and engineering facilities have already been
developed, such as South Korea, China, India, Philippines, Thailand and
Malaysia. There is immediate need for such facilities to be developed in
Pakistan, which can form a source of foreign exchange earnings.
(xi) Organizational Structure
These companies may be conceived as joint ventures between foreign and
local partners, with equity participation to be negotiated.
The foreign partner will locate some experts in Pakistan to work with the local
company to achieve the above mentioned objectives.
The organization and structure of the proposed engineering companies is
shown in Figure 4.3.
4.4 National Committee for the Development of Technology Policy and Investment Planning
It is proposed that a National Committee for the Development of Technology Policy
and Investment Planning should be created with equal representation from the public
and private sectors. The objectives of this Committee will be:
(i) To provide suitable incentives to entrepreneurs, in order to accelerate the
processes of chemical industry development and the resolution of industrial
problems and policies on a continual basis.
(ii) To develop investment policies and infrastructure for capital formation.
The role of the government may be reviewed from several perspectives: enhancing
the supply of science and technology; facilitating the transfer of foreign technology;
diffusing foreign technology; and promoting in-house research through local

Proposal Structure of Engineering Companies for Commercialization of Technologies
Development of New Projects and Revamping of Old Plants
Design, Engineering and Construction Management Services
Consultancy Services
Preliminary & Detailed
Feasibility
Process Design
Detailed Engineering
Procurement Services
Construction Services
Commissioning Services
Modernization & Revamping of Old Plants
*Market Research *Survey & Selection of Plant Location *Study of Raw Material & Utilities *Selection of Technology *Determination of Investment Costs *Preparation of Financial Plan and Means of Funding *Environmental Assessment *Planning of Plant Management *Implementation Plan
*Acquisition of Technology and know-how *Process design, utilities design *Establishment of Technical Requirements
*Checking of Process Design *Plant Layout *Mechanical Design *Piping Design *Instrumentation Design *Electrical Design *Civil and Structural Design *Environment Control *Preparation of Project Packages
*Preparation of tenders *P/Q of Contractors *Evaluation of Bids *Local Fabrication *Foreign Procurement *Selection of Companies *Inspection of Equipment *Shipments to Plant Site
*Preparation of tenders *P/Q of Contractors *Evaluation of Bids *Selection of Contractors *Supervision during erection *Plant schedule control *Project Cost Control *Quality Control *Safety Control
*Manpower training *Preparation of SOPs and operating Manuals *Start up Planning *Raw Materials and other inputs Control *Organization of commissioning team *Commissioning *Supervision of Guarantee Tests
*BMR Studies *Technical auditing *Preparation of proposals based on engineering fabrication of equipment *Construction Management
Chapter - 4 Page 14 of 21
Fig - 4.3

utilization of national R&D infrastructure; enhancing the scope of industrial
infrastructure for commercialization by advocating and developing PPPs, keeping
industrial peace; developing the scope and availability of various feedstocks;
protecting the environment; and setting quality standards for manufactured products
and systems. It is the integration of the various components of a NIS that determines
its effectiveness in accelerating technological transformation, knowledge acquisition,
generation, diffusion and application. The role of the government in the successful
utilization of various components of technology will depend on its ability to foster
PPPs with the involvement of industrial and venture capital institutions and a vibrant
entrepreneurial class in the implementation of its policies for development.
In order to attract investment capital, it is proposed that a Holding Company should
be established with the participation of the financial sector, international donors,
friends of Pakistan, overseas Pakistanis and other investors, who will be invited to
participate as share holders in this company.
4.5 Human Resource Development
The educational institutions of a country have the primary responsibility for
producing highly skilled labour for the smooth and efficient functioning of an
economy. High rates of enrolment at the tertiary level are crucial, in order to make
education relevant for the technological transformation of an economy and to
encourage R&D development. Other important factors are the relevance of curricula
to the needs of a market economy; the extent to which curricula reflect the breadth
and changes in different disciplines; emerging technologies such as new materials,
biotechnology, renewable resources of energy, micro-electronics, computer and
information technologies, and the technologies required in the development and
application of software and hardware used in the commercialization of chemical
processes. Unless the education system is geared towards equipping its graduates with
this knowledge, the NIS will remain constrained.
Chapter - 4 Page 15 of 21
It should also be recognized that an educational system which emphasizes practical
apprenticeship, and vocational and technological training, is far more relevant for
rapid technological development than the more academic and theoretical orientation
of other systems. The present trend in developed countries and NICs is to blend both
systems.
Another requirement is that the educational system should be geared to lifelong
learning in view of the rapid and continuous technological changes taking place in
globally. This can be accomplished if the industrial sector arranges company-level
training in a productive environment and imparts specific competencies. In addition,
the industrial sector and universities should be required to organize short-term
training programmes for working personnel every 3-4 years of their professional
careers, in order to keep their knowledge current and up-to-date. A NIS that organizes
this type of human resource development will facilitate company level innovation.
4.6 Integrated Plan for the Development of a National Innovation System
Technology is changing at a very fast rate and there is a renewal of technology in a 5-
6 year cycle. There is continual development of process technologies especially those
concerned with:
(i) New materials of construction which can withstand high temperatures,
pressures and a corrosive environment, as well as the production of
composite materials for the aerospace, automobile and transport industries.
(ii) New design methods in chemical, mechanical, electrical, instrumentation,
safety and environment engineering.
(iii) Production and manufacture of high reliability rotary equipment consisting
of compressors, pumps, turbines, generators, gas engines and capital plant
and equipment used in the chemical industry.
(iv) New methodologies introduced for the training of the labour force for the
operation and maintenance of plants utilized in the chemical industry.
Chapter - 4 Page 16 of 21

Chapter - 4 Page 17 of 21
(v) Complete computerization of plant design and operation.
Computational technologies have a broad range of applications, from molecular
modeling to process simulation and control. These technologies are embodied in
almost every aspect of chemical research, development, design and manufacture.
Those most critical to the development of the chemical industry include
computational science, computational fluid dynamics, process modeling, simulation,
operations optimization and control.
In view of these developments, the chemical industry faces enormous challenges. Six
major forces are shaping future developments in its business landscape. These are:
(i) Increasing globalization of markets.
(ii) Societal demand for higher environmental performance.
(iii) Financial market’s demand for increased profitability and productivity.
(iv) Higher customer expectations.
(v) Changing labour force requirements.
(iv) Higher quality standards.
The achievement of these objectives will require improvements in the design,
production and quality of chemical products, which will only be possible if Pakistan
develops an integrated plan by creating linkages between industry, research
institutions and universities. This will permit quantitative and qualitative
improvements in the development of the chemical industry.
An integrated plan for education, research and project management for the
commercialization of chemical processes is illustrated in Fig 4.4 and 4.5.

Development of Design and Engineering Infrastructure for Commercialization of Technologies
Project &
Product Identification
Locally Developed and/or Imported Technology and
know-how
Market Study.
Supply / Demand
Feedstock Study
And Availability
Tech-Economic Study And Project Approval
Design, Detailed Engineering, Plant & Equipment Specs. Preparation of Workshop
Drawings, Utility Plants & Material Specs..
Installation and Erection of Plant and Equipment
Mechanical Completion
Plant Commissioning and Commencement of
Commercial Production
Marketing and Consumer Acceptance
Local Fabrication of Plant
and Equipment
Training of Manpower
Procurement of Plant and Equipment from Foreign
Sources
Source of Finance Debt/Equity Ratio
Fig-4.4
Chapter - 4 Page 18 of 21

Chapter - 4 Page 19 of 21
An Integrated Plan For Education, Research
And Project Management For Commercialization Of Chemical Industry
Commercialization of Processes Engineering, Project Management Services,
Development of Project Packages
Selectio logy for n and Adoption of TechnoCommercialization.
Process and Plant Management Plant Operation, Management and
Marketing Management
Creation & Development of Linkages
New Processes / Technology
Consultancy Services Revamping and Modernization,
Optimization and Productivity Improvement
Industrial Survey Identification And Management of R&D Projects
Pilot Plant Studies at Universities, R&D Institutes and Industry
Selection and Adoption of Technologies for Commercialization
Commercialization of Processes
Assessment of Needs Human Resources Development
In Newly Emerging Technologies
Licensing of Process Technologies
(Local / Imported).
Engineering, Project Management Services, Development of Project
Packages
Fig – 4.5

An important factor which is responsible for the development of the chemical
industry is the expansion of domestic demand for consumer products. Various NIC’s
and developed countries raised the income of low wage employees in the
manufacturing sector and exerted upward pressures on agricultural wages. The
minimum wage policy has been instrumental in increasing domestic purchasing
power at the grass root level, and consequently in accelerating the pace industrial
development.
4.7 Industrial Master Plan
The past experience of NICs has shown that industrial policies based on a strategy of
dynamic comparative advantage played an important role in sustaining and promoting
their economic development. These countries offered a variety of incentives to
accelerate the development of their industrial sector, such as tax exemptions, reduced
corporate tax, the provision of cheap credit and tax benefits. They introduced
outward-oriented trade and industrial policies, which boosted their exports of high
value-added goods, resulting in strong economic performance.
It is important for the government of Pakistan to devise an Industrial Masterplan,
which outlines a strategy for the development and implementation of specific
chemical industry manufacturing sub-sectors. The Industrial Masterplan should
identify the country’s capabilities in various priority sub-sectors where it has
particular advantages, define policy measures and provide fiscal incentives to
promote investment. The pattern of incentives should include a variety of subsidies
and tax exemptions, credits to encourage increased spending on R&D and manpower
training. It should focus on factors such as investment in resources, industrial
linkages, the promotion of exports, investment in industrial and technology
infrastructure, human capital development and the efficient and relevant utilization of
science and technology.
Chapter - 4 Page 20 of 21

Chapter - 4 Page 21 of 21
Under the present political scenario it has become difficult to assemble capital
investment packages. Therefore, the private sector in Pakistan needs to have
increased access to external sources of funding, if it is to meet its investment needs.
In the absence of any state participation in private sector initiatives, the commercial
banking sector would be reluctant to participate in capital formation because of the
industrial risks involved. Therefore, state participation is imperative for promoting
economic development. In addition, other microeconomic and macroeconomic
policies need to be explored, in order to accelerate the pace of chemical industry
development.
Pakistan is beset with the “brain drain” of its highly qualified manpower, primarily
because of a lack of employment opportunities in the country. The development of a
NIS will require the services of tens of thousands of scientists, engineers,
technologists, economists and social scientists. Employment opportunities will arise if
a NIS is introduced, which should help to reverse this brain drain.
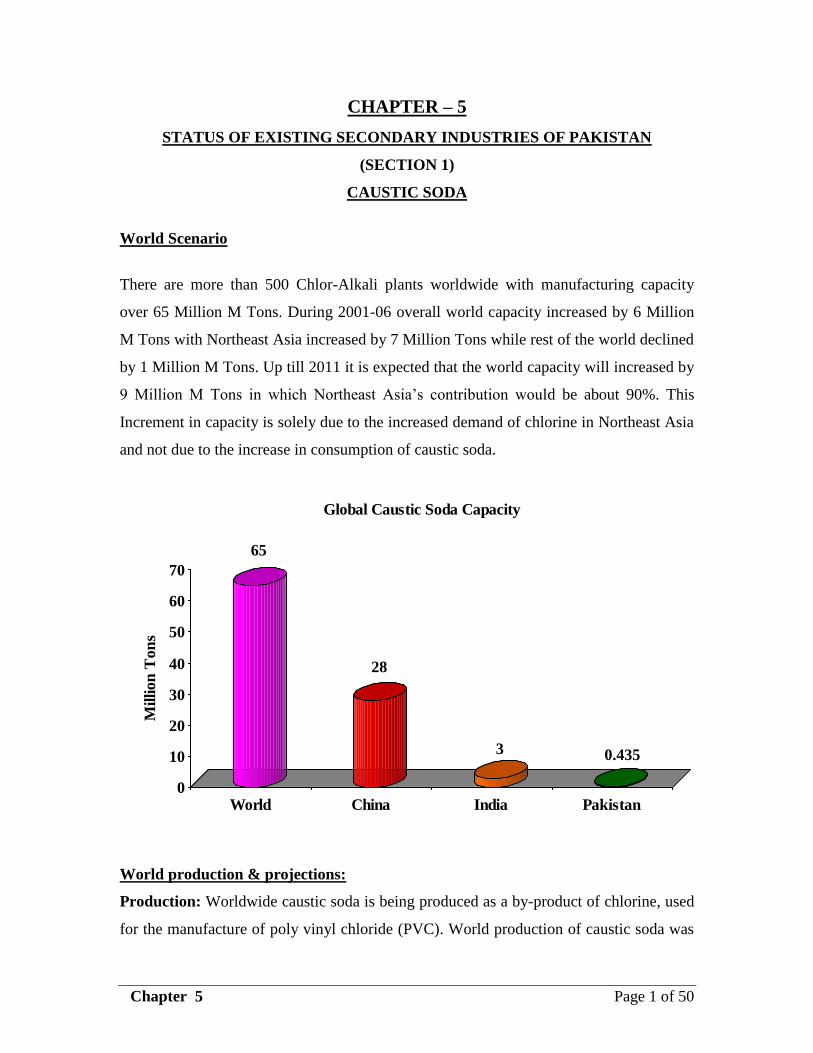
Chapter 5 Page 1 of 50
CHAPTER – 5
STATUS OF EXISTING SECONDARY INDUSTRIES OF PAKISTAN
(SECTION 1)
CAUSTIC SODA
World Scenario
There are more than 500 Chlor-Alkali plants worldwide with manufacturing capacity
over 65 Million M Tons. During 2001-06 overall world capacity increased by 6 Million
M Tons with Northeast Asia increased by 7 Million Tons while rest of the world declined
by 1 Million M Tons. Up till 2011 it is expected that the world capacity will increased by
9 Million M Tons in which Northeast Asia’s contribution would be about 90%. This
Increment in capacity is solely due to the increased demand of chlorine in Northeast Asia
and not due to the increase in consumption of caustic soda.
World production & projections:
Production: Worldwide caustic soda is being produced as a by-product of chlorine, used
for the manufacture of poly vinyl chloride (PVC). World production of caustic soda was
65
28
3 0.435
0
10
20
30
40
50
60
70
Million
Ton
s
World China India Pakistan
Global Caustic Soda Capacity

Chapter 5 Page 2 of 50
estimated to be 58.4 Million Tons in 2009 with an annual compound growth rate of
2.89%.
47.5 48.5 50.752.7 55.1 55.1
56.758.4
0
10
20
30
40
50
60
Mill
ion
To
ne
s
2002 2003 2004 2005 2006 2007 2008 2009
Year
World Production
Projections: Ever growing demand of PVC pushing caustic soda production and it is
estimated that it will grow with an ACGR of 2.8%.
62 63.9 65.867.8 69.8 71.9
7476.3
78.580.9
0
10
20
30
40
50
60
70
80
90
Mill
ion
To
nes
2011 2012 2013 2014 2015 2016 2017 2018 2019 2020
Year
World Projections

Chapter 5 Page 3 of 50
World Trade:
Of the 56.7 Million M. Tons caustic soda produced in 2008, 28% i.e. about 16 Million
M.Tons was traded, of which 90% was from China, Europe, USA, and Japan. About 93%
of the trade was in liquid form i.e. 50% solid contents.
World Trade
15.2
16.416.3
15.6
14.6
14.8
15
15.2
15.4
15.6
15.8
16
16.2
16.4
16.6
2005 2006 2007 2008Year
Mill
ion
To
ne
s
Prices
209231
319
190
0
50
100
150
200
250
300
350
2005 2006 2007 2008Year
US
$ /
M.T
on
s

Chapter 5 Page 4 of 50
Liquid Caustic Soda
Top 10 Exporters:
Total Exports = 13.5 Million Tons in 2008
'Qatar
3%
Other
15%
'Russian Federation
3%
'Netherlands
5%
'Belgium
5%
'Romania
4%
'Japan
10%'Chinese Taipei
11%
'China
12%
'United States of
America
14%
'Germany
18%
Top 10 Importers:
Total Imports = 15.1 Million Tons in 2008
'Sweden
3%
Others
38%
'Belgium
3%
'Canada
4%
'Jamaica
4%
'Austria
4%
'Netherlands
6%
'Finland
6%
'United States of
America
6%
'Brazil
12%
'Australia
14%

Chapter 5 Page 5 of 50
Solid Caustic Soda
Top 10 Exporters:
Total Exports = 1.02 Million Tons in 2008
'Germany
2%
Other
11%
'Saudi Arabia
3%
'Russian Federation
4%
'India
4%
'Spain
3%
'Thailand
4%
'United States of
America
6%
'Poland
7%
'Chinese Taipei
14%
'China
42%
Top 10 Importers:
Total Imports = 1.15 Million Tons in 2008
'Spain
2%
Others
61%
'Namibia
2%
'Italy
4%
'Brazil
3%
'Uzbekistan
3%
'Viet Nam
4%
'Nigeria
4%
'United States of
America
5%
'Bangladesh
5%'Belgium
7%

Chapter 5 Page 6 of 50
Sector wise Consumption:
Chemical sector is accounting for about 50% of caustic soda consumption with propylene
oxide 12%, Soap & detergents 5%, inorganic chemicals 5% and other organic chemicals
26%. Pulp & paper sector is consuming about 25% of the total caustic soda produced in
the world.
Caustic Soda - Sector wise consumption
Water
2%
Propylene oxide
12%
Alumina
2%
Petroleum
3%
Soap & Detergent
5%
inorganics
5%
Others
20%
Other organic
26%
Pulp & paper
25%

Chapter 5 Page 7 of 50
Pakistan scenario
Production Capacity
Presently, there are four plants with production capacity around 435,000 MTPY of
Caustic Soda. Engro Polymers has recently installed a new plant having name plat
capacity of 100,000 MTPY and Sitara Chemicals has enhanced its capacity from 129,000
MTPY to 180,000 in last year.
Source: Manufacturers
Caustic Soda - Production Capacities (MTPY, %) - 2010
Total = 435,000 MTPY
Nimir
Chemicals,
10,000, 2%
Engro
Polymaers,
100,000, 23%
Ittehad
Chemicals,
145,000, 33%
Sitara
Chemicals,
180,000, 42%

Chapter 5 Page 8 of 50
Local Market Size of Caustic Soda
Local consumption of the caustic soda was increased with a compound annual growth
rate of 7% from 2000-01 to 2007-08 and then declined by 4.5% because of recession in
the world market and decline in exports of textile sector. Electricity is a major cost
component in the manufacturing of caustic soda, account for about 60% of overall cost of
production. Existing energy (Electricity & Natural gas) crises are badly impacted the
local production. Local
production,
consumption, imports
and exports of caustic
soda of last nine years
are given below:
Source: Federal
Bureau of Statistics
Local Sector wise
Consumption
Alone textile sector of
Others, 4Vegetable Ghee
& Oil, 5
Oil & Gas, 6Textiles, 43
Soap &
Detergents, 19
Power Plant, 7
Pulp & Paper, 6
Fertilizer, 6
Carpet Industry,
4
Production, Consumption and Trade of Caustic Soda
145.5 151.1164.4
187.5206.7 199.4
242.2 248.3 244.3
149.7
179.8 186199
218 225.4245.3
258.7247.1
4.2
28.7 21.711.5 11.3
26
3.5 10.6 3
0 0 0.1 0.1 0.1 0 0.4 0.2 0.20
50
100
150
200
250
300
2000-01 2001-02 2002-03 2003-04 2004-05 2005-06 2006-07 2007-08 2008-09
'000' M
. T
on
s
Production Consumption Imports Exports

Chapter 5 Page 9 of 50
Pakistan is 43% of caustic soda consumption. Second major consumption is in the
manufacturing of soap & detergent contributes about 19%.
Future Prospects
Local demand of caustic soda was declined by 4.5% in 2008-09 because of decline in
exports of textile sector, after recession in the international market. It is expected that in
future conditions will improved and demand will grow at a rate of 7% demand of caustic
soda is expected to be expand to 350,000 MTPY in the next 5 years. After Engro’s new
investment Country have sufficient capacity to cater the local market and export surplus.
0
0.05
0.1
0.15
0.2
0.25
0.3
0.35
0.4
0.45
0.5
Millio
n T
on
s p
er A
nn
um
Capacity & Demand of Caustic Soda in Pakistan
Capacity Demand
Capacity 0.335 0.335 0.435 0.435 0.435 0.435 0.435 0.435 0.435 0.435 0.435 0.435 0.435
Demand 0.252 0.264 0.278 0.292 0.306 0.322 0.338 0.355 0.372 0.391 0.411 0.431 0.453
2007 2008 2009 2010 2011 2012 2013 2014 2015 2016 2017 2018 2019

Chapter 5 Page 10 of 50
SWOT Analysis
Strengths
1. Abundantly available raw materials in the country at low rates
Weaknesses
1. The Caustic Soda manufacturing produces chlorine as a by-product which has
limited usage in the country only Engro Polymers utilizing chlorine for the
manufacture of value added products i.e. PVC. While in the rest of the world
chlorine is the main driver for the plant and caustic soda is considered as a by-
product.
2. High cost of energy
3. Availability of natural gas and electricity
4. High freight cost to export surplus capacity
Threats
1. Dumping of Caustic Soda in the country
Opportunities
1. Surplus capacity of caustic soda available to export

Chapter 5 Page 11 of 50
TARIFF STRUCTURE OF CHLOR-ALKALI INDUSTRY
Electrolysis
Caustic Soda
2815.1100
20% (5%, SRO
567)
Hydrochloric
Acid
2806.1000
10%
Locally
ManufacturedImported
Chlorine
2801.1000
10%
Sodium
Chloride
2501.0020
20%
Sodium
Hypochlorite
2828.9000
5%
Bleaching
Powder
2828.1010
5%
Ammonium
Chloride
2827.1000
5% (0%, SRO
565)
Magnesium
Chloride
2827.3100
5%
Ferric Chloride
2827.3900
5%
Nickel Chloride
2827.3500
5% (0%, SRO
565)
Absorption
Reaction
Reaction
Reaction
Reaction
Reaction
Reaction
Caustic Soda
2815.1200
Rs. 4000/MT
(20%, SRO 565)
Water
Calcium
Chloride
2827.2000
5%
Acid Treatment
Hydrochloric Acid
Hydrochloric Acid
Hydrochloric Acid
Chlorine
Chlorine
Hydrochloric Acid
Chlorine
Lime Stone
2521.000
10%
Lime Stone
2521.000
10%
Ammonia
2814.1000
5%
Magnesite
2519.1000
5%
Iron Waste
7204.0000
0%
Nickel Waste
7503.0000
5%
Hydrochloric Acid
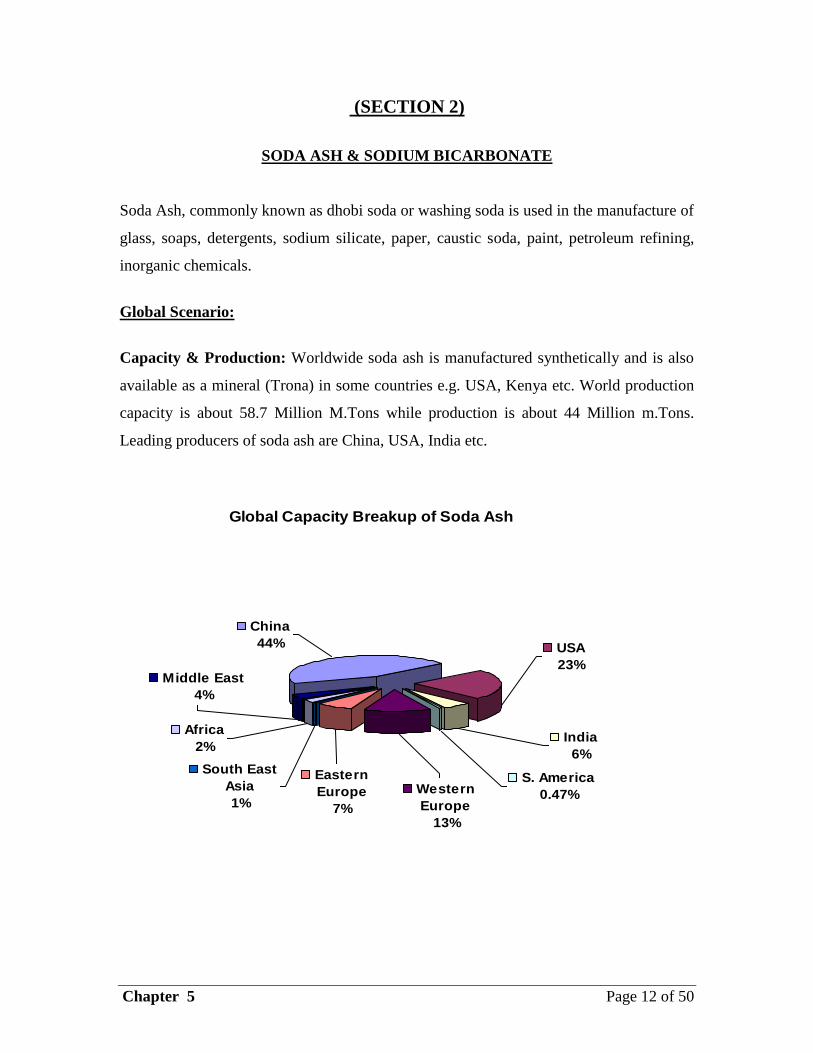
Chapter 5 Page 12 of 50
(SECTION 2)
SODA ASH & SODIUM BICARBONATE
Soda Ash, commonly known as dhobi soda or washing soda is used in the manufacture of
glass, soaps, detergents, sodium silicate, paper, caustic soda, paint, petroleum refining,
inorganic chemicals.
Global Scenario:
Capacity & Production: Worldwide soda ash is manufactured synthetically and is also
available as a mineral (Trona) in some countries e.g. USA, Kenya etc. World production
capacity is about 58.7 Million M.Tons while production is about 44 Million m.Tons.
Leading producers of soda ash are China, USA, India etc.
Global Capacity Breakup of Soda Ash
China
44% USA
23%
India
6%
S. America
0.47%Western
Europe
13%
Eastern
Europe
7%
South East
Asia
1%
Africa
2%
Middle East
4%

Chapter 5 Page 13 of 50
Global Production Breakup of Soda Ash
China
48%
USA
23%
India
5%
S. America
0.18%Western
Europe
12%
Eastern
Europe
6%
South East
Asia
1%
Africa
2%
Middle East
3%
Global Demand Breakup of Soda Ash
China
45%
USA
14%
India
7%
S. America
5.07%
Western
Europe
15%
Eastern
Europe
3%
South East
Asia
5%
Africa
2%
Middle East
4%
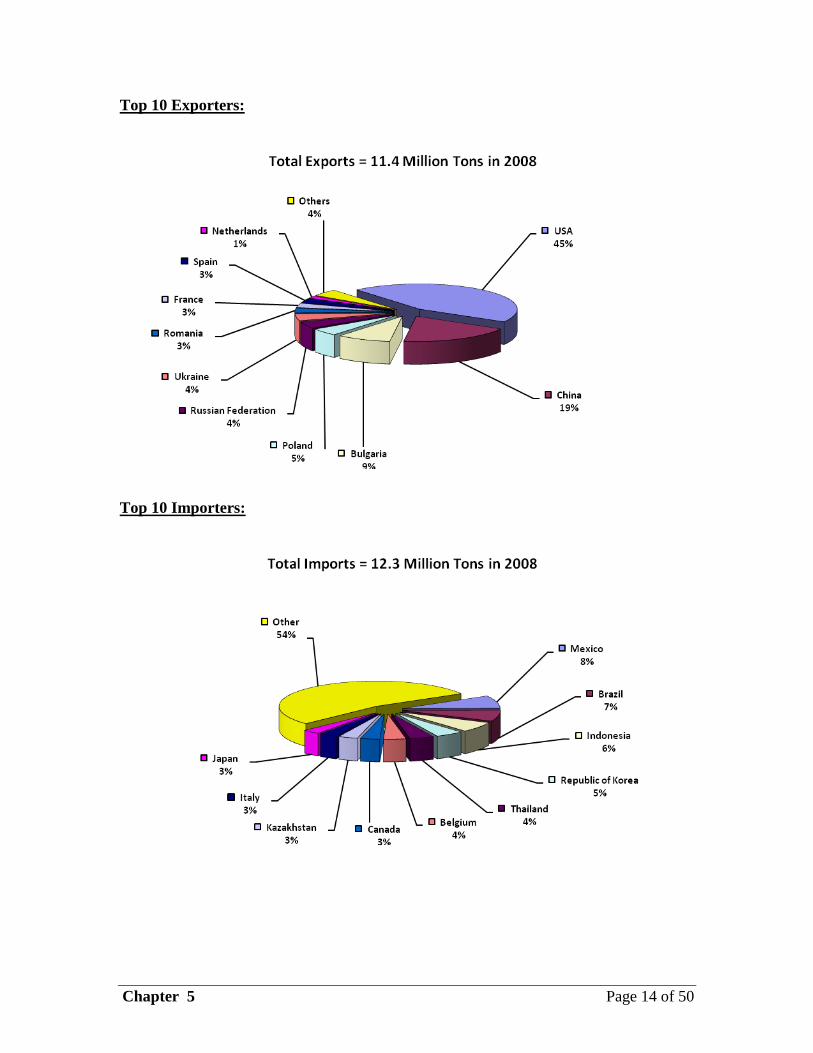
Chapter 5 Page 14 of 50
Top 10 Exporters:
Top 10 Importers:

Chapter 5 Page 15 of 50
Consumption Pattern
Globally, glass industry accounts for around 53% the total consumption of soda ash (see
table) followed by detergents & soap 13%, chemicals 11%, metal & mining 5% and
paper 1%.
Pakistan Scenario
Production Capacity
There are two Soda ash plants with production capacity of 470,000 MTPY. Both the
plants producing soda ash are located in the Salt Range area.
Source: Manufacturers
The Akzonobel
(former ICI) plant is
the oldest and largest
operating plant in
Pakistan. It was
established in 1944

Chapter 5 Page 16 of 50
with a capacity of 18,000 MTPY. The capacity has been progressively increased to
350,000 MTPY in 2009.
The Olympia Chemicals started operation in 2000 with a capacity of 40,000 MTPY
which has been increased now to 120,000 MTPY.
Local Market Size of Soda Ash
Production of soda ash in the country was about 218,000 M.Tons during 2000-01 which
has been increased to 365,000 M.Tons during 2008-09. Production increased from 2000-
01 to 2007-08 with an annual growth rate of 7.64% and stabilize there with a negligible
growth rate during 2008-09 even not impacted by the world economic crises.
Among the two local players Akzonobel has major share in the local market contributing
about 70%, share of Olympia Chemicals is about 28% and rest of the share i.e. 2% is of
imports. In 2005-06 imports of soda ash were about 54,000 M.Tons which has now been
decreased to about 9,000 M.Tons. On the other hand exports are on the rise and reached
about 11,000 M.Tons in 2008-09.

Chapter 5 Page 17 of 50
Consumption Pattern
Locally, glass & silicate industry accounts for around 43% of the total consumption of
soda ash (see table) followed by Bazzar (Detergent & textiles) 28%, detergents & soap
7%, chemicals 2, baking powder 9% and paper 11%.
Future Prospects
As mentioned earlier Pakistan’s existing production capacity of soda ash is about 470,000
MTPY while local market demand is about 364,000 and therefore has enough surplus
capacity about 106,000 M.Tons to export in regional and international market.
Sodium Bicarbonate (Baking Powder)
At Present, Akzonobel Pakistan and Olympia Chemicals has a combined capacity of
about 40,000 MTPY to produce Sodium Bicarbonate. Sindh Alkalis Karachi had a
capacity of 10,000 MTPY but the plant is not operating since 2000.

Chapter 5 Page 18 of 50
Local Market Size:
Sodium Bicarbonate is used in drugs manufacturing, bakery & food products and
beverages. Besides local production imports were also made in the recent years but are on
the decrease. Collective share of local manufacturers in the local market was about 79%
and share of import was 21%.
Future Prospects
Local manufacturers has sufficient capacity to cater all the local demand of sodium The
imports can be substituted through revival of Sindh Alkalis Plant or setting up of an
additional plant of same capacity.

Chapter 5 Page 19 of 50
TARIFF STRUCTURE OF SODA ASH INDUSTRY
Reaction
Soda Ash
2836.2000
10%
Calcium Chloride
2827.2000
5%
Locally
ManufacturedImported
Lime Stone
2521.0000
10%
Rock Salt
2501.0020
20%
Sodium
Bicarbonate
(Raw form)
Sodium
Bicarbonate
(Food Grade)
2836.3000
20%(10%, SRO
567)
Chapter 5 Page 20 of 50
SECTION -3)
PETROCHEMICALS
Petrochemicals have played a key role especially in the development of industrialized
economies e.g. USA, Canada, Japan, Saudi Arabia, Singapore, Malaysia, China, India
etc. In this era where traditional materials are too much costly petrochemicals provide
alternative and cheaper materials for the production of industrial and consumer products
that is why polymers are increasingly replacing metals, wood and other traditional
materials. Petrochemical industry is termed as one of the fastest growing industrial sub-
sector and has very well contributed to the objective of rapid progress and balanced
expansion of manufacturing sector.
Petrochemical products are broadly classified into two group i.e. basic and end-products.
The basic product group includes ethylene, propylene, butadiene and aromatics, while
the end-products include plastics, synthetic fibres and elastomers. The petrochemical
products offer to a large extent an ideal substitute for conventional materials such as
wood, metals, jute, natural rubber, etc. in which Pakistan is deficient. Therefore, there is
substantial scope for development of petrochemical industry in Pakistan.
At present, the petrochemical industry of Pakistan is limited to production of polyvinyl
chloride (backward integration to produce EDC and VCM is in process and will be
completed by 2009), synthetic fibers, i.e. polyester, polyamide, aromatics (Benzene,
Toluene, Xylene), Purified Terephthalic Acid (PTA), Phthalic Anhydride and carbon
black.
During last three decades repeated efforts have been made to develop a project capable of
producing basic petrochemicals. In this connection numerous studies have been carried
out for production of basic petrochemicals i.e. ethylene, propylene, etc. utilizing the
alternate feed stocks i.e. naphtha, associated gases (ethane, propane), natural gas and
molasses (a by product of sugar industry). However, despite interest and efforts no

Chapter 5 Page 21 of 50
significant development has taken place as far as production of basic petrochemicals are
concerned.
The factors responsible for non-development of basic petrochemical industry include:
High capacity of world scale basic petrochemical production facilities
Complexity and high level of the technology involved
High level of capital outlay required
Market size limitations vis-à-vis world scale plants
Pakistan has no facility to produce basic petrochemicals like Ethylene, Propylene,
Butadiene, Styrene, etc. and they are being imported in bulk. Out of long list of
petrochemicals, only few are being produced locally. They include Pure Terephthalic
Acid (PTA), BTX and carbon black.
Petrochemicals provide raw materials for plastics, detergents, dyes, paints & varnishes
and pesticides etc. They are also used as additives in the lubricating oils. Most of the
specialty and fine chemicals belong to the petrochemical group. Their production and
marketing is monopolized by few global giants.
Historically, polyvinyl chloride and polyethylene are the only thermo plastic materials
which have been produced in the country. These plants were setup in 1960s. The
polyethylene plant was closed down in 1970s.
Apart from PVC, polystyrene is also being produced by Pak Petrochemical Industries
(Private) Limited. The polystyrene plant uses imported styrene and is capable of
producing around 40,000 metric tons of various grades of polystyrene.
Consumption
Among the plastic materials the thermoplastics consumption of the country has reached a
sizeable level. Thermoplastics are the family of plastics formed by addition of

Chapter 5 Page 22 of 50
polymerization which can be reshaped by application of heat. The description and major
end-uses of major thermo plastics being consumed in Pakistan are given below:
Thermoplastics consumption of the country has reached a sizeable level as the
consumption in 2006-07 was around 665,000 M.Tons which has been decreased to
500,000 M.Tons in 2008-09 due to hike in the prices of petroleum.
The trend of thermoplastics consumption during 2001 - 2009 is presented in the
following
diagram.
Material Brief Description Major End Uses
Polyethylene
(PE)
A semi crystalline lightweight
thermoplastic.
Household articles,
packaging, bottles,
containers and pipes.
Polypropylene
(PP)
A thermoplastic with low specific
gravity, high stiffness and good
tensile strength.
Woven bags/cloth,
household articles,
furniture, industrial items
and packaging.
Polyvinyl
Chloride (PVC)
A colorless rigid material with limited
heat stability with a tendency to
adhere to metallic surface when
heated.
Pipes & fittings, wire and
cables, footwear.
Polystyrene (PS) A hard, rigid transparent
thermoplastic with low specific
gravity.
Electronic, electrical items,
household articles/
appliances and packaging.

Chapter 5 Page 23 of 50
Thermoplastic Consumption Trend
0
50
100
150
200
250
300
'000' M. Tons
Polyethylene (P.E) 155 157 192 220 232 275 274 267 198.6
Polypropylene (P.P) 110 144 142 165 188 225 219 210 156.2
Polyvinyl Chloride
(P.V.C)
84 87 92 88 91 97 132 23.6 23.56
Polystyrene (P.S) 11 9 14 15 15 16 16 118.4 121.9
2000-
01
2001-
02
2002-
03
2003-
04
2004-
05
2005-
06
2006-
07
2007-
08
2008-
09
PE is the leading material being consumed with a share of 40% in country’s
thermoplastics consumption. PP and PVC enjoyed shares of 31% and 24% respectively.
The consumption of PS is relatively small i.e. 5% in country’s thermoplastics
consumption.
Product wise share of Thermoplastics
500,000 M.Tons in 2008-09
Polypropylene
31%
Polystyrene
5%
Polyvinyl Chloride
24% Polyethylene
40%
Polyethylene (PE)
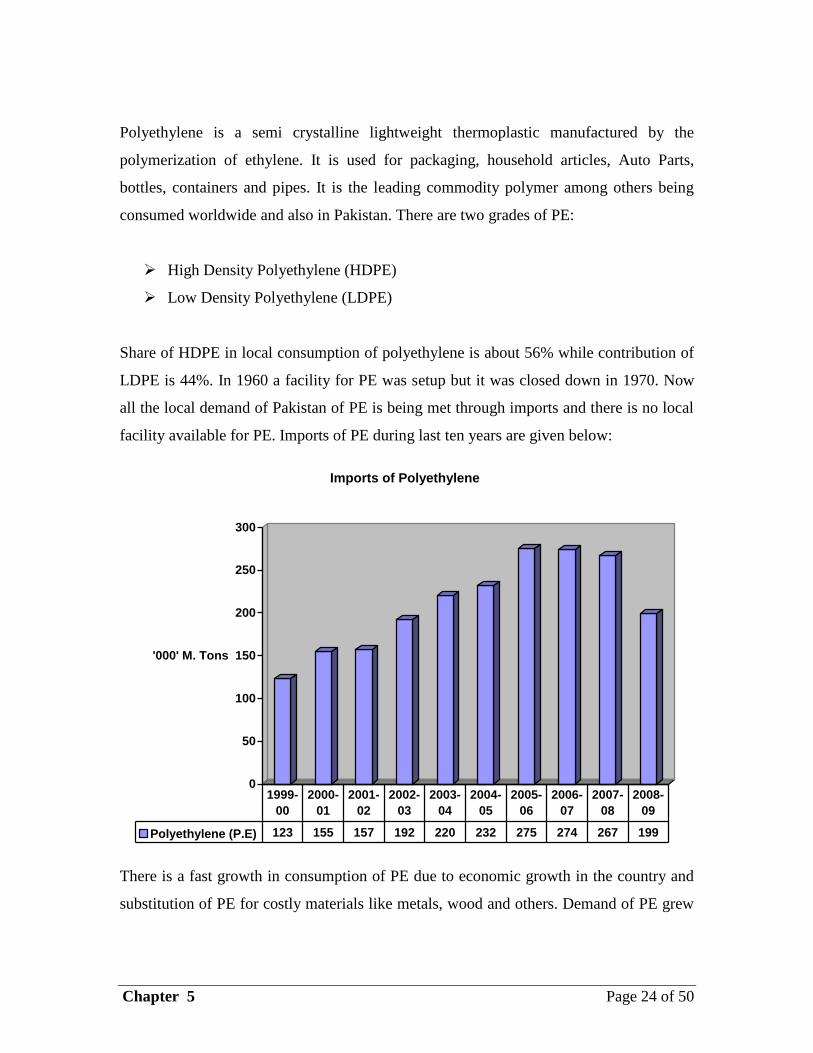
Chapter 5 Page 24 of 50
Polyethylene is a semi crystalline lightweight thermoplastic manufactured by the
polymerization of ethylene. It is used for packaging, household articles, Auto Parts,
bottles, containers and pipes. It is the leading commodity polymer among others being
consumed worldwide and also in Pakistan. There are two grades of PE:
High Density Polyethylene (HDPE)
Low Density Polyethylene (LDPE)
Share of HDPE in local consumption of polyethylene is about 56% while contribution of
LDPE is 44%. In 1960 a facility for PE was setup but it was closed down in 1970. Now
all the local demand of Pakistan of PE is being met through imports and there is no local
facility available for PE. Imports of PE during last ten years are given below:
0
50
100
150
200
250
300
'000' M. Tons
Imports of Polyethylene
Polyethylene (P.E) 123 155 157 192 220 232 275 274 267 199
1999-
00
2000-
01
2001-
02
2002-
03
2003-
04
2004-
05
2005-
06
2006-
07
2007-
08
2008-
09
There is a fast growth in consumption of PE due to economic growth in the country and
substitution of PE for costly materials like metals, wood and others. Demand of PE grew

Chapter 5 Page 25 of 50
about 9% annually from 2002-03 to 2006-07 and after that it declined to about 198,640
M.Tons due to sharp rise in international prices.
The price trend of polyethylene is shown in the graph given below. During last six years
the prices has been increased by 123% due to the hike in the crude oil prices.
0
20
40
60
80
100
120
140
160
Rs./ Kg
Price Trend of Imported Polyethylene
Polyethylene (P.E) 35 40 40 60 64 78 95 146
2001-
02
2002-
03
2003-
04
2004-
05
2005-
06
2006-
07
2007-
08
2008-
09
G
lobal demand of polyethylene is growing at a rate of more than 4% per annum and it was
about 50 Million Metric Tons in 2003. Per capita consumption in the world is given in
graph:
0
10
20
30
40
50
Kg Per Capita
Per Capita Consumption of Polyethylene
1997 34 27 6 23 3.5 0.8 3 21 0.75 8
2003 45 34 7 25 6 1.5 2.5 22 1.51 10
N.
Ameri
W.
Europ
Africa/
M. Japan China India
Indone
sia
Malay
sia
Pakist
anWorld

Chapter 5 Page 26 of 50
Transpolymer Pvt. Limited a foreign investor is interested in investing for the
development of local facility for Polyethylene and Polypropylene. The project is at its
initial stages.
Breakup of imports of different grades of Polyethylene i.e. HDPE and LDPE are given
below:
0
20
40
60
80
100
120
140
160
'000' M. Tons
Import of High and Low Density Polyethylene
High Density P.E 67 90 80 106 120 126 147 153 159 101
Low Density P.E 56 65 76 86 99 105 128 121 108 98
1999-
00
2000-
01
2001-
02
2002-
03
2003-
04
2004-
05
2005-
06
2006-
07
2007-
08
2008-
09
This graph shows that decline in import of PE after the year 2006-07 which was solely
due to hike in the prices of crude oil in international market.
Polypropylene (PP)
PP is the second largest thermoplastics being consumed in the country. Its primary use is
in Woven bags/cloth, household articles, furniture, industrial items and packaging like
Chemicals, Fertilizers and Textile Industries.
PP consumption was 65,169 M. Tons in 1996-97 which has been increased to 218,799 M.
Tons with an annual growth rate of 15% in 2006-07 afterward it declines mainly due to
sharp rise in prices of petroleum. The consumption of polypropylene during last ten years

Chapter 5 Page 27 of 50
is given in the graph shown
:
0
50
100
150
200
250
'000' M. Tons
Imports of Polypropylene
Polypropylene (P.P) 102 110 144 142 165 188 225 219 210 156
1999-
00
2000-
01
2001-
02
2002-
03
2003-
04
2004-
05
2005-
06
2006-
07
2007-
08
2008-
09
The price trend of imported polypropylene is given in the below.
0
20
40
60
80
100
120
140
Rs./ Kg
Price Trend of Imported Polypropylene
Polypropylene (P.P) 33 37 42 60 64 78 94.5 137.3
2001-
02
2002-
03
2003-
04
2004-
05
2005-
06
2006-
07
2007-
08
2008-
09
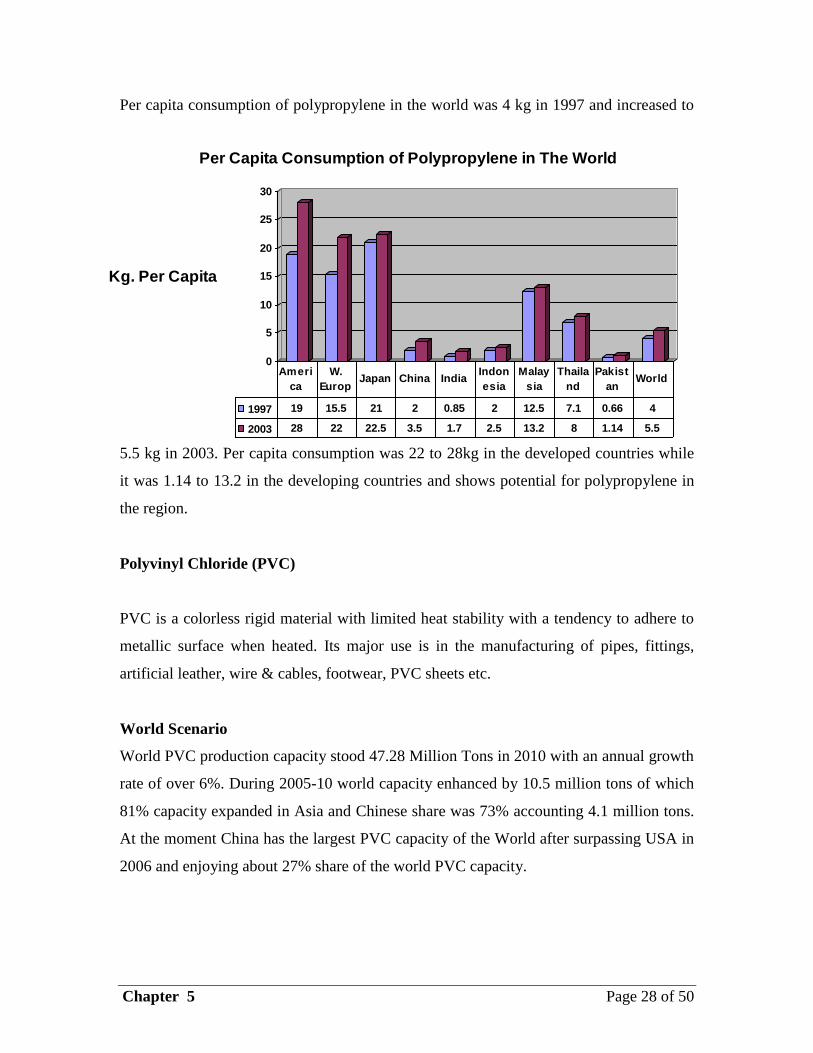
Chapter 5 Page 28 of 50
Per capita consumption of polypropylene in the world was 4 kg in 1997 and increased to
5.5 kg in 2003. Per capita consumption was 22 to 28kg in the developed countries while
it was 1.14 to 13.2 in the developing countries and shows potential for polypropylene in
the region.
Polyvinyl Chloride (PVC)
PVC is a colorless rigid material with limited heat stability with a tendency to adhere to
metallic surface when heated. Its major use is in the manufacturing of pipes, fittings,
artificial leather, wire & cables, footwear, PVC sheets etc.
World Scenario
World PVC production capacity stood 47.28 Million Tons in 2010 with an annual growth
rate of over 6%. During 2005-10 world capacity enhanced by 10.5 million tons of which
81% capacity expanded in Asia and Chinese share was 73% accounting 4.1 million tons.
At the moment China has the largest PVC capacity of the World after surpassing USA in
2006 and enjoying about 27% share of the world PVC capacity.
0
5
10
15
20
25
30
Kg. Per Capita
Per Capita Consumption of Polypropylene in The World
1997 19 15.5 21 2 0.85 2 12.5 7.1 0.66 4
2003 28 22 22.5 3.5 1.7 2.5 13.2 8 1.14 5.5
Ameri
ca
W.
EuropJapan China India
Indon
esia
Malay
sia
Thaila
nd
Pakist
anWorld

Chapter 5 Page 29 of 50
13
7.56.7 1
2.6
20
86.9 1.1
2.7
34
98
2
30
5
10
15
20
25
30
35
Million M.
Tons
2001 2005 2010
World Capacities by Region
Asia Europe N. America Middle East Others
Asian PVC capacity is growing at a fast rate of over 14% per annum because of the fast
economic growth in the region. It is estimated that the world PVC capacity will reach
about 53.55 Million Tons in 2014 which was about 37 Million Tons in 2005. About 89%
of this additional capacity will be installed in Asia. The graph representing the
distribution future expansions in PVC capacities is given below:

Chapter 5 Page 30 of 50
Asia
89%
Europe
4%
China
91%
India
6%
Other Asia
4%
Middle East
3%Other
6%
World PVC Capacity Expansion
(2005-10)
In 2009 about 31.35 million tons of PVC was produced and the capacity utilization was
about 71%. World production of PVC by regions is given
below.
PVC Production by Region
9.3 9.4 9.9 10.8 12.2 12.9
7.0 6.9 7.27.2
7.6 7.8
5.6 6.0 6.1 6.06.1 6.23.9 3.9
3.9 4.04.1
4.2
0.0
5.0
10.0
15.0
20.0
25.0
30.0
35.0
2000 2001 2002 2003 2004 2005
Million M. Tons
Asia North America western Europe others
In 2005 Asia was leading producer of PVC while North America and Western Europe are

Chapter 5 Page 31 of 50
at second and third position respectively. Share of Asia in world production was about
35%.
Price trend of last 7 years of PVC in Asia is depicted in the graph which shows a cyclical
trend like other plastics.
0
100
200
300
400
500
600
700
800
US $ per
M. Tons
Price Trend of PVC in Asia
Asia 550 680 400 500 560 800 760
1999 2000 2001 2002 2003 2004 2005
Production cost of PVC was lowest 200 $/M. ton in Middle East because of availability
of cheaper raw material and highest in America i.e. 305 $/m. ton during 2005.
Comparison of production cost in different countries is depicted below.

Chapter 5 Page 32 of 50
0
50
100
150
200
250
300
350
US $ per M.
Tons
Production Cost of PVC (2005)
Production Cost 200 240 270 280 290 305
Middle
EastBrazil
W.
EuropeChina Japan USA
The average on stream PVC plant sizes is given in the graph below:
0
50
100
150
200
250
300
350
'000' M. Tons
Average PVC Plant Size in World
Plant Size 347 200 160 159 149 118 117 101
N.
Americ
W.
Europe
Middle
East
Latin
AmericWorld
E.
EuropeAsia Africa
World average size of PVC plant was 149,000 m. tons in 2005. North America with
347,000 tons had the greatest average PVC plant size followed by Western Europe,
Middle East, Latin America, Asia and Africa.

Chapter 5 Page 33 of 50
0
50
100
150
200
250
300
350
'000' M. Tons
Average PVC Plant Size in Asia
Plant Size 117 97 160 135 100 118 285 327
Asia ChinaAsia Exc.
ChinaJapan Pakistan India Taiwan
South
Korea
In Asia South Korea has the largest average PVC plant size while smallest average size is
in China because in china about 60% capacity is based on acetylene route.
Pakistan Scenario
Engro Asahi Polymers (EAPCL) the only facility available in Pakistan for PVC
manufacturing was commissioned in 1999 at Port Qasim, Karachi. The plant capacity
was enhanced to 150,000 metric tons in 2009 for the manufacture of various grades of
PVC. They had also installed the facilities of Vinyl Chloride Monomer (VCM) / Ethylene
dichloride (EDC) through backward integration based on ethylene as a feedstock.
PVC consumption has also increased at a reasonably high growth rate i.e. 8 % per annum
much lower than the regional growth rate of 14%. During last 9 years, the total PVC
consumption has been increased from 84,380 M. Tons, in 2000-01 to 121,900 M. Tons in
2008-09. And per capita consumption of PVC has reached 0.73 kg in 2008-09 from 0.61
kg in 2000-01.
Local production, import, export and local market size of PVC is given in the graph
shown below.

Chapter 5 Page 34 of 50
Local Market Size of PVC
0
20
40
60
80
100
120
140'0
00
' M
. T
on
s
Import 19.3 18.7 20.3 19.7 18.1 27.3 37.2 18.7 9.8
Export 0 0 11.5 22.2 13.9 20 0.2 1.4 6.6
Production 65.1 68.6 83.6 90.3 87 90 95 101.1 118.7
Local Market Size 84.4 87.3 92.4 87.8 91.3 97.3 131.9 118.4 121.9
2000-
01
2001-
02
2002-
03
2003-
04
2004-
05
2005-
06
2006-
07
2007-
08
2008-
09
Sector Wise Consumption:
Single major consumption of PVC in Pakistan is in pipes & fittings account for about
58%, second largest is in film 13%
Sector Wise Consumption of PVC - 2009
Rigid sheet
5%
Twist / Shrink /
Film
13%
Artificial
Leather
1%
Garden Hose
8%
Compounding
8%
Shoes
4%Others
3%
Pipes & Fittings
58%
This project hopefully will come into production by the end of 2009.

Chapter 5 Page 35 of 50
Sitara Chemicals (Pvt) Limited major producer of caustic soda in Pakistan was also
planning for the installation of 45,000 TPA PVC plant based on calcium carbide route to
utilize in house chlorine.
After the completion of this project PVC’s capacity of Pakistan will be about 195,000
TPA and surplus PVC will be available for export purposes.
Future PVC Production Capacities of Pakistan
195,000 MTPY
Sitara
23%
Engro
77%

Chapter 5 Page 36 of 50
Ethylene2901.2100
(5%)
Chlorine2801.1000
(10%)
Ethylene Dichloride (EDC)2903.1500 (5%, 0% SRO 565)
Vinyl Chloride Monomer (VCM)2903.2100 (5%, 0% SRO 565)
Poly Vinyl Chloride (PVC)3904.1090
(10%)
PVC Pipes3917.2390 (20%)
PVC Sheets3920.4300 (25%)
3920.4910 (25%)
3920.4990 (25%)
PVC
Compound3904.2200 (20%)
PVC Artificial
Leather5903.1000 (25%)
PVC Shoes6402.2000 (25%)
6402.9900(25%)
PVC Flooring5904.1000 (25%)
PVC Industry Tariff Structure
Locally
Manufactured
Not Locally
ManufacturedUnder Process
Up-
stream
Mid-
stream
Down-
stream

Chapter 5 Page 37 of 50
Polystyrene (PS)
PS is the most versatile product and is being consumed in variety of products ranging
from electrical/electronics accessories, parts of sanitary wares and for packaging
purposes.
There is only one company Pakpetro Chemicals in Pakistan manufacturing all grades of
polystyrene and not only meeting the local demand but also exporting. Production
capacity of all types of polystyrene (PS) is 39,000 M.Tons out of which 30,000 M.Tons is
of expansible polystyrene (EPS) and 9,000 M.Tons of both general purpose polystyrene
(GPPS) & high impact polystyrene (HIPS).
PS consumption on the average remains about 24,500 M.Tons during last six years. Local
market size, Production, import and export of polystyrene is given in above graph.
Local Market Size of Polystyrene
0
5,000
10,000
15,000
20,000
25,000
30,000
M. Tons
Production 25,931 25,787 27,627 25,036 25,950 24,701
Imports 7,329 5,503 5,628 5,073 4,844 3,515
Exports 6,261 10,102 8,011 7,178 7,149 4,658
Local Market
Size
26,999 21,188 25,244 22,931 23,645 23,558
2003-
04
2004-
05
2005-
06
2006-
07
2007-
08
2008-
09

Chapter 5 Page 38 of 50
(SECTION 1V)
Inorganic Acids
Sulfuric Acid
Sulfuric acid is an important basic chemical. Its demand is taken as a barometer of
industrialization. It is a substance of great commercial importance and is used in
manufacture of fertilizers, other acids, heavy chemicals, dyes & pigments, lacquers,
plastics, explosives, textile, paints, leather tanning, oil refining, water treatment,
treatment of cotton seeds and other chemicals. It is generally marketed with 98%
concentration.
The largest single use, about 65% of the sulfuric acid produced annually, is in the
production of agricultural fertilizers, both phosphates and ammonium sulfate. Other uses
include production of:
In addition, sulfuric acid is used in:
Metal processing and refining
Electroplating baths
Water treatment, to adjust pH and to control corrosion and scaling
Petroleum refining (alkylation) of high-quality, high-octane gasoline components
Pickling (cleaning) iron and steel before plating with tin or zinc
Rayon
Dyes
Alcohols
Plastics
Rubber
Ether
Glue
Film
Explosives
Drugs
Paints
Food containers
Wood preservative
Soaps and Detergents
Pharmaceutical products
Petroleum products
Pulp and paper

Chapter 5 Page 39 of 50
Production Units & Capacity
S.# Plant Name Capacity
MTPD MTPY
1 Acid Ind. Pvt. Ltd. Karachi 80 26,400
2 Amber Chemicals, Hattar 50 16,500
3 Ata Chemicals, Multan 100 33,000
4 Attock Chemicals, Hattar 80 26,400
5 Crescent Chemicals, Sukkur 40 13,200
6 Exide Pakistan limited, Karachi 70 23,100
7
Faras Combine Marketing Company (Pvt) Ltd. Bhai
Pheru 300 99,000
8 Fazal Chemicals, Lahore 100 33,000
9 Hazara Phosphate, Haripur 110 36,300
10 Ittehad Chemicals, Lahore 40 13,200
11 Karsaz Chemicals, Lahore 10 3,300
12 Al-Hamd Chemicals & Fertilizers, Jaranawala 100 33,000
13 Margala Industries, Hattar 20 6,600
14 PAEC, D. G. Khan 25 8,250
15 Pak Chemicals, Karachi 80 26,400
16 POF, Wah Cantt. 10 3,300
17 Prime Chemicals, Sheikhupura 30 9,900
18 Rawal Chemicals, Hattar 25 8,250
19 Rawal Chemicals, Sheikhupura 30 10,000
20 Raiwind Chemicals (Pvt.) Ltd., Karachi 100 33,000
21 Riaz Aslam Chemicals, Chunian 20 6,600
22 Shafiq Industrial Chemicals, Karachi 35 11,550
23 Tufail Chemicals, Lahore 50 16,500
Total: 1,505 496,750
*Mainly for SSP Production
Total sulfuric acid production capacity is 496,750 ton per year. Presently, the installed
capacity is surplus to the local demand.
Production from few sulfuric acid plants is reported to the Federal Bureau of Statistics.
Thus it does not represent the actual total production in the country. It is always very

Chapter 5 Page 40 of 50
important to know the actual production of sulfuric acid as it represents the health of the
industry in the country.
The reported production of sulfuric acid by FBS and estimated production and market
size is given below.
Sulfuric Acid Market Size
Units Source 2001-2002
2002-2003
2003-2004
2004-05
2005-06
2006-07
2007-08
2008-09
Capaity 222,300 222,300 333,650 333,650 396,000 396,000 396,000 396,000
Production FBS 59,420 55,997 68,380 91,299 95,580 94,941 102,773 97,802
Production Estimated 59,379 63,104 109,206 157,189 172,440 190,427 212,472 234,567
Imports FBS 5.7 154 66.3 61.5 9.95 44.6 3 30.5
Exports FBS 472 483 430 786.3 937.5 63 3535
Market size FBS 59,426 55,679 67,963 90,931 94,804 94,048 102,713 94,298
Market size Estimated 59,385 62,786 108,789 156,820 171,664 189,534 212,412 231,063
Source: Federal Bureau of Statistics
Manufacturers

Chapter 5 Page 41 of 50
Hydrochloric Acid
It is used
In the manufacture of phosphoric acid, chlorine dioxide, ammonium chloride, fertilizers,
dyes, and artificial silk and pigments for paints.
As a refining ore in the production of tin and tantalum, as a lab reagent, and as a metal
treating agent.
To remove scale and dust from boilers and heat exchange equipment, to clean membranes
in desalination plants, to increase oil well output, to prepare synthetic rubber products by
treating isoprene, and to clean and prepare other metals for coatings.
In the neutralization of waste streams, the recovery of zinc from galvanized iron scrap.
In production of chemicals, i.e. production of vinyl chloride from acetylene and alkyl
chlorides from olefins, the manufacture of sodium glutamate and gelatin, the conversion
of cornstarch to syrup, sugar refining, electroplating, soap refining, leather tanning, and
the photographic, textile, brewing, and rubber industries.
As an antiseptic in toilet bowls against animal pathogenic bacteria, and in food
processing as a starch modifier.
Production Capacity
Ittehad Chemicals and Sitara Chemicals produce hydrochloric acid on demand from the
excess chlorine by-product available with them. The production capacities for both the plants
are sufficient to meet the local demand and the imports are generally negligible.

Chapter 5 Page 42 of 50
Nitric Acid
Nitric Acid is very important for certain types of reactions and uses especially in the
fertilizer and explosives industries. The principle use for nitric acid is the production of
fertilizers, explosives, flares, and rocket propellants. In making explosives, Nitric Acids
react with toluene in the presence of sulfuric acid to form trinitrotoluene (TNT).
Raw Materials & Processes
The raw materials are ammonia, air and fresh water. There are three stages in the
production of nitric acid.
o Oxidation of ammonia,
o Oxidation of nitrogen monoxide
o Absorption of nitrogen dioxide in water.
Production Capacity
Nitric acid is produced by Pak-Arab Fertilizers, Multan for the production of Calcium
Ammonium Nitrate (CAN) fertilizers and POF wah for explosives such as Nitroglycerine
& Nitrotoluene production. The local demand is met through imports and surplus
production of above two units.
Unit Production Capacity, MTPY
Pak-Arab, Multan 455,600
POF, Wah Cantt 10,000
Total 465,600

Chapter 5 Page 43 of 50
(SECTION V)
Dyes & Pigments
Dyes are intensely colored substances used for the coloration of various substrates
including paper, leather, fur, hair, foods, drugs, cosmetics, waxes, greases, petroleum
products, plastics and textile materials. They are retained in these items by physical
adsorption, salt or metal complex formation, solutions mechanical retentions or by the
formation of covalent bonds.
Dyes are applied to textile fibers by two distinct processes, dyeing and printing, of which
dyeing is much more extensively used. Dyes are classified in accordance with their
chemical constitutions or their application method or coloring purposes.
Pigments, although both have the same purpose of imparting color to the article, are
differentiated from the dyes. Pigments are finely ground, insoluble particles that disperse
in the liquid portion of the paint. Dyes are generally “fast” which means they can
maintain their color throughout exposure to weathering effects like rain, wind & snow,
and normal wear & tear. Pigments are used to give desired color and gloss. Plus provide
“hiding ability” and surface protection. They are selected by characteristics such as
color, hardness, oil absorption, density, pH, refractive index, hiding efficiency and
opacity.
Titanium dioxide (Tio2) is the most commonly used pigment worldwide. It has a high
refractive index (second only to diamond) and when produced at the proper particle size,
allows for a large opacity. For the record, magnesium oxide, MgO, is whiter than TiO2,
but it does not have a high refractive index. This means that more MgO would be needed
to achieve the same opacity as TiO2.
Color pigments, on the other hand, have a large variety of ingredients. This is, of course,
due to the fact that there are so many different colors available that can give different
compositions of these, which can create the huge variety of colors possible.

Chapter 5 Page 44 of 50
Raw Materials
Raw materials for Dyes & Pigments are totally derived from petrochemical Building
Blocks. Manufacturing of dyestuff can be done either by processing dye intermediates or
by starting from basic chemicals (organic and inorganic chemicals). For instance
manufacture of technology intensive vat dyes involves lengthy and distinct stages, which
in many cases may run through ten or twelve intermediates. Therefore it follows that a
good base of raw materials is critical to the success of the dyestuff unit. Hence a dyestuff
manufacturing unit has to rely on a mix of local supplies as well as imports for its
requirement of raw materials.
World Scenario
Traditionally Dyes & Pigments manufacturing was concentrated in Europe because of
development and progress made by Germany in this field at the start of 20th
century. This
high-Tech industry was limited to 7 or 8 major producers like BASF, Hoechst, Sandoz,
Bayer, ICI, Ciba-Geigy etc. up to the middle of 20th
century. However in the later half of
20th
century, major changes in the industry came up with the above multinational
companies, opening production sites out side Europe like in India, in Far-East, Japan,
USA etc.
This opened the secret technology to rest of the World and the decades of 70’s & 80’s
saw a mushroom growth in this industry, mainly in Far-East, India & China. The
environmental hazards involved in dyestuff manufacturing also pushes world wide
players to prefer import of dyes from developing countries. Another reason for this
change was the shifting of Textile Processing Industry from Europe & USA to Far East
and South East Asia.
Regional Scenario
Today China, India, Pakistan, Taiwan, Korea, Indonesia, Japan contributing about 70-
75% of world production of Dyes & Pigment. About 85-90% of raw materials, required
for Dyes & Pigments manufacturing, are produced by India & China.
A strong industrial base when formed for finished dyestuffs & pigments manufacturing
in China & India, brought a huge backward integration for manufacturing of basic raw

Chapter 5 Page 45 of 50
material called intermediates for this industry. Today India & China are top producers
and exporters of Dyes & Pigments intermediates.
India’s dye industry makes every type of dyes & Pigments. Production of dyestuff &
Pigment in India is around 75,000 tonnes. Traditionally the industry exports the 50% of
its production. The world market for dyes, intermediates and pigments is estimated to be
around US$ 23 billion and is growing at a rate of about 2%. The current share of India in
the global dyestuff market is around 2.5%. India is the second largest exporter of
dyestuffs and intermediates amongst developing countries after China.
Per capita consumption of dyestuffs in India, like most of the developing countries, is as
low as 50 grams against world average of 200 grams. Increasing middle class population
will stimulate demand for textiles, which in turn will accelerate the growth of dyes.
Pakistan Scenario
Pakistan although entered very late in this area and in early 60’s with manufacturing of
some Direct Dyes & Sulphur Dyes in the government owned corporation at Dawood
Khel. However this facility could not flourished due to unavoidable reasons. Clariant
Pakistan and Sandal Dyestuff are major manufacturers of dyes & pigments in Pakistan.
Dyestuffs Business and Textile Industry
The Pakistan textile industry is traditionally based on the manufacture and export
of spinning yarn and threads. Today around two hundred large and medium sized
processing mills exist along with thousands of small dye houses. It is estimated that this
industry consumes over 22,000 tons of dyestuff and pigments annually. The shares of
different type of dyes consumed are given as follows:
o Reactive dyes 34.27 % o Disperse dyes 15.00 %
o Acid dyes 09.00 % o Sulfur dyes 07.65 %
o Basic dyes 05.77 % o Direct dyes 03.07 %
o Vat dyes 02.24 % o Pigments 23.00 %

Chapter 5 Page 46 of 50
Production Capacity
There are 9 units in organized sector and multiple units at cottage level involved
in the production of dyestuff. The production capacity of main units is given below:
Company Year
Disperse Dyes & Prep.
thereof
Acid Dyes
Direct Dyes
Reactive Dyes
Pigment Powders & Prep. based thereof
Synthetic Organic
Products Total
HS Code 32041100 32041200 32041400 32041600 32041700 3204.2000
Sandal Dyestuff Industries Limited.
Capacity - 400.00 500.00 3,000.00 6,000.00 - 9,900.00
2005~06 - 78.37 20.30 1,567.30 2,635.75 - 4,301.72
2006~07 - 52.70 13.43 1,367.60 2,636.79 - 4,070.51
2007~08 - 83.50 4.47 1,033.90 2,849.35 - 3,971.22
2008~09 - 86.80 4.25 969.43 2,458.05 - 3,518.53
Clariant Pakistan Limited.
Capacity 1,000.00 1,500.00 800.00 3,000.00 2,000.00 1,000.00 9,300.00
2005~06 350.00 650.00 200.00 2,000.00 500.00 500.00 4,200.00
2006~07 363.00 426.00 214.00 2,209.00 409.00 565.00 4,186.00
2007~08 383.00 431.00 264.00 2,272.00 604.00 586.00 4,540.00
2008~09 393.00 485.00 170.00 2,348.00 680.00 461.00 4,537.00
2009-10 360.00 440.00 194.00 2,679.00 665.00 661.00 4,999.00
Sardar Dyes (Pvt.) Limited.
Capacity - 300.00 210.00 50.00 10.00 90.00 660.00
2005~06 - 180.00 70.00 26.00 2.00 80.00 358.00
2006~07 - 210.00 72.80 68.42 - 84.70 435.92
2007~08 - -
2008~09 - 118.00 54.00 50.00 1.00 85.00 308.00
Chemi Dyestuff Industries (Pvt.) Ltd.
Capacity 300.00 300.00 300.00 800.00 300.00 100.00 2,100.00
2005~06 19.40 47.58 8.05 390.10 40.28 6.10 511.51
2006~07 - - - - - - -
2007~08 - - - - - - -
2008~09 - - - - - - -
Aqsa Dyestuff Industries (Pvt.) Ltd.
Capacity - - - - 1,200.00 - 1,200.00
2005~06 - - - - - - -
2006~07 - - - - - - -
2007~08 - - - - - - -
2008~09 - - - - - - -
Descon Chemicals (Pvt.) Limited.
Capacity - - - 1,000.00 - 1,200.00 2,200.00
2005~06 - - - - - 785.00 785.00
2006~07 - - - - - - -
2007~08 - - - - - - -
2008~09 - - - - - - -
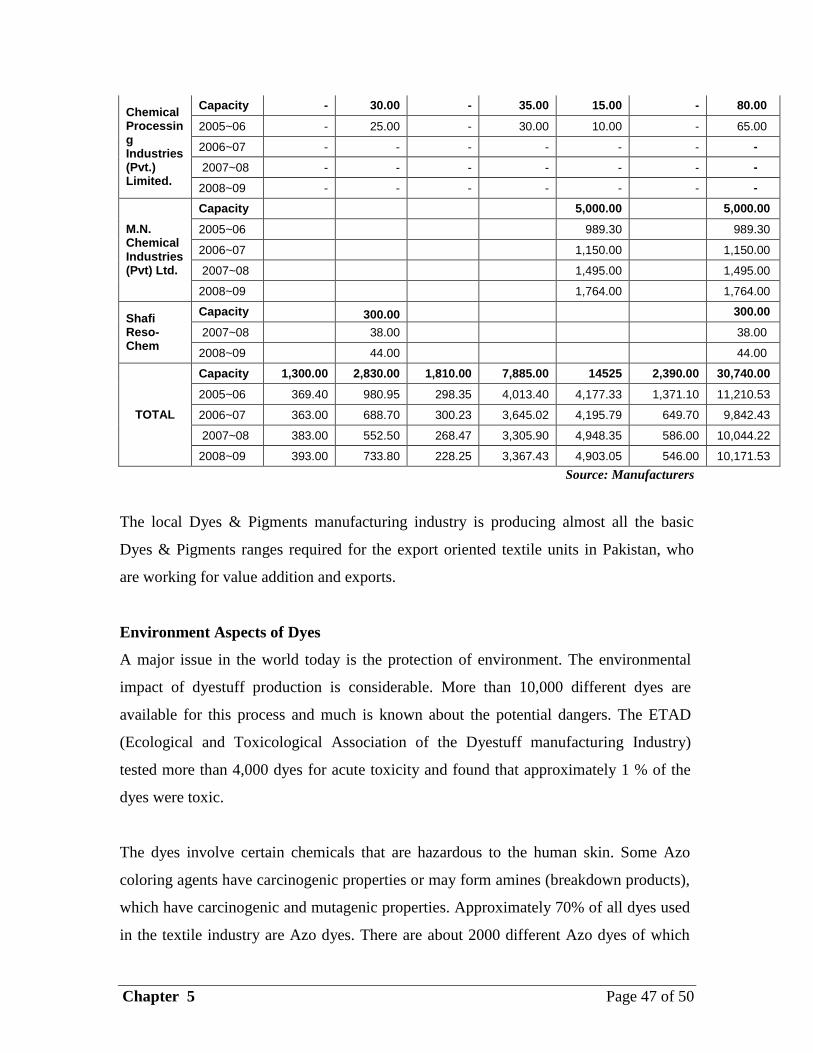
Chapter 5 Page 47 of 50
Chemical Processing Industries (Pvt.) Limited.
Capacity - 30.00 - 35.00 15.00 - 80.00
2005~06 - 25.00 - 30.00 10.00 - 65.00
2006~07 - - - - - - -
2007~08 - - - - - - -
2008~09 - - - - - - -
M.N. Chemical Industries (Pvt) Ltd.
Capacity 5,000.00 5,000.00
2005~06 989.30 989.30
2006~07 1,150.00 1,150.00
2007~08 1,495.00 1,495.00
2008~09 1,764.00 1,764.00
Shafi Reso-Chem
Capacity 300.00 300.00
2007~08 38.00 38.00
2008~09 44.00 44.00
TOTAL
Capacity 1,300.00 2,830.00 1,810.00 7,885.00 14525 2,390.00 30,740.00
2005~06 369.40 980.95 298.35 4,013.40 4,177.33 1,371.10 11,210.53
2006~07 363.00 688.70 300.23 3,645.02 4,195.79 649.70 9,842.43
2007~08 383.00 552.50 268.47 3,305.90 4,948.35 586.00 10,044.22
2008~09 393.00 733.80 228.25 3,367.43 4,903.05 546.00 10,171.53
Source: Manufacturers
The local Dyes & Pigments manufacturing industry is producing almost all the basic
Dyes & Pigments ranges required for the export oriented textile units in Pakistan, who
are working for value addition and exports.
Environment Aspects of Dyes
A major issue in the world today is the protection of environment. The environmental
impact of dyestuff production is considerable. More than 10,000 different dyes are
available for this process and much is known about the potential dangers. The ETAD
(Ecological and Toxicological Association of the Dyestuff manufacturing Industry)
tested more than 4,000 dyes for acute toxicity and found that approximately 1 % of the
dyes were toxic.
The dyes involve certain chemicals that are hazardous to the human skin. Some Azo
coloring agents have carcinogenic properties or may form amines (breakdown products),
which have carcinogenic and mutagenic properties. Approximately 70% of all dyes used
in the textile industry are Azo dyes. There are about 2000 different Azo dyes of which

Chapter 5 Page 48 of 50
approximately 200-300 may be hazardous. As a result worldwide players are downing
shutters and prefer imports of dyes from developing countries. This scenario is giving an
opportunity to the developing countries to establish a strong manufacturing base.
The complete treatment of hazardous effluents of dyestuff manufacturing unit is
uneconomical for individuals, therefore, a common secondary treatment plant, whereas
the primary treatment of the effluent is the responsibility of individual units, can
facilitate the individuals in meeting the environmental obligations.
Exports of Dyes & Pigments
The export of Dyes & Pigments is around US$ 2.00 Million per year, which
is a very encouraging sign for the local manufaureres. There is a strong need to
encourage this High-Tech industry as it will not only help our overgrowing Textile
Industry for strong value addition but can also fetch a very handsome amount of foreign
exchange.
Future Prospects
There is local manufacturing of dyes and pigments but large quantities are still
being imported. Currently the total import of this group stood around Rs 5.0 billion.
Additionally, about Rs 0.4 billion worth of printing ink and paints were also imported.
Pakistan has a strong manufacturing base for Textile & Leather. The textile industry in
Pakistan is the single most important manufacturing sector, accounting for an average of
40% of manufacturing employment, 64% of exports and 30% of manufacturing value
added. Similarly Leather industry has also a strong base with the production of high value
added products such as leather garments, leather gloves, leather footwear & other leather
manufactures.
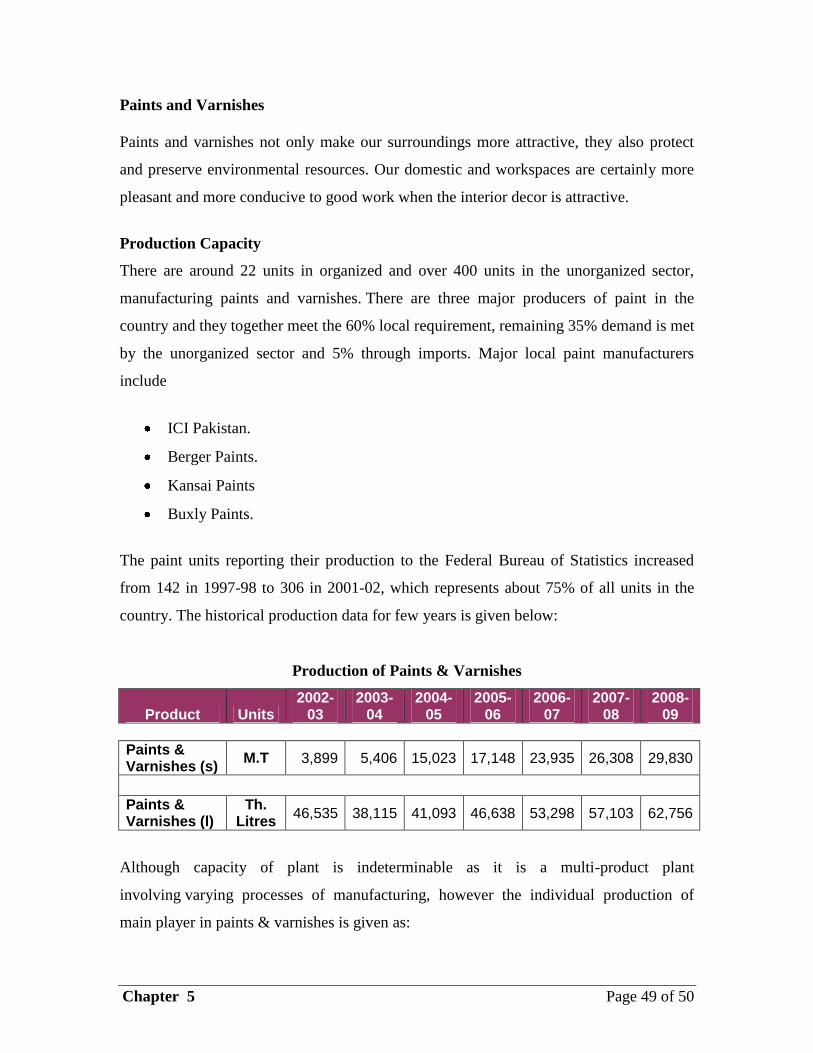
Chapter 5 Page 49 of 50
Paints and Varnishes
Paints and varnishes not only make our surroundings more attractive, they also protect
and preserve environmental resources. Our domestic and workspaces are certainly more
pleasant and more conducive to good work when the interior decor is attractive.
Production Capacity
There are around 22 units in organized and over 400 units in the unorganized sector,
manufacturing paints and varnishes. There are three major producers of paint in the
country and they together meet the 60% local requirement, remaining 35% demand is met
by the unorganized sector and 5% through imports. Major local paint manufacturers
include
ICI Pakistan.
Berger Paints.
Kansai Paints
Buxly Paints.
The paint units reporting their production to the Federal Bureau of Statistics increased
from 142 in 1997-98 to 306 in 2001-02, which represents about 75% of all units in the
country. The historical production data for few years is given below:
Production of Paints & Varnishes
Product Units 2002-
03 2003-
04 2004-
05 2005-
06 2006-
07 2007-
08 2008-
09
Paints & Varnishes (s)
M.T 3,899 5,406 15,023 17,148 23,935 26,308 29,830
Paints & Varnishes (l)
Th. Litres
46,535 38,115 41,093 46,638 53,298 57,103 62,756
Although capacity of plant is indeterminable as it is a multi-product plant
involving varying processes of manufacturing, however the individual production of
main player in paints & varnishes is given as:
Chapter 5 Page 50 of 50
Six manufacturers of decorative paints are ICI Pakistan, Berger Paints, Buxly Paints,
Master Paints, and Brighto & Gobbis. The industrial paints segment has also a large
number of applications and uses. Major players in this segment are ICI Pakistan and
Berger Paints. Some industrial paints are imported.
The refinish segment caters the requirements for maintenance of vehicles. Major players
in this segment are ICI Pakistan, Berger Paints and Champion Paints.
Powder Coating Chemical
The recent trend in the world is to apply powder coating instead of liquid paints and there
are a lot of chemicals required for preparation of metal sheet before powder coating.
These chemicals are basically known as pre-treatment or phosphating chemicals, which
include degreasing, phosphating Anodizing chemicals etc. There are a number of small
units producing above chemicals in Lahore and Karachi catering to the local
manufacturers of home appliance like Dawlance, Waves and Multinationals including
carmakers like Toyota, Honda, Suzuki, etc.
Oxyplast Karachi also has the facility to produce powder-coating paints. The raw
materials are Polyester resin, Epoxy resin, Barium Sulphate, Titanium Oxide and curing
agents.
FUTURE PROSPECTS:
The current production is sufficient for local demand. However, the raw material used in
this sector are being imported and comes from Petrochemical base, setting up of a
Petrochemical base would help backward integration in this sector resulting in industrial
growth.

CHAPTER – 6
PROPOSAL FOR THE FUTURE DEVELOPMENT OF SECONDARY INDUSTRIES IN PAKISTAN
The principal purpose of the Secondary Industries is to provide the connecting link
between the products of the Primary Industries and materials which are of practical use to
Pakistan’s national economy. This implies that they will rely upon the Primary Industries
for Feedstocks and will consist of engineering, fabrication, construction and
manufacturing plants for petrochemicals, plastics, steel, aluminium, minerals, agricultural
and miscellaneous products. These industries will require medium and relatively high
technology and range from medium to light categories. However, the Secondary
Industries will not only be concerned with the manufacture of finished goods but will also
become the principal suppliers of raw materials, particularly plastics for the development
of downstream small and medium scale enterprisers.
The size of the secondary industries should be based on market analysis and projections
of demand for intermediate products and consumer goods, as well as the projected
availability and character of feedstocks from the Primary Industries and other sources.
Their selection should also be based on the opportunities for regional and world export
marketing of selected products.
Criteria for Selection of Secondary Industries. The following criteria have been used for determining the suitability of secondary
industries:-
i) Feedstock Relationship to Primary Industries:
The secondary industries should where possible use feedstocks which will be
available from the primary industries to produce materials with high added
value.
Chapter – 6 Page1 of 5

ii) Use of other resources available in Pakistan
The secondary industries will use Pakistan’s natural resources and produce
materials related to demand by the various economic sectors within Pakistan
butt should also consider the potential for exports of the finished products.
Maximum use should be made of the availability of technical and managerial
skills, the abundance of energy supplies and the suitably developed
infrastructure.
iii) Import Substitution:
A clear objective is to reduce the Pakistani’s dependence on imports by
substituting locally produced goods.
iv) Develop exports for Pakistan’s high quality products
The secondary industries should be sized and planned to take account of the
development of export markets in the Central Asian States, Afghanistan, Sri
Lanka and other adjoining countries in the Middle East.
v) Development of Pakistani’s Management, Technical and Industrial
Manpower.
The broad mix of Secondary Industries will provide a wide spectrum of
opportunities for the utilization of all types of industrial manpower.
The present development of small and medium secondary chemical industries in Pakistan
is based on the policy of import substitution and no consideration has been given to the
potential for exports of the manufactured products. In addition the manufactured goods in
many cases are not comparable in quality as well as costs with imported products.
The Home Market
The selection of candidate industries has been based on a review of the feedstocks
produced by the Primary Industries and other raw materials available in Pakistan coupled
Chapter – 6 Page2 of 5

with an assessment of the future needs of the industrial, agricultural, commercial and
domestic sectors of the economy.
The assessment of the potential markets in Pakistan is hampered by the relative scarcity
of market research data. The Import/Export Statistics cover materials handled through the
ports but it is generally supposed that much of the overland trade goes unrecorded.
The Export Market In the future development of secondary industries, based on import substitution, it is
necessary that Pakistan also takes into consideration the potential for exports. However,
in order to achieve this objective, it would be necessary that,
i) Pakistan is able to produce high quality products at competitive costs in the
world markets.
ii) Pakistan will have to develop progressively its national innovation system
which will enable it to improve continually its technological and management
capabilities necessary for the improvement of quality as well as productivity
of the manufactured products
iii) Suitable recommendations for the development of national innovation system
(NIS) consisting of Technological and Social capabilities has been proposed
which are necessary for achieving self reliance in the commercialization of
locally developed or imported technologies and reducing the costs of
manufactured goods and products. It would be necessary to prepare an Action
Plan for the implementation of these recommendations
Chapter – 6 Page3 of 5
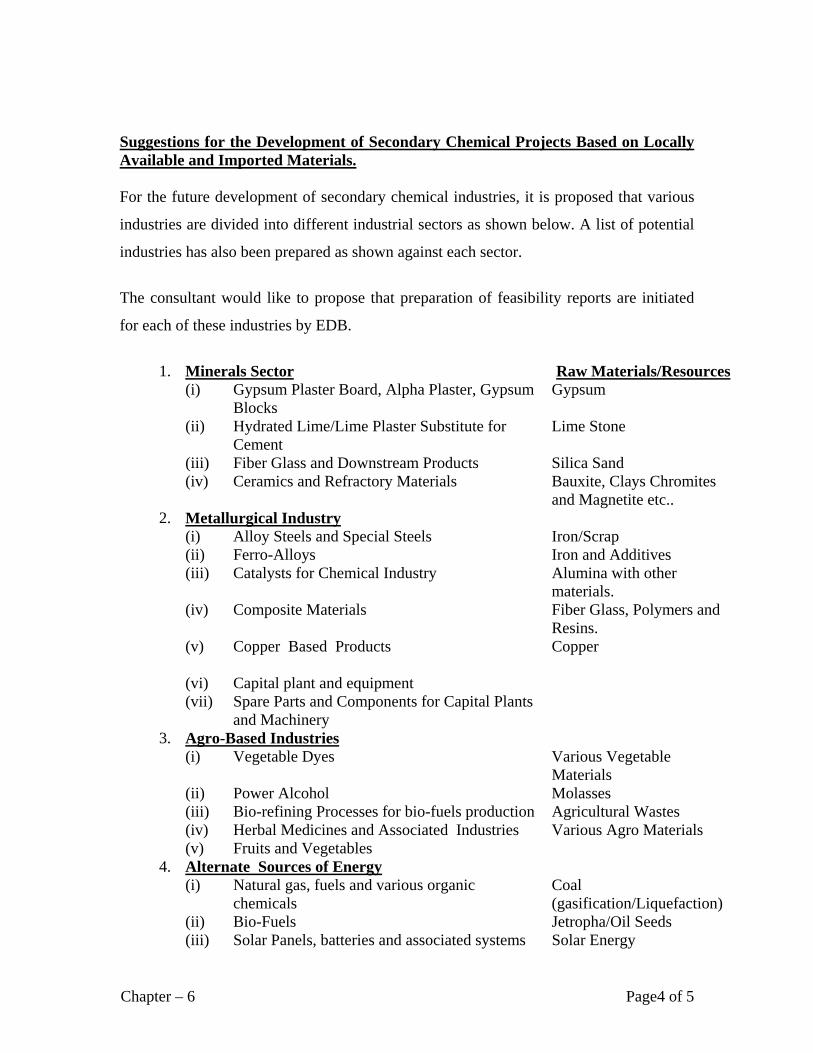
Suggestions for the Development of Secondary Chemical Projects Based on Locally Available and Imported Materials. For the future development of secondary chemical industries, it is proposed that various
industries are divided into different industrial sectors as shown below. A list of potential
industries has also been prepared as shown against each sector.
The consultant would like to propose that preparation of feasibility reports are initiated
for each of these industries by EDB.
1. Minerals Sector Raw Materials/Resources
(i) Gypsum Plaster Board, Alpha Plaster, Gypsum Blocks
Gypsum
(ii) Hydrated Lime/Lime Plaster Substitute for Cement
Lime Stone
(iii) Fiber Glass and Downstream Products Silica Sand (iv) Ceramics and Refractory Materials Bauxite, Clays Chromites
and Magnetite etc.. 2. Metallurgical Industry
(i) Alloy Steels and Special Steels Iron/Scrap (ii) Ferro-Alloys Iron and Additives (iii) Catalysts for Chemical Industry Alumina with other
materials. (iv) Composite Materials Fiber Glass, Polymers and
Resins. (v) Copper Based Products Copper
(vi) Capital plant and equipment (vii) Spare Parts and Components for Capital Plants
and Machinery
3. Agro-Based Industries (i) Vegetable Dyes Various Vegetable
Materials (ii) Power Alcohol Molasses (iii) Bio-refining Processes for bio-fuels production Agricultural Wastes (iv) Herbal Medicines and Associated Industries Various Agro Materials (v) Fruits and Vegetables
4. Alternate Sources of Energy (i) Natural gas, fuels and various organic
chemicals Coal (gasification/Liquefaction)
(ii) Bio-Fuels Jetropha/Oil Seeds (iii) Solar Panels, batteries and associated systems Solar Energy
Chapter – 6 Page4 of 5
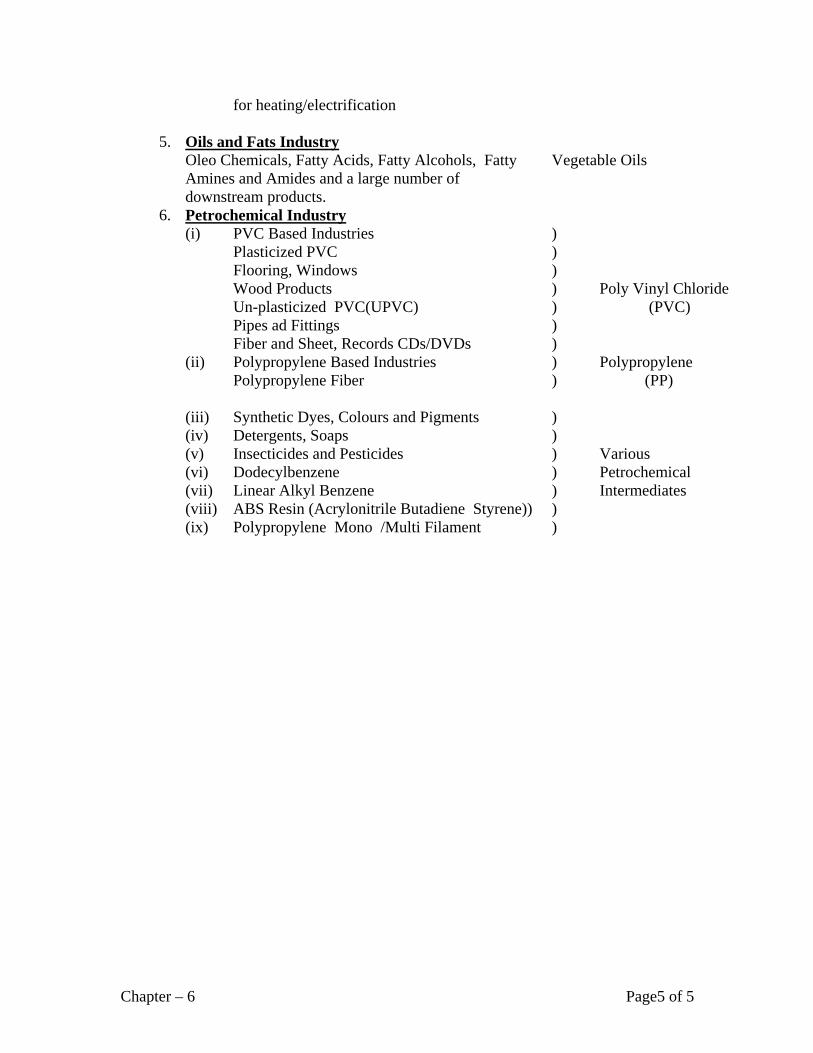
Chapter – 6 Page5 of 5
for heating/electrification
5. Oils and Fats Industry Oleo Chemicals, Fatty Acids, Fatty Alcohols, Fatty Amines and Amides and a large number of downstream products.
Vegetable Oils
6. Petrochemical Industry (i) PVC Based Industries ) Plasticized PVC ) Flooring, Windows ) Wood Products ) Poly Vinyl Chloride Un-plasticized PVC(UPVC) ) (PVC) Pipes ad Fittings ) Fiber and Sheet, Records CDs/DVDs ) (ii) Polypropylene Based Industries ) Polypropylene Polypropylene Fiber ) (PP) (iii) Synthetic Dyes, Colours and Pigments ) (iv) Detergents, Soaps ) (v) Insecticides and Pesticides ) Various (vi) Dodecylbenzene ) Petrochemical (vii) Linear Alkyl Benzene ) Intermediates (viii) ABS Resin (Acrylonitrile Butadiene Styrene)) ) (ix) Polypropylene Mono /Multi Filament )

Chapter 7 – Tariff
Background: In order to develop the Chemical Industry, review of Customs Tariff structures for the Industrial
Tariff lines including Chemical and related industry of Pakistan and ensure its best fit in these
new tariff imperatives was initiated in 2000-2001. The exercise was primarily based to determine
the optimum tariff structures achievable for each segment of the Industry taking also into
consideration the need to remove anomalous relationships i.e., (cascading) upstream to
downstream, as far as practical. Since then fine tuning of the Tariff Structure continued during
the annual budget exercises in close consultations with the relevant stake holders.
Non-Agriculture Market Access (NAMA)
Under Non-Agriculture Market Access (NAMA) Bound tariff rates of all WTO member
countries are to be brought down as laid down under the Doha Mandate where it was agreed to
initiate negotiations to further liberalize trade on non-agricultural goods. To this end, the
Negotiating Group on Market Access (NGMA) was created at the first meeting of the Trade
Negotiations Committee at Doha, in early 2002. The negotiations aim to reduce or eliminate
tariffs, including tariff peaks, high tariffs, tariff escalation and non-tariff barriers for non-
agricultural goods, in particular on products of export interest to developing countries. Special
and Differential treatment for developing and least developed Members shall be fully taken into
account, including through less than full reciprocity in the reduction commitments and measures.
Existing Status
As a result of rationalization of Tariffs, investments were made in the capital intensive industries
like PVC, Polystyrene, Hydrogen Peroxide and downstream industries of Pure Terephthalic Acid
(PTA).Pakistan has now become a major exporter of PET resins. Similarly the PVC industry has
not only invested in expansion but has gone for upstream integration through manufacture of
Ethyl Di-Chloride (EDC) and VCM. This ultimately would create demand for a Naphtha Cracker
which is considered to be the basic requirement for the growth of the Chemical industry.
Under the existing Tariff Structure for approximately 1325 Tariff lines spread over 13 chapters
of the Pakistan Customs Tariff relates Chemical sector which also includes fertilizers,
Pharmaceuticals and Pesticides. Chapter and duty wise break up is shown in Table below;

Summary - Chapter wise Customs Duty
Chapter CD% 2010-11
No of Tariff lines
28) Inorganic chemicals; organic or inorganic compounds of precious metals, of rare-earth metals, of radioactive elements or of isotopes.
0 3 5 166 10 32 15 2 20 2 25 3
Rs.4000/MT 1 28 Total 209
29) Organic chemicals
0 6 5 442 10 32 15 5 20 14 25 13
29 Total 512
30) Pharmaceutical products
5 9 10 32 20 10 25 3
30 Total 54
31) Fertilizers 0 23 5 1
31 Total 24
32) Tanning or dyeing extracts; tannins and their derivatives; dyes, pigments and other colouring matter; paints and varnishes; putty and other mastics; inks
0 6 5 16 10 10 15 19 20 28 25 1
32 Total 80 33) Essential oils and resinoids; perfumery, cosmetic or toilet preparations
10 16 35 30
33 Total 46 34) Soap, organic surface-active agents, washing preparations, lubricating preparations, artificial waxes, prepared waxes, polishing or scouring preparations, candles
0 4 5 5 10 8 15 1

and similar articles, modelling pastes, "dental waxes" and dental preparations with a basis or plaster
20 15 25 6 35 4
34 Total 43
35) Albuminoidal substances; modified starches; glues; enzymes
0 1 5 3 10 11 15 2 20 7
35 Total 24 36) Explosives; pyrotechnic products; matches; pyrophoric alloys; certain combustible preparations
20 5
25 3
36 Total 8
37) Photographic or cinematographic goods
5 33 10 1 15 1 20 1
Rs. 5 per meter plus 5% ad val. 2
37 Total 38
38) Miscellaneous chemical products
0 8 5 40 10 28 15 13 20 23 25 5
38 Total 117
39) Plastics and articles thereof
0 3 5 31 10 24 15 7 20 80 25 25
39 Total 170 Grand Total 1325

Road Map
Analysis of this indicates that above 50% of the products are placed at 0 and 5% duty slabs.
These products are mostly not manufactured locally or are basic inputs for other industries.
Except for consumer products like Soap, Shampoos, Detergents, Cosmetics and Toiletries etc.
which are placed at 25 and 35% duty, all other products are inputs for other industries and attract
a duty ranging from 10 to 20%. Further rationalization of Tariff with a view to bring down duties
of products attracting duties of 20% and above to a maximum of 15% ensuring a spread of
minimum 10% between raw materials and finished products or value addition whichever is
higher is considered imperative, through a process of phased reduction in consultation with the
stake holders and spread over a period of 5 years. This reduction becomes all the more important
in view of NAMA and the Free / Preferential Trade Agreements being planned by the
Government. Products which are at 20% and above are listed below:
Products at 20%
S.# PCT CODE DESCRIPTION CD%
2010-11 1 2815.1100 - - Solid 20
2 2836.3000 -Sodium hydrogencarbonate (Sodium bicarbonate) 20
3 2905.4400 - - D-glucitol (sorbitol) 20 4 2905.4500 - - Glycerol 20 5 2905.4900 - - Other 20 6 2915.3600 - -Dinoseb (ISO) acetate 20 7 2915.7010 - - - Stearic acid 20 8 2916.3910 - - - Ibuprofen 20 9 2917.3200 - - Dioctyl orthophthalates 20 10 2933.3920 - - - Pyrazinamide 20 11 2933.5930 - - - Ciprofloxacin 20 12 2933.5940 - - - Norfloxacin 20 13 2939.4300 - - Cathine (INN) and its salts 20 14 2939.4900 - - Other 20 15 2941.9010 - - - Cephalexin 20 16 2941.9040 - - - Cephradine oral 20
17 3004.9030 - - - Dextrose and saline infusion solution, with infusion set 20
18 3004.9040 - - - Dextrose and saline infusion solution, without saline infusion set 20
19 3004.9050 - - - Eye drops 20 20 3004.9060 - - - Ointments, medicinal 20

21 3005.1010 - - - Surgical tape in jumbo rolls 20 22 3006.2000 -Blood-grouping reagents 20 23 3006.5000 -First-aid boxes and kits 20
24 3006.7000
-Gel preparations designed to be used in human or veterinary medicine as a lubricant for parts of the body for surgical operations or physical examinations or as a coupling agent between the body and medical instruments
20
25 3006.9100 - -Appliances identifiable for ostomy use 20 26 3006.9200 - -Waste pharmaceuticals 20
27 3202.9010 - - - Tanning substances, tanning preparations based on chromium sulphate 20
28 3204.2000 -Synthetic organic products of a kind used as fluorescent brightening agents 20
29 3204.9000 -Other 20 30 3208.1010 - - - Varnishes 20 31 3208.1090 - - - Other 20 32 3208.2010 - - - Varnishes 20 33 3208.2090 - - - Other 20 34 3208.9020 - - - Varnishes 20 35 3208.9090 - - - Other 20 36 3209.1010 - - - Varnishes 20 37 3209.9090 - - - Other 20 38 3210.0010 - - - Distempers 20
39 3210.0020 - - - Prepared water pigments of a kind used for finishing leather 20
40 3210.0090 - - - Other 20 41 3211.0090 - - - Other 20 42 3212.1000 -Stamping foils 20 43 3212.9020 - - - Pigments in paint or enamel media 20 44 3212.9090 - - - Other 20 45 3213.1000 -Colours in sets 20 46 3213.9000 -Other 20 47 3214.1010 - - - Glaziers putty (mastic based on oil) 20 48 3214.1020 - - - Grafting putty (mastic based on wax) 20 49 3214.1030 - - - Resin cements 20 50 3214.1090 - - - Other 20 51 3214.9090 - - - Other 20 52 3215.1190 - - - Other 20 53 3215.1990 - - - Other 20 54 3215.9090 - - - Other 20 55 3402.1190 - - - Other 20 56 3402.1220 - - - Other than in retail packing 20 57 3402.1290 - - - Other 20 58 3402.1300 - - Non-ionic 20

59 3403.1110 - - - Of a kind used in the leather or like industires 20
60 3403.1120 - - - Of a kind used in the paper or like industries 20
61 3403.1139 - - - -Other 20 62 3403.1190 - - - Other 20 63 3403.1910 - - - Greases 20 64 3403.1990 - - - Other 20
65 3403.9110 - - - Of a kind used in the leather or like industires including fat liquors 20
66 3403.9120 - - - Of a kind used in the paper or like industries 20
67 3403.9139 - - - -Other 20 68 3403.9190 - - - Other 20 69 3403.9990 - - - Other 20 70 3505.1090 - - - Other 20 71 3505.2010 - - - Starch based glues 20 72 3505.2020 - - - Dextrin based glues 20 73 3505.2090 - - - Other 20
74 3506.1000 -Products suitable for use as glues or adhesives, put up for retail sale as glues or adhesives, not exceeding a net weight of 1 kg 20
75 3506.9190 - - - Other 20 76 3506.9990 - - - Other 20 77 3601.0000 Propellent powders 20
78 3602.0000 Prepared explosives, other than propellent powders 20
79 3603.0000 Safety fuses; detonating fuses; percussion or detonating caps; igniters; electric detonators. 20
80 3606.1000 -Liquid or liquefied gas fuels in containers of a kind used for filling or refilling cigarette or similar lighters and of a capacity not exceeding 300cm3
20
81 3606.9000 -Other 20 82 3701.3090 - - - Other 20 83 3808.9990 - - -Other 20 84 3810.9000 -Other 20 85 3811.1100 - - Based on lead compounds 20
86 3813.0000 Preparations and charges for fire- extinguishers; charged fire-extinguishing grenades. 20
87 3814.0000 Organic composite solvents and thinners, not elsewhere specified or included; prepared paint or varnish removers. 20
88 3819.0010 - - - Hydraulic brake fluids 20 89 3819.0090 - - - Other 20

90 3820.0000 Anti-freezing preparations and prepared de-icing fluids. 20
91 3822.0000
Diagnostic or laboratory reagents on a backing, prepared diagnostic or laboratory reagents whether or not on a backing, other than those of heading 30.02 or 30.06; certified reference materials.
20
92 3823.1100 - - Stearic acid 20 93 3823.1300 - - Tall oil fatty acids 20
94 3824.4000 -Prepared additives for cements, mortars or concretes 20
95 3824.5000 -Non-refractory mortars and concretes 20
96 3824.6000 -Sorbitol other than that of subheading No. 2905.44 20
97 3825.1000 -Municipal waste 20 98 3825.2000 -Sewage sludge 20 99 3825.3000 -Clinical waste 20 100 3825.4100 - - Halogenated 20 101 3825.4900 - - Other 20
102 3825.5000 -Wastes of metal pickling liquors, hydraulic fluids, brake fluids and anti- freeze fluids 20
103 3825.6100 - - Mainly containing organic constituents 20 104 3825.6900 - - Other 20 105 3825.9000 -Other 20 106 3904.2100 - - Non-plasticised 20 107 3904.2200 - - Plasticised 20 108 3905.1200 - - In aqueous dispersion 20 109 3905.1900 - - Other 20 110 3906.9010 - - - Cyanoacrylate 20 111 3906.9020 - - - Acrylic binders 20 112 3907.3000 -Epoxide resins 20 113 3907.5000 -Alkyd resins 20 114 3907.6090 - - - Other 20 115 3907.7000 -Poly(lactic acid) 20 116 3907.9100 - - Unsaturated 20 117 3907.9900 - - Other 20 118 3909.1090 - - - Other 20 119 3909.2000 -Melamine resins 20 120 3909.3000 -Other amino-resins 20 121 3909.4000 -Phenolic resins 20 122 3911.1010 - - - Petroleum resins 20 123 3911.1090 - - - Other 20 124 3911.9000 -Other 20 125 3912.2010 - - - Cellulose nitrates nonplasticised 20 126 3912.2090 - - - Other 20

127 3916.1000 -Of polymers of ethylene 20 128 3916.2000 -Of polymers of vinyl chloride 20 129 3916.9000 -Of other plastics: 20 130 3917.2100 - - Of polymers of ethylene 20 131 3917.2200 - - Of polymers of propylene 20 132 3917.2390 - - - Other 20 133 3917.2900 - - Of other plastics 20
134 3917.3100 - - Flexible tubes, pipes and hoses, having a minimum burst pressure of 27.6 MPa 20
135 3917.3200 - - Other, not reinforced or otherwise combined with other materials, without fittings: 20
136 3917.3300 - - Other, not reinforced or otherwise combined with other materials, with fittings 20
137 3917.3990 - - - Other 20 138 3917.4000 -Fittings 20 139 3919.1090 - - - Other 20
140 3919.9010 - - - Oriented Polypropylene (OPP) packing tapes 20
141 3919.9090 - - - Other 20 142 3920.1000 -Of polymers of ethylene 20
143 3920.2010 - - - Biaxially Oriented Polypropylene (BOPP) film, plain 20
144 3920.2020 - - - Biaxially Oriented Polypropylene (BOPP) film, printed 20
145 3920.2030 - - - Biaxially Oriented Polypropylene (BOPP) film, metallized 20
146 3920.2040 - - - Biaxially Oriented Polypropylene (BOPP) film, laminated 20
147 3920.2090 - - - Other 20 148 3920.3000 -Of polymers of styrene 20
149 3920.4300 - - Containing by weight not less than 6 % of plasticisers 20
150 3920.4910 - - - Polyvinyl Chloride (PVC) Rigid film 20 151 3920.4990 - - - Other 20 152 3920.5100 - - Of poly(methyl methacrylate) 20 153 3920.5900 - - Other 20 154 3920.6100 - - Of polycarbonates 20 155 3920.6200 - - Of poly(ethylene terephthalate) 20 156 3920.6300 - - Of unsaturated polyesters 20 157 3920.6900 - - Of other polyesters 20 158 3920.7100 - - Of regenerated cellulose 20 159 3920.7300 - - Of cellulose acetate 20 160 3920.7900 - - Of other cellulose derivatives 20 161 3920.9100 - - Of poly(vinyl butyral) 20 162 3920.9200 - - Of polyamides 20

163 3920.9300 - - Of amino resins 20 164 3920.9400 - - Of phenolic resins 20 165 3920.9900 - - Of other plastics 20 166 3921.1100 - - Of polymers of styrene 20 167 3921.1200 - - Of polymers of vinyl chloride 20 168 3921.1300 - - Of polyurethanes 20 169 3921.1400 - - Of regenerated cellulose 20 170 3921.1900 - - Of other plastics 20 171 3921.9090 - - - Other 20 172 3923.1000 -Boxes, cases, crates and similar articles 20 173 3923.3010 - - - Bottles 20 174 3926.2010 - - - Plastic belts 20 175 3926.2090 - - - Other 20 176 3926.3000 -Fittings for furniture, coachwork of the like 20 177 3926.4010 - - - Ornamental articles of plastics 20 178 3926.4020 - - - Plastic bangles 20 179 3926.4030 - - - Spangles of plastics 20 180 3926.4040 - - - Plastic beads 20 181 3926.4090 - - - Other 20 182 3926.9010 - - - Synthetic floats for fishing nets 20 183 3926.9030 - - - Transmission, conveyor or elevator belts 20 184 3926.9060 - - - Shoe lasts 20 185 3926.9099 - - - -Other 20
Products at 25%
S.# PCT CODE DESCRIPTION CD%
2009-10 1 3926.1000 -Office or school supplies 25 2 3925.9000 -Other 25
3 3925.3000 -Shutters, blinds (including Venetian blinds) and similar articles and parts thereof 25
4 3925.2000 -Doors, windows and their frames and thresholds for doors 25
5 3925.1000 -Reservoirs, tanks, vats and similar containers, of a capacity exceeding 300l 25
6 3924.9000 -Other 25 7 3924.1000 -Tableware and kitchenware 25 8 3923.9090 - - - Other 25 9 3923.5000 -Stoppers, lids, caps and other closures 25 10 3923.4000 -Spools, cops, bobbins and similar supports 25 11 2803.0010 - - - Carbon black (rubber grade) 25 12 2803.0020 - - - Carbon black (other than rubber grade) 25 13 3923.3090 - - - Other 25 14 2803.0090 - - - Other 25 15 3923.2900 - - Of other plastics 25

16 3923.2100 - - Of polymers of ethylene 25 17 3922.9000 -Other 25 18 3922.2000 -Lavatory seats and covers 25
19 3922.1000 -Baths, shower-baths, sinks and wash-basins 25
20 3919.1030 - - - Scotch tape, plastic 25 21 3919.1020 - - - PVC electric insulation tapes 25 22 3918.9000 -Of other plastics 25 23 3918.1000 -Of polymers of vinyl chloride 25 24 3915.9000 -Of other plastics 25 25 3915.3000 -Of polymers of vinyl chloride 25 26 3915.2000 -Of polymers of styrene 25 27 3915.1000 -Of polymers of ethylene 25 28 3909.1010 - - - Urea formaldehyde moulding compound 25 29 3811.1900 - - Other 25 30 3808.9150 - - - Para dichlorobenzene blocks 25 31 3808.9120 - - - Napthalene balls 25 32 3808.9110 - - - Mosquito coils, mats and the like 25 33 3808.5090 - - - Other 25
34 3605.0000 Matches, other than pyrotechnic articles of heading 36.04. 25
35 3604.9000 -Other 25 36 3604.1000 -Fireworks 25 37 3406.0000 Candles, tapers and the like. 25 38 3405.9000 -Other 25
39 3405.3000 -Polishes and similar preparations for coachwork, other than metal polishes 25
40 3405.1010 - - - For footwear 25 41 3402.9000 -Other 25 42 3402.2000 -Preparations put up for retail sale 25 43 3209.1090 - - - Other 25 44 3005.9090 - - - Other 25 45 3005.1090 - - - Other 25
46 3004.1010 - - - Ampicillin, Amoxcillin and Cloxcillin capsules/ syrup 25
47 2941.1000 -Penicillins and their derivatives with a penicillanic acid structure; salts thereof 25
48 2939.4200 - - Pseudoephedrine (INN) and its salts 25 49 2939.4100 - - Ephedrine and its salts 25 50 2935.0060 - - - Sulphanilamide 25 51 2935.0050 - - - Sulpha-thiazolediazine 25 52 2935.0040 - - - Sulphamethexazole 25 53 2934.9910 - - - Furazolidone 25 54 2924.2910 - - - Paracetamol 25 55 2918.2210 - - - Aspirin 25 56 2915.3300 - -n -Butyl acetate 25

57 2915.3100 - - Ethyl acetate 25 58 2915.2100 - - Acetic acid 25 59 2915.1100 - - Formic acid 25
Products at 35%
S.# PCT CODE DESCRIPTION CD%
2009-10
1 3401.3000 -Organic surface-active products and preparations for washing the skin, in the form of liquid or cream and put up for retail sale, whether or not containing soap
35
2 3401.2000 -Soap in other forms 35 3 3401.1900 - - Other 35 4 3401.1100 - - For toilet use (including medicated products) 35 5 3307.9090 - - - Other 35 6 3307.9010 - - - Contact lens solution 35 7 3307.4900 - - Other 35
8 3307.4100 - - "Agarbatti" and other odoriferous perparations which operate by burning 35
9 3307.3000 -Perfumed bath salts and other bath preparations 35 10 3307.2000 -Personal deodorants and antiperspirants 35 11 3307.1000 -Pre-shave, shaving or after-shave preparations 35 12 3306.9000 -Other 35 13 3306.2000 -Yarn used to clean between the teeth (dental floss) 35 14 3306.1090 - - - Other 35 15 3306.1010 - - - Tooth paste 35 16 3305.9090 - - - Other 35 17 3305.9020 - - - Dyes for hair 35 18 3305.9010 - - - Cream for hair 35 19 3305.3000 - Hair lacquers 35 20 3305.2000 -Preparations for permanent waving or straightening 35 21 3305.1000 -Shampoos 35 22 3304.9990 - - - Other 35 23 3304.9920 - - - Tonics and skin food 35 24 3304.9910 - - - Face and skin creams and lotions 35 25 3304.9190 - - - Other 35 26 3304.9120 - - - Talcum powder 35 27 3304.9110 - - - Face powder 35 28 3304.3090 - - - Other 35 29 3304.3010 - - - Nail polish 35 30 3304.2000 -Eye make-up preparations 35 31 3304.1000 -Lip make-up preparations 35 32 3303.0090 - - - Other 35 33 3303.0020 - - - Perfumes 35 34 3303.0010 - - - Eau-de-cologne 35

Tariff reduction modalities under NAMA The text under negotiation stipulates Formula Coefficient and Flexibilities as under:
• For developed countries the proposed co-efficient is [5-7]. For developing countries either of the following can be accepted
(x) 20 with flexibilities of 14%] with trade volume of 10%]. (y) 22 with flexibilities of 10% and trade volume 10%. (z) 25 with no flexibilities.
A preliminary exercise, carried out to determine the impact, the following scenario emerges on a bound rate of 75% which has been considered in this example as most of the Tariff lines have this rate:
• BOUND VS APPLIED RATES UNDER NAMA
Duty Rate (2010-11)
Existing Bound Rate Bound Rate at different coefficients
15% 20% 25% 30% 5% 20 to 75% 12.5 15.79 18.75 21.43 10% 30 to 75% 12.5 15.79 18.75 21.43 15% 50 to75% 12.5 15.79 18.75 21.43
20,25,30,35% 30 to 75% 12.5 15.79 18.75 21.43
50 120 13.3 17.1 20.7 24.0 55 120 13.3 17.1 20.7 24.0 60 170 13.3 17.1 20.7 24.0 65 170 13.8 17.9 21.8 25.5 75 250 14.2 18.6 22.9 27.0 80 250 14.2 18.6 22.9 27.0
Under the Swiss formula for calculating reduction in bound rates, cut would be greater on higher rates as elaborated in the Table above and products at duties upto 15% would be least affected therefore the industry should prepare for reduction of tariff to 15% which otherwise is also considered as tariff peak.

CHAPTER - 8
CONCLUSIONS AND RECOMMENDATIONS
(i) The development of chemical industry produces high value-added goods and is
essential if Pakistan is to remain internationally competitive, reduce its trade
deficit and record strong rates of economic growth.
(ii) Feedstocks derived from primary industries, as well as alternative sources of raw
materials, which are required for the development of secondary chemical
industries have been investigated and processes for their utilization have been
outlined. These will form the basis for the future development of secondary
chemical industries in Pakistan. A number of potentially feasible projects in
various sectors of chemical industry have been proposed for future
implementation.
(iii) Pakistan’s major exports consist of low technology, labour intensive products.
The share of medium and high technology products in total exports from Pakistan
remains very small in spite of the trade liberalization policies that have been
adopted over the past 10 years.
(iv) The development of primary and secondary chemical industries has occurred
primarily with the help of foreign engineering corporations, which were awarded
turnkey contracts for the commercialization of local and / or imported
technologies on EPC (Engineering, Procurement and Construction) basis.
(v) The National Innovation System (NIS), consisting of process science and
engineering technology (PS&ET), necessary for the integration of facilities for
technology development, process design, detailed engineering, manufacturing of
`capital plant and machinery, plant construction, and marketing management is
very weak. It requires enhancement and modernization in order to enable the
development of local capabilities for the commercialization of local and / or
imported technologies.
Chapter – 8 Page 1 of 5

(vi) We recommend that the scope of the Engineering Development Board should be
enhanced and given the additional responsibility for technology development. In
order to achieve this objective, we propose that three committees should be
established under Engineering And Technology Development Board (ETDB) in
order to strengthen the NIS. These are:
(a) A National Committee / Council for research and technology
development,
(b) A National Committee / Council for the development of software and hardware for the commercialization of technologies,
(b) A National Committee / Council for the development of Technology
Policy and Investment Planning.
The task of each of these Committees will be to foster links between universities,
research and development (R&D) institutions and industry necessary for the
development, appraisal and evaluation of local and / or imported technologies, to
create engineering companies as joint ventures between local and / or foreign
companies for the development of facilities required for the commercialization of
local and imported technologies and to develop industrial and investment policies
for capital formation on continual basis.
(vii) In order to facilitate the formation of investment capital, we suggest that a
Holding Company should be established with the participation of the financial
sector, international donors, friends of Pakistan, overseas Pakistanis, and other
investors, who should be invited to participate as shareholders in this company.
(viii) The chemical industry is the driving force in developing a healthy Pakistani
economy, so as to provide jobs and bridge the gap between imports and exports.
This poses an increasing challenge for the chemical industry over the next twenty
years as global competition, technology advances, public health and
environmental concerns, and new markets and products shape the future.
Chapter – 8 Page 2 of 5

The present policy for the development of chemical industry based entirely on
imported technologies and their commercialization by awarding Turnkey
contracts to Foreign Engineering Companies on EPC basis (Engineering,
Procurement and Construction) is costly and highly uneconomic. According to
World Bank estimates the investment costs of chemical projects in countries
where National Innovation System (N.I.S) is lacking or not well developed is
about 40 percent higher compared with their costs in countries where industrial
infrastructure is locally established.
(ix) The rapid development of South East Asian and ASEAN Countries as well as
China and India has been based on the development of their N.I.S. which forms
an important aspect of their economic policies and institutional framework. The
rapid development of their manufactured industrial products and spectacular rates
of growth in exports has been the result of the development of local technology,
engineering and industrial infrastructure. Pakistan will not be ale to compete with
these countries on quality as well as costs for the export of its manufactured
products unless it is able to enhance its capability with the development of N.I.S.
(x) In order to prepare an Action Plan for the development of N.I.S. and Institutional
infrastructure, it is suggested that ETDB establish a Commission with its
members drawn from:-
i. Ministry of Industries and Production
ii. Ministry of Science and Technology
iii. Ministry of Planning and Development
iv. Higher Education Commission
v. Industry
Chapter – 8 Page 3 of 5
The development of Action / Implementation Plan will become the basis for the
preparation of PC-1 for the allocation of Resources. In addition we would like to
propose that ETDB organize a National Conference with the participation of
various public/private sector organizations which will also be useful for the
preparation and development of comprehensive policy for the development of
National Innovation System.
(xi) The main factors affecting continual brain drain of Pakistan’s highly qualified
manpower is due to lack of employment opportunities. The development of NIS
will require the services of tens of thousands of scientists, engineers,
technologists, economists and social scientists, and will therefore result in job
creation which will reverse the current brain drain.
(xii) Pakistan has been importing Second Hand Plants based on Antiquated
Technology, Energy Intensive, Low Productivity Projects. The products
manufactured by these plants in many cases are not economically competitive
with the imported products. Such plants in many cases were ultimately shutdown.
In addition the investors in some cases were not able to pay the Bank Loans
which had to be written off.
We suggest that GOP should undertake investigations / survey of such projects in
order to determine the extent of financial losses incurred by the Banking Sector
and the Country. It is also suggested that the policy of importing second hand
plants is reviewed and a Ban is imposed on the future import of such plants.
(xii) Pakistan is dependent upon foreign engineering and construction companies for
the acquisition and commercialization of technologies for the development of its
primary and secondary industries. Under the circumstances it is not possible for
its industrial products to compete in the international markets in respect of quality
and costs unless it is able to achieve self reliance by developing its local
technological and social capabilities as a part of its NIS.
Chapter – 8 Page 4 of 5
Chapter – 8 Page 5 of 5
The national innovation system consists of a set of institutions whose interaction
determines the innovative performances of the economy. These consist of private
and public R&D institutions, operations, design, engineering and construction
management corporations, capital plant manufacturing companies, financial
institutions, the educational system and government regulatory bodies. These
constitute the framework for the creation of pro-innovative environment aimed at
maintaining quality, productivity of manufactured goods and products and
increasing the competitiveness of a country in the international markets.

Annexure - B REFERENCES
Serial No
Reference
1. Chemical Industry – Wikipedia. The Free encyclopedia
http://en.wikipedia.org/wiki/chemical_industry
2. World Industries, World Industry
http://www.economywatch.com/world-industries/
3. The Chemical Industry
http://www.politics.co.uk/opioion-formers/Chemical-Industries-Association/the-chemical-i
4. Industry – Wikipedia. The Free encyclopedia
http://en.wikipedia.org/wiki/Industry
5. SIC 3341 Secondary Smelting and Refining of Nonferrous Metals
http://www.referenceforbusiness.com/industries/Primary-Metals/Secondary-Smelting-Refi
6. Industry: Facts, Discussion Forum, and Encyclopedia Article
http://www.absoluteastronomy.com/topics/industry
7. Primary Sector of Industry Industries Raw Materials Considered
http://www.economicexpert.com/a/primary:ssector: of:industry.htm
8. Chemical industry http://www.answers.com/topic/chemical-industry
9. Technological Strategies and Exports: A study of Indian Basic Chemical Industry
Research Scholar, Department of Humanities and Social Sciences, Indian Institute of Technology, Bombay
10. Bio-refineries for the chemical industry – A Dutch point of view
Dr...Ir. Ed de Jong1, Drs.ing. Rene van ree rea2, Ir,
Robert van Tuil1, Dr.Ir.Wolter Elbersen1
11. Research – Energy – The bio-refinery concept
http://europa.eu/research/energy/nn/nn_pu/renews/ 003/article_2293_en.htm
12. Chemical Industry in India
Source: Central Statistical Organization, Ministry of Statistics and Programme Implementation, Government of India.
13. Bio-refineries for the chemical industry – A Dutch point of view
Dr...Ir. Ed de Jong1, Drs.ing. Rene van ree rea2, Ir,
Robert van Tuil1, Dr.Ir.Wolter Elbersen1
14. Development of Petrochemicals from natural gas (methane)
N.S. Maina – Department of Chemical Engineering, Ahmadu Bello Bello university,Zaria, 810261. E-Mail : [email protected]
_____________________________________________________________________ References Page 1 of 3

15. Source of Bio-mass Materials, What are Bio-mass Source ? What is Bio-mass Energy?
http://www.brighthub.com/engineering/mechanical/ articles/6362.aspx
16. Secondary Smelting and Refining of Nonferrous Metals
http://www.referenceforbusiness.com/industries/Primary-Metals/Secondary-Smelting-Refi
17. Industry Sectors – Chemical & Petrochemicals
http://www.albertacanada.com/industries/861.html
18. Chemical Industry – Wikipedia The Free encyclopedia
http://en.wikipedia.org/wiki/steel
19. A advanced Steel Making www.uktradeinvest.gov.uk
20. Vision 2020 – Chemical Industry of the Future
Technology Road Map
21. Singapore’s manufacturing Sector as engine for economic growth: past, present and future
Science and Public Policy October 2001
22. Technology Development in Malaysia and the newly industrializing economies: A comparative analysis
Mun-Chow Lai” and Su-Fei Yap”
23. Towards a vision 2030 and the challenges of openness to Pakistan economy:
Khan Muhammad Tariq Yousuf Institute of Developing Economies, Japan External Trade Organization
24. United Nations Economic Commission for Africa
Science and Technology for Africa’s Development http://www.un.org./depts/eca/divis/fssd/
25. Commercializing technology Solutions Moving from products to Solutions
Annual Dass is with Wipro Limited, Yokohama City, Japan 2208109(phone:+81-80-3206-2139, fax+81-45-650-3951;email: [email protected]).
26. Survey of Trends in the Development of Science and Technology Parks NISTEP Report No. 38
http://www.nistep.go.jp/achieve/abs/eng/rep038e/rep038ae.html
_____________________________________________________________________
27. Failure of the Miracle: Why South Korea’s Managed Economy Is Dying
Hhp://www.gongol.com/research/economies/ ethaebol/;
References Page 2 of 3

_____________________________________________________________________ References Page 3 of 3
28. Towards the furthering of export promotion and industrial development of Egypt – looking at Japan’s Experiences.
Keynote speech by Osamu Watanable, Chairman and CEO of JETRO at the Management Development Centre, Cairo – Egypt on June 16th 2004.
29. Technology Vision 2020 The US Chemical Industry 1155 16th Street NW Washington DC 20036 (202) 452 8917 http://www.acs.org
30. Jaebeol – Wikipedia – The Free encyclopedia
http://en.wikipedia.org/wiki/chaebol Japan’s Keiretsu
31. Zaibatsu – Encylcopedia.com
http//www.encyclopedia.com/doc/1048-zaibatsu.html.
32. Keiretsu Economy – New Economy? Japan’s Multinational Enterprises from a Post Modern perspective.
http://www.thefreelibrary.com/Keiretsu+Economy – New + E economy% 3F+japan’s Multinational+E
33. Various Five year plan Economic Surveys of Pakistan World Bank ADB Reports