engineering design challenge - nasa design challenge: sample learning targets ... have worked...
TRANSCRIPT

E
ngineering Design C
hallenge
1

Above: NASA’s Glenn Research Center (GRC) in Cleveland, Ohio, is 1 of 10 NASA centers. Serving as an essential component of NASA and an integral contributor to the region, GRC researches, designs, develops, and tests innovative technology for aeronautics and spaceflight. On Cover: The sphere graphic on the lower left includes images from many of GRC’s research facilities and technologies. The four images in the upper right highlight GRC’s Simulated Lunar Operations laboratory and the Curiosity rover operating on Mars.
“The most important thing we can do is inspire young minds and to advance the kind of science, math and technology education that will help youngsters take us to the next phase of space travel.”
- Senator John H. Glenn, Jr., NASA Astronaut and United States Senator

E
ngineering Design C
hallenge
1
Table of Contents Introduction to the Engineering Design Challenge ................................................................ 3 Facilitator Overview .............................................................................................................. 4
Elements of the Engineering Design Challenge .......................................................................... 4 Next Generation Science Standards: Performance Expectations .............................................. 4
Introduction to Related NASA Research: NASA’s Glenn Research Center’s Simulated Lunar Operations Facility and the Curiosity Rover ......................................................... 5
The Engineering Design Process .......................................................................................... 7 Formative and Summative Assessment Options .................................................................. 9
Engineering Design Challenge: Sample Learning Targets ....................................................... 10 Engineering Design Challenge Formative Assessment: Before Learning Self-
Assessment ........................................................................................................................ 11 Lead-Up Investigations: Sample Learning Targets .................................................................... 12 Lead-Up Investigations Formative Assessment A: Before Learning Self-Assessment ........... 13 Lead-Up Investigations Formative Assessment B: Active-Reading Response ....................... 14 Engineering Design Challenge Pre-assessment/Post-assessment ......................................... 15
Materials List ....................................................................................................................... 17 Facilitator Guide for Engineering Design Challenge ........................................................... 19
The Challenge ............................................................................................................................. 19 Next Generation Science Standards Addressed ....................................................................... 19 Performance Expectations .......................................................................................................... 19 Materials for Design Challenge ................................................................................................... 19 Facilitator Notes ........................................................................................................................... 20 Procedure .................................................................................................................................... 20 Differentiation Options ................................................................................................................. 22
Student Resources for Engineering Design Challenge ....................................................... 23 Student Background.................................................................................................................... 24 Student Challenge Sheet ............................................................................................................ 25 Student Test Vehicle Assembly Instructions .............................................................................. 27 Student Test Vehicle Templates ................................................................................................. 29 Student Data Sheet ..................................................................................................................... 31 Student Documentation of Results ............................................................................................. 33 Assessment Rubric for Design Challenge .................................................................................. 35
Lead-Up Investigations Background and Supporting Content ............................................. 37 Student Performance Rubric for Lead-Up Investigations .......................................................... 42 Investigation One—“Racing Against Friction” .............................................................................. 43 Investigation Two—“Stacked for Power”...................................................................................... 47 Investigation Three—“Charged Attraction” .................................................................................. 51 Investigation Four—“Fine Motor Skills” ........................................................................................ 57
Glossary of Key Terms ........................................................................................................ 65 Related Supplemental NASA Educational Activities ........................................................... 66 Links to Related NASA Content .......................................................................................... 67

G
aini
ng T
ract
ion
on M
ars
2

E
ngineering Design C
hallenge
3
Introduction to the Engineering Design Challenge
Dear Formal and Informal Educators,
The students you work with today are the scientists, technicians, engineers, and mathematicians of tomorrow. Creativity, curiosity, analytical thinking, and the ability to successfully utilize the engineering design process are characteristics and skills necessary for NASA’s future workforce. Engineering design challenges, like the one shared in this guide, create authentic learning experiences that allow students to develop these skills through rigorous and engaging Science, Technology, Engineering, and Mathematics (STEM) content. This design challenge directly correlates with work being done in the Simulated Lunar Operations (SLOPE) facility at NASA’s Glenn Research Center. Engineers are testing wheels matching those on the Curiosity rover on Mars and are studying the challenges regarding their longevity. These engineers have worked hand-in-hand with our education team in developing this content to accurately simulate the research that they are doing. This facilitation guide is designed for versatility. It includes four lead-up investigations that provide background knowledge for the Engineering Design Challenge, students dive into understanding the forces that interact to propel a vehicle across a sandbox—the same forces that push a car down the highway or move a rover on Mars. These lead-up investigations take approximately 45 minutes each to complete. The challenge problem can be implemented in as little as 1 week, but it can continue open-endedly as your students test and improve their designs. All the activities are designed with both you and your students in mind. They include simple explanations of relevant background information, clear step-by-step instructions of each process, reflective student data sheets, and concise rubrics for evaluating student performance. You can use all the materials presented in this guide, or customize your implementation of the challenge with resources that best fit the setting in which you operate. NASA supports educators and facilitators, like you, who play a key role in preparing students for careers in STEM fields through engaging content. Thank you for helping us to share this learning experience with your students.
Engineering Design Challenge Team Glenn Research Center Office of Education

G
aini
ng T
ract
ion
on M
ars
4
Facilitator Overview
This Engineering Design Challenge serves as an authentic standards-based investigation into a real scientific and engineering problem. It includes a main “challenge problem” and four lead-up investigations that explore the interactions between materials, electromagnetic forces, and the engineering design process. The investigations and challenge problem are designed to be used sequentially; however, each can be used as a single standalone activity.
Elements of the Engineering Design Challenge “Gaining Traction on Mars” Challenge Problem: Students will work in engineering design
teams to create and test various wheel designs and materials on a test vehicle to determine which are most effective on a simulated Martian surface.
Lead-Up Investigations: To understand how the test vehicle operates, students will explore the inner-workings that operate the vehicle through four lead-up investigations:
1. “Racing Against Friction”—Students will test materials for the effects of friction. 2. “Stacked for Power”—Students will build a battery and measure its output. 3. “Charged Attraction”—Students will build an electromagnet and measure its attractive
capabilities. 4. “Fine Motor Skills”—Students will build an electromagnetic motor and measure its
efficacy in terms of rotations per minute (RPMs).
Next Generation Science Standards: Performance Expectations
MS-ETS1: Engineering Design MS-ETS1-1: Define the criteria and constraints of a design problem with sufficient
precision to ensure a successful solution taking into account relevant scientific principles and potential impacts on people and the natural environment that may limit possible solutions.
MS-ETS1-2: Evaluate competing design solutions using a systematic process to determine how well they meet the criteria and constraints of the problem.
MS-PS2: Motion and Stability: Forces and Interactions MS-PS2-2: Plan an investigation to provide evidence that the change in an object’s
motion depends on the sum of the forces on the object and the mass of the object. MS-PS2-3: Ask questions about data to determine the factors that affect the strength of
electric and magnetic forces. MS-PS2-5: Conduct an investigation and evaluate the experimental design to provide
evidence that fields exist between objects exerting forces on each other even though the objects are not in contact.

E
ngineering Design C
hallenge
5
Introduction to Related NASA Research: NASA’s Glenn Research Center’s Simulated Lunar Operations Facility and the Curiosity Rover
NASA’s Glenn Research Center’s (GRC) Simulated Lunar Operations (SLOPE) facility is a unique indoor, climate-controlled environment used to simulate driving conditions on the Moon or Mars. It houses large tanks of simulated extraterrestrial “soil,” called regolith. One tank includes an adjustable tilt bed that can be filled with the various regolith simulants for conducting traction tests as well as other tests that relate to planetary exploration.
Developed in 2005 at GRC, this laboratory is designed to optimize mobility of various vehicles on surface of the Moon and Mars.
GRC decided to research wheel design and terramechanics, a field of study that focuses on the interface between a machine and the terrain beneath it. By studying these interactions, researchers can better design wheel structures for load, traction, and lifespan.
Wheel design is inherently more challenging for lunar applications because of the rugged and often varying nature of the terrain, the extreme temperatures (both hot and cold) at the surface, and the need to absorb impacts without puncturing a tire. To evaluate the performance of lunar wheels, researchers use simulant materials that have mechanical properties similar to those of lunar regolith and that mimic the terrain response to vehicles on the Moon. A large 12 × 6 × 0.3-m soil bed, split into two lanes, each with a different material, is used to compare the tractive performance of full-size vehicles under different situations. A 6 × 5 × 0.3-m adjustable tilt bed that can be raised to 45° is used to simulate climbing a slope on the Moon.
So that GRC researchers could learn from the extensive research and development that had been put into the tires for the original Apollo Lunar Roving Vehicles (LRVs), they followed archived technical blueprints and interviewed Apollo engineers. With this information and support from Goodyear, they built 12 replicates of the LRV wheels to better understand lunar terramechanics and determine ways to improve the design. The LRV tires, which were constructed of a wire mesh woven of piano wire material, were designed to deal with the extreme temperature shifts and lack of air pressure on the lunar surface. These non-inflatable tires could not be punctured and would not become flat. Influenced by this design, engineers at GRC and Goodyear worked to develop tires that could withstand 10 times the load for which the LRV tires were designed, while still generating traction in the
Two test vehicles sitting in the SLOPE test bed with the tilt bed inclined at the 20° position.
Airless tire developed and tested by NASA and Goodrich

G
aini
ng T
ract
ion
on M
ars
6
extreme lunar environment. The result was the “Spring Tire,” an airless, compliant tire made of several hundred springs woven together into a mesh. These tires can carry up to 270 kg each and conform very well to uneven terrain which helps to generate traction. This enveloping capability also allows the wheels to absorb impacts without losing energy.
In support of the Mars Science Laboratory (MSL) Program, a set of the same wheels as those currently on the Curiosity rover on Mars were sent to GRC recently for performance evaluation by the Jet Propulsion Laboratory (JPL). The goal was to understand the effects of wheel damage on traction performance. In the photograph, GRC technician Ariana Miller is checking the wheel mount and drive hardware assembly on a Curiosity wheel for tests using the Traction and Excavation Capabilities (TREC) rig, which is housed in the
SLOPE laboratory. Researchers are using a newly built single-wheel tester that simulates a variety of terrain conditions similar to those found on Mars, including loose granular soil, dense high-shear-strength soil, and a bedrock-like material.
Compared with the first 12 months of the rover’s mission on Mars, the pace of holes appearing in Curiosity’s aluminum wheels increased unexpectedly in late 2013. Curiosity was crossing terrain studded with sharp embedded rocks. By early 2014, changes in route planning and driving methods had slowed the pace of wheel damage. The tests at GRC were part of the rover project’s efforts to understand how the damage occurs, to develop methods for further reducing the pace of damage, and to anticipate how the accumulation of wheel damage could affect performance.
SLOPE facts: • The test rigs and equipment in the SLOPE laboratory are used to study the traction
and power consumption of lunar vehicles and other machines operating in soil. • A dedicated wheel-test vehicle can be configured to four-by-four or six-by-six mode. • A 12 × 6 × 0.3-m soil tank is used for flat surface operations. • A drawbar pull rig applies controlled pull force to a test vehicle while wheel slip is
recorded. • A 6 × 5 × 0.3-m adjustable tilting (0° to 45°) soil tank is used for sloped surface
operations. • A portable bevameter, a tool used to analyze the surface strength of a terrain,
facilitates the modeling of terrain-machine interactions in the lab.
GRC technician conducting a test on a simulated Curiosity rover wheel in the TREC rig.
Close-up of one of the Curiosity rover's wheels on Mars. Some damage is noticeable near the top of the image.

E
ngineering Design C
hallenge
7
The Engineering Design Process
The engineering design process involves a series of steps that lead to the development of a new product or system. In this design challenge, students complete each step and document their work as they develop their solution. The students should perform each step and then record their work on each of the following:
STEP 1: Identify the problem—Students state the challenge problem in their own words.
Example: How can I design a __________ that will __________?
STEP 2: Identify criteria and constraints—Students specify the design requirements (criteria). What properties must their designed solution possess? Students should list the limits on the design due to available resources and the environment (constraints). What limitations must be accounted for in the final design? Students should revisit these during each design iteration (one instance of a repeated process) to make sure that no limitations have been overlooked; however, students might choose to intentionally ignore one or more criteria or constraints on an early design to focus on others. This should be recorded in notes.
STEP 3: Brainstorm possible solutions—Each student in the group sketches his or her own ideas as the group discusses ways to solve the problem. Labels and arrows should be included to identify parts and how they might interact. These drawings should be quick and brief.
STEP 4: Select a design—Students show their designs to the group. Then the group discusses the positive and negative aspects of each design. The group chooses a design to begin building, possibly implementing aspects from several designs into one.
STEP 5: Build a model or prototype—Students construct a full-size or scale model based on the selected designs. The teacher helps the group identify and acquire appropriate modeling materials and tools.
STEP 6: Test the model and evaluate—The group repeatedly tests their solutions in a controlled test environment. They take measurements and make observations during each test and begin to consider modifications that could address any problems or concerns with the design that arise during testing.
STEP 7: Refine the design—The group examines and evaluates their prototypes or designs based on the criteria and constraints. Group members may enlist students from other groups to review the solution and help to identify changes that need to be made. Based on criteria and constraints, teams must identify any secondary problems and proposed solutions.
STEP 8: Share the solution—The group demonstrates their solution in a public forum that allows them to demonstrate the knowledge and skills that they have gained from utilizing the engineering design process to solve the initial problem.

G
aini
ng T
ract
ion
on M
ars
8
The Engineering Design Process

E
ngineering Design C
hallenge
9
Formative and Summative Assessment Options
The following pages contain tools for formative assessment. These tools help educators determine what students do and do not know before they participate in any of the Engineering Design Challenge activities. These tools include:
• Engineering Design Challenge: Sample Learning Targets—Facilitators can use this sample set of learning targets in planning lessons using the “Gaining Traction on Mars” challenge problem.
• Engineering Design Challenge Formative Assessment: Before Learning Self-Assessment—Students can use this inventory tool to determine which of the key skills incorporated in the Engineering Design Challenge are familiar to them and which skills could use more practice.
• Lead-Up Investigations: Sample Learning Targets—Facilitators can use this sample set of learning targets in planning lessons using the lead-up investigations.
• Lead-up Investigations Formative Assessment Option A: Before Learning Self-Assessment —Students can use this inventory tool to determine which of the key skills incorporated in the lead-up investigations are familiar to them and which skills could use more practice.
• Lead-up Investigations Formative Assessment Option B: Active Reading Response— Instead of having students take the self-assessment, facilitators can use this assessment to determine levels of prior knowledge regarding the key skills of the lead-up investigations.
This section also includes an Engineering Design Challenge Pre/Post-Assessment that
will be used during NASA evaluations to measure expected outcomes from the use of the Engineering Design Challenge. Facilitators can also use this tool in determining knowledge gains. Answer Keys for Specific Assessment Tools
Lead-up Investigations Formative Assessment Option B: Active Reading Response Activity
Engineering Design Challenge Pre/Post-Assessment
1. rest, forces 2. force 3. imbalance 4. battery 5. electromagnet 6. current 7. chemical, mechanical 8. speed 9. energy 10. friction
1. c 2. a 3. d 4. a 5. c 6. b 7. a 8. b 9. c 10. a

G
aini
ng T
ract
ion
on M
ars
10
Engineering Design Challenge: Sample Learning Targets
Learning targets should be created by facilitators using their specific performance indicators for their lessons. Learning targets should be shared with students. A learning target unpacks a “bite size” amount of learning. Learning targets define expectations for learning and how students will demonstrate their understanding.
Disclaimer: Learning targets should reflect the specific learning standard being addressed. Therefore the listing below serves as a sample and may not include the learning target most appropriate for the specific performance indicator every class is addressing.
Bloom’s Taxonomy Level Sample Learning Target
Remembering
I can memorize the steps of the engineering design process. I can define “iterative.” I can name the constraints of a design problem. I can recognize the impacts of possible solutions.
Understanding
I can describe the steps in the engineering design process. I can label the forces acting upon an object. I can summarize the criteria and constraints of a particular
design problem. I can explain the similarities and differences between the
engineering design process and the scientific method.
Applying I can measure and record various types of data. I can explain the criteria and constraints of a design problem I can conduct tests of designs and collect data.
Analyzing
I can categorize the impacts of a possible design solution. I can compare similarities and differences among several
design solutions. I can infer possible reasons for test results. I can analyze data from tests.
Evaluating
I can assess the quality of a design based on data collected I can critique how a design solution meets criteria for
success. I can justify a design based on data collected.
Creating I can construct a model based on a design. I can design a model to generate data. I can predict the impact of possible solutions.

E
ngineering Design C
hallenge
11
Engineering Design Challenge Formative Assessment: Before Learning Self-Assessment
Directions: On the space next to statement give yourself the score that describes your ability to complete the learning target.
0 = “NO” 1 = “SORT OF” 2 = “YES”
Learning Target Your Score
I can memorize the steps of the engineering design process.
I can define iterative.
I can measure and record various types of data.
I can explain the criteria and constraints of a design problem.
I can conduct tests of designs and collect data.
I can describe the steps in the engineering design process.
I can explain the similarities and differences between the engineering design process and the scientific method.
I can name the constraints of a design problem.
I can predict the impact of possible solutions.
I can describe the steps in the engineering design process.
I can label the forces acting upon an object.
I can summarize the criteria and constraints of a particular design problem.
I can explain the similarities and differences between the engineering design process and the scientific method.
I can construct a model based on a design.
Self-Assessment Inventory Score

G
aini
ng T
ract
ion
on M
ars
12
Lead-Up Investigations: Sample Learning Targets
Facilitators should use their specific performance indicators for their lessons in creating learning targets. Learning targets should be shared with students. A learning target unpacks a “bite size” amount of learning, and it defines expectations for learning and how students will demonstrate their understanding.
Disclaimer: Learning targets should reflect the specific learning standard being addressed. The following listing serves as a sample. It might not include the learning target most appropriate for the specific performance indicator that a particular class is addressing.
Bloom’s Taxonomy Level Sample Learning Target
Remembering I can define force. I can identify how the speed of an object can be changed. I can recognize the force acting upon an object.
Understanding
I can describe how a force acts upon an object. I can recognize that different surface types cause friction
differently. I can summarize Newton’s First Law of Motion.
Applying I can demonstrate how magnets can produce electricity. I can explain how forces act upon an object. I can label the forces acting upon an object.
Analyzing I can categorize examples of chemical and electrical energy. I can compare chemical and electrical energy. I can infer what will happen when two forces interact.
Evaluating I can critique how diverse surface types cause friction
differently. I can justify a design (wheel) based on data collected.
Creating I can construct a simple circuit. I can predict the result when a force is applied in a particular
direction.

E
ngineering Design C
hallenge
13
Lead-Up Investigations Formative Assessment A: Before Learning Self-Assessment
Directions: On the space next to statement give yourself score based on your ability to complete the learning target.
0 = “NO” 1 = “SORT OF” 2 = “YES”
Learning Target Your Score
I can define force.
I can identify how the speed of object can be changed.
I can recognize the force acting upon an object.
I can describe how a force acts upon an object.
I can label the forces acting upon an object.
I can recognize that different surface types cause friction differently.
I can demonstrate how magnets can produce electricity.
I can explain how forces act upon an object.
I can categorize examples of chemical and electrical energy.
I can compare chemical and electrical energy.
I can infer what will happen when two forces interact.
I can critique how diverse surface types cause friction differently.
I can design a wheel that increases friction.
I can predict the result when a force is applied in a particular direction.
I can construct a simple circuit.
Self-Assessment Inventory Score
G
aini
ng T
ract
ion
on M
ars
14
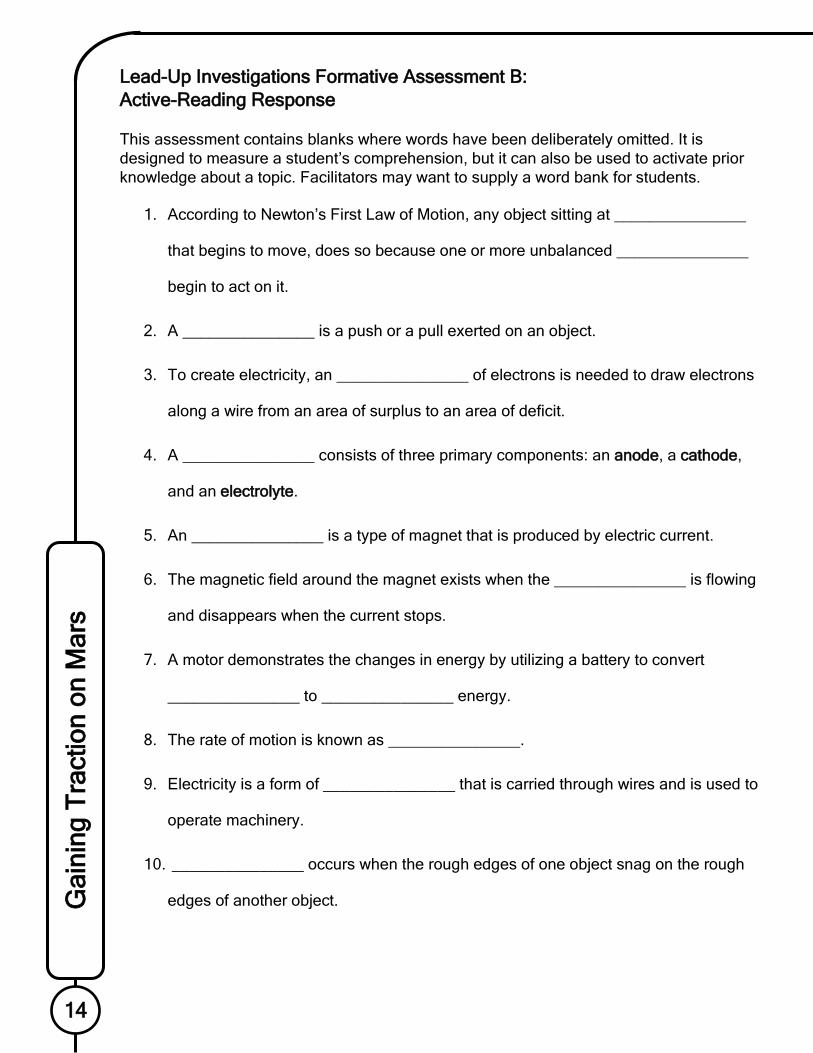
Lead-Up Investigations Formative Assessment B: Active-Reading Response This assessment contains blanks where words have been deliberately omitted. It is designed to measure a student’s comprehension, but it can also be used to activate prior knowledge about a topic. Facilitators may want to supply a word bank for students.
1. According to Newton’s First Law of Motion, any object sitting at _______________
that begins to move, does so because one or more unbalanced _______________
begin to act on it.
2. A _______________ is a push or a pull exerted on an object.
3. To create electricity, an _______________ of electrons is needed to draw electrons
along a wire from an area of surplus to an area of deficit.
4. A _______________ consists of three primary components: an anode, a cathode,
and an electrolyte.
5. An _______________ is a type of magnet that is produced by electric current.
6. The magnetic field around the magnet exists when the _______________ is flowing
and disappears when the current stops.
7. A motor demonstrates the changes in energy by utilizing a battery to convert
_______________ to _______________ energy.
8. The rate of motion is known as _______________.
9. Electricity is a form of _______________ that is carried through wires and is used to
operate machinery.
10. _______________ occurs when the rough edges of one object snag on the rough
edges of another object.

E
ngineering Design C
hallenge
15
Engineering Design Challenge Pre-assessment/Post-assessment
Multiple choice directions: Read each question and their corresponding answers carefully and completely. Choose the answer that best fits the question.
Use the following information to answer questions 1 and 2. Julia and Mike did an investigation with a toy car. They recorded their data in the
following table on their Student Data Sheet.
Trial Time (sec) Distance (cm) 1 7.23 6.98 2 8.23 7.56 3 8.56 8.22 4 9.00 8.50
___1. According to the data table, which question can Julia and Mike answer?
a. How does the size of the wheels affect the distance that the car moved? b. How does the mass of the car affect the distance that the car moved? c. How does the length of time that the car rolled affect the distance that the car
moved? d. How does the length of the track affect the distance that the car moved?
___ 2. According to the data table, what can you infer?
a. Increase in time traveled is related to distance traveled. b. The larger the mass of the toy car, the farther it travels. c. The color of the toy car affects the speed that it travels d. The smaller the mass of the toy car, the farther it travels.
___ 3. The word “iterative” means ________.
a. unusual b. limiting c. rare d. repeating
___ 4. What is the first step in the Engineering Design Process?
a. Identify the problem b. Gather resources c. Build a model or prototype d. Brainstorm possible solutions
___ 5. What is the second step in the Engineering Design Process?
a. Redefine the design b. Test the model and evaluate c. Identify criteria and constraints d. State a hypothesis
___6. What is the final step in the Engineering Design Process?
a. Identify the problem b. Share the solution c. Record data d. Design

G
aini
ng T
ract
ion
on M
ars
16
___ 7. A limitation or restriction placed on a design solution is known as a…
a. Constraint b. Process c. Variable d. Resource
___ 8. When solving an engineering design problem the best way to determine the best solution is to…
a. pick a solution out of a hat. b. systemically test many designs and compare data c. build one solution and adjust accordingly. d. randomly test designs and estimate results
Use the following information to answer questions 9 and 10.
Derek and Lauren did an investigation using paper airplanes. The paper airplanes were folded using identical sheets of printer paper (8.5 in. x 11 in.). Derek and Lauren recorded their data in the following table on their Student Data Sheet.
Trial 1 Model A Model B
Distance (m) 15.5 12.8 Time in air (sec) 5.2 7.6
Trial 2 Distance (m) 14.2 11.5
Time in air (sec) 4.6 7.2 Trial 3
Distance (m) 14.7 12.5 Time in air (sec) 4.8 7.8
___ 9. According to the information above, which factor was the most important in
contributing to the distance that the plane traveled?
a. Air resistance b. Mass of the plane c. Shape of wings d. Color of plane
___ 10. Using only the data table, determine which statement is most accurate.
a. Model A traveled longer distances; Model B stayed in the air longer. b. Model A traveled longer distances; Model B was heavier. c. Model A traveled shorter distances; Model B was faster. d. Model A stayed in the air longer; Model B was faster.

E
ngineering Design C
hallenge
17
Materials List
The materials list below serves as an “at-a-glance” planning tool for acquiring all the materials needed for each activity. For any of the activities, materials can be modified to match specific resource limitations or existing supplies. Many of the same materials are used across multiple activities to help reduce materials costs.
Engineering Design Challenge: Gaining Traction on Mars
Item Quantity Unit
Needed per student, group,
or site Student activity sheets and rubric (two-sided) 7 sheets per student Set of two test vehicle templates: 1 schematic template and 1 rim template 1 sheet of templates per group
Corrugated cardboard, 10 × 10 cm (approx. 4 × 4 in.) 1 piece of cardboard per group Corrugated cardboard, 7.5 × 10 cm (3 × 4 in.) 1 piece of cardboard per group Empty toilet paper roll 1 cardboard roll per group 9V battery 1 9V battery per group 9V battery connector 1 9V battery connector per group Single-pole, double-throw submini toggle switch (3 A at 125 VAC, 1 A at 250 VAC) 1 switch per group
130-size toy/hobby motor 4 motors per group Roll of electrical tape 1 roll of electrical tape per group Roll of masking tape 1 roll of masking tape per group Roll of transparent tape 1 roll of transparent tape per group Hole-punching tool (paper clip, bamboo skewers or strong toothpicks) 1 hole-punching tool per group Pair of scissors 1 pair of scissors per group Bottle of liquid glue 1 bottle of glue per group 30-cm (12-in.) ruler 1 ruler per group Pair of wire strippers 1 pair of wire strippers per site Pair of full-size scissors for cutting cardboard 1 pair of full-size scissors per site Rolls of 22-gauge wire (one roll with red insulation, one with black) for backup 2 rolls of 22-gauge wire per site
Manual one-hole punch 1 manual one-hole punch per site Underbed storage box, 100 × 51 × 17.5 cm (39.5 × 20 × 7 in.) 1 underbed storage box per site Bag of play sand, 22.7 kg (50 lb) 1 50-lb bag of play sand per site Investigation One—“Racing Against Friction”
Item Quantity Unit
Needed per student, group,
or site Student activity sheets and rubric (two-sided) 2 sheets per student
Books, blocks, or other materials that can be stacked to a height of 4 cm 1 set of 4-cm high materials per group
Thick corrugated cardboard for ramp, 60 × 30 cm (2 × 1 ft) 1 cardboard ramp per group Rolled wax paper, 1 piece, 60 cm (2 ft) 60 cm of wax paper per group Rolled bubble wrap, 1 piece, 60 cm (2 ft) 60 cm of bubble wrap per group Coarse (50- to 100-grit) sand paper, 2 sheets, 23 × 28 cm (9 × 11 in.) 2 sheets of sandpaper per group Craft felt, 2 sheets, 23 × 30 cm (9 × 12 in.) 2 sheets of craft felt per group Roll of masking tape 1 roll of masking tape per group Small toy car with moving wheels 1 toy car per group Stopwatch 1 stopwatch per group
Meter stick or measuring tape 1 meter stick or measuring tape per group
Pair of scissors 1 pair of scissors per group Investigation Two—“Stacked for Power”

G
aini
ng T
ract
ion
on M
ars
18
Item Quantity Unit
Needed per student, group,
or site Student activity sheets and rubric (two-sided) 2 sheets per student Clean pennies—free from dirt or patina (green tarnish from oxidation) 5 pennies per group 5/8-in. Zinc washers 5 zinc washers per group 150-ml (approx. 0.5-c.) Distilled water 0.5 cups of distilled water per group 266-ml (9-oz) Disposable cup 1 cup per group 17-g (1-T.) table salt 1 tablespoon of salt per group Coffee filters (basket or cone) 2 filters per group Roll of heavy-duty aluminum foil (divided into 2 × 4-cm pieces) 1 roll per site AA battery 1 AA battery per group Voltage meter 1 voltage meter per group Tweezers 1 pair of tweezers per group Voltage meter 1 voltage meter per group 1-c. liquid measuring cup 1 measuring cup per site 1-T. measuring spoon 1 measuring spoon per site Roll of electrical tape 1 roll of electrical tape per site Investigation Three—“Charged Attraction”
Item Quantity Unit
Needed per student, group,
or site Student activity sheets and rubric (two-sided) 3 sheets per student Ceramic iron ferrite disc magnets—1 × 5/32 in. recommended 2 magnets per group
26-gauge, enamel-coated “magnet” wire, 120-cm (approx. 4-ft) 4 feet of 26-gauge magnet wire
per group
7.5-cm (3-in.) galvanized/zinc-coated nail 1 nail per group 3-cm (1.25-in.) small paper clips 10 small paper clips per group Piece of coarse (50- to 100- grit) sandpaper, 2.5 × 5 cm (1 × 2 in.)—cut from 9 × 11-in. sheets
0.025 sheet of sandpaper per group
AA battery 1 AA battery per group Pair of scissors 1 pair of scissors per group 30-cm (12-in.) ruler 1 ruler per group Heat-protective glove 1 protective glove per group Roll of electrical tape 1 roll of electrical tape per group Investigation Four—“Fine Motor Skills”
Item Quantity Unit
Needed per student, group,
or site Student activity sheets and rubric (two-sided) 3 sheets per student Piece of corrugated cardboard, 10 × 10 cm 1 piece of cardboard per group 3-cm (1.25-in.) small paper clips 2 small paper clips per group AA battery 1 AA battery per group Ceramic iron ferrite disc magnets—1 × 5/32 in. recommended 2 magnets per group
26-gauge, enamel-coated “magnet” wire, 125 cm (4 ft) 4 feet of 26-gauge magnet wire
per group
10-cm pieces of 22-gauge solid copper insulated wire—recommend 1 red/white piece and 1 black/blue piece 2 10-cm pieces of
22-gauge wire per group
Piece of coarse (50-100) grit sandpaper, 2.5 × 5 cm (1 × 2 in.)—cut from 9 × 11-in. sheets 0.025 sheet of sandpaper per group
30-cm (12-in.) Ruler 1 ruler per group Pair of scissors 1 pair of scissors per group Roll of electrical tape 1 roll of electrical tape per group Stopwatch 1 stopwatch per group Pair of wire strippers 1 pair of wire strippers per site Extra motor to be disassembled or motor diagram (optional) 1 motor (diagram) per site

E
ngineering Design C
hallenge
19
Facilitator Guide for Engineering Design Challenge
The Challenge Students will build a standard vehicle as a
means to design and test wheels that achieve traction on a simulated Mars surface. The vehicle will be placed in the test bed switched on and with the back wheels touching the wall. It will then be timed until it touches the opposite wall with the front wheels. A successful solution will have the fastest time and the least amount of wheel damage. Bonus points will be awarded for any design that can also climb the test bed at an inclined angle determined by the team.
Next Generation Science Standards Addressed MS-ETS1-1: Define the criteria and constraints of a design problem with sufficient
precision to ensure a successful solution taking into account relevant scientific principles and potential impacts on people and the natural environment that may limit possible solutions.
MS-ETS1-2: Evaluate competing design solutions using a systematic process to determine how well they meet the criteria and constraints of the problem.
Performance Expectations Students will provide evidence of their understanding of the engineering design process
by evaluating design solutions and determining how well their designs meet the constraints of the problem. Students will demonstrate their understanding of the interaction of forces and the strength of electromagnetic and physical forces by evaluating how their design was implemented in their experimental investigations.
Materials for Design Challenge Each group of students will require the following supplies to assemble one test vehicle: • 1 set of two test vehicle templates—1 schematic template and 1 rim template • 1 piece of corrugated cardboard, 10 × 10 cm (approx. 4 × 4 in.) • 1 piece of corrugated cardboard, 7.5 × 10 cm (3 × 4 in.) • 1 empty toilet paper roll • 1 9V battery • 1 9V battery connector • 1 Single-pole, double-throw submini toggle switch (3 A at 125 VAC, 1 A at 250 VAC) • 4 130-size toy/hobby motors • 1 roll of electrical tape • 1 roll of masking tape • 1 roll of transparent tape • 1 hole-punching tool (paper clip, bamboo skewers, or strong toothpick) • 1 pair of scissors (full-size recommended for cutting cardboard) • 1 bottle of liquid glue • 1 30-cm (12-in.) ruler In addition, students will need to decide which additional materials they will use in
designing and creating their unique wheels. One common set of usable materials could be
Challenge's test vehicle

G
aini
ng T
ract
ion
on M
ars
20
provided for the whole class, or each group could be assigned to acquire the materials that the group decides to use.
The entire class will also need at least one of the following items: • 1 pair of wire strippers • 1 pair of full-size scissors for cutting cardboard • 2 rolls of 22-gauge wire (1 roll with red insulation and 1 roll with black insulation) for
backup • 1 manual one-hole punch • 1 underbed storage box, 100 × 51 × 17.5 cm (39.5 × 20 × 7 in.) • 1 bag of play sand, 22.7 kg (50 lb)
Facilitator Notes • This design challenge provides a strong correlation between the student work and
ongoing work in NASA’s SLOPE laboratory. As verified by the NASA subject matter experts, the vehicle that students build and use for this challenge operates according to concepts similar to those for a SLOPE test vehicle: it utilizes four electric motors to operate wheels independently. In addition, the student vehicle tests wheel friction in a way similar to how the SLOPE vehicle tests friction.
• Time is being used to collect quantitative (numeric) data that can be used to compare success among various wheel designs. Because the speed of motor rotation on the vehicle is relatively uniform, speed across the test bed can be used to assume better traction on the simulated Martian surface. Speed would not be an evaluation factor for real rovers sent to Mars.
• This design challenge simulates the surface of Mars. It is important to point out to students that the atmospheres of Mars and Earth are different and that, although the materials they choose may work on Earth, they may not necessarily work on Mars. Students may want to consider substitutions in materials that would be more suitable to the Martian environment based on their most successful design.
Procedure Advanced Preparation for Challenge
• Read the following documents to become familiar with the design challenge components: ○ Introduction to Related NASA Research ○ Facilitator Notes ○ Student Sheets ○ Assessment Rubric for Design Challenge
• Gather the required materials and any other supplies that the teams may be able to use for their wheel designs. This guide assumes standard wiring colors, but some elements (motors, connectors, etc.) may vary in color. Be sure to provide this information to the students.
• Build one test vehicle with the original base wheels so that students can see the vehicle that will be using their wheels.
• Pour the play sand into the bottom of the underbed storage box to create a smooth, even 3-cm depth of sand on the bottom of the storage box. This box simulates NASA’s SLOPE test bed.
• Create teams of three to four students each.

E
ngineering Design C
hallenge
21
Safety warning: Protective eyewear should be worn by students and facilitators when conducting scientific investigations and challenges.
Introduce the Challenge
• State the challenge problem. Then have the students restate the challenge problem in their own words.
• Have the students list all of the criteria and constraints that they should consider in designing their solution.
• Have each of the teams build their own test vehicle as explained in the “Student Test Vehicle Assembly Instructions.” The procedure is broken into two sessions to allow the wheels to dry fully before they are used on the vehicle. The procedure can be done in one complete process, but the glue will be wet and may spray when the motors spin up for the first time.
Student Team Work
• Students should begin to consider names for their teams. However, they may want to change the name as their design evolves.
• Students should select their roles on the team, for example: ○ Design engineer—sketches, outlines, patterns, or plans the ideas that the team
generates ○ Technical engineer—assembles, maintains, repairs, or modifies the mechanical or
electrical components of the system ○ Operations engineer—sets up and operates the system to complete a process or
test ○ Technical writer—records and organizes information and data and prepares
documentation to be published • Teams design, construct, and test through trial and error, a wheel system that best
meets the challenge requirements. This should be a repeated process and should allow teams to demonstrate improvement in performance from their original design to their final design.
• Teams record the changes and or modifications that are made to the wheel system throughout the engineering design process, including why the changes were required, what changes were made, and what was the outcome of the changes.
• As student groups are working, ask them to explain what they are doing and why. Remind them to constantly reflect on the group ideas and whether or not those ideas are successful. Students must be able to explain the process from the origin through to completion. Ask groups what they are doing and their reasoning behind which materials they are using. Remind them to record their data to document their process and their reflections for the video presentation at the end of the challenge.
Report Out
• Teams create a final poster presentation of their designs and modifications through the engineering design process.
• Teams report their designs and what they have learned by creating a 5-minute video explaining their design through the engineering design process. This video can be submitted to NASA for review as a response to the challenge.
!

G
aini
ng T
ract
ion
on M
ars
22
Challenge Rules • So that the wheel design will be the only variable, the test vehicle must be built
exactly according to the instructions and templates. The wheels may only attach by being affixed to the motor shafts on the four wheels.
• The wheels may be of any shape, size or material as long as the vehicle with the wheels attached can fit entirely within a 20-cm (7-7/8-in.) square box with all four wheels touching the floor of the box.
• The total weight of the vehicle with wheels included may not exceed 200 g. • Any design must be tested successfully no less than 3 times, and a mean average
time must be calculated. More tests will add validity to the data, and data for any tests that are unsuccessful because of a malfunction—although recorded and reflected upon—should not be included in the average.
• After demonstrating a successful design on a flat (0°) test bed, teams may choose to test their design on an inclined bed. Any successful incline will score a bonus in the total design score by a percent equal to the degree of incline. (For example, if a design scores 30 on the design and successfully climbs a 10° slope, 30 design points + 3 bonus points (10% × 30 design points) = a total design score of 33.)
Differentiation Options The following options can be used to modify the content of the challenge and supporting
lead-up investigations to accommodate the available time and students of all ability levels.
Modifications • Provide the test vehicle prebuilt so that students can focus entirely on the wheel
design. • Place students in mixed-ability groups, and intentionally assign them to team roles
that match their abilities. • Allow students to present their results in formats other than on poster board or video,
such as in a one-on-one conversation, to determine the knowledge gains. • Allow additional time, or break activities into smaller, more manageable pieces. • Decrease, or remove, mass or size constraints to modify the difficulty of the
challenge. • Omit one or more of the lead-up investigations if they do not address the needs of
the students, either because the content covered is not relevant or because it is provided within the curriculum of a different grade level.
Enrichments • Have students research and present suggestions for materials that would replace the
common materials used for their design that would be suitable for the Martian environment.
• After a successful design has been determined and presented as in the original challenge, add various sizes of rocks and gravel to the test bed to simulate a more rugged terrain.
• After a successful design has been determined and presented as in the original challenge, have the students duplicate their design and intentionally damage the wheels to determine if they still function acceptably with wear and tear.
• Increase the mass or size constraints to increase the difficulty of the challenge. • Use any or all of the “Related Supplemental NASA Activities” and “Links to Related
NASA Content” found in this guide to increase understanding.

E
ngineering Design C
hallenge
23
Student Resources for Engineering Design Challenge
The following resources are designed for student use. These sheets should be provided to each group of students creating a wheel design. These sheets include:
• Student Background—The science behind the challenge and the GRC SLOPE laboratory
• Student Challenge Sheet—A synopsis used to introduce the challenge, the required materials, and design rules and constraints
• Student Test Vehicle Assembly Instructions—Step-by-step instructions for assembling a test vehicle and basic wheels
• Student Test Vehicle Templates—Two templates that are taped to measured pieces of cardboard and used to align all pieces of the test vehicle (Note that the wiring schematic is color-coded, so if possible, these templates should be printed or copied in color
• Student Data Sheet—A two-sided sheet used to collect performance data on one iteration of an Engineering Design model (Each group will need one two-sided sheet for each new iteration of their design
• Student Documentation of Results—A summary of the documentation necessary to complete a full report of the Engineering Design Process
Other sections of this facilitation guide also may be printed or copied for student use,
depending on available time, resources, and student capabilities. The following sections may be useful to students:
• Introduction to Related NASA Research: GRC’s SLOPE laboratory and the Curiosity
rover—An introduction to the NASA research that this design challenge is modeling • The Engineering Design Process—A graphic and bulleted summary of the process
used in this challenge • Assessment Rubric for Design Challenge—A tool for assessing student performance,
not only in design but in reporting experiences and in the knowledge that they have gained from the entire challenge process
• Glossary of Key Terms—Terms that students may find confusing or unfamiliar (These terms are found in bold throughout the facilitation guide.

G
aini
ng T
ract
ion
on M
ars
24
Student Background The Challenges of Exploring Mars
Why go to Mars? By exploring the Red Planet, we can search for clues to whether there was ever life on Mars. On Earth, all life as we know it requires, among other things, water, carbon, and some source of energy. If we can find evidence of these resources on Mars, then recognizable life would have had a chance to survive there.
NASA’s Mars Science Laboratory rover, named “Curiosity,” landed on Mars in August 2012. It was designed to study the atmosphere, climate, and geochemistry in two areas of Mars: Gale Crater, believed to be a dried up ancient lakebed, and Mount Sharp, a mountain built of an extensive series of layered rocks. Both areas may provide clues about the history of Mars. Although the original mission was planned
for only 2 years, the rover was engineered to last up to 14 years.
You cannot just steer Curiosity on Mars with a wheel or joystick. Because of the great distance between Earth and Mars, engineers have to send computer commands to the rover overnight to tell it where to go the next day. These can either be direct commands (“move forward 10 m; turn left 45°”) or general instructions that the rover can use to determine its own path to a specific location (“navigate safely to that rock in the distance”). Curiosity uses six aluminum wheels to drive over the rocky and dusty
Martian terrain. Now that Curiosity has been on Mars more than 2 years, NASA scientists are finding that the rover’s wheels, especially
the middle two, are taking a bigger beating than first expected.
Why are the wheels so vulnerable to damage? First, rubber tires, like ones that are used all over the Earth, are not workable in the Martian environment. The atmosphere is so thin that the tires would start to “outgas” and fall apart. Second, Mars is so cold that the normal oils and greases used for inflatable tires and wheels would freeze. Third, the rover must be as light as possible to minimize the propellant used as the rover is launched from Earth, travels through space, and lands on Mars. Engineers constantly have to balance trying to remove every extra ounce of weight with keeping the rover durable enough to handle the rough Martian terrain. This is why Curiosity runs on very light aluminum wheels. When you are 50 million miles away from the nearest mechanic, it’s important to make sure that your rover doesn’t break down!
This view of Mount Sharp was compiled from data from three Mars satellites. The image shows the landing target for Curiosity in Gale Crater and the expected path up Mount Sharp.
This photograph, taken from the underside of the Curiosity rover sitting on Mars, clearly shows puncture damage on the treads of the aluminum wheel.

E
ngineering Design C
hallenge
25
Standard test vehicle inside an angled test rig.
Student Challenge Sheet
The Challenge Students build a standard vehicle as a means to
design and test wheels that achieve traction on a simulated Mars surface. To test the team design,
• The vehicle is placed in the test bed switched on and with the back wheels touching the wall.
• Next it is timed until it touches the opposite wall with the front wheels.
• Designs are evaluated for the fastest time and the least amount of wheel damage. • Bonus points are awarded for designs that can climb the test bed at an inclined
angle.
Required Materials
• 1 set of 2 test vehicle templates—1 schematic template, 1 rim template • 1 piece of corrugated cardboard 10 × 10 cm (approx. 4 × 4 in) • 1 piece of corrugated cardboard 7.5 × 10 cm (3 × 4 in.) • 1 empty toilet paper roll • 1 9V battery • 1 9V battery connector • 1 Switch • 4 motors • 1 roll of electrical tape • 1 roll of masking tape • 1 roll of transparent tape • 1 hole-punching tool (paper clip, bamboo skewer or strong toothpick) • 1 pair of scissors • 1 bottle of liquid glue • 1 30-cm (12-in.) ruler
Design Challenge Rules • To ensure that the wheel design is the only variable, students must build their test
vehicles exactly according to the build instructions and templates. The wheels may only attach by being affixed to the motor shafts on the four wheels.
• The wheels may be of any shape, size, or material, as long as the vehicle can fit entirely within a 20-cm (7-7/8 in.) square box with all four wheels touching the floor of the box.
• The total weight of the vehicle with wheels included may not exceed 200 grams. • Any design must be tested successfully no less than 3 times, and a mean average
time must be calculated. More tests will add validity to the data. Although data for tests that are unsuccessful because of malfunction should be recorded, they should not be included in the average.
• After demonstrating a successful design on a flat (0°) test bed, teams may choose to test their design on an inclined bed. Any successful incline test will score a bonus in the total design score by a percent equal to the degree of incline: for example, if a vehicle scores 30 design points for the flatbed tests and it successfully climbs a 10° slope, it will receive 30 design points + 3 slope bonus points (10% of 30 = 3) = a total design score of 33 points.
G
aini
ng T
ract
ion
on M
ars
26

E
ngineering Design C
hallenge
27
Standard test vehicle for the Engineering Design Challenge
Student Test Vehicle Assembly Instructions A simple test vehicle must be created to allow all wheel designs to be tested in the same
way. The following instructions create a working base vehicle that allows the wheels to be tested and switched out with new designs. Procedure - Part One
1. Cut the toilet paper roll into four even rings of approximately 2.5 cm (1 in.) each. These will serve as the base wheels.
2. Cut out and place the Rim Template on top of the 10 × 10-cm piece of cardboard. Use transparent tape to tape down the template completely along all four sides. Cut the cardboard apart on the dotted lines to create four smaller pieces with one rim template, taped on two sides to each smaller cardboard piece.
3. Using an open paper clip, toothpick or bamboo skewer, poke a hole through the template and cardboard at the small white dot in the center of each template. The hole should span the width of the entire black dot.
4. Cut each rim out precisely along the template border. Uneven cutting will greatly affect wheel performance. Remove the template. With a 2.5 × 2.5-cm (1 × 1-in.) piece of masking tape, cover the hole on the front and back of the rim. Re-poke the hole through both pieces of tape. This will reinforce the hole.
5. Place one of the rims on the table top. Set one of the wheels around the circle. Trim any overhang off the rim, if necessary, until it fits snuggly inside the wheel. Repeat this for all four wheels.
6. Using the liquid glue place a bead of glue around the circumference of the inside of the wheel, securing the rim. A finger can be used to push the glue around the entire rim. Let the glue dry at least 30 minutes; the glue will dry fully overnight.
Part Two is on the next page.
G
aini
ng T
ract
ion
on M
ars
28
Student Test Vehicle Assembly Instructions Procedure – Part Two
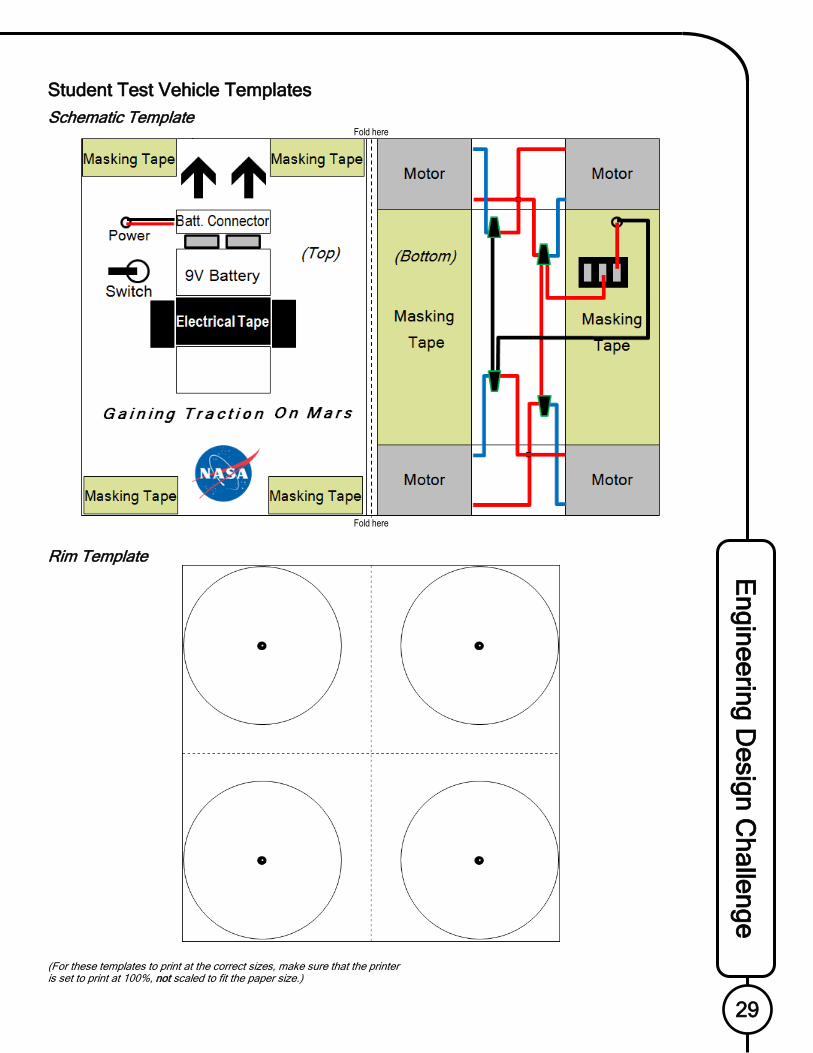
1. Cut out the vehicle Schematic Template and fold it tightly over the 7.5 × 10-cm piece of cardboard. Tape the template down on all three open sides.
2. With the skewer or toothpick, poke a hole through the circle marked “Power” on the top of the test vehicle. Using a pen, pencil or manual one-hole punch, make a hole on the larger circle marked “switch.”
3. Flip the vehicle over. Use a small ring of masking tape (adhesive side out) to affix one motor to each of the four corners of the vehicle. The wire connections should be facing up and pointing to the middle of the vehicle. The motors should be as straight as possible for best vehicle performance.
4. Using approximately 20 cm of masking tape, run one long strip of tape over both motors on the left side of the vehicle and flip the remaining tape on both ends over to the top of the vehicle. Repeat this on the right side.
5. Reopen any holes covered up by the masking tape. They should be visible through one layer of tape.
6. Feed the 9V battery connector wires through the hole marked “Power” on the top of the vehicle so that they come out the hole on the bottom of the vehicle.
7. On the switch, unscrew the nut and remove any washers. Feed the switch through the bottom of the vehicle so that the toggle is visible on the top of the vehicle. Screw the nut and washer back onto the switch to secure it on the vehicle.
8. Connect the bare wires, as indicated with black and green cone-shaped symbols on the diagram, by twisting them together and wrapping the ends tightly with electrical tape. Some connections will require one or more extra pieces of wire with stripped ends on both sides. When taping the ends, include some of the wire insulation to secure all the connections. Use another piece of electrical tape to cover the connections on the back of the switch (see the position of the wires in the sketch).
9. Connect the 9V battery to the battery connector, and secure it to the top of the vehicle using electrical tape.
10. On each of the four motors, roll a 2.5 cm (1 in.) piece of masking tape around the spinning shaft. This will create a gripping surface for the wheels. Cut off the excess tape beyond the metal shaft on a diagonal so that you can easily push the wheels onto the motors.
11. Affix the base wheels onto the motors, making sure not to push them so far that they rub against the vehicle as they spin.
12. Flip the switch to test the circuit. All motors should be spinning in such a way that the wheels are all rolling forward. If one or more motors are spinning backwards or not spinning at all, make sure that the wire connections match the schematic and are tight. If the vehicle works, secure the wires flat to the bottom of the vehicle with masking tape. You are ready to begin designing.
Illustration of the underside of the challenge's test vehicle
E
ngineering Design C
hallenge
29
Student Test Vehicle Templates
Schematic Template Fold here
Fold here
Rim Template
(For these templates to print at the correct sizes, make sure that the printer is set to print at 100%, not scaled to fit the paper size.)

G
aini
ng T
ract
ion
on M
ars
30

E
ngineering Design C
hallenge
31
Student Data Sheet Team name: _________________________________ Date: __________ Brief description of wheel design:
Weight of vehicle with this design: __________________________________ Degree of Incline of SLOPE test bed for these tests: ____________________
Trial Run complete? (Yes/No)
Time to complete
Description of any wheel damage
Other observations
1
2
3
4
5
AVERAGE TIME:

G
aini
ng T
ract
ion
on M
ars
32
Student Data Sheet What will you do to try to improve your design based on this data?
Sketch your new design in the space below. Point out any improvements to be made. How do you predict that this new design’s performance will improve over the one you tested?

E
ngineering Design C
hallenge
33
Student Documentation of Results Because the documentation of the scientific and engineering progress is a key element
of research, students are evaluated on a written component along with the performance of their wheel design. Each team is required to create a poster board that describes the steps of the Engineering Design Process for that team’s design. Poster Board
The poster is used to share the team’s process in creating, constructing, and testing their engineering design. The poster should be clean and organized, and it should include the following information:
• An appropriate title • The team’s name • A “literature review” section, documenting
what is currently known about the Martian environment and how that environment influences vehicle wheel design
• A section highlighting the work the team did to complete each step of the Engineering Design Process
• Visual aids including photos or illustrations showing the development of the design, charts and/or tables presenting test data from all iterations of the design process
• A concluding “lessons learned” section, explaining what concepts and trends led to their final design, and what the team would share with other teams conducting similar research
This poster and its supporting visual aids are shared in the team response video that is
submitted to NASA. Video Submission
The video submission should be a 5- to 7-minute concise explanation of the team’s design process. Although it is important to present the final design that the team created, the key is to describe the data and information that guided the team through the process from the initial design to the final design iteration. The video should maintain viewers’ interest and should utilize meaningful visuals (photographs or illustrations, and charts and/or tables) to help present the following:
1. What was your team’s original design? 2. How did you improve your team’s design with each major design iteration? 3. What did your data tell you as you tested each major design iteration? 4. What was the final design that your team created, and how did it perform? 5. What general trends and lessons did you learn as your team conducted its research?
Example of a trifold poster board layout.

G
aini
ng T
ract
ion
on M
ars
34

E
ngineering Design C
hallenge
35
Assessment Rubric for Design Challenge Team name: School:
Poster board Developing (1) Approaching (3) Meeting (5) Score Literature review Review section is missing
or does not discuss the atmosphere of Mars or potential wheel materials suitable for the Martian environment.
Review section describes the Martian environment but does not clearly explain how the environment influences wheel design.
Review section thoroughly discusses both the atmosphere of Mars and potential wheel materials suitable for the Martian environment.
Engineering design process elements
Poster is missing one or more steps of the engineering design process.
Poster includes all steps of the engineering design process, but one or more steps are missing ties to the group’s design.
Poster highlights all steps of the engineering design process sequentially and clearly defines the specifics of the design.
Lessons learned Poster lacks any explanations of conclusions based on design iterations.
Poster includes minimal explanations of at least one conclusion based on design iterations.
Poster includes detailed explanations of final conclusions based on entire set of iterations.
Visual aids (charts, tables, photos and illustrations)
Visual aids are absent, are confusing, or detract from the group’s poster presentation.
Most visual aids contribute positively to the poster. Poster is unorganized.
All visual aids are appropriately placed, and contribute positively to the design explanation
Writing mechanics and aesthetics
Poster has many spelling and grammatical errors. It lacks structure or organization. Poster is disorganized, sloppy, or falling apart.
Poster has minimal spelling or grammatical errors. It is organized and is understandable. It is neatly handwritten with minimal smudges or erasure marks.
Poster has no spelling or grammatical errors. It is expertly organized and very easy to follow. Poster is cleanly typewritten and uniform.
Total Poster Board Score: Poster presentation/
video submission Developing (1) Approaching (3) Meeting (5) Score
Evidence of expertise
Students present their final design by reading entirely from notes or slides. If presenting live, students answered questions incorrectly or did not answer questions about the project.
Students present their final design but cannot justify design elements based on design iterations. They rely heavily on notes for content support. If presenting live, they answer questions with uncertainty.
Students present their final design, and justify their design based on all design iterations confidently. They present with little help from notes and, if presenting live, are able to confidently and accurately answer questions.
Visual aids (charts, tables, photos and illustrations)
Visual aids are absent, are confusing, or detract from the group’s poster presentation.
Most visual aids contribute positively to the presentation. One or more visuals seem to be placed haphazardly.
All visual aids are appropriately displayed, and contribute positively to the design explanation.
Presentation style Presenters were unclear, used filler words (“um,” “like,” “you know,” etc.) enough to be distracting, and did not make adequate eye contact.
Presenters were mostly loud and clear, used minimal filler words, or broke eye contact, but it did not detract from presentation.
Presenters spoke clearly and loud enough to be heard, avoided the use of filler words, and maintained eye contact.
Total Presentation Score:

G
aini
ng T
ract
ion
on M
ars
36
Assessment Rubric for Design Challenge Team name: School:
Design challenge solution Developing (1) Approaching (3) Meeting (5) Score
Vehicle meets dimensional requirements
Vehicle does not fit entirely within a 20-cm square box with all four wheels touching the floor of the box and also exceeds 200 g total weight.
Vehicle does not fit entirely within a 20-cm square box with all four wheels touching the floor of the box or exceeds 200 g total weight.
Vehicle fits entirely within a 20-cm square box with all four wheels touching the floor of the box and does not exceed 200 g total weight.
Functionality during and after testing
Final design does not test successfully at least three times.
Final design demonstrates it can be tested successfully three times but is no longer functional after three complete tests.
Final design demonstrates it can be tested successfully at least three times and is still functional after all tests are complete.
Design Challenge Solution Score:
Slope angle multiplier (degree of incline ÷ 100 × Design Challenge Solution Score):
Total Design Performance Score:
Design Innovation Developing (1) Approaching (3) Meeting (5) Score
Good use of resources
Design solution demonstrates some effective use of resources.
Design solution demonstrates considerably effective use of resources.
Design solution demonstrates exceptionally effective use of resources.
Originality Solution utilizes a basic design to accomplish challenge goals. Design, could use improvement in terms of visual aesthetics.
Solution utilizes an enhanced design to accomplish challenge goals. Design is aesthetically pleasing.
Solution utilizes a very novel design to accomplish challenge goals. Design is visually stunning and dramatic.
Structurally sound One or more pieces completely detaches from the design.
One or more pieces come loose from the design but do not fall off.
Design stays together throughout all trials.
Total Design Innovation Score:
Total from first page:
Total from second page:
OVERALL SCORE:

E
ngineering Design C
hallenge
37
Lead-Up Investigations Background and Supporting Content
The following four scientific investigations serve as supporting content that leads up to the design challenge problem. Background information is provided as a foundation of understanding so that facilitators can proficiently conduct the investigations. Newton’s Laws of Motion and Interaction with Friction
Sir Isaac Newton established the scientific laws that govern 99% or more of everyday experiences—from how an ice skater slides over ice, to how the planets orbit the Sun. Newton’s Laws of Motion are considered to be some of the most important laws of all physical science.
Newton’s Laws are closely related to the concepts of forces and motion. A force is a push or a pull on an object resulting from the object’s interaction with another object. If forces acting on an object are imbalanced, they can cause the object to move. Forces have both direction as well as magnitude. In diagrams, force can be represented by an arrow indicating its two qualities. The direction of the arrow shows the direction of the force. The length of the arrow is proportional to the magnitude of the force.
Newton’s First Law—An object at rest tends to stay at rest, and an object in motion tends to stay in motion with the same speed and in the same direction, unless the object is acted upon by an unbalanced external force.
Consider this in terms of automobile travel. Suppose that a cup of water filled to the rim is sitting in a stopped car. When the car’s wheels begin to turn, the road in contact with the wheels provides an unbalanced force on the wheels, and the car starts to move forward. The water in the cup, however, tends to remain at rest where it was before the car began to move. As a result, the water sloshes out of the cup toward the rear of the car.
Newton’s Second Law—The acceleration, a, of an object as produced by a net force, F, is directly proportional to the magnitude of the net force, and inversely proportional to the mass, m, of the object: F = ma.
In simple terms, if a person pushes with the same amount of force on two cars—a full-size car and a toy car—the toy car will accelerate much faster than the full-size car because the toy car has much less mass than the full-size car.
Newton’s Third Law—For every action, there is an equal and opposite reaction.
This law means that in every interaction between two objects, there is a pair of equal forces acting in opposite directions on both of the interacting objects. To continue the car analogy, if a car is sitting on a dirt road, and the driver of the car pushes down on the gas pedal quickly, the tires will start to spin. The car will start to move forward, but dirt from the road will also be kicked up and thrown backwards. The dirt will fly backwards more rapidly than the car moves forward because the mass of the dirt particles are far less than the mass of the car; however, the net forces between the car and the road will remain equal and opposite.
Figure 1: Sir Isaac Newton (1642–1727), scientist and mathematician (as painted by Godfrey Kneller in 1689).

G
aini
ng T
ract
ion
on M
ars
38
Friction Friction is a special type of force that resists the relative motion of solid surfaces, and
fluids sliding against each other. Friction always opposes the motion or attempted motion of one surface across another surface and is dependent on the texture of both surfaces as well as the amount of contact force pushing the two surfaces together. How Batteries Work
A battery produces electrical energy through an electrochemical reaction. A battery has two terminals. One marked negative (-) and one marked positive (+). In common AAA-, AA-, C- and D-cell batteries, the terminals are located on opposite ends. On a 9V battery, the terminals are next to each other.
Inside a metal or plastic case, the battery consists of a cathode, which connects to the positive terminal, and an anode, which connects to the negative terminal. The anode and cathode, which are generally known as electrodes, occupy most of the space inside a battery. This is the place where the chemical reactions occur. A separator creates a barrier between the cathode and the anode. It prevents the electrodes from touching each other while allowing electrical charge to flow freely between them. The electrolyte is the medium that allows the electric charge to flow between the cathode and the anode.
If a wire was connected between the two terminals, the electrons would flow as fast as possible from the negative end of the wire to the positive end, causing the battery to “drain.” If nothing impeded this flow, the electrons would move quickly through the wire, generating considerable heat. This is called a “short circuit.” If left uncontrolled, a short circuit can cause burns or start a fire.
Safety warning: Creating short circuits, even with relatively low-voltage and low-amperage circuits, can eventually create enough heat to burn skin or start fires. Instruct your students about the dangers of short circuits and how to avoid getting burned.
When a device called a “load” (like a light bulb, a motor, or an appliance) is attached using wires to complete the circuit between the two terminals, the battery produces electric current through a series of electromagnetic reactions between the anode, cathode, and electrolyte. The reaction in the anode frees electrons, and the reaction in the cathode bonds them. The net imbalance is the usable electricity that will operate the load. The battery will continue to produce electricity until one or both of the electrodes run out of the substances necessary for the reactions to occur.
!
A simple battery cell; the electrons use the wire as a path of least resistance from the surplus at the anode to the deficit at the cathode.

E
ngineering Design C
hallenge
39
Types of Magnets All objects containing atoms have mass, which creates a gravitational field surrounding
them that attracts other objects with mass. In a similar way, the atoms have an electrical charge that creates a magnetic field. Unlike gravity, however, magnetic force has both a positive and negative charge. This causes objects with unlike charges (one positive, one negative) to attract one another, and objects with like charges (both positive or both negative) to repel one another.
Permanent magnets exist when the majority of the atoms of the substance are organized in a way that their positive and negative sides are lined up in the same direction. This causes the substance to constantly have a north and a south magnetic pole. Although these magnets are called permanent magnets, they still can be demagnetized by scattering the orientation of the charged atoms, either with heat, jarring impact, or prolonged interaction with a stronger magnetic field oriented in a different direction.
Some materials are naturally too rigid to allow the atoms to align in a magnetic fashion. Because the atoms are not aligned, the charges of the individual atoms tend to cancel each other out, resulting in no net magnetic field. These materials are not magnetic.
Certain materials allow for the alignment of atoms when a magnet is nearby, but they do not maintain that organization when the magnet is no longer present. These materials are called temporary magnets. Paper clips, for example, will attract to a permanent magnet and will even attract other paper clips while temporarily magnetized. When the permanent magnet is removed, the paper clips are no longer magnetized and will quickly lose all residual magnetism. Electromagnets are also temporary in nature. While the current is flowing through the wire, a magnetic field exists around the wire. As soon as the current is disconnected, the wire demagnetizes. Magnetic Fields, Electromagnets, and the Right-Hand Rule
The size, strength, and orientation of a magnet’s north and south poles will determine the magnetic field surrounding the magnet. Magnetic fields have both direction and magnitude, which one can explore by using a compass needle around a bar magnet. Although the sketch shows the field on a flat surface, in reality, it extends in all directions 360° around the magnet. The field may deviate, however, from a uniform roundness depending on the other materials located with the field’s reach.
The Earth itself is one large magnet with a north and south pole. Therefore, a large magnetic field surrounds our planet. There is often confusion about why the north pole on a compass points to the North Pole on the earth, when two north poles should repel. While people typically refer to the geographically northernmost point on Earth as the “North Pole,” it is actually the southern magnetic pole. The geographically southernmost point on the planet is the northern magnetic pole.
A standard bar magnet with invisible magnetic field lines, shown in black; a compass needle will align with the direction of the field lines.
Earth's magnetic field

G
aini
ng T
ract
ion
on M
ars
40
Any time that an electric current is moving through a material, a magnetic field is produced around the material. Often, the current is moving in one direction through metal wire. In this case, the polar direction of the magnetic field can be determined using the “Right-Hand Rule.” The Right-Hand Rule states that if a wire is held in the right hand with thumb pointing in the direction of the current moving through the wire, the remaining fingers will wrap around the wire in the direction of the magnetic field. As charged particles move near the wire, the magnetic field around the wire interacts with the particles and bends their paths. The magnetic force pulls the particles inward toward the wire as a centripetal force, causing the particles to move in a curved path constantly perpendicular (90°) to the inward force of the magnet. This force cannot alter the speed of the particles, only the direction, and will continue to do so until the current stops or the particles leave the magnetic field.
Given the effect of the Right-Hand Rule, a wire with current running through it can be coiled into a spiral. The result is a series of rings each with a magnetic field surrounding them in the same right-hand direction. A current running through the wire will generate a field with a distinct north and south pole, as if a bar magnet were sitting in the center of the coil. This is called a solenoid. With a solenoid, increasing the number of loops will increase the magnetic field through the center of the coil and can create strong electromagnets from ferromagnetic (easily magnetized) materials like iron or nickel. Outside the coil, however, the magnetic field is still relatively weak.
Solenoids also can be used in the opposite direction. Rather than pushing current through the wire
coil to generate a magnetic field, a magnet can be pushed through the coil, using its magnetic field to move the electrons in the wire to generate electric current. This is known as electromagnetic induction. The same concept can be applied to electric motors, which generate electric current, by mechanically turning a shaft by some means of power like wind or steam.
Concepts of the Right-Hand Rule. The diagram on the left shows how the rule gets its name; with the right thumb pointed in the direction of current running through a wire (shown by the yellow arrows) the magnetic field forms around the wire in the direction of the remaining fingers curled around the wire. In the center, compasses point out the direction of the field. On the right, a charged particle is pulled around the field by an inward force toward the wire.
Cutaway diagram of a solenoid with current running through the wire as shown by the yellow (roughly vertical) arrows. The Right-Hand Rule still applies (shown by curved black arrows), but the field is magnified by the multiple coils of wire.

E
ngineering Design C
hallenge
41
How Electric Motors Work Motors are used to convert electrical energy into mechanical energy to do work. In
normal operation, a motor converts electrical energy into magnetic energy, which spins a rotor inside the motor.
The conversion of magnetic energy to mechanical energy can happen in one of two ways. In one configuration, the rotor holds one or more solenoids to create temporary magnetic fields. These solenoids interact with permanent magnets surrounding the rotor, called stators. In the other configuration, the rotor holds the permanent magnets, and the stator is made of solenoids to create temporary magnetic fields.
In either design, the current moving through the solenoids is intermittent, so the rotor spins freely when the current is disconnected and it is pushed by magnetic field interactions between the rotor and stator when the current is moving. The current is switched on and off using brushes. The brushes provide a small gap to first disconnect the current, then to connect the solenoids in the opposite polarity to keep the rotor spinning in one direction. In both designs, the rotor is attached to a shaft outside the motor to create usable mechanical power.
When the current is active, the solenoids generate heat due to the resistance of the electrons moving through the wires. As a result, a motor naturally heats up during use. This heat is expected and is usually accounted for in the motor’s design, but over time, it will cause wear and tear on the motor. The wire’s insulation and the contacts made with the brushes will break down over the life of the motor, which will decrease the motor’s efficiency. A well-designed motor minimizes natural wear and tear, thereby extending the life of the motor.
Cutaway diagram of an electric motor. The yellow and green solenoids magnetize the ends of the rotor as they are forced through the stators' magnetic fields. The current alternates direction through these solenoids, switching the polarity of the solenoids’ fields as they pass each stator magnet.

G
aini
ng T
ract
ion
on M
ars
42
Student Performance Rubric for Lead-Up Investigations
Title of activity:
Student’s name: Date:
Teacher’s name:
Category 1 Point 2 Points 3 Points Score Awarded
Understanding of skills and concepts
Student was unable to demonstrate even a basic understanding of the skills and concepts related to performance expectation(s).
Student demonstrated at least 70% of a basic understanding of the skills and concepts related to performance expectation(s).
Student demonstrated a thorough understanding of the skills and concepts related to performance expectation(s).
Activity
Student was unable to complete activity without outside assistance.
Student completed at least 70% of the activity.
Student successfully completed the activity.
Class discussion
Student participated minimally (less than 50%) in class discussion.
Student was engaged in class discussion at least 50% of the time.
Student was highly engaged in class discussion throughout the activity.
Cooperative Learning Group
Student was unfocused and did not participate in cooperative learning group.
Student was engaged, focused, and worked with group at least 50% of the time.
Student was highly engaged and focused; worked well with group.
Directions
Student was unable to follow directions without outside assistance.
Student followed directions at least 50% of the time in cooperative learning and whole group settings.
Student followed directions well in both cooperative learning and whole group settings.
Total Score (out of 15)

E
ngineering Design C
hallenge
43
Investigation One—“Racing Against Friction”
Facilitator Information
Next Generation Science Standards Addressed MS-PS2-3: Plan an investigation to provide evidence that the change in an object’s
motion depends on the sum of the forces on the object and the mass of the object.
Performance Expectations Students will demonstrate understanding of the terms: force, gravity, friction, and speed.
Students will experiment with the effects of friction on speed and motion and gain an understanding that friction and other forces have an effect on speed and motion.
Materials Each group of students will require the following to complete one set of tests: • Books, blocks, or other stacking materials • One piece of 60 × 30-cm- (2 × 1-ft-) thick cardboard (see facilitator note) • One piece of 60-cm (2-ft) rolled wax paper • One piece of 60-cm (2-ft) rolled bubble wrap • Two sheets of 23 × 28-cm (9 × 11-in.) coarse (50 to 100 grit) sand paper • Two sheets of 23 × 30-cm (9 × 12-in.) craft felt • One roll of masking tape • One small toy car with moving wheels • One stopwatch • One meter stick or tape measure • One pair of scissors
Notes • This lesson will introduce students to the concept of friction being a slowing force. It
will show the ways that multiple forces, in this case gravity and friction, can interact, and what happens when one of those forces is stronger than another.
• The lid of a standard box of copier paper turned upside-down will serve very well as the ramp. Otherwise, you can use the extra length on the piece of thick cardboard (about 15 cm or 6 in.) to fold up as a barricade at the bottom of the ramp. This will keep the toy cars from flying off the ramps and onto the floor.
• If resources are tight, the surface materials can be rotated around the groups (for example, one group is testing felt while another is testing wax paper; then trade)
• If students have not yet been introduced to Newton’s Laws of Motion, they are a great way to open this investigation because they will be applied throughout.
• Unless every toy car and ramp angle are exactly the same, student groups will likely get different time results for each material; however, the order of materials based on which allowed the car run the fastest, should be similar across all groups. This is dependent on the same ramp height and length being used for all tests for one group.
• Students will want to informally experiment and play with the toy cars and ramps. Rather than trying to impede this exploration, allow a specific designated time (approximately 5 minutes) to “explore at-will” when the materials are distributed. This may help students stay on task during the remainder of the investigation.
• As possible extensions to this activity, students can change the height or length of the ramp or change the size of the test car to investigate how those changes affect times down the ramp.

G
aini
ng T
ract
ion
on M
ars
44
Procedure 1. Assemble the stacking materials to approximately 4 cm high. 2. Place one short end of the cardboard on top of the stacked materials to form a ramp. 3. Tape the cardboard in place onto the stacked materials. 4. As a control group, hold the toy car at the top of the ramp. Release the car, and use
the stopwatch to measure the time it takes to get to the bottom of the ramp. Repeat this 3 times, recording all three times on the data sheet. Then calculate an average time.
5. Predict which surface test material (cardboard, waxed paper, bubble wrap, sandpaper, or felt) will allow the car to move down the ramp the fastest. Write your prediction on the Student Data Sheet, and explain your prediction.
6. Use the scissors to trim each surface material to fit the ramp from top to bottom. 7. Place the first surface material to test on the ramp. Tape the material in place, as flat
as possible, using a strip of masking tape from the top to the bottom of the ramp on both sides of the material.
8. Place the toy car at the top edge of the ramp on the surface material, and let the car roll down the ramp to the table. Use the stopwatch to measure how long it takes the car to travel from the top of the ramp to the bottom. Then record the time on the Student Data Sheet.
9. Repeat the test three times, and record all three times on the Student Data Sheet. 10. Remove the test material, and repeat steps 7 through 9 with each of the remaining
test materials. Record all results on the Student Data Sheet.
Answers to Reflection Questions 1. On which material was the vehicle the fastest? Was your prediction correct? If not,
why do you think it was incorrect?
Students will probably predict that either the cardboard ramp or the wax paper will allow the vehicle to run the fastest. The wax paper tests should be the fastest, with the cardboard a close second. Either material may end up with the fastest results based on possible margin of error during testing.
2. How did the other materials perform? What was the order of all the materials from fastest to slowest?
Results may vary based on testing. As long as the test data backs the results, the answers should be considered to be correct. In ideal testing situations, the order should be (from fastest to slowest) wax paper, cardboard, sandpaper, felt, bubble wrap (which should not roll down at all).
3. Did any of the materials perform differently than you expected? If so, which material and what was unexpected?
Answers will vary based on original expectations. It is likely that students will think that the bubble wrap will cause the vehicle to go very slowly, but in fact, the vehicle should not roll at all on such a bumpy surface. The friction of the bubble wrap overcomes the force of gravity and prevents the vehicle from rolling.

E
ngineering Design C
hallenge
45
Student Investigation Sheet
Investigation One—“Racing Against Friction”
Concept According to Newton’s
First Law of Motion, any object sitting at rest that starts to move, does so because one or more unbalanced forces begin to act on it. The force of gravity pulling objects
down to Earth is relatively constant everywhere on the Earth’s surface. The force of friction, however, depends on which materials are in contact. Frictional force resists the pulling apart of objects that are in contact with each other.
In this investigation you will test several materials to determine how friction affects them. Some materials may make the vehicle run faster than the bare cardboard ramp, and some materials may make the vehicle run slower. Some materials may cause so much friction that they overcome the force of gravity and prevent the vehicle from running down the ramp at all.
Materials • Books, blocks, or other
stacking materials • Cardboard ramp • One piece of 60-cm (2-ft)
rolled wax paper • One piece of 60-cm (2-ft)
rolled bubble wrap • Two sheets of 23 × 28-cm
(9 × 11-in.) coarse (50 to 100 grit) sand paper
• Two sheets of 23 × 30-cm (9 × 12-in.) craft felt
• One roll of masking tape • One small toy car with
moving wheels • One stopwatch • One meter stick or tape
measure • One pair of scissors
Procedure 1. Assemble the stacking materials to approximately 4 cm high. 2. Place one short end of the cardboard on top of the stacked materials to form a ramp. 3. Tape the cardboard in place onto the stacked materials. 4. As a control group, hold the toy car at the top of the ramp. Release the car, and use
the stopwatch to measure the time it takes to get to the bottom of the ramp. Repeat this three times, recording all three times on the data sheet, and calculate an average time.
5. Predict which surface material (cardboard, waxed paper, bubble wrap, sandpaper, or felt) will allow the car to move down the ramp the fastest. Write your prediction on the Student Data Sheet, and explain your prediction.
6. Use the scissors to trim each surface material to fit the ramp from top to bottom. 7. Place the first surface material to test on the ramp. Tape the material in place, as flat
as possible, using a strip of masking tape from the top to the bottom of the ramp on both sides of the material.
8. Place the toy car at the top edge of the ramp on the surface material, and let the car roll down the ramp to the table. Use the stopwatch to measure how long it takes the car to travel the length of the ramp (see the illustration above). Then record the time on the Student Data Sheet.
9. Repeat the test three times, and record all three times on the Student Data Sheet. 10. Remove the test material, and repeat steps 7 through 9 with each of the remaining
test materials. Record all results on the Student Data Sheet.

G
aini
ng T
ract
ion
on M
ars
46
Student Data Sheet 1. What is the length of the ramp for the tests in meters? ________________________
2. What material do you think will allow the car to run the fastest? Why do you think it will allow the car to run the fastest?
3. Record the time trials of your vehicle on each surface material. Use the average times to calculate an average speed of your vehicle.
Test material Trial 1 Time, sec.
Trial 2 Time, sec.
Trial 3 Time, sec.
Average Time, sec.
Average speed (ramp length ÷ avg. time),
m/sec
Bare cardboard ramp
Wax paper
Sandpaper
Felt
Bubble wrap
Reflection Questions 4. Which material was the fastest for the vehicle? Was your prediction correct? If not, why
do you think it was incorrect?
5. How did the other materials perform? What was the order of all the materials from fastest to slowest?
6. Did any of the materials perform differently than you expected? If so, which material was it and what was unexpected?
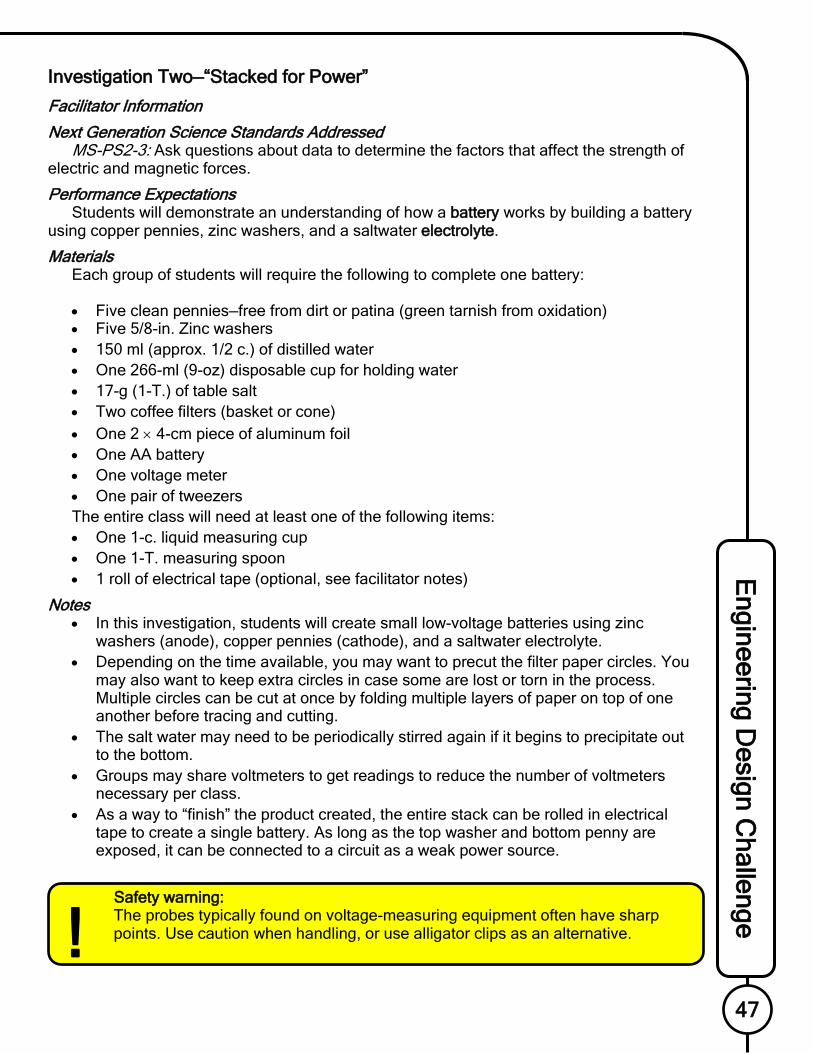
E
ngineering Design C
hallenge
47
Investigation Two—“Stacked for Power”
Facilitator Information
Next Generation Science Standards Addressed MS-PS2-3: Ask questions about data to determine the factors that affect the strength of
electric and magnetic forces.
Performance Expectations Students will demonstrate an understanding of how a battery works by building a battery
using copper pennies, zinc washers, and a saltwater electrolyte.
Materials Each group of students will require the following to complete one battery: • Five clean pennies—free from dirt or patina (green tarnish from oxidation) • Five 5/8-in. Zinc washers • 150 ml (approx. 1/2 c.) of distilled water • One 266-ml (9-oz) disposable cup for holding water • 17-g (1-T.) of table salt • Two coffee filters (basket or cone) • One 2 × 4-cm piece of aluminum foil • One AA battery • One voltage meter • One pair of tweezers The entire class will need at least one of the following items: • One 1-c. liquid measuring cup • One 1-T. measuring spoon • 1 roll of electrical tape (optional, see facilitator notes)
Notes • In this investigation, students will create small low-voltage batteries using zinc
washers (anode), copper pennies (cathode), and a saltwater electrolyte. • Depending on the time available, you may want to precut the filter paper circles. You
may also want to keep extra circles in case some are lost or torn in the process. Multiple circles can be cut at once by folding multiple layers of paper on top of one another before tracing and cutting.
• The salt water may need to be periodically stirred again if it begins to precipitate out to the bottom.
• Groups may share voltmeters to get readings to reduce the number of voltmeters necessary per class.
• As a way to “finish” the product created, the entire stack can be rolled in electrical tape to create a single battery. As long as the top washer and bottom penny are exposed, it can be connected to a circuit as a weak power source.
Safety warning: The probes typically found on voltage-measuring equipment often have sharp points. Use caution when handling, or use alligator clips as an alternative.
!

G
aini
ng T
ract
ion
on M
ars
48
Procedure 1. Using the voltmeter, measure the output of the AA battery for reference and
comparison. Record your answer on the Student Data Sheet. 2. Add the tablespoon of salt to the 150 ml of water and stir until dissolved. 3. Trace and cut five penny-sized circles from the coffee filters. Cut inside the traced
lines so that the circles are no larger than the pennies. 4. Place the remaining pieces of the coffee filters on the table as a drying surface. 5. Lay the aluminum foil beside the coffee filters. 6. Lay one penny on top of the aluminum foil. This will serve as the cathode. 7. Using the tweezers, submerge one of the paper circles in the saltwater for
30 seconds. After submersion, dab both sides of the paper circle on the coffee filter to remove excess water. Place the paper circle on top of the penny.
8. On the paper circle, place one zinc washer. This will serve as the anode. 9. Measure the voltage output of your penny-zinc battery with the voltmeter by placing
the red probe against the foil (near the penny but not touching the penny/washer stack. and placing the black probe on top of the zinc washer. Record the reading on the Student Data Sheet.
10. Repeat steps 6 to 9, placing another set of penny, filter, and washer on top of the already-existing stack. Record the reading on the Student Data Sheet after each stack. Do this for up to five stacks.
Answers to Reflection Questions 1. What did you notice happening to the voltage reading as you increased the number
of penny-filter-washer sets in the stack?
Students should notice a steady increase of voltage from less than 1 V up to, perhaps even beyond, 3 V, depending on the precision of construction.
2. Were there any deviations from the pattern you observed in question 1? Why do you think this might have happened?
Students may notice a sudden decrease of voltage if they do not properly stack one of the sets or if a filter paper is dripping down the remainder of the stack, creating a short circuit in the battery.
3. What do you think might account for any differences between the voltage readings of your battery and those of batteries created by other groups?
Students may notice differences among the batteries because of variations in the precision of the construction or because of the presence of any dirt, oil, or oxidation on either the pennies or the washers.
4. Voltage is one measurement of electricity. It measures the electrical potential. Amperage is a measure of the amount of electricity moving through the circuit. How do you think we might be able to increase the possible amperage?
Rather than assembling the battery cells in series (end-to-end) like the procedure instructs, to increase the amount of amperage, several of the batteries would need to be assembled in parallel (side-by-side).

E
ngineering Design C
hallenge
49
Student Investigation Sheet
Investigation Two—“Stacked for Power”
Concept For electricity to be
created, an inequality of electrons is needed to draw electrons along a wire from an area of surplus to an area of deficit. While electrons are moving along a wire, we can harness the energy of the
electrons to do work. In this investigation you will create a battery. A
battery consists of three primary components: an anode, a cathode, and an electrolyte. The anode interacts with the electrolyte and releases a surplus of free electrons ready to leave the terminal (called oxidation). The cathode interacts with the electrolyte and bonds with the free electrons (called reduction). This creates a deficit of free electrons near the terminal, which causes electrons to move through the wire to fill the void, and creates current.
Materials • Five clean pennies • Five 5/8-in. Zinc washers • 150 ml (approx. 1/2 c.) of
distilled water • One 266-ml (9-oz)
disposable cup for holding water
• 17-g (1-T. of table salt • Two coffee filters • One 2 × 4-cm piece of
aluminum foil • One AA battery • One voltage meter • One pair of tweezers
Procedure 1. Using the voltmeter, measure the output of the AA battery for reference and
comparison. Record your answer on the Student Data Sheet. 2. Add the tablespoon of salt to the 150 ml of water and stir until dissolved. 3. Trace and cut five penny-sized circles from the coffee filters. Cut inside the traced
lines so that the circles are no larger than the pennies. 4. Place the remaining coffee filters on the table as a drying surface. 5. Lay the aluminum foil beside the coffee filters. 6. Lay one penny on top of the aluminum foil. This penny will serve as the cathode. 7. Using the tweezers, submerge one of the paper circles in the saltwater for
30 seconds. After submersion, dab both sides of the paper circle on the coffee filter to remove excess water. Place the paper circle on top of the penny.
8. On the paper circle, place one zinc washer. This washer will serve as the anode. 9. Measure the voltage output of your penny-zinc battery with the voltmeter by placing
the red probe against the foil (near the penny but not touching the penny-paper-washer stack) and placing the black probe on top of the zinc washer (see the illustration above). Record the reading on the Student Data Sheet.
10. Repeat steps 6 to 9, placing another set of penny, filter, and washer on top of the already-existing stack. Record the reading on the Student Data Sheet after each stack. Do this for up to five stacks.

G
aini
ng T
ract
ion
on M
ars
50
Student Data Sheet 1. What was the voltage measured from the AA battery? ________________________ 2. What voltage does the AA battery have printed on it? _________________________ 3. Record the voltage from your battery as you assemble it:
Number of sets (penny-paper-washer) in the stack Voltage reading
1
2
3
4
5
Reflection Questions 4. What did you notice happening to the voltage reading as you increased the number of
penny-filter-washer sets in the stack?
5. Were there any deviations from the pattern you observed in question 1? Why do you
think this might have happened?
6. What do you think might account for any differences between the voltage readings for
your battery and those for batteries created by other groups?
7. Voltage is one measurement of electricity. It measures electrical potential. Amperage is
a measure of the amount of electricity moving through a circuit. How do you think we might be able to increase the possible amperage?

E
ngineering Design C
hallenge
51
Investigation Three—“Charged Attraction”
Facilitator Information
Next Generation Science Standards Addressed MS-P2-3: Ask questions about data to determine the factors that affect the strength of
electric and magnetic forces. MS-P2-5: Conduct an investigation and evaluate the experimental design to provide
evidence that fields exist between objects exerting forces on each other even though the objects are not in contact.
Performance Expectations Students will demonstrate how electromagnetic forces work in two ways: (1) by using
magnets to show that there are forces between objects that are not necessarily in contact with each other and (2) by creating an electronic circuit showing forces in contact with each other.
Materials Each group of students will require the following to complete the investigation: • Two ceramic iron ferrite disc magnets, 1 × 5/32 in. recommended • 120-cm (approx. 4-ft) 26-gauge, enamel-coated “magnet” wire • One 7.5 cm (3 in.) galvanized nail • Ten 3-cm (1.25-in.) #1 paper clips • One piece of 2.5 × 5-cm (1 × 2-in.) coarse-grit sandpaper • One AA battery • One pair of scissors • One ruler • One roll of electrical tape • One heat-protective glove
Notes • In this investigation, the students will use a battery, a coil of wire called a solenoid
and a nail to create an electromagnet. • Students will want to informally experiment and play with the magnets. Rather than
trying to impede this exploration, allow a specific designated time (approximately 5 minutes) to “explore at-will” after the materials have been distributed. This may help students stay on task during the remainder of the investigation.
Safety warnings: • Nails and wire can have sharp edges. Use caution when handling. • Intentionally, this electromagnet is a short circuit. It will quickly heat up and,
with prolonged connection to the battery, could cause burns or start fires. Do not operate the electromagnet for longer than 10 seconds before disconnecting, and avoid touching the wire during or just after use.
• To prevent damage to magnetically sensitive equipment, keep all magnets away from all electronic devices and magnetic data storage, including computers and cell phones.
!

G
aini
ng T
ract
ion
on M
ars
52
Procedure 1. Hold one disc magnet in each hand. Investigate what happens when the magnets
are moved closer together or farther apart. Turn one magnet to face the opposite direction. Again investigate what happens when the magnets are moved closer together or farther apart. Record observations on the Student Data Sheet.
2. Starting approximately 5 cm from one end of the wire, coil the wire around the nail tightly without overlapping coils. Periodically push the coils tightly together and pull the remaining wire to remove slack. Continue until only 5 cm of wire remain at the other end of the wire. Then wrap a small piece of electrical tape onto the nail at the bottom of the coil to prevent uncoiling.
3. Use the piece of sandpaper on each loose end of wire to remove the colored enamel and completely expose approximately 2 cm of the copper wire.
4. Use a small piece of electrical tape to affix one exposed end of the wire to the positive terminal of the battery.
5. Use a second piece of tape to quickly affix the other end of the exposed wire to the negative terminal of the battery. After both ends of the wire are connected, the electromagnet should only be handled by the battery or the nail. The wire will warm up and could get hot. Slide the nail over the paper clips. What did you observe?
6. Pull the piece of tape off one end of the battery, disconnecting the wire. What did you observe?
7. Record your observations on the Student Data Sheet 8. Allow the magnet to fully cool down before trying to use it again.
Answers to Reflection Questions 1. Why do you think the magnets behaved differently in your hands before and after
you turned one magnet around?
The disc magnets are polarized, meaning one face of the magnet is the north pole and one face of the magnet is the south pole. When two like poles are brought toward each other, they repel or push away from each other. When two unlike poles are brought toward each other, they attract or pull together. The forces of attraction and repulsion both increase as the distance between the two magnets decreases.
2. Was everyone’s electromagnet able to hold the same amount of paper clips? If not, what differences do you think would account for this variation?
Differences among electromagnets could include the total number of solenoid coils, the tightness of the solenoid coils, and the amount of charge still left in the battery.
3. Where did the paper clips cling to the electromagnet? Why do you think they were attracted there?
Depending on the way that the magnet is assembled and the amount of charge that the battery has, the paper clips may cling to any part of the electromagnet. Although it is likely that they may accumulate toward the exposed ends of the nail more than on the wire coil. This is because the coiled wire will produce a magnetic field with a strong polar force at the two ends of the coil.

E
ngineering Design C
hallenge
53
Student Investigation Sheet
Investigation Three—“Charged Attraction”
Concept An electromagnet is
a type of temporary magnet that is produced by electric current. The magnetic field around the magnet only exists when the current is flowing, and it disappears when the current stops.
In this investigation you will create an electromagnet. The electromagnet consists of a power source and a solenoid (a coil of wire). If the wire is coiled around a magnetic item, like a nail, the item itself also will become magnetized.
Electromagnets are frequently used for industrial purposes, including lifting heavy loads of magnetic metals and in electromotors.
Materials • Two ceramic iron ferrite disc
magnets, 1 × 5/32 in. recommended
• 120-cm (approx. 4-ft) 26-gauge, enamel-coated “magnet” wire
• One 7.5-cm (3-in.) galvanized nail
• Ten small paper clips • One piece of 2.5 × 5-cm
(1 × 2-in.) coarse-grit sandpaper
• One AA battery • One pair of scissors • One 30-cm (12-in.) ruler • One roll of electrical tape • One heat-protective glove
Procedure 1. Hold one disc magnet in each hand. Investigate what happens when the magnets
are moved closer together or farther apart. Turn one magnet to face the opposite direction. Again investigate what happens when the magnets are moved closer together or farther apart. Record observations on the Student Data Sheet.
2. Starting approximately 5 cm from one end of the wire, coil the wire around the nail tightly without overlapping coils. Periodically push the coils tightly together and pull the remaining wire to remove slack. Continue until only 5 cm of wire remain at the other end of the wire. Then wrap a small piece of electrical tape onto the nail at the bottom of the coil to prevent uncoiling (see the illustration above).
3. Use the piece of sandpaper on each loose end of wire to remove the colored enamel and completely expose approximately 2 cm of the copper wire.
4. Use a small piece of electrical tape to affix one exposed end of the wire to the positive terminal of the battery.
5. Use a second piece of tape to quickly affix the other end of the exposed wire to the negative terminal of the battery. After both ends of the wire are connected, the electromagnet should only be handled by the battery or the nail. The wire will warm up and could get hot. Use the heat-protective glove for safety. Slide the nail over the paper clips. What did you observe?
6. Pull the piece of tape off one end of the battery, disconnecting the wire. What did you observe?
7. Record your observations on the Student Data Sheet 8. Allow the magnet to fully cool down before trying to use it again.

G
aini
ng T
ract
ion
on M
ars
54

E
ngineering Design C
hallenge
55
Student Data Sheet Describe the observations that you made during the steps of this investigation. 1. Hold one disc magnet in each hand. Investigate what happens when the magnets are
moved closer together or farther apart.
2. Turn one magnet to face the opposite direction. Again investigate what happens when
the magnets are moved closer together or farther apart.
3. After both ends are connected, slide the nail over the paper clips.
4. Disconnect one end of the wire from the battery.

G
aini
ng T
ract
ion
on M
ars
56
Reflection Questions 1. Why do you think the magnets behaved differently in your hands before and after you
turned one magnet around?
2. Was everyone’s electromagnet able to hold the same amount of paper clips? If not, what
differences do you think would account for this variation?
3. Where did the paper clips cling to the electromagnet? Why do you think that they were
attracted there?

E
ngineering Design C
hallenge
57
Investigation Four—“Fine Motor Skills”
Facilitator Information
Next Generation Science Standards Addressed MS-PS2-3: Ask questions about data to determine the factors that affect the strength of
electric and magnetic forces. MS-PS-5: Conduct an investigation and evaluate the experimental design to provide
evidence that fields exist between objects exerting forces on each other even though the objects are not in contact.
Performance Expectations Students will create a model motor to demonstrate their understanding of the strength of
forces, how magnetic forces exist, and how magnetic forces influence electrical forces.
Materials Each group of students will require the following to complete the investigation:
• One 10 × 10-cm piece of corrugated cardboard • Two 3-cm (1.25-in.) #1 paper clips • One AA battery • Two ceramic iron ferrite disc magnets—1 × 5/32 in. recommended • 125-cm (4-ft) of 26-gauge, enamel-coated “magnet” wire • Two 10-cm pieces of 22-gauge solid copper insulated wire—one red/white wire and
one black/blue wire recommended • One piece of 2.5 × 5-cm (1 × 2-in.) coarse-grit sandpaper • One 30-cm (12-in.) ruler • One pair of scissors • One roll of electrical tape • One stopwatch
The entire class will need at least one of the following items:
• One pair of wire strippers • One sample motor to be disassembled or motor diagram (optional, see facilitator
notes)
Notes • Several elements of this investigation can be prepared in advance to save time
during the investigation itself, including: ○ Precut the cardboard into 10 × 10-cm pieces. ○ Precut 125-cm (4-ft) sections of enamel-coated magnet wire. ○ Strip 1/4 in. of insulation from both ends of the pieces of 20-gauge insulated wire.
• The coil must be level across the paper clips or it may slide off-center. • Students may need to move their magnets slightly off-center of the traced circle on
the cardboard to get the motor spinning. • The key to getting this motor to work is to precisely sand the enamel off the tips of the
wire. Follow these directions carefully. When the motor is sitting with the bare ends facing up, the electricity is traveling through the paper clips, but not the wire ring. The ring is not charged and therefore not magnetic, so it is free to spin. When the bare ends are facing down, they come in contact with the paper clips and complete the

G
aini
ng T
ract
ion
on M
ars
58
circuit. The wire ring instantly magnetizes, and interacts with the permanent magnets. This “on-again, off-again” cycle happens repeatedly as the ring spins.
• Facilitators may wish to get one or two extra motors to disassemble to allow students to see the inside of them. A diagram can be used to reduce cost.
Procedure 1. Stack two magnets on top of each other in the middle of the cardboard. Trace a
circle around the magnets. Remove the magnets from the cardboard and set aside. 2. Bend open each paper clip 90° at the U-shaped bend about halfway along the clip,
forming a piece of metal with a long “U” flat on the table and a short upside-down “U” standing upright.
3. Bend closed the upright short legs of both paper clips so that each forms a small closed loop at the top of the upside-down “U.”
4. Place each paper clip on top of the cardboard so that the flat legs sit against the middle of the left and right edges of the cardboard and the upright loops stand near the opposite edges of the traced circle. Secure the paper clips to the cardboard with 2 pieces of tape near the outside edges of the cardboard.
5. Take one piece of insulated wire and slide one of the exposed ends underneath one of the paper clips. Bend the end of the wire to ensure that it is touching the paper clip. Use a piece of tape to secure the wire against the clip. Repeat this step with the other piece of wire by placing it under the other paper clip in the same manner. Both wires should extend off the cardboard on the side closest to you.
6. Put the magnets back into the traced circle. 7. Leaving 12 cm of the wire free on both ends, wrap the enamel-coated magnet wire
around the battery (20 to 30 times). Wrap tightly, allowing the coils to overlap. 8. Slide the wire off the battery. On opposite sides of the coil, use the loose ends to
wrap around the inside and outside of the coil three times, creating a tight ring. There should still be at least 3 to 4 cm of wire remaining, sticking straight out in opposite directions.
9. Use the sandpaper to remove the enamel coating on the top half of each end of the wire, from the tip to the ring.
10. Insert the wire circle into the paperclip loops so that the ring sits directly above the magnets. The ring needs to be as perfectly centered as possible. If it favors tilting to one side, that side will be heavier and the ends will need to be bent to better center the ring. The closer to center, the better the motor will operate.
11. Tape the two insulated wires to the ends of the AA battery. The wire ring should begin to spin because of the forces interacting. If it does not, give it a little push with your finger to help get it started. Some small adjustments (balancing the ring, moving the magnets, adjusting the paper clip loops, etc.) will probably be necessary to get the motor running.
12. Once the motor is running steadily, have one person in the group count the revolutions of the motor while a second person times for 10 seconds (do the best you can, some motors may be moving quite quickly). Multiply your number of revolutions in 10 seconds × 6 to get the number of revolutions in 60 seconds. This is called revolutions per minute, or rpm. Repeat this three times, and use the data to get an approximate average rpm of your motor. Then record your data on the Student Data Sheet.

E
ngineering Design C
hallenge
59
Answers to Reflection Questions 1. After you completed the motor assembly, did you have to make any adjustments to it
to get it to run or run better? If so, what adjustments did you make?
Many students will have to bend their wire rings to get them to sit more centered in the motor. They may find that moving the magnets closer to or farther from the center will help them interact well with the ring.
2. What gave you the most challenge while building the motor? How did you overcome that challenge?
Answers to this question will vary, but they often will include elements of making the motor balanced and level. Allow students to share with the class how they solved these problems.
3. What are some ideas of work that you could do with this motor if it were strong enough?
Answers to this question could be anything, but they could include moving the wheels on a vehicle, turning propellers on aircraft, powering fans, or anything else that requires rotational force.
4. Remove the battery and reconnect it facing the opposite direction. Get the motor spinning again. What did you notice about your motor’s operation in comparison to your original observations?
Students should notice that the motor will only spin in the opposite direction to the way it spun previously. This is due to the “Right-Hand Rule” governing the magnetic field of the wire ring and its interaction with the permanent magnets.

G
aini
ng T
ract
ion
on M
ars
60

E
ngineering Design C
hallenge
61
Student Investigation Sheet
Investigation Four—“Fine Motor Skills”
Concept It is possible to
convert between magnetic forces and mechanical forces. The device used to perform this change is either called a motor or
generator depending on the direction of that change. Converting a mechanical force, like moving wind or water, to an electrical force uses a generator. Converting electrical energy to mechanical energy, like the device in this investigation, uses a motor.
The motor demonstrates three changes in energy:
1. A battery to convert chemical energy to electrical energy
2. An electromagnet to convert electrical energy to a magnetic field
3. The interaction between the electromagnet and a permanent magnet to generate motion resulting in mechanical energy that turns an axle
Materials • One 10 × 10-cm piece of
corrugated cardboard • Two 3-cm (1.25-in.) #1 paper
clips • One AA battery • Two ceramic iron ferrite disc
magnets • 125 cm (4 ft) of 26-gauge,
enamel-coated “magnet” wire
• Two 10-cm pieces of 22-gauge solid copper insulated wire
• One piece of 2.5 × 5-cm (1 × 2-in.) coarse-grit sandpaper
• One 30-cm (12-in.) ruler • One pair of scissors • One roll of electrical tape • One stopwatch
Procedure
4. Stack two magnets on top of each other in the middle of the cardboard. Trace a circle around the magnets. Remove the magnets from the cardboard and set aside.
5. Bend open each paper clip 90° at the U-shaped bend about halfway along the clip, forming a piece of metal with a long “U” flat on the table and a short upside-down “U” standing upright.
6. Bend closed the upright short legs of both paper clips so that each forms a small closed loop at the top of the upside-down “U.”
7. Place each paper clip on top of the cardboard so that the flat legs sit against the middle of the left and right edges of the cardboard and the upright loops stand near the opposite edges of the traced circle. Secure the paper clips to the cardboard with two pieces of tape near the outside edges of the cardboard (see the paper clips in the illustration on the next page).
8. Take one piece of insulated wire and slide one of the exposed ends underneath one of the paper clips. Bend the end of the wire to ensure that it is touching the paper clip. Use a piece of tape to secure the wire against the clip. Repeat this step with the other piece of wire by placing it under the other paper clip in the same manner. Both wires should extend off the cardboard on the side closest to you.
9. Put the magnets back into the traced circle.

G
aini
ng T
ract
ion
on M
ars
62
10. Leaving 12 cm of the wire free on both ends, wrap the enamel-coated magnet wire around the battery 20 to 30 times. Wrap tightly, allowing the coils to overlap.
11. Slide the wire off the battery. On opposite sides of the coil, use the loose ends to wrap around the inside and outside of the coil three times, creating a tight ring. There should still be at least 3 to 4 cm of wire remaining, sticking straight out in opposite directions.
12. Use the sandpaper to remove the enamel coating on the top half of each end of the wire, from the tip to the ring. You should be able to clearly see the copper wire.
13. Insert the wire circle into the paperclip loops so that the ring sits directly above the magnets (see the illustration below). The ring needs to be as perfectly centered as possible. If it favors tilting to one side, that side will be heavier and the ends will need to be bent to better center the ring. The closer to center, the better the motor will operate.
14. Tape the two insulated wires to the ends of the AA battery. The wire ring should begin to spin because of the forces interacting. If it does not, give it a little push with your finger to help get it started. Some small adjustments (balancing the ring, moving the magnets, adjusting the paper clip loops, etc.) will probably be necessary to get the motor running.
15. After the motor is running steadily, have one person in the group count the revolutions of the motor while a second person times for 10 seconds (do the best you can, some motors may be moving quite quickly). Multiply your number of revolutions in 10 seconds × 6 to get a number of revolutions in 60 seconds. This is called revolutions per minute, or rpm. Repeat this three times, and use the data to get the approximate average rpm of your motor. Then record your data on the Student Data Sheet.
The diagram below compares your motor to a standard direct-current (DC)
electromagnetic motor. The same basic parts are in both designs.
Student motor. Standard DC electromagnetic motor.

E
ngineering Design C
hallenge
63
Student Data Sheet
Trial Revolutions in 10 seconds
Revolutions in 10 seconds × 6 =
Revolutions per minute, rpm
1
2
3
Average
Reflection Questions 1. After you completed the motor assembly, did you have to make any adjustments to it to
get it to run or run better? If so, what adjustments did you make?
2. What was your greatest challenge while you were building the motor? How did you
overcome that challenge?
3. What types of work could you do with this motor if it were strong enough?
4. Remove the battery and reconnect it facing the opposite direction. Get the motor
spinning again. What did you notice about your motor’s operation in comparison to the original observations?

G
aini
ng T
ract
ion
on M
ars
64

E
ngineering Design C
hallenge
65
Glossary of Key Terms
Acceleration—The rate at which an object changes its velocity; can be positive or negative, depending on whether the object is speeding up or slowing down
Anode—The electrode of an electrochemical cell at which oxidation occurs in the positive terminal of an electrolytic cell
Axle—A pin, bar, shaft, or other structure, on which one or more wheels rotate Battery—A cell that provides electric current Cathode—The electrode of an electrochemical cell at which reduction occurs in the negative
terminal of an electrolytic cell Chassis—The frame, wheels, and machinery of a motor vehicle on which the body is supported Current—A flow of electrons Electricity—A form of energy that is carried through wires and is used to operate machinery;
electric current or power Electrochemical reaction—Any process either caused or accompanied by the passage of an
electric current and involving the transfer of electrons between two substances Electrodes—One of the two points through which electricity flows into or out of a battery or
other device Electrolyte—A substance that ionizes when dissolved in a solvent, such as water; in a
battery, the ions of the electrolyte interact with the anode and cathode, creating an imbalance of electrons that can be used to generate current
Electromagnet—A fabricated magnet made of a coiled wire wound around an iron core with electric current flowing through it to produce a magnetic field
Engineer—A person who applies understanding of science and mathematics to create things for the benefit of humanity and the planet
Force—A push or a pull exerted on an object Friction—A force that resists motion between two bodies in contact Gravity—The natural force that attracts all objects with mass toward each other Ion—An atom or group of atoms that has a positive or negative electric charge as a result of
losing or gaining one or more electrons Magnet—An object or material that attracts iron and generates a magnetic field Magnetic field—The portion of space around a magnet where the magnetic forces of the
object can be detected Motor—An electrical device that converts electrical energy into mechanical energy Rim—A circular strip of metal that connects an automobile wheel and a tire, either
permanently attached to or removable from the wheel Solenoid—A coil of insulated wire used to create a strong electromagnetic field when current
is conducted through the wire. Speed—The rate of motion Terramechanics—A field of study that focuses on the interface between a machine and the
terrain beneath it Velocity—The speed of an object moving in a specific direction Voltaic pile—A series of two metal discs separated by an electrolyte, repeated as necessary
to generate desired voltage, that creates an electric potential from one end of the stack to the other

G
aini
ng T
ract
ion
on M
ars
66
Related Supplemental NASA Educational Activities
Magnetic Math Educator Guide—Lab exercises prepare students to work mathematics problems with a better understanding of magnetism. http://www.nasa.gov/audience/foreducators/topnav/materials/listbytype/Magnetic_Math.html
Marsbound! Mission to the Red Planet—Through an interactive card game, students create
a mission to Mars that balances science return with mission constraints. http://www.jpl.nasa.gov/education/index.cfm?page=106
Mars Image Analysis—Students use orbital images of Mars to analyze its environment.
http://mars.jpl.nasa.gov/files/msip/onsite/1_Learning_about_the_Red_Planet/TG_MARS_IMAGE_ANALYSIS_12_2012_1.pdf
Moon Rovers—Students design and build a rubber-band-powered rover that can scramble
across the room. http://www.nasa.gov/offices/education/programs/national/summer/education_resources/engineering_grades7-9/E_moon-rovers.html
Rover Races—Working in small teams, students simulate being a rover and learn the
constraints of operating a rover on Mars. http://mars.jpl.nasa.gov/files/mep/Rover%20Races%206th%20-%2012th%20Grade%20Lesson.pdf
Touchdown Challenge—Students utilize the engineering design process to design and build
a shock-absorbing system that will protect two “astronauts” when they land. http://www.nasa.gov/offices/education/programs/national/summer/education_resources/engineering_grades7-9/E_touchdown-challenge.html
(The links on this page were verified on 9/24/14.)

E
ngineering Design C
hallenge
67
Links to Related NASA Content
Select NASA Websites Simulated Lunar Operations (SLOPE) Facility—General information about SLOPE
http://rt.grc.nasa.gov/main/rlc/simulated-lunar-operations-slope-facility/
Engine Research Building: Gallery—Select NASA images highlighting research conducted at GRC’s Engine Research Building, including many from the SLOPE laboratory http://facilities.grc.nasa.gov/erb/gallery.html
NASA Mars Exploration—The latest news and media from NASA about exploring Mars http://mars.nasa.gov/
NASA Mars Exploration: Mars for Educators—Activities, lessons plans, multimedia, and content about Mars http://mars.jpl.nasa.gov/participate/marsforeducators/
Mars Lithograph—High-resolution lithograph with basic information about the Red Planet http://www.nasa.gov/audience/foreducators/topnav/materials/listbytype/Mars_Lithograph.html
Robotics—Current NASA work in robotics http://www.nasa.gov/education/robotics/
Select NASA Videos Curiosity Rover Report (Feb. 14, 2014): Rover’s 5K Run—Testing being conducted to
reduce the wear on the Curiosity rover’s wheels https://www.youtube.com/watch?v=PiBbFC4Isr0
Lunar Roving Vehicle Wheel Assembly Testing—Historic footage of the Lunar Roving Vehicle wheels being tested on Earth https://www.youtube.com/watch?v=byg3iKMnwj0
Driving on the Moon—Historic footage of the Lunar Roving Vehicle driving on the Moon https://www.youtube.com/watch?v=NRqHubCtKmE
Real World: Scarab, NASA’s Newest Lunar Exploration Rover—Introductory information about Scarab, a rover frequently used at GRC to test new tire designs for space applications http://www.youtube.com/watch?v=z2UqCpr5Oh0
Check out Tri-ATHLETE—Information about the second-generation ATHLETE vehicle being tested in NASA’s Desert Research and Technology Studies (Desert RATS) https://www.youtube.com/watch?v=YC8jBdRO_80
NASA 360—Desert RATS and Analog Testing—A 24-minute feature about analog field testing and how NASA perfects equipment before heading to destinations like the Moon or Mars https://www.youtube.com/watch?v=9RyZT6Ko7A0
(The links on this page were verified on 9/24/14.)

G
aini
ng T
ract
ion
on M
ars
68


National Aeronautics and Space Administration
Glenn Research Center 21000 Brookpark Road Cleveland, OH 44135 www.nasa.gov/centers/glenn
www.nasa.gov PS–01422