engineering & construction september 05, 2013...
TRANSCRIPT

Engineering & Construction September 05, 2013
Voltas Bloomberg: VOLT IN EQUITY Reuters: VOLT BO
Accounting: GREEN Predictability: AMBER Earning Momentum: RED
Ambit Capital and / or its affiliates do and seek to do business including investment banking with companies covered in its research reports. As a result, investors should be aware that Ambit Capital may have a conflict of interest that could affect the objectivity of this report. Investors should not consider this report as the only factor in making their investment decision. Please refer to the Disclaimers at the end of this Report.
BUY
Key financials [` mn unless specified]
Year to March FY12 FY13 FY14E FY15E FY16E Operating income 51,857 55,310 54,747 55,360 61,947 Adjusted EBITDA 598 1,497 2,184 2,779 3,496 Adjusted EBITDA margin (%) 1.2% 2.7% 4.0% 5.0% 5.6% Core EPS (`) 1.2 3.0 4.4 6.0 7.9 RoE (%) 4.4% 6.5% 9.9% 12.5% 14.8% RoIC (%) 17.7% 11.5% 9.8% 12.9% 16.3% P/E (x) 33.8 21.1 12.8 9.6 7.5
Source: Company, Ambit Capital research
COMPANY INSIGHT
Nitin Bhasin Tel: +91 22 3043 3241 [email protected]
Tanuj Mukhija Tel: +91 22 3043 3203 [email protected]
Recommendation
CMP: `64
Target Price (12 months): `106
Previous TP: `113
Upside (%) 64
EPS (FY14E): `4.4
Change from previous (%) -33.9
Variance from consensus (%) -22.3
Stock Information
Mkt cap: `21bn/US$321mn
52-wk H/L: `63/139
3M ADV: `95mn/US$1.4mn
Beta: 1.06
BSE Sensex: 18,235
Nifty: 5,341
Stock Performance (%)
1M 3M 12M YTD
Absolute (14) (24) (42) (39)
Rel. to Sensex (9) (17) (47) (33)
Performance (%)
16,000
18,000
20,000
22,000
Oct
-12
Dec
-12
Feb-
13
Apr
-13
Jun-
13
Aug
-13
406080100120140
Sensex Voltas (RHS)
One-year forward P/E
05
101520
Oct
-11
Jan-
12
Apr
-12
Jul-
12
Oct
-12
Jan-
13
Apr
-13
Jul-
13
B lue S tar (x) Voltas (x)
Source: Bloomberg, Ambit Capital research
Value for your money Even if we assign nil value to Voltas’ Electromechanical Projects (EMP) business, its other segments plus cash/ investments (`28/share) are worth `86/share. Its room AC business’ discernible competitive advantages (built on ability to launch consumer-pull products, wide distribution reach and flexi-sourcing model) support our Unitary Cooling Products (UCP) segments’ valuation of `13.2bn (`40/share, 7.1x FY15E EBITDA). Improving environment for textile exports support Engineering Products and Service (EPS) segment valuation of `5.9bn (`18/share). Whilst we value EMP segment at `20/share (considering strong reputation, profitable domestic business, history of free cash generation), continuing losses in Middle East remain the key risk. We retain BUY but cut TP to `106/share (`113/share earlier).
Competitive position: MODERATE Change to this position: STABLE
Uncertainty makes multiples expensive, building valuation by blocks: Capex cycle/consumption uncertainty in India and poor visibility on Middle East business turning around make eps-based multiples (13X and 10X FY14 and FY15 eps, respectively) look expensive. Hence, investors should build fair value for Voltas by assessing valuation contributors in piece-meal. Excluding EMP, our fair value is `86/share—`40 from UCP, `18 from EPS, `22 from cash/investments and `6 from rental—implying 34% upside. However, EMP segment turning around is the key catalyst for crystallization of this upside. Voltas’ room AC business, an excellent franchise with strong competitive advantages: Over FY07-13, Voltas gained 4.9% market share to become Room AC leader (June-13: 20.9% share). Its market share gain was built consistently over two distinct phases for industry—high growth (FY09-11) then negative growth (FY11-13)—as it (a) launched consumer-pull products at regular intervals, (b) expanded distribution reach in tier-2/3 cities and (c) capitalized on its flexi-sourcing model. Whilst we expect nominal (3-5%) volume growth over FY14/15, moderating margins and RoCEs over next 5 years, we find large value in UCP business given low penetration rates for ACs. Our implied valuation for UCP is at marginal premium to Whirlpool India. All is not lost in EMP: Whilst our two-year outlook for the EMP business is negative (6% YoY sales decline in FY14/15E), we believe EMP business has value given Voltas’ profitable and leadership status in India (market with large potential), strong reputation with developers and a 10-year history of free cash flow generation after factoring in Rohini acquisition and Sidra’s onerous costs. Assuming moderate recovery beginning FY16, we value EMP at `6.8bn (`20/share). Legacy order completions and management highlighted costs controls will improve profits albeit gradually. Downward revision: We cut FY14E/15E sales by 2%/7% due to expected weak demand for room ACs and FY14E/15E EBITDA by 29%/27% owing to losses in EMP in 1QFY14 and even slower recovery expectations in EMP. We cut FY14E/15E PAT by 33%/29% due to lower EBITDA and other income.

Voltas
Ambit Capital Pvt Ltd 2
Upside of 34% even after assigning zero value for EMP business Voltas’ Electromechanical Projects (EMP) business deserves `6.8bn valuation, on account of a) strengths and the reputation built over the last decade, which can be verified by an FCFF of `2.7bn and b) the profit-making domestic business. However, even if one were to completely discount the EMP business and assign zero value to it, the other profitable business, such as Unitary Cooling Products (UCP), Engineering Products and Service (EPS) and cash/ liquid investments, are worth `86/share, resulting in 34% upside to the current market price. To calculate the fair value of the EMP business, we have assumed that Voltas’ entire debt (of `2.1bn) is for the EMP business, as the other businesses (UCP and EPS) have asset-light business models and high free cash flow generation.
Exhibit 1: Potential upside of 34% excluding EMP business
Particulars Fair value/share
(`) Contribution
to TP (%) Implied FY15
EV/EBITDA (x)
Unitary Cooling Product (UCP) 40 38% 7.1
Cash/ Liquid Investments* 22 21%
Engineering Products and services (EPS) 18 17% 6.6
Electromechanical Projects (EMP) # 20 19% 15.9
Rental Income 6 5%
Total Target Price 106 100%
Target Price ex EMP 86
Current Price 64
Potential upside ex EMP 34%
Source: Company, Bloomberg, Ambit Capital research. Note: # We have assumed that the entire debt is for the EMP projects business; * Liquid investments include shares of Lakshmi Machine Works (LMW) and Government securities worth Rs1.4bn
SOTP-based fair valuation Our SOTP-based valuation is `106/share and the core business value of `96/share (including all three sectors) forms 94% of our SOTP value. We have used 15% WACC for the EMP business, higher than the 14% WACC used for the UCP and EPS businesses, due to lack of visibility and higher embedded risks in the EMP business (applied from FY25E onwards). We have also capitalised the value of FY14E rental income (`319mn, 10% YoY decline) on the commercial properties at an annual yield of 10%.
Exhibit 2: SOTP-based valuation of `106/share
Business Methodology Value (` mn)
Holding (%)
Effective value (` mn)
Value/share (`) Implied FY15
P/E
Core business equity value (3-stage DCF) DCF 100% 31,865 96 15.9
Rental income capitalised at 10% yield Capitalisation 1,913 1,913 6
Lakshmi Machine Works’ equity shares + Gsecs Market Value 1,437 1,437 4
Total 35,215 106 15.9
Source: Company, Ambit Capital research

Voltas
Ambit Capital Pvt Ltd 3
Core business driven by two divergent businesses Considering the contrasting business outlook, growth and capital needs for the two major businesses (EMP and UCP), we have divided the valuation into three parts and we have calculated the enterprise value of the three different businesses (EMP, UCP and EPS). We use historical segmental data to model the following: (a) segmental revenue growth and EBITDA margins; (b) segmental capex and working capital requirements; and (c) terminal growth rate for each business. Our core DCF value is `96/share, which implies a P/E of 15.9x on FY15E core EPS of `6.0.
Exhibit 3: Segmental DCF valuation
Particulars (` mn, unless specified) Value % share of total EV
EMP segmental EV 8,887 28%
PV of free cash flow 4,791 15%
PV of terminal value 4,097 13%
UCP segmental EV 13,252 42%
PV of free cash flow 7,779 24%
PV of terminal value 5,473 17%
EPS segmental EV 5,878 18%
PV of free cash flow 4,016 13%
PV of terminal value 1,862 6%
Total PV of free cash flow (a) 16,585 52%
PV of terminal value (b) 11,432 36%
EV (a) + (b) 28,017 88%
Less/ (Add): Consolidated net debt (3,848) 12%
Implied core business equity value 31,865 100%
Implied core business equity value (` per share) 96
Implied rental income capitalized at 10% yield 1,913
Rental income capitalized at 10% yield (`/share) 6
Market value of LMW and G-sec 1,437
Market Value of LMW and G-sec (`/share) 4
Total 106
Source: Ambit Capital research
Sensitivity analysis of core business Our base-case valuation factors in EBIT margin of -1.8% for the EMP business and revenue growth of 8% YoY for the UCP business in FY14. Whilst the sensitivity table below shows the changes to our base-case FY14 estimates, we highlight that the change in our base-case estimates leads to a change in forward estimates.
Exhibit 4: Base-case valuation of `96/share
Particulars Change in EMP EBIT margin (FY14)
-200 bps -100 bps Base Case
(-1.8% EBIT margin) 100 bps 200 bps
-200 bps 90 92 93 95 97
-100 bps 91 93 95 97 98
Base Case (8% YoY revenue growth)
93 94 96 98 100
100bps 94 96 98 100 101
Ch
an
ge in
UCP
re
ven
ue g
row
th (
FY1
4)
200bps 96 98 99 101 103
Source: Company, Ambit Capital research

Voltas
Ambit Capital Pvt Ltd 4
SWOT analysis of Voltas’ room AC business
Exhibit 5: SWOT analysis of Voltas’ room AC business
Strengths Weaknesses
Voltas has a strong track record of launching new products, such as ‘All weather ACs,’ with cost-effective advertising.
Voltas’ promoter, Tata, is one of the most respected and trusted brands in India.
It has a strong dealer network across India especially in north and west India. Also, it has the first-mover advantage in tier-2 and tier-3 cities
The company has a flexi-sourcing model, as it is only an assembler and not manufacturer, leading to higher-than-peers RoCEs.
Voltas does not have an indigenous room AC manufacturing facility unlike its peers, such as Daikin, to offset higher import costs from INR depreciation.
In the last two years, Voltas’ cash-generating UCP business has been used to fund the loss-making EMP business.
Opportunities Threats
India has one of the lowest market penetrations of room ACs in the world at only 3.8% as on March 2013. Thus, the room AC market is a large untapped market.
According to the National Council of Applied Economic Research (NCAER), the number of middle income households is likely to increase at 11% CAGR until 2025.
The company faces intense competition from large Japanese players (such as Daikin and Panasonic) and Korean players (such as LG and Samsung) with deep pockets. These large players have aggressively reduced prices and offered discount schemes in the past to increase market share.
Since India is a price-sensitive market, an increase in room AC prices (due to INR depreciation) as well as a change in energy ratings could dampen demand for room ACs.
Source: Company, Ambit Capital research
Porter’s five forces analysis of room AC sector
Exhibit 6: Porter’s five forces analysis for the room AC sector
Source: Company, Ambit Capital research
Bargaining power of suppliers MEDIUM
Voltas is the largest purchaser of compressors in India. Hence, it has high bargaining power with the suppliers.
Other players such as LG, Samsung and Daikin have their own manufacturing facilities.
Competition HIGH Competition has intensified
after the entry of Japanese players such as Daikin, Hitachi and Panasonic.
To increase market share, Japanese players cut prices aggressively and had huge advertising spends.
The market share of Daikin and Panasonic has more than doubled in the last two years at the expense of Korean players such as LG and Samsung.
Barriers to entry MEDIUM
Existing players have created distribution network, economies of scale and brand identity. So, it is very difficult for any inexperienced new player to enter the room AC market.
However, major global players with deep pockets could potentially sell imported ACs in India.
Bargaining power of buyers
MEDIUM Room AC companies cannot
pass through the entire cost increase to end customers, as this would slow down the demand of their products, leading to loss in market share.
Further, consumers can easily switch between companies (brands), thereby limiting the bargaining power of individual companies.
Threat of substitution MEDIUM
Price-sensitive consumers could substitute room ACs with low-cost air coolers.
Improving
Unchanged
Deteriorating

Voltas
Ambit Capital Pvt Ltd 5
Voltas’ competitive advantages key to its outperformance in room ACs Voltas’ Unitary cooling products (UCP) business consists of room air conditioners (ACs), water dispensers and commercial refrigeration. Room air conditioners account for 80% of total UCP revenues. We believe the UCP business deserves `40/share valuation owing to its strong competitive advantages in the room air conditioning business which has enabled Voltas to outperform the sector consistently over the last five years.
In the last two years, AC prices have increased by 7-10% YoY each year, owing to energy label changes and higher input costs (due to INR depreciation), which have led to a decline in volume growth in the room AC business. Further, competition intensified with the entry of aggressive Japanese players in 2010. In such a tough scenario, Voltas has increased its market share, highlighting its strong competitive advantages.
Exhibit 7: Voltas has consistently outperformed the market in a highly competitive and volatile environment
40% 34%24%
24%
4%-10%
30%
6% -5%-20%
24%25%
-30%
-10%
10%
30%
50%
70%
FY09
FY10
FY11
FY12
FY13
1QFY
14
Voltas Volume growth Sector Volume growth
Energy label change and INR depreciation led increase in prices, delay in onset of summer
Energy label change, power supply issue, increase in prices
Source: Company, Industry, Ambit Capital research Note: This is based on secondary sales data and may not match with Voltas’ reported numbers for UCP segement
Competitive mapping of room AC players In our opinion, the key parameters for a competitive mapping of room AC players are: (a) market share and change in market share, (b) advertising strategy, (c) product price and quality, (d) distribution network, and (e) sourcing model. Based on our analysis, the key drivers of Voltas’ competitive advantage are: (a) ability to consistently launch unique products with effective advertising, (b) wide distribution reach, and (c) flexi-sourcing model. In the last five years, Voltas has validated its competitive advantages by increasing its market share in both growing and declining room AC market.

Voltas
Ambit Capital Pvt Ltd 6
Exhibit 8: Competitive mapping of key room AC players
Result Product placement strategy
Market
share Change in market
share FY11-13 Advertising campaign Price
Product quality#
Dealers Sourcing model
Voltas 20.9%* 3.9% All Weather AC Tier 1 Better >6,000 Flexi-sourcing
Blue Star 6.0% 2.0% Office-like cooling at home Tier 1 Good >1,200 Manufacturing plants in the south
LG** 17.3% -4.7% Cooling V Saving V Tier 1 Good >20,000* Manufacturing plants in Noida, Pune
Samsung** 11.3% -5.7% Samsung ON Saving ON, assured gift
Tier 1 Good >17,000* Manufacturing plant at Noida
Daikin 12.0% 8.0% Imported Inverter Air conditioners
Premium Best >1,000 35% locally manufactured
Panasonic 8.0% 3.5% Celebrity : Katrina Kaif Premium Best Mainly metros Local manufacturing unit
Source: Company, Ambit Capital research. Note: * Market share for Voltas is as on end-June 2013 whereas market share for others is as on end-February 2013; ** Samsung and LG also sell other consumer durable products. # We conducted a dealer survey to understand product quality.
Exhibit 9: Price (`) of 1-tonne window AC, star rating 2, noise level 45-55db
02000400060008000
100001200014000160001800020000
Hai
er
Sam
sung
Vide
ocon
Oni
da
God
rej
Elec
trlu
x
Blue
Sta
r
Volta
s
LG
Whi
rlpoo
l
Source: Company, Industry, Compareindia.com
Exhibit 10: Price (`) of 1-tonne split AC, Star rating 3, noise level 35-45db
0
5000
10000
15000
20000
25000
30000
Vide
ocon
Loyd
Oni
da
Elec
trol
ux
Volta
s
Sam
sung LG
God
rej
Hita
chi
Blue
Sta
r
Dai
kin
Pana
soni
c
Source: Company, Industry
(a) Ability to consistently launch customer-pull products with effective advertising has created a strong ‘Value for money’ brand
Whilst the competition has used consumer-push strategies to advertise room air conditioners, Voltas has focused on building a superior product to match consumer needs. Japanese competitors have used discount schemes, price cuts and big celebrities to advertise their products. Voltas, on the other hand, has advertised the utility of its superior product. Mentioned below are few examples of Voltas’ successful room AC product placement strategy:
Energy-saving ACs (2007): In a price-sensitive Indian market, Voltas introduced premium energy-saving ACs under an Indian advertising theme: ‘India ka Dil, India ka AC’ (English translation: India’s heart, India’s AC). Despite higher AC prices, the product was well received by the customers due to lower running costs. Thus, the company gained a market share of 200bps over the next two years.
Sensible cooling ACs (2010): In 2010, Voltas launched a new advertising campaign, ‘sensible cooling,’ to educate the customer about the use of air conditioners. The campaign was well received by customers and Voltas maintained its market leadership in the room AC business.

Voltas
Ambit Capital Pvt Ltd 7
All weather AC (2012): Voltas launched a highly successful ‘All weather AC’
and used cost-effective common-man advertising through ‘Mr Murthy’. This product helped Voltas become the market leader (with a market share of 20.9% as on June 2013) in room ACs.
Voltas’ higher market share is not due to higher advertisement spend: In proportion to revenues from the consumer durables business, we find that Voltas has the lowest advertisement expense. We believe this highlights Voltas’ brand strength as compared to other smaller players such as Blue Star and Hitachi. Clearly, as Blue Star and Hitachi aggressively increase their advertising spends to capture more market share, we believe Voltas will also have to increase its advertisement spend. However, the adverse affect that such incremental advertisement spend will have on profitability for Blue Star and Hitachi may be more than that on Voltas.
Exhibit 11: Voltas and Blue Star have the lowest advertisement expenditure vs other consumer durables companies
` mn FY10 FY11 FY12 FY13 % CAGR
(FY10-13)
Voltas 282 246 254 337 6.1
Blue Star 147 149 235 300 26.5
Hitachi Home 284 274 422 409 12.8
MIRC Electronic 744 904 560 309 (25.1)
Whirlpool 744 894 528 507 (11.9)
Source: Company, Capitaline, Ambit Capital research
Exhibit 12: Voltas’ advertisement expenditure has always remained the lowest vs peers
Companies (%) FY10 FY11 FY12 FY13
Voltas* 2.4 1.6 1.6 1.8
Blue Star* 2.5 1.9 2.5 3.1
Hitachi Home 4.4 3.6 5.8 4.9
MIRC Electronic 4.9 4.7 3.2 2.3
Whirlpool 2.9 2.9 1.9 1.7
Source: Company, Capitaline, Ambit Capital research. Note: (a) * For Voltas and Blue Star, we have considered marketing expenditure as a percentage of cooling products business’ revenues
Product quality perception of consumers: The Korean players such as Samsung and LG use a copper coil, which is not suitable for the humid Mumbai climate. Hence, the Korean players are offering discounts to push sales in Mumbai. According to dealers, the key reason for Voltas’ higher sales is its strong brand name. Further, customers perceive Daikin and other Japanese AC as a premium brand with superior product quality as compared to other brands.
(b) Strong dealer network in tier-2 and tier-3 cities, especially in north and west India:
Voltas has built strong dealer network across India especially in tier-2 and tier-3 cities, which account for more than 50% of its room AC sales (source: dealer network). Voltas has a wide distribution reach in the north (the largest market in India) and west, which is substantiated by its market leadership in Mumbai, Madhya Pradesh, Jharkhand, Bihar and the north. Whilst the fast-growing aggressive Japanese players have a strong presence in metros, they lag behind Voltas in tier-2 and tier-3 cities. Competitors such as Panasonic also highlight that the reason for Voltas’ consistent market share gains has been its presence in markets where Japanese have had lesser focus.
(c) Flexi-sourcing model leading to higher-than-peers RoCE
Voltas is an assembler and not a manufacturer of room air conditioners. It operates on an asset-light model; it imports (mainly indoor units for splits/compressors) 40-60% of the gross cost from China/Indian sub-contractors and assembles through its subsidiary, Universal Cooling Products, which has a plant in Pantnagar with only 51 full-time employees. It also has similar outsourced assembling workshops around demand centres. Voltas works on a flexi-sourcing and low capital-intensive model, resulting in higher than peers RoCE and consistent FCFF generation. Given the scale of sourcing, we believe Voltas enjoys relatively stronger bargaining power on OEMs/suppliers.

Voltas
Ambit Capital Pvt Ltd 8
Exhibit 13: Voltas’ RoCE superior to other listed peers
-80%-60%-40%-20%
0%20%40%60%80%
FY05
FY06
FY07
FY08
FY09
FY10
FY11
FY12
FY13
Voltas Blue StarWhirlpool Hitachi
Source: Company, Ambit Capital research
Exhibit 14: Strong track record of generating FCFF
-500
0
500
1,000
1,500
FY05
FY06
FY07
FY08
FY09
FY10
FY11
FY12
FY13
Voltas UCP (Rs mn) Blue Star UCP (Rs mn)
Source: Company, Ambit Capital research
FY13: An example of the benefits of Voltas’ flexi-sourcing model
As mentioned earlier, Voltas imports compressors from China or Indian subcontractors, depending on which is the lower-cost option. Voltas imported finished goods in FY12 to meet consumer demand, as the INR appreciated marginally by 1.5% YoY in 1HFY12, making imports cheaper. Since, the INR depreciated sharply by 7% YoY in FY13, Voltas increased sourcing from Indian sub-contractors. Thus, the flexi-sourcing model enabled Voltas to effectively manage gross costs in FY13, thereby improving EBIT margins in the UCP business by 100bps and RoCEs by 1000bps YoY to 59.8%.
Exhibit 15: A good example of Voltas’ sourcing model
` mn unless specified FY09 FY10 FY11 FY12 FY13
Value of imports on CIF basis
Raw materials 249 159 232 354 116
Finished Goods 4,254 3,891 4,515 7,743 4,554
Components and Spares 697 1,565 2,159 4,633 3,536
Total 5,200 5,615 6,907 12,729 8,206
Unitary cooling products revenue 9,223 11,871 15,608 15,388 18,356
value of imports as % of unitary product sales 56.4% 47.3% 44.3% 82.7% 44.7%
Cost of unitary cooling sales 8,622 10,627 13,974 14,055 16,595
Value of Imports as % cost of unitary product sales 60.3% 52.8% 49.4% 90.6% 49.4%
Depreciation 51 41 34 34 34
Unitary cooling products EBIT 550 1,203 1,599 1,298 1,727
EBIT margin 6.0% 10.1% 10.2% 8.4% 9.4%
Finding out the true Gross cost of the Unitary Cooling Business
Employee Cost @8% of sales 738 950 1249 1231 1469
% of unitary product sales 8.0% 8.0% 8.0% 8.0% 8.0%
Marketing cost 93 277 245 252 336
% of unitary product sales 1.0% 2.3% 1.6% 1.6% 1.8%
Distribution and selling @5% of sales 461 594 780 769 918
% of unitary product sales 5.0% 5.0% 5.0% 5.0% 5.0%
Business overheads 369 237 312 308 367
% of unitary product sales 4.0% 2.0% 2.0% 2.0% 2.0%
Gross product cost 6,961 8,570 11,388 11,496 13,506
Hence Gross product cost 75% 72% 73% 75% 74%
Assuming 90% of imports are for this business (except FY12) 4,680 5,053 6,216 9,197 7,385
Imports as a %age of Gross Cost of Products sold in UCP business 67% 59% 55% 80% 55%
Source: Company, Ambit Capital research
Voltas
Ambit Capital Pvt Ltd 9
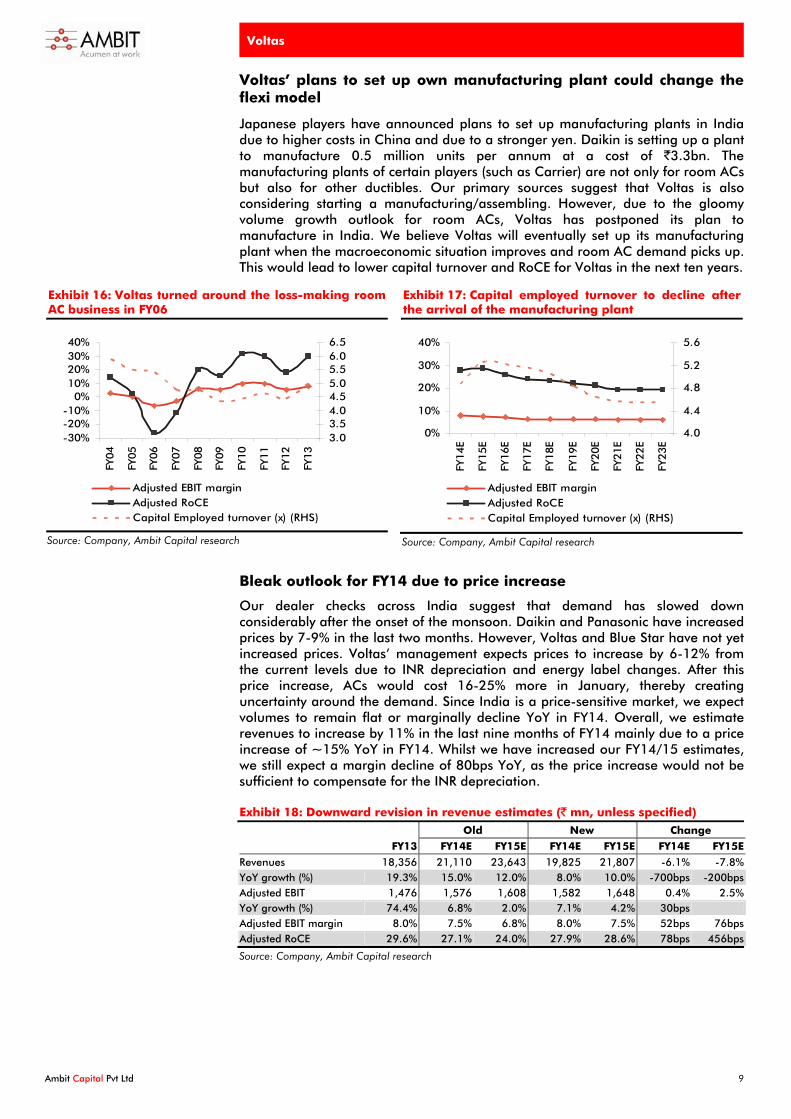
Voltas’ plans to set up own manufacturing plant could change the flexi model
Japanese players have announced plans to set up manufacturing plants in India due to higher costs in China and due to a stronger yen. Daikin is setting up a plant to manufacture 0.5 million units per annum at a cost of `3.3bn. The manufacturing plants of certain players (such as Carrier) are not only for room ACs but also for other ductibles. Our primary sources suggest that Voltas is also considering starting a manufacturing/assembling. However, due to the gloomy volume growth outlook for room ACs, Voltas has postponed its plan to manufacture in India. We believe Voltas will eventually set up its manufacturing plant when the macroeconomic situation improves and room AC demand picks up. This would lead to lower capital turnover and RoCE for Voltas in the next ten years.
Exhibit 16: Voltas turned around the loss-making room AC business in FY06
-30%-20%-10%
0%10%20%30%40%
FY04
FY05
FY06
FY07
FY08
FY09
FY10
FY11
FY12
FY13
3.03.54.04.55.05.56.06.5
Adjusted EBIT marginAdjusted RoCECapital Employed turnover (x) (RHS)
Source: Company, Ambit Capital research
Exhibit 17: Capital employed turnover to decline after the arrival of the manufacturing plant
0%
10%
20%
30%
40%
FY14
E
FY15
E
FY16
E
FY17
E
FY18
E
FY19
E
FY20
E
FY21
E
FY22
E
FY23
E
4.0
4.4
4.8
5.2
5.6
Adjusted EBIT marginAdjusted RoCECapital Employed turnover (x) (RHS)
Source: Company, Ambit Capital research
Bleak outlook for FY14 due to price increase
Our dealer checks across India suggest that demand has slowed down considerably after the onset of the monsoon. Daikin and Panasonic have increased prices by 7-9% in the last two months. However, Voltas and Blue Star have not yet increased prices. Voltas’ management expects prices to increase by 6-12% from the current levels due to INR depreciation and energy label changes. After this price increase, ACs would cost 16-25% more in January, thereby creating uncertainty around the demand. Since India is a price-sensitive market, we expect volumes to remain flat or marginally decline YoY in FY14. Overall, we estimate revenues to increase by 11% in the last nine months of FY14 mainly due to a price increase of ~15% YoY in FY14. Whilst we have increased our FY14/15 estimates, we still expect a margin decline of 80bps YoY, as the price increase would not be sufficient to compensate for the INR depreciation.
Exhibit 18: Downward revision in revenue estimates (` mn, unless specified) Old New Change
FY13 FY14E FY15E FY14E FY15E FY14E FY15E
Revenues 18,356 21,110 23,643 19,825 21,807 -6.1% -7.8% YoY growth (%) 19.3% 15.0% 12.0% 8.0% 10.0% -700bps -200bps Adjusted EBIT 1,476 1,576 1,608 1,582 1,648 0.4% 2.5% YoY growth (%) 74.4% 6.8% 2.0% 7.1% 4.2% 30bps Adjusted EBIT margin 8.0% 7.5% 6.8% 8.0% 7.5% 52bps 76bps Adjusted RoCE 29.6% 27.1% 24.0% 27.9% 28.6% 78bps 456bps
Source: Company, Ambit Capital research

Voltas
Ambit Capital Pvt Ltd 10
Cash and liquid investments worth `22/share (32% of mcap) Voltas had `8.66bn in cash and liquid investments as on 1QFY14 equivalent to `26/share (~38% of the current market capitalisation). Voltas had higher cash and liquid investments in 1QFY14 due to low room-AC inventory after the summer season. The company stocks room ACs before Diwali and the summer season in the remaining three quarters, resulting in lower cash flows. Our FY14E cash and liquid investments are very conservative at `5.96bn (down 11% YoY), equivalent to `18/share.
According to the management, the company had an unusually large amount of cash in the current account in end-FY13 due to several holidays before the year-end closing. In addition to the above investments, Voltas has 0.6mn shares of Lakshmi Machine Works (LMW), which are currently valued at `1.13bn, equivalent to `3.5/share, as well as Government treasury securities worth `1/share.
Exhibit 19: Cash and liquid investments (` mn, unless specified)
FY12 FY13 FY14E
Cash and Bank Balances 2,710 3,498 2,280
Cash in hand and Cheques on Hand 569 509 N.A.
Current accounts 1,750 2,269 N.A.
Deposit accounts 392 720 N.A.
Current Investments in mutual funds 2,233 3,180 3,680
Source: Company, Ambit Capital research
Steady outlook for EPS business, valued at `18/share In the Engineering products and service (EPS) business, Voltas is the dealer for textile and mining equipment. It sells the spinning equipment of Lakshmi Machine Works (LMW) along with knitting and weaving textile equipments from other reputed suppliers. The source of earnings in the textile business is commissions and spares (not after sales or O&M).
According to LMW, the outlook for spinning equipment is positive due to policy changes in China to import yarn instead of cotton. Further, Voltas has entered into new segments besides spinning in the textile business to augment textile machinery growth. Whilst the outlook for yarn/textile exports appears good, the uncertainty around the Technology Upgradation Funds Scheme (TUFS) is looming large (on clear direction and intensity of growth). Apart from LMW, Voltas has 8-9 principals in textiles.
The mining business constitutes 50% of revenues of the EPS business. The company earns revenue from product sales, spares sales, O&M contracts and after-sales service. Whilst orders are erratic in India, new geographies such as Mozambique (for after sales service) have excelled in the last 15 months. In our opinion, the right metric to look at this business is value addition growth (likely to be in single digits). We estimate the five-year revenue CAGR to decline by ~1% (FY12-16E). Our EBITDA margin estimates are in line with management expectations of 17-21%.

Voltas
Ambit Capital Pvt Ltd 11
Exhibit 20: EPS business - financial performance (` mn unless specified)
FY12 FY13 FY14E FY15E FY16E
Revenue 4,121 4,311 4,526 4,888 5,377
YoY growth (%) -27% 5% 5% 8% 10%
EBITDA 702 837 905 880 968
EBITDA YoY growth (%) -32.9% 19.3% 8.1% -2.8% 10.0%
EBITDA margin 17.0% 19.4% 20.0% 18.0% 18.0%
Source: Company, Ambit Capital research
`6/share valuation for rental income Voltas has investment properties comprising office buildings in Mumbai, Chennai and Jamshedpur as well as other office premises given on rent. Rental income declined 14% YoY due to sale of investment properties and sluggish commercial real estate demand. We have estimated a further rental income decline of 10% YoY (conservative estimate) to factor in lower commercial space demand. The company has invested `150mn in new investment properties in FY14, leading to `240mn worth of investment properties in FY13.
Exhibit 21: Rental yield valuation (` mn, unless specified)
FY11 FY12 FY13 FY14
Rental Income received 349 410 354 319
YoY growth 6% 17% -14% -10%
EBIT 210 246 213 191
EBIT margin 60% 60% 60% 60%
Capitalisation at 10% yield 2,126 1,913
Source: Company, Ambit Capital research

Voltas
Ambit Capital Pvt Ltd 12
All is not lost in EMP: `20/share valuation In our opinion, the key concern for investors is the low profitability of the EMP business especially in the Middle Eastern projects. The two main reasons for lower margins are: (1) cost overruns due to project execution delays and (2) delay in payment cycle, leading to higher working capital requirement. We agree that the financial performance of Voltas’ EMP business has disappointed in the last eight quarters and the leading indicators do not indicate a strong recovery in the buildings capex cycle. Whilst our two-year outlook for the EMP business is negative (sales decline of 6% YoY in FY14/15E), we believe the EMP business deserves a value of `6.8bn (`20/share, 15.9x FY15E EBITDA) owing to its strengths and the reputation built in the last decade, which can be verified by FCFF generation of `2.7bn and by the profit-making domestic business. We have assumed that the entire debt on Voltas’ balance sheet is for the EMP business.
(a) Voltas has generated superior FCFF than Blue Star in EMP
In the last ten years, Voltas has outperformed Blue Star in the EMP business. Voltas has cumulatively generated FCFF of `2.7bn in the last ten years whereas Blue Star has only generated `0.5bn in the same period. Three key observations from our ten-year FCFF analysis are:
Cash flow generation has declined in last five years (FY08-13) vs FY03-08: Excluding acquisitions, both Voltas and Blue Star have generated higher free cash flows in FY03-08 vs FY08-13. Whilst Voltas has generated `896mn free cash flows in FY08-13, Blue Star has generated negative free cash flows of `309mn in the same period. We believe that the decline in EBIT margins in the last five years was due to a change in the industry structure (higher competition) and the slowdown in commercial construction in India and the Middle East.
Value-destructive acquisitions made by both Voltas and Blue Star to become integrated MEP players: Voltas acquired an 84% stake in Rohini Industrial Electrical for `1.1bn and Blue Star acquired DS Gupta Construction and Naseer Electricals in FY08-11 to become integrated Mechanical Electrical Plumbing (MEP) players. However, due to the slowdown in the capital investment cycle, clients continue to prefer low-cost small piecemeal MEP orders instead of integrated orders. Further, profitability decreased sharply in electrical companies due to intense competition. Hence, the acquisitions have been value-destructive for both companies. Voltas is trying to reduce the size of Rohini Industrials to cut its losses. Rohini's FY13 revenues were ~38% of its FY10 revenues. In our opinion, these acquisitions will become value-accretive only when the integrated MEP order inflow picks up.
Flat revenues in last three years (FY10-13) for both Voltas and Blue Star: The cumulative FY10-13 order book has declined for both Voltas and Blue Star by 20% due to the slowdown in the commercial building capex cycle. The managements of both the firms state that they had cautiously bid for projects during the last three years. However, their conservative bidding has not yielded results, owing to execution delays and higher working capital requirements.

Voltas
Ambit Capital Pvt Ltd 13
Exhibit 22: Voltas’ ten-year FCFF (` mn, unless specified)
FY04 FY05 FY06 FY07 FY08 FY09 FY10 FY11 FY12 FY13 FY03-13 FY03-08 FY08-13
EMP revenues 7,342 8,037 11,295 14,383 17,449 27,668 31,134 30,411 31,832 31,995 211,547 58,506 153,040
within which International revenues
NA 3,218 6,114 7,034 8,350 16,207 18,826 16,228 17,891 18,699 112,567 24,716 87,851
EMP revenue YoY 9.5% 40.5% 27.3% 21.3% 58.6% 12.5% -2.3% 4.7% 0.5%
EMP revenue share of total revenues
55% 56% 59% 57% 54% 64% 65% 59% 61% 58% 59.7% 56.2% 61.2%
Reported EBIT 206 429 647 685 1,170 2,134 3,091 2,393 1,724 513 12,993 3,138 9,855
Total unallocated expenditure
206 348 308 -816 -161 -309 -173 -371 259 1,136 426 -115 541
Onerous costs 2,766 956 3,722 0 3,722
Adjusted EBIT 92 235 465 1,149 1,258 2,332 3,203 2,611 -1,201 -1,101 9,043 3,199 5,844
Adjusted EBIT margin 1.3% 2.9% 4.1% 8.0% 7.2% 8.4% 10.3% 8.6% -3.8% -3.4% 4.3% 5.5% 3.8%
Tax rate (company wise) 17% 13% 23% 17% 32% 32% 28% 33% 26% 26%
Assumed tax rate 32% 32% 32% 32% 32% 32% 28% 33% 26% 26%
Depreciation/non cash expenditure
227 114 150 128 325 481 194 764 507 337 3,227 944 2,283
Capital Expenditure 28 34 36 132 134 238 131 322 123 228 1,406 364 1,042
Change in working capital
69 174 -257 834 44 -617 584 2,314 2,948 -922 5,172 865 4,307
EMP FCFF 193 66 687 -56 997 2,457 1,796 -120 -3,453 216 2,782 1,887 896
Acquisition 536 236 244
Company FCFF 135 454 269 79 3,280 80 2,863 -741 -1,832 1,023 5,611 4,217 1,393
Share of EMP FCFF within overall FCFF
143% 14% 256% -71% 30% 3053% 63% 16% 189% 21% 50% 45% 64%
Source: Company, Ambit Capital research
Exhibit 23: Blue Star’s ten-year FCFF (` mn, unless specified)
FY04 FY05 FY06 FY07 FY08 FY09 FY10 FY11 FY12 FY13 FY03-13 FY03-08 FY08-13
EMP revenues 4,786 6,515 8,213 11,243 15,563 17,331 17,960 19,850 16,751 17,766 135,978 46,320 89,658
EMP revenue YoY 36.1% 26.1% 36.9% 38.4% 11.4% 3.6% 10.5% -15.6% 6.1%
EMP revenue share of total revenues
67% 70% 70% 70% 69% 69% 70% 66% 59% 61% 66.1% 69.1% 64.7%
Reported EBIT 465 603 800 1,029 1,897 2,182 2,147 1,812 -982 634 10,586 4,794 5,792
Total unallocated expenditure 66 191 329 454 271 764 707 698 729 801 5,008 1,311 3,697
Adjusted EBIT 421 469 571 711 1,711 1,657 1,650 1,352 -1,411 147 7,279 3,884 3,396
Adjusted EBIT margin 8.8% 7.2% 7.0% 6.3% 11.0% 9.6% 9.2% 6.8% -8.4% 0.8% 5.4% 8.4% 3.8%
Tax rate (company wise) 25% 32% 28% 26% 29% 24% 24% 31% -1% 6%
Depreciation/non cash expenditure
98 69 85 135 190 224 290 270 265 309 1,935 577 1,358
Capital Expenditure 100 133 86 133 766 778 253 211 284 333 3,076 1,218 1,859
Change in working capital
126 219 378 311 321 245 827 1,921 -1,560 528 3,316 1,355 1,962
EMP FCFF 186 37 32 215 314 456 471 -936 115 -415 475 784 -309
Acquisition cost 420 800 1,220 420 800
Company FCFF 186 37 32 215 -106 456 471 -1,736 115 -415 -745 364 -1,109
Share of EMP FCFF within overall FCFF
133 -75 -162 417 -131 1,045 915 -2,437 1,912 18 1,634 181 1,453
Source: Company, Ambit Capital research
(b) Profitable domestic EMP business
According to our industry checks and confirmed by Voltas’ management, the company’s domestic EMP business is profit-making at the EBIT level. Domestic projects account for 64% of the 1QFY14 order backlog and ~50% of FY13 revenues. The building capex cycle has currently come to a halt in India, resulting in lower EMP orders. However, Indian EMP projects have a strong long-term

Voltas
Ambit Capital Pvt Ltd 14
potential, owing to under-penetration of HVAC in commercial buildings and the recovery in the capex cycle.
(c) Reducing share of loss-making Middle East projects business
The proportion of the Middle East order book has declined consistently in the last five years (42% in FY13 vs 83% in FY08). According to the management, they have cautiously bid for projects with reasonable site margins (in excess of 6%), resulting in declining order book. Whilst Voltas has laid off employees in the Middle East to reduce operating costs, its efforts have not yielded results due to execution delays. The management believes that the external business environment must improve for their cost-cutting efforts to show results. Whilst we do not expect a quick recovery in the Middle East projects business, the increasing share of the profitable domestic EMP projects business will offset the loss-making Middle East projects business.
Exhibit 24: Dwindling Middle East order book will lead to ….
0
10
20
30
40
50
60
FY08
FY09
FY10
FY11
FY12
FY13
0.00.51.01.52.02.53.03.54.04.5
India orderbook (Rs bn) ME orderbook (Rs bn)
India book to bill (RHS) ME book to bill (RHS)
Source: Company, Ambit Capital research. Note: ME=Middle East
Exhibit 25: …decline in FY14/15E Middle East revenues
05
10
1520
2530
35
FY08
FY09
FY10
FY11
FY12
FY13
FY14
E
FY15
E
-20%
0%
20%
40%
60%
80%
100%
India sales (Rs bn) ME Sales (Rs bn)
India sales YoY (RHS) ME sales YoY ( RHS)
Source: Company, Ambit Capital research. Note: ME=Middle East
Voltas and Blue Star can learn from MEP operations of Drake and Skull
Whilst Indian EMP players, such as Voltas and Blue Star, have struggled to generate EBIT margins and RoCEs, Drake and Skull reported net income margins of ~9% in FY13 in the MEP business. Drake’s and Skull’s strategy of bidding for large and complex projects is the key reason behind their superior performance. The management of Drake and Skull highlighted that construction outlook in the Middle East has improved in the last six months. Also, their payment cycle has improved, as their receivables have declined by 40% in the last six months. The strong performance of Drake and Skull and the improving outlook on construction in the Middle East bodes well for the EMP businesses of Voltas and Blue Star.
Why did Voltas not book cost overruns in 1QFY14 under exceptional items as it did for Sidra in 4QFY13?
Sidra is a unique project in which the cost overruns are due to prolonged delays in approvals and an inefficient design by Voltas. The client will not pay for an inefficient design and hence a 100% recovery in Sidra’s claims is unlikely. However, in other projects, Voltas could negotiate with clients to claim cost variations. Historically, the execution cost of all the fixed-price EMP projects exceeded 15-20% of the budgeted cost and the client had paid for the increase in project cost. Lastly, the cost overruns in the other Middle East jobs are small and not as onerous as Sidra. In the past, cost overruns of `300mn-400mn in Sidra were part of regular costs and when these exceeded or became large then only an onerous entry was passed.

Voltas
Ambit Capital Pvt Ltd 15
Further reduction in our EMP profitability estimates We had earlier modeled moderate profitability recovery in FY15 both in the India and Middle East business. However, we believe that recovery in the Indian and Middle Eastern EMP business has been further delayed owing to the 1QFY14 disappointment in the Middle Eastern business and the macroeconomic slowdown in India. Whilst 1QFY14 order inflow growth was reasonable (at 2% YoY), EBIT margins were a disappointment (at -3.8%).
Key changes to our estimates are:
We have reduced our domestic order inflow by 16% for FY14E and 23% for FY15E due to lack of recovery in buildings capex cycle.
Whilst our FY14 revenues estimates are unchanged (down 6% YoY), we believe the share of Middle Eastern business revenues will increase, as the company has won large orders in the Middle East such as the `2.8bn Qatar stadium order. Voltas is in advanced stage of negotiation for a `5.35bn order in Oman and Qatar. We have significantly reduced India business EMP revenues due to execution delays and payment cycle delays.
We reiterate that the India projects business is profitable at the EBIT level but the Middle East business is still loss-making. In our opinion, the EMP business does not have any leading indicators that suggest a significant improvement in profitability. Thus, we have further reduced our EBITDA estimates by 29% for FY14 and 41% for FY15 in the India EMP business. We expect the Middle East operations to continue to make losses in FY14 and FY15.
Exhibit 26: Further downward revision in EMP estimates (` mn unless specified)
Old New Change
FY13 FY14E FY15E FY14E FY15E FY14E FY15E
EMP order book 37,190 36,374 41,008 34,514 36,915 -5% -10%
India 21,610 24,609 29,460 23,487 26,318 -5% -11%
Middle East 15,580 11,765 11,548 11,027 10,597 -6% -8%
EMP order inflow 26,136 29,358 35,229 27,178 30,469 -7% -14%
YoY growth (%) 12% 20% 4% 12% -800bps -800bps
India 15,712 18,633 22,360 15,712 17,283 -16% -23%
YoY growth (%) 19% 20% 0% 10% -1900bps -1000bps
Middle East 10,424 10,725 12,869 11,466 13,186 7% 2%
YoY growth (%) 3% 20% 10% 15% 700bps -500bps
EMP business revenue 31,866 30,174 30,596 29,855 28,068 -1% -8%
YoY growth (%) -5% 1% -6% -6% -100bps -700bps
India 13,662 15,634 17,510 13,835 14,452 -12% -17%
YoY growth (%) 14% 12% 1% 4% -1300bps -800bps
Middle East 18,204 14,540 13,086 16,019 13,617 10% 4%
YoY growth (%) -20% -10% -12% -15% 800bps -500bps
EMP EBITDA 660 927 1,662 -90 515 N.A. -69%
India 546 782 1,138 551 651 -29% -43%
Middle East 113 145 523 -641 -136 N.A. N.A.
Source: Company, Ambit Capital research

Voltas
Ambit Capital Pvt Ltd 16
Key assumptions Exhibit 27: Key assumptions (` mn, unless specified)
Key assumptions Old estimates New estimates Change in estimates
FY14E FY15E FY14E FY15E FY14E FY15E Comments
Closing Order book 36,374 41,008 34,514 36,915 -5.1% -10.0%
YoY growth (%) -2% 13% -7% 7% -500bps -578bps
Order Addition-total 29,358 35,229 27,178 30,469 -7.4% -13.5%
YoY growth (total) (%) 12% 20% 4% 12% -779bps -789bps
India 18,633 22,360 15,712 17,283 -15.7% -22.7%
India YoY 10% 20% 0% 10% -1000bps -1000bps
Overseas 10,725 12,869 11,466 13,186 6.9% 2.5%
Overseas YoY 15% 20% 10% 15% -500bps -500bps
Overall book to bill 1.2 1.3 1.2 1.3
Previously, we had expected the onset of recovery from FY15. However, leading indicators such as IIP do not reflect a pick up in the Indian capex cycle. Hence, we have cut our India business FY14/15 order inflow estimates owing to a slowdown in the India capex cycle. We have increased our Middle East business order inflow estimates owing to the company’s guidance of winning large projects worth `8bn in the next two quarters.
Revenues 56,480 59,955 54,747 55,360 -3.1% -7.7%
YoY growth (%) 2.1% 6.2% -1.0% 1.1% -313bps -503bps
EMP business 30,174 30,596 29,855 28,068 -1.1% -8.3%
YoY growth -5.7% 1.4% -6.7% -6.0% -100bps -738bps
UCP business 21,110 23,643 19,825 21,807 -6.1% -7.8%
YoY growth 15% 12% 8% 10% -700bps -200bps
We have cut our FY15 revenue estimates due to lower order inflow in FY14/15. We expect a price increase ~15% YoY in FY14 owing to energy ratings change and INR depreciation, which will lead to flat AC volume growth.
EBITDA 3,072 3,854 2,184 2,779 -28.9% -27.9%
EBITDA margin 5.4% 6.4% 4.0% 5.0% -145bps -141bps
EMP business 3.1% 5.4% -0.3% 1.8% -337bps -360bps
UCP business 8.5% 8.0% 8.8% 8.5%
We have decreased our EBITDA margin estimates for the EMP business due to lower-than-expected EBIT margins in 1QFY14.
Adjusted PAT 2,511 3,159 1,654 2,202 -34.2% -30.3%
Net margin 4.5% 5.3% 3.0% 4.0% -143bps -130bps
Adjusted EPS (`) 7.6 9.5 5.0 6.7 -34.2% -30.3%
Core EPS (`) 6.5 8.5 4.4 6.0 -33.4% -28.7%
Our FY14E/15E PAT estimates have been revised downwards due to lower EBITDA and lower other income.
Working capital turnover (x) 3.6 3.6 3.8 3.8
Gross Block turnover (x) 12.0 11.8 11.7 11.0
CFO 2,758 4,360 829 2,346 -70.0% -46.2%
Our CFO estimates have decreased owing to lower EBIT and higher working capital requirements due to delays in the payment cycle.
Source: Company, Ambit Capital research
Ambit vs Consensus
Exhibit 28: Ambit vs consensus (` mn, unless specified)
Consensus Ambit Divergence Comments
Revenue (` mn)
FY14E 55,722 54,747 -1.7%
FY15E 60,097 55,360 -7.9%
Below consensus as we estimate revenues would decline by 6% YoY in FY14 and by 5% YoY in FY15 in the EMP business. We expect moderate revenue growth of 8% YoY in the UCP business.
EBITDA (` mn)
FY14E 2,785 2,184 -21.6%
FY15E 3,521 2,779 -21.1%
Our EBITDA estimates are below consensus estimates, as we estimate EBIT margins of 0% in FY14E and 1.8% in FY15 in the EMP business.
EPS (adjusted) (`)
FY14E 6.5 5.0 -23.0%
FY15E 8.1 6.7 -17.5%
Below consensus due to lower revenue growth and lower EBITDA margins especially in the EMP business.
Source: Company, Bloomberg, Ambit Capital research
Voltas
Ambit Capital Pvt Ltd 17
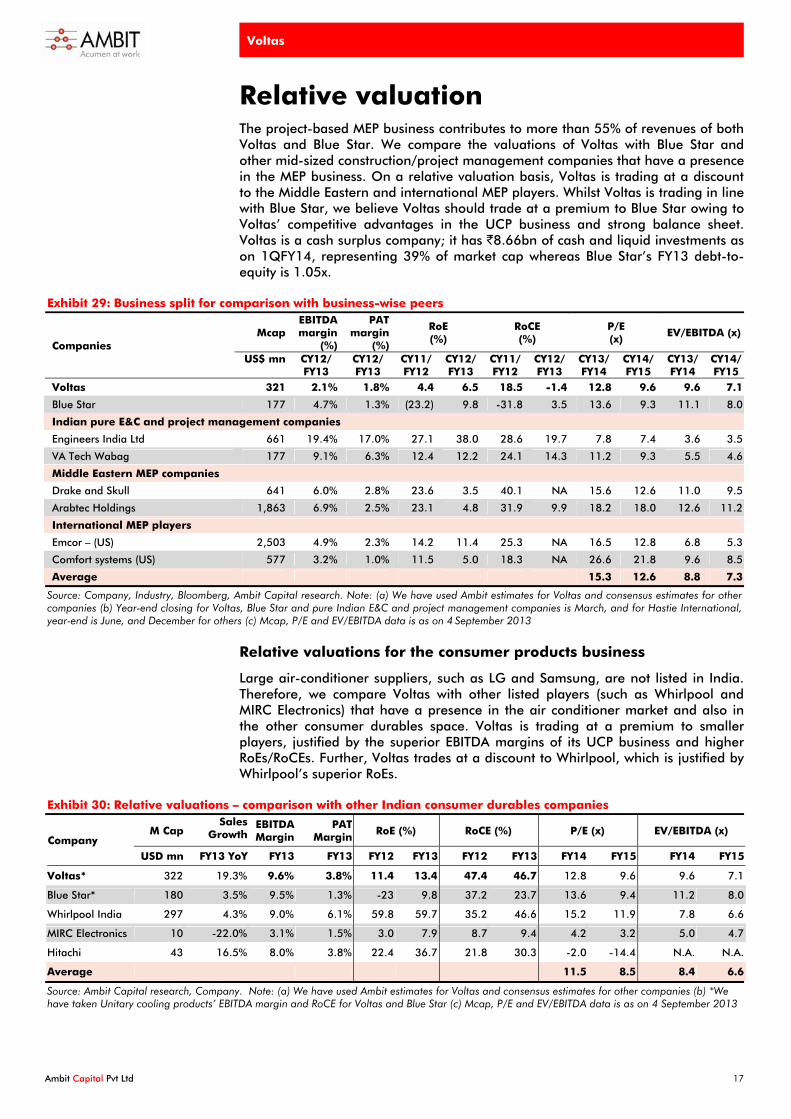
Relative valuation The project-based MEP business contributes to more than 55% of revenues of both Voltas and Blue Star. We compare the valuations of Voltas with Blue Star and other mid-sized construction/project management companies that have a presence in the MEP business. On a relative valuation basis, Voltas is trading at a discount to the Middle Eastern and international MEP players. Whilst Voltas is trading in line with Blue Star, we believe Voltas should trade at a premium to Blue Star owing to Voltas’ competitive advantages in the UCP business and strong balance sheet. Voltas is a cash surplus company; it has `8.66bn of cash and liquid investments as on 1QFY14, representing 39% of market cap whereas Blue Star’s FY13 debt-to-equity is 1.05x.
Exhibit 29: Business split for comparison with business-wise peers
Mcap EBITDA margin
(%)
PAT margin
(%)
RoE (%)
RoCE (%)
P/E (x)
EV/EBITDA (x) Companies
US$ mn CY12/ FY13
CY12/ FY13
CY11/ FY12
CY12/ FY13
CY11/ FY12
CY12/ FY13
CY13/FY14
CY14/FY15
CY13/FY14
CY14/FY15
Voltas 321 2.1% 1.8% 4.4 6.5 18.5 -1.4 12.8 9.6 9.6 7.1
Blue Star 177 4.7% 1.3% (23.2) 9.8 -31.8 3.5 13.6 9.3 11.1 8.0
Indian pure E&C and project management companies
Engineers India Ltd 661 19.4% 17.0% 27.1 38.0 28.6 19.7 7.8 7.4 3.6 3.5
VA Tech Wabag 177 9.1% 6.3% 12.4 12.2 24.1 14.3 11.2 9.3 5.5 4.6
Middle Eastern MEP companies
Drake and Skull 641 6.0% 2.8% 23.6 3.5 40.1 NA 15.6 12.6 11.0 9.5
Arabtec Holdings 1,863 6.9% 2.5% 23.1 4.8 31.9 9.9 18.2 18.0 12.6 11.2
International MEP players
Emcor – (US) 2,503 4.9% 2.3% 14.2 11.4 25.3 NA 16.5 12.8 6.8 5.3
Comfort systems (US) 577 3.2% 1.0% 11.5 5.0 18.3 NA 26.6 21.8 9.6 8.5
Average 15.3 12.6 8.8 7.3
Source: Company, Industry, Bloomberg, Ambit Capital research. Note: (a) We have used Ambit estimates for Voltas and consensus estimates for other companies (b) Year-end closing for Voltas, Blue Star and pure Indian E&C and project management companies is March, and for Hastie International, year-end is June, and December for others (c) Mcap, P/E and EV/EBITDA data is as on 4 September 2013
Relative valuations for the consumer products business
Large air-conditioner suppliers, such as LG and Samsung, are not listed in India. Therefore, we compare Voltas with other listed players (such as Whirlpool and MIRC Electronics) that have a presence in the air conditioner market and also in the other consumer durables space. Voltas is trading at a premium to smaller players, justified by the superior EBITDA margins of its UCP business and higher RoEs/RoCEs. Further, Voltas trades at a discount to Whirlpool, which is justified by Whirlpool’s superior RoEs.
Exhibit 30: Relative valuations – comparison with other Indian consumer durables companies
M Cap Sales
Growth EBITDA Margin
PAT Margin
RoE (%) RoCE (%) P/E (x) EV/EBITDA (x) Company
USD mn FY13 YoY FY13 FY13 FY12 FY13 FY12 FY13 FY14 FY15 FY14 FY15
Voltas* 322 19.3% 9.6% 3.8% 11.4 13.4 47.4 46.7 12.8 9.6 9.6 7.1
Blue Star* 180 3.5% 9.5% 1.3% -23 9.8 37.2 23.7 13.6 9.4 11.2 8.0
Whirlpool India 297 4.3% 9.0% 6.1% 59.8 59.7 35.2 46.6 15.2 11.9 7.8 6.6
MIRC Electronics 10 -22.0% 3.1% 1.5% 3.0 7.9 8.7 9.4 4.2 3.2 5.0 4.7
Hitachi 43 16.5% 8.0% 3.8% 22.4 36.7 21.8 30.3 -2.0 -14.4 N.A. N.A.
Average 11.5 8.5 8.4 6.6
Source: Ambit Capital research, Company. Note: (a) We have used Ambit estimates for Voltas and consensus estimates for other companies (b) *We have taken Unitary cooling products’ EBITDA margin and RoCE for Voltas and Blue Star (c) Mcap, P/E and EV/EBITDA data is as on 4 September 2013

Voltas
Ambit Capital Pvt Ltd 18
Voltas is trading at a discount to Blue Star on one-year forward EPS/EBITDA multiples
Voltas is trading at a 23% and 40% discount to Blue Star on one-year forward P/E and on one-year forward EV/EBITDA respectively. We agree that Blue Star is a step ahead of Voltas in working capital management in the EMP business. However, we argue that Voltas should at least trade in line with Blue Star, owing to Voltas’ superior balance sheet and strong competitive advantages in the UCP business.
Exhibit 31: Voltas trades at a 23% discount to Blue Star on one-year forward P/E (x) due to …
0
5
10
15
20
Dec
-11
Feb-
12
Apr
-12
Jun-
12
Aug
-12
Oct
-12
Dec
-12
Feb-
13
Apr
-13
Jun-
13
Aug
-13
Blue Star (x) Voltas (x)
Source: Bloomberg, Ambit Capital research
Exhibit 32: … marginally lower RoEs
-30%
-20%
-10%
0%
10%
20%
30%
40%
FY11 FY12 FY13 FY14E FY15E
Voltas RoE Blue Star RoE
Source: Company, Ambit Capital research
Exhibit 33: Voltas trades at a 40% discount to Blue Star on one-year forward EV/EBITDA (x)
0246
8101214
Dec
-11
Feb-
12
Apr
-12
Jun-
12
Aug
-12
Oct
-12
Dec
-12
Feb-
13
Apr
-13
Jun-
13
Aug
-13
Blue Star (x) Voltas (x)
Source: Company, Ambit Capital research
Exhibit 34: …owing to lower RoCEs
-10%
-5%
0%
5%
10%
15%
20%
25%
FY11 FY12 FY13 FY14E FY15E
Voltas RoCE Blue Star RoCE
Source: Company, Ambit Capital research
Exhibit 35: Voltas trades at a discount to Blue Star on one-year forward P/B
0.00.51.01.52.02.53.03.54.0
Dec
-11
Feb-
12
Apr
-12
Jun-
12
Aug
-12
Oct
-12
Dec
-12
Feb-
13
Apr
-13
Jun-
13
Aug
-13
Blue Star Voltas
Source: Company, Bloomberg, Ambit Capital research
Exhibit 36: Whirlpool trading at a premium to historical one-year average forward EV/EBITDA
6
8
10
12
Apr
-12
Jun-
12
Aug
-12
Oct
-12
Dec
-12
Feb-
13
Apr
-13
Jun-
13
Aug
-13
Whirlpool 1 year forward EV/EBITDA (x)
Whirlpool average 1 year forward EV/EBITDA (x)
Source: Company, Bloomberg, Ambit Capital research

Voltas
Ambit Capital Pvt Ltd 19
Key catalysts Improvement in EMP business’ EBIT margins: In our opinion, the key concern for investors is the lower EBIT margins in the EMP business, especially in the Middle East due to cost overruns from execution delays. Hence, market appears to be assigning nil value to Voltas’ EMP business. Thus, a material improvement in margins of the EMP business in India or the Middle East could be a key catalyst for Voltas.
Strong room AC volume growth in 2HFY14 could positively surprise the market: In FY11-13, room AC prices were increased by 7-10% YoY to compensate for higher costs which led to a decline in volume growth in FY12/13. Room AC players are likely to increase prices by 6-12% due to INR depreciation and energy label changes. Hence, most of the room AC players have suggested that volume growth will be sluggish in 2HFY14. Thus, positive volume growth in room ACs in FY14 could drive share prices higher.
Key risks to our BUY stance Continued cost overruns due to execution delays in EMP projects: Voltas is facing several hurdles and delays in closing EMP projects particularly in the Middle East. We estimate margins will recover from FY16E owing to improvement in construction capital expenditure. However, growth and margins would continue to be suppressed if the construction capex recovery were to be further delayed than FY16E.
Lower-than-expected room AC volume growth due to increase in prices: Voltas imports 55-60% of total gross cost for room ACs from China. Thus, Voltas would have to increase room AC prices to pass through higher costs from INR depreciation and potential increase in tariff on imports of non-essential consumer durables. We believe that in a price-sensitive market like India, higher prices could lead to lower-than-expected demand. If Voltas does not increase prices to compensate for INR depreciation then its margins would reduce substantially.
Exhibit 37: Explanation for the flags on the cover page
Field Score Comments
Accounting GREEN
In our accounting analysis of BSE500 companies, we have classified Voltas as an ’engineering and construction (E&C) company‘. Voltas ranks second in our accounting analysis of E&C companies on account of a higher rank in CFO/EBITDA, gross block/gross turnover and capital WIP-gross block.
Predictability AMBER Whilst the company has communicated clearly to clients about the challenging environment especially in the EMP business, cost overruns in the Middle East have increased the volatility in its earnings.
Earnings momentum RED Over the last six months, consensus EPS estimates for FY14 and FY15 have been revised downward by 20-25%.
Source: Company, Ambit Capital research

Voltas
Ambit Capital Pvt Ltd 20
Profit and loss (consolidated)
Y/E March (`` mn) FY12 FY13 FY14E FY15E FY16E
Revenue 51,857 55,310 54,747 55,360 61,947
% growth -0.1% 6.7% -1.0% 1.1% 11.9%
Total expenses 48,493 52,857 52,563 52,581 58,451
Adjusted EBITDA 598 1,497 2,184 2,779 3,496
Adjusted EBITDA margin (%) 1.2% 2.7% 4.0% 5.0% 5.6%
Net depreciation 340 278 251 275 313
Adjusted EBIT 259 1,219 1,933 2,504 3,183
Net interest 253 318 340 171 79
Other income 924 822 715 741 830
Adjusted PBT 930 1,722 2,308 3,074 3,934
Adjusted PAT 627 995 1,662 2,213 2,832
Provision for taxation 571 728 646 861 1,102
Minority Interest 1 (7) 8 11 14
Adj. Consolidated PAT 626 1,002 1,654 2,202 2,818
Adj. consol PAT margin 1.2% 1.8% 3.0% 4.0% 4.5%
Core PAT 384 1,012 1,432 1,984 2,591
Core EPS (`) 1.2 3.0 4.4 6.0 7.9
Source: Company, Ambit Capital research
Balance sheet (consolidated)
Y/E March (`Rs mn) FY12 FY13 FY14E FY15E FY16E
Share capital 331 331 331 331 331
Reserves and surplus 14,448 15,925 16,708 17,942 19,599
Total Net worth 14,778 16,256 17,039 18,273 19,930
Minority Interest 170 118 126 137 152
Loans 2,252 2,612 2,112 1,112 612
Sources of funds 17,219 19,009 19,300 19,546 20,717
Gross Block 4,198 4,505 4,852 5,195 5,576
Net block 2,004 2,110 2,206 2,274 2,342
Capital work-in-progress 46 0 0 0 0
Goodwill on consolidation 890 888 888 888 888
Investments 3,116 4,073 4,573 4,573 4,573
Cash and bank balances 2,710 3,498 2,280 2,470 3,264
Sundry debtors 11,668 13,618 13,799 13,650 15,105
Inventories 8,334 9,784 9,505 9,508 10,409
Loans and advances 3,246 3,159 3,000 3,033 3,225
Total Current Assets 35,268 38,350 36,789 37,003 41,337
Current Liabilities 21,575 23,865 22,358 22,297 25,335
Provisions 2,790 2,792 3,043 3,140 3,334
Current liabilities and provisions 24,365 26,657 25,402 25,438 28,669
Net current assets 10,903 11,693 11,388 11,566 12,668
Application of funds 17,219 19,009 19,300 19,546 20,717
Source: Company, Ambit Capital research

Voltas
Ambit Capital Pvt Ltd 21
Cash flow statement (consolidated)
Y/E March (`` mn) FY12 FY13 FY14E FY15E FY16E
EBIT 3,025 2,174 1,933 2,504 3,183
Depreciation 340 278 251 275 313
Others (1,572) (1,411) (297) (260) (257)
Direct taxes paid (1,199) (870) (646) (861) (1,102)
Change in WC (2,137) (245) (1,165) (85) (502)
CFO (2,063) 949 829 2,346 2,494
Purchase of fixed assets (300) (438) (347) (343) (382)
Interest received 57 77 38 31 29
Others 990 981 (241) 229 229
CFI 747 620 (550) (83) (124)
Net borrowings 871 373 (500) (1,000) (500)
Interest paid (317) (393) (378) (202) (108)
Dividends paid (848) (654) (619) (871) (968)
CFF (270) (674) (1,497) (2,073) (1,576)
Net cash inflow/ (outflow)
(1,587) 895 (1,219) 190 794
Cash at the end 3,303 3,402 2,280 2,470 3,264
Free cash flow (1,832) 1,023 482 2,003 2,112
Source: Company, Ambit Capital research
Key ratios
Y/E March FY12 FY13 FY14E FY15E FY16E
EBITDA Margin (%) 6.5% 4.4% 4.0% 5.0% 5.6%
EBIT Margin (%) 5.8% 3.9% 3.5% 4.5% 5.1%
Net margin 1.2% 1.8% 3.0% 4.0% 4.5%
Debt:Equity 0.2 0.2 0.1 0.1 0.0
Net debt/Equity (0.0) (0.1) (0.0) (0.1) (0.1)
Working capital turnover (x)
4.0 3.9 3.8 3.8 4.0
Gross block turnover (x) 12.5 12.7 11.7 11.0 11.5
ROCE 15.0% 10.4% 8.4% 10.2% 12.0%
ROIC 17.7% 11.5% 9.8% 12.9% 16.3%
ROE 4.4% 6.5% 9.9% 12.5% 14.8%
Source: Company, Ambit Capital research
Valuation parameters
Y/E March FY12 FY13 FY14E FY15E FY16E
Adjusted EPS basic (`) 1.9 3.0 5.0 6.7 8.5
Core EPS basic (Rs) 1.16 3.04 4.35 6.03 7.87
DPS (`) 1.6 1.6 2.3 2.5 3.0
P/E 33.8 21.1 12.8 9.6 7.5
P/B 1.4 1.3 1.2 1.2 1.1
EV/EBITDA 6.2 8.3 9.6 7.1 5.3
Source: Company, Ambit Capital research

Voltas
Ambit Capital Pvt Ltd 22
Institutional Equities Team
Saurabh Mukherjea, CFA CEO, Institutional Equities (022) 30433174 [email protected]
Research
Analysts Industry Sectors Desk-Phone E-mail
Aadesh Mehta Banking / NBFCs (022) 30433239 [email protected]
Achint Bhagat Cement / Infrastructure (022) 30433178 [email protected]
Ankur Rudra, CFA Technology / Telecom / Media (022) 30433211 [email protected]
Ashvin Shetty Automobile (022) 30433285 [email protected]
Bhargav Buddhadev Power / Capital Goods (022) 30433252 [email protected]
Dayanand Mittal Oil & Gas (022) 30433202 [email protected]
Gaurav Mehta Strategy / Derivatives Research (022) 30433255 [email protected]
Karan Khanna Strategy (022) 30433251 [email protected]
Krishnan ASV Banking (022) 30433205 [email protected]
Nitin Bhasin E&C / Infrastructure / Cement (022) 30433241 [email protected]
Nitin Jain Technology (022) 30433291 [email protected]
Pankaj Agarwal, CFA NBFCs (022) 30433206 [email protected]
Pratik Singhania Real Estate / Retail (022) 30433264 [email protected]
Parita Ashar Metals & Mining (022) 30433223 [email protected]
Rakshit Ranjan, CFA Consumer / Real Estate (022) 30433201 [email protected]
Ravi Singh Banking / NBFCs (022) 30433181 [email protected]
Ritika Mankar Mukherjee Economy / Strategy (022) 30433175 [email protected]
Ritu Modi Healthcare (022) 30433292 [email protected]
Shariq Merchant Consumer (022) 30433246 [email protected]
Tanuj Mukhija E&C / Infrastructure (022) 30433203 [email protected]
Utsav Mehta Telecom / Media (022) 30433209 [email protected]
Sales
Name Regions Desk-Phone E-mail
Deepak Sawhney India / Asia (022) 30433295 [email protected]
Dharmen Shah India / Asia (022) 30433289 [email protected]
Dipti Mehta India / USA (022) 30433053 [email protected]
Nityam Shah, CFA USA / Europe (022) 30433259 [email protected]
Parees Purohit, CFA USA (022) 30433169 [email protected]
Praveena Pattabiraman India / Asia (022) 30433268 [email protected]
Sarojini Ramachandran UK +44 (0) 20 7614 8374 [email protected]
Production
Sajid Merchant Production (022) 30433247 [email protected]
Joel Pereira Editor (022) 30433284 [email protected]
E&C = Engineering & Construction

Voltas
Ambit Capital Pvt Ltd 23
Explanation of Investment Rating
Investment Rating Expected return
(over 12-month period from date of initial rating)
Buy >5%
Sell <5%
Disclaimer This report or any portion hereof may not be reprinted, sold or redistributed without the written consent of Ambit Capital. AMBIT Capital Research is disseminated and available primarily electronically, and, in some cases, in printed form.
Additional information on recommended securities is available on request.
Disclaimer 1. AMBIT Capital Private Limited (“AMBIT Capital”) and its affiliates are a full service, integrated investment banking, investment advisory and brokerage group. AMBIT
Capital is a Stock Broker, Portfolio Manager and Depository Participant registered with Securities and Exchange Board of India Limited (SEBI) and is regulated by SEBI 2. The recommendations, opinions and views contained in this Research Report reflect the views of the research analyst named on the Research Report and are based upon
publicly available information and rates of taxation at the time of publication, which are subject to change from time to time without any prior notice. 3. AMBIT Capital makes best endeavours to ensure that the research analyst(s) use current, reliable, comprehensive information and obtain such information from sources
which the analyst(s) believes to be reliable. However, such information has not been independently verified by AMBIT Capital and/or the analyst(s) and no representation or warranty, express or implied, is made as to the accuracy or completeness of any information obtained from third parties. The information or opinions are provided as at the date of this Research Report and are subject to change without notice.
4. If you are dissatisfied with the contents of this complimentary Research Report or with the terms of this Disclaimer, your sole and exclusive remedy is to stop using this Research Report and AMBIT Capital shall not be responsible and/ or liable in any manner.
5. If this Research Report is received by any client of AMBIT Capital or its affiliate, the relationship of AMBIT Capital/its affiliate with such client will continue to be governed by the terms and conditions in place between AMBIT Capital/ such affiliate and the client.
6. This Research Report is issued for information only and should not be construed as an investment advice to any recipient to acquire, subscribe, purchase, sell, dispose of, retain any securities. Recipients should consider this Research Report as only a single factor in making any investment decisions. This Research Report is not an offer to sell or the solicitation of an offer to purchase or subscribe for any investment or as an official endorsement of any investment.
7. If 'Buy', 'Sell', or 'Hold' recommendation is made in this Research Report such recommendation or view or opinion expressed on investments in this Research Report is not intended to constitute investment advice and should not be intended or treated as a substitute for necessary review or validation or any professional advice. The views expressed in this Research Report are those of the research analyst which are subject to change and do not represent to be an authority on the subject. AMBIT Capital may or may not subscribe to any and/ or all the views expressed herein.
8. AMBIT Capital makes no guarantee, representation or warranty, express or implied; and accepts no responsibility or liability as to the accuracy or completeness or currentess of the information in this Research Report. AMBIT Capital or its affiliates do not accept any liability whatsoever for any direct or consequential loss howsoever arising, directly or indirectly, from any use of this Research Report.
9. Past performance is not necessarily a guide to evaluate future performance. 10. AMBIT Capital and/or its affiliates (as principal or on behalf of its/their clients) and their respective officers directors and employees may hold positions in any securities
mentioned in this Research Report (or in any related investment) and may from time to time add to or dispose of any such securities (or investment). Such positions in securities may be contrary to or inconsistent with this Research Report.
11. This Research Report should be read and relied upon at the sole discretion and risk of the recipient. 12. The value of any investment made at your discretion based on this Research Report or income therefrom may be affected by changes in economic, financial and/ or
political factors and may go down as well as up and you may not get back the full or the expected amount invested. Some securities and/ or investments involve substantial risk and are not suitable for all investors.
13. This Research Report is being supplied to you solely for your information and may not be reproduced, redistributed or passed on, directly or indirectly, to any other person or published, copied in whole or in part, for any purpose. Neither this Research Report nor any copy of it may be taken or transmitted or distributed, directly or indirectly within India or into any other country including United States (to US Persons), Canada or Japan or to any resident thereof. The distribution of this Research Report in other jurisdictions may be strictly restricted and/ or prohibited by law or contract, and persons into whose possession this Research Report comes should inform themselves about such restriction and/ or prohibition, and observe any such restrictions and/ or prohibition.
14. Neither AMBIT Capital nor its affiliates or their respective directors, employees, agents or representatives, shall be responsible or liable in any manner, directly or indirectly, for views or opinions expressed in this Report or the contents or any errors or discrepancies herein or for any decisions or actions taken in reliance on the Report or inability to use or access our service or this Research Report or for any loss or damages whether direct or indirect, incidental, special or consequential including without limitation loss of revenue or profits that may arise from or in connection with the use of or reliance on this Research Report or inability to use or access our service or this Research Report.
Conflict of Interests 15. In the normal course of AMBIT Capital’s business circumstances may arise that could result in the interests of AMBIT Capital conflicting with the interests of clients or one
client’s interests conflicting with the interest of another client. AMBIT Capital makes best efforts to ensure that conflicts are identified and managed and that clients’ interests are protected. AMBIT Capital has policies and procedures in place to control the flow and use of non-public, price sensitive information and employees’ personal account trading. Where appropriate and reasonably achievable, AMBIT Capital segregates the activities of staff working in areas where conflicts of interest may arise. However, clients/potential clients of AMBIT Capital should be aware of these possible conflicts of interests and should make informed decisions in relation to AMBIT Capital’s services.
16. AMBIT Capital and/or its affiliates may from time to time have investment banking, investment advisory and other business relationships with companies covered in this Research Report and may receive compensation for the same. Research analysts provide important inputs into AMBIT Capital’s investment banking and other business selection processes.
17. AMBIT Capital and/or its affiliates may seek investment banking or other businesses from the companies covered in this Research Report and research analysts involved in preparing this Research Report may participate in the solicitation of such business.
18. In addition to the foregoing, the companies covered in this Research Report may be clients of AMBIT Capital where AMBIT Capital may be required, inter alia, to prepare and publish research reports covering such companies and AMBIT Capital may receive compensation from such companies in relation to such services. However, the views reflected in this Research Report are objective views, independent of AMBIT Capital’s relationship with such company.
19. In addition, AMBIT Capital may also act as a market maker or risk arbitrator or liquidity provider or may have assumed an underwriting commitment in the securities of companies covered in this Research Report (or in related investments) and may also be represented in the supervisory board or on any other committee of those companies.
Additional Disclaimer for U.S. Persons 20. The research report is solely a product of AMBIT Capital 21. AMBIT Capital is the employer of the research analyst(s) who has prepared the research report 22. Any subsequent transactions in securities discussed in the research reports should be effected through J.P.P. Euro-Securities, Inc. (“JPP”). 23. JPP does not accept or receive any compensation of any kind for the dissemination of the AMBIT Capital research reports. 24. The research analyst(s) preparing the research report is resident outside the United States and is/are not associated persons of any U.S. regulated broker-dealer and that
therefore the analyst(s) is/are not subject to supervision by a U.S. broker-dealer, and is/are not required to satisfy the regulatory licensing requirements of FINRA or required to otherwise comply with U.S. rules or regulations regarding, among other things, communications with a subject company, public appearances and trading securities held by a research analyst account.
© Copyright 2013 AMBIT Capital Private Limited. All rights reserved.
Ambit Capital Pvt. Ltd. Ambit House, 3rd Floor 449, Senapati Bapat Marg, Lower Parel, Mumbai 400 013, India. Phone: +91-22-3043 3000 Fax: +91-22-3043 3100