engaging visitors in innovative ways: process, data and participation
TRANSCRIPT

Engaging Visitors in Innovative Ways: Process, Data and Participation (#PDP)
Silvia Filippini-Fantoni@silviaff20@imamuseumDirector of Interpretation, Media, and Evaluation


The Collection

User-centred Approach
Visitor-Centered Approach

Process:•New exhibition development
process
Data: •Research and evaluation
Participation:•Participatory in-gallery
experiences• Innovative programming
Visitor-oriented approach: #PDP

Process: New Exhibition Development Model

• Interdisciplinary core team is created at the start: curator, an interpretation specialist, an evaluator, a designer, and an exhibition manager
• Big idea: identification of the main thesis and learning outcomes to inform checklist, layout, interpretive plan, content, title, etc.

Before

After

HIGHER VISITORS’ SATISFACTION BETTER COMMUNICATION OF KEY MESSAGES
BETTER INTEGRATION OF INTERPRETIVE TOOLS
40-60% 60% 30-50% 30-50%

Data: Collecting Visitors’ Feedback

Methods

n=576
21% 21%
27%
31%
0%
5%
10%
15%
20%
25%
30%
35%
Art DecoAutomobiles
Duesenbergs AutomobileMasterpieces
Concept Cars
Front-End: Automobile Design

Visitors’ interests:
• Artist’s life (30/40)
• Inspiration (30/40)
• Process/technique (26/40)
• Artist’s or other’s explanation about the meaning behind the work (7/40)
Formative: Robert Indiana

Design Thinking Workshop

Prototype Testing


Visual Identity Testing
Option 1 Option 2
Option 3

Summative: Exhibition Evaluations
•Have learning outcomes been met?
•Are visitors satisfied with their experience?
•How do they engage with the art and interpretive tools?
•What problems do visitors encounter?
•Who visited the exhibition (demographics & psychographics)?

Participation: In Gallery & Programming

Inspired by Matisse


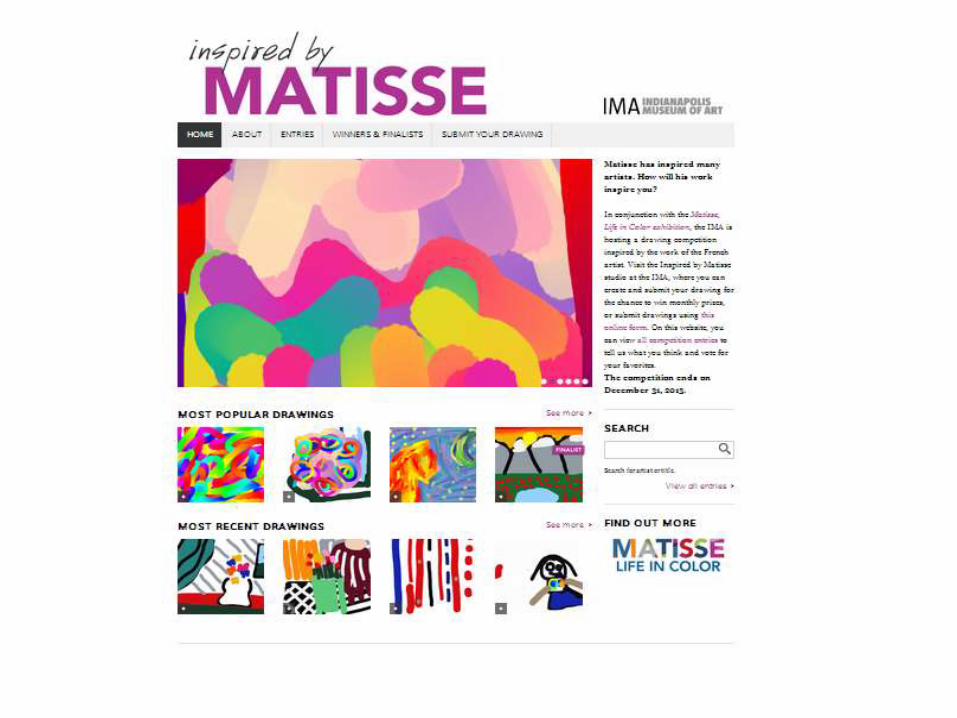


• 3,922: # of drawings submitted
• 30,709: online visits
•3% of drawings with comments
•1,457 votes: Most popular drawing
•Visitors responded to patterns, colors, shape and compositions seen in exhibition
Key Results

• 2,655 drawings left behind
• 23% of exhibition visitors made a drawing
• 77% inspired by the display
• 11% inspired by exhibition
• 75% of visitors looked at the drawings
Draw a Still Life

Create Your Autoportrait


• 3,706: # of autoportraitsmade
• 40% of exhibition visitors created an autoportrait
• 51% of exhibition visitors looked at other visitors’ autoportraits
•Reinforced the understand that words, numbers, forms, and colors symbolize specific events in Indiana’s life
Key Results

Pontillize Yourself

• 71% of exhibition visitors were with other people
• 59% of exhibition visitors 45+ used the app
• 61% of exhibition visitors used the app
• 400+ positive comments“fun”, “engaging”,“easy”
Key Results

Scott Stulen @middlewest@imamuseumCurator of Audience Experiences and Performance
Innovative Programming

Stuart Hyatt: E is for Equinox

Monster Drawing Rally

B-movie Bingo

• Increasing # of facilitators(who visit to engage in a social experience)
• Increased exhibition attendance (44,000 in 2013 vs. 81,000 in 2014)
• Increased # of members
•Change of perception: visitors have responded positively to the museum willingness to engage people in different ways.
