enetic mechanisms underlying tomato … · genetic mechanisms underlying tomato quality ......
TRANSCRIPT

UNIVERSITÀ DEGLI STUDI DI NAPOLI FEDERICO IIDOTTORATO DI RICERCA IN AGROBIOLOGIA E AGROCHIMICA – XXI CICLO
INDIRIZZO MIGLIORAMENTO GENETICO E ORTICOLTURA
GENETIC MECHANISMS UNDERLYINGTOMATO QUALITY TRAITS
CANDIDATADOTT.SSA ADRIANA SACCO
RELATORE COORDINATORECHIAR.MO PROF. LUIGI FRUSCIANTE CHIAR.MO PROF. MATTEO LORITO
CORRELATOREDOTT. ANTONIO DI MATTEO

i
INDEX
pag.1. INTRODUCTION
1.1 The Tomato 1
1.2 The Tomato quality 3
1.2.1 Apocarotenoid volatiles 4
1.2.2 Total soluble solids 5
1.2.3 Fruit firmness 7
1.2.4 L-Ascorbic acid 8
1.2.5 Phenolic compounds 9
1.3 Tomato breeding 11
1.4 Biotechnological approaches to tomato breeding 12
for quality traits
1.5 Tomato introgression lines and quantitative traits loci 14
1.6 Aim of the study 15
2. MATERIALS AND METHODS
2.1 Plant material and fruit sampling 17
2.2 Phenotypic measurements 19
2.3 Statistical analysis of phenotypic data 21
2.4 Gene expression analysis 22
2.4.1 RNA isolation 22
2.4.2 Synthesis antisense RNA 24
2.5 Chip design 26
2.6 Hybridization and imaging 26
2.7 Data extraction, normalization and filtring 28
2.8 Statistical analysis and bioinformatics procedures 30
2.9 E. coli transformation 30
2.10 Volatile analysis from E. coli cultures 31
2.11 Protein blot analysis 32

ii
3. RESULTS
3.1 QTL analysis in tomato S. pennellii IL population 34
3.1.1 Total soluble solids 34
3.1.2 Fruit firmness 36
3.1.3 Ascorbic acid and total ascorbic acid content 38
3.1.4 Phenolic content 43
3.2 Microarray analysis of gene expression in fruit 45
of Introgression Line (IL) 12-4
3.3 AtCCD7 and AtCCD8 apocarotenoid volatile products 56
4. DISCUSSION
4.1 QTLs for tomato fruit quality 58
4.2 Comparative transcriptomic analysis 66
4.3 AtCCD7 and AtCCD8 cleave multiple carotenoids 73
to generate apocarotenoid volatiles
5. CONCLUSION 76
6. REFERENCES 79

Introduction
1
1. Introduction
1.1 The tomato
Tomato (Solanum lycopersicum) belongs to the nightshade family Solanaceae.
The extremely diverse and large Solanaceae family is believed to consist of 96
genera and over 2800 species distributed in three subfamilies, Solanoideae (to
which Solanum belongs), Cestroideae, and Solanineae (Knapp et al., 2004).
Solanaceae is one of the most economically important families of angiosperms
and contains many of the commonly cultivated plants, including potato, tomato,
pepper, eggplant, petunia, and tobacco. This family is the most variable of all
crop species in terms of agricultural utility, the 3rd economically most important
crop family, exceeded only by grasses and legumes, and the most valuable in
terms of vegetable crops (van der Hoeven et al., 2002). The cultivated tomato,
Solanum lycopersicum Mill., a fruit that is often treated as a vegetable, is widely
grown around the world and constitutes a major agricultural industry.
Worldwide, it is the second most consumed vegetable after potato (FAOSTAT
2005; http://faostat.fao.org) and unquestionably the most popular garden crop.
In addition to tomatoes that are eaten directly as raw vegetable or added to
other food items, a variety of processed products such as paste, whole peeled
tomatoes, diced products, and various forms of juice, sauces, and soups have
gained significant acceptance. There are more varieties of tomato sold
worldwide than any other vegetable. Although a tropical plant, as already
mentioned, tomato is grown in almost every corner of the world from the tropics
to within a few degrees of the Arctic Circle. It is grown in greenhouses where
outdoor production is restricted due to cool temperatures. Major tomato
producing countries in descending orders include China, USA, India, Turkey,
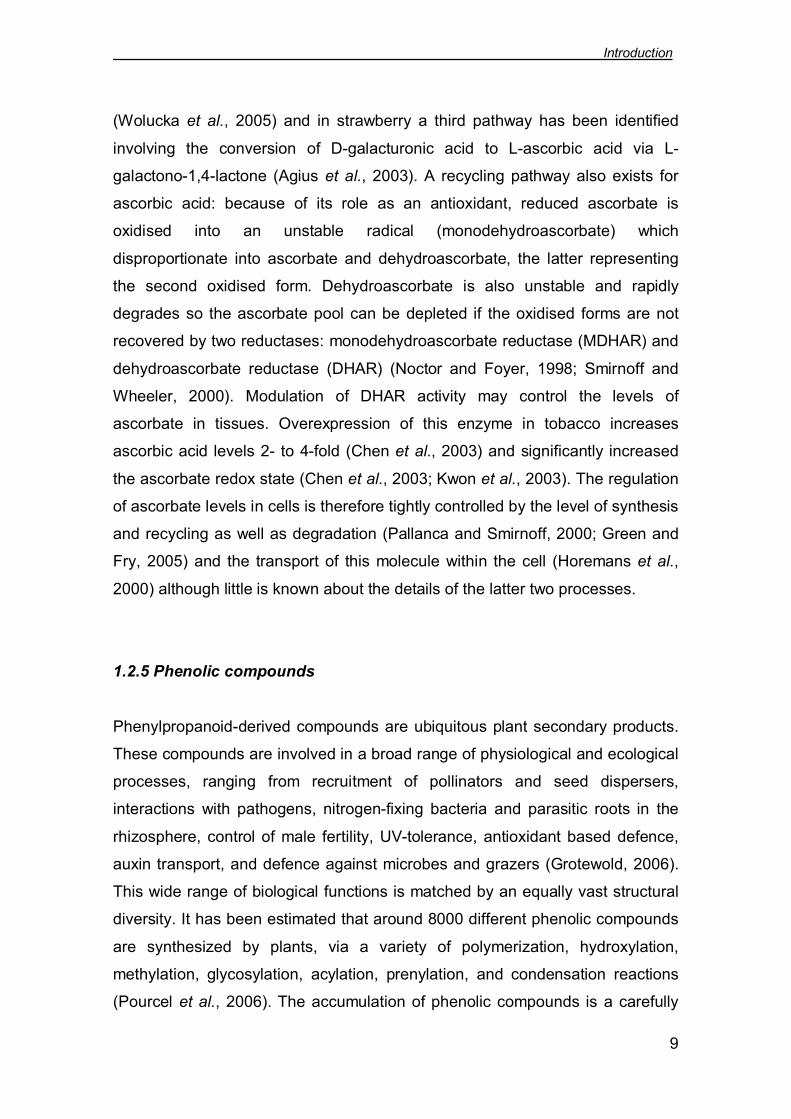
Egypt, and Italy (Fig. 1.1).

Introduction
2
1. China : 31.644.040
2. USA : 11.043.300
3. Turkey : 9.700.000
4. India : 7.600.000
5. Egypt : 7.600.000
6. Italy : 7.187.000
Other leading countries include Spain, Brazil, Iran, Mexico, Greece, and Russia
(http://faostat.fao.org). Tomatoes are the most highly consumed vegetables in
Italy, with the highest average consumption among European countries
(NETTOX, 1998). A study on the Italian food consumption patterns, reported
that the consumption of tomatoes (both ripe and for salad) is estimated in 75.5
g/day/capita (Turrini et al., 2001). Most the production (62,9%) is concentrated
in Southern Italy, the 29,2% in the North and only the 7,9% in the central part of
Italy. Actually tomatoes are one of the main component of the traditional
Mediterranean diet, which has been associated with health protection and
longevity.
In addition to the cultivated species S. lycopersicum and its wild form S.
lycopersicum var. cerasiforme (Dun.) Gray (wild cherry), there are eight related
wild species, including S. pimpinellifolium (Jusl.) Mill. (currant tomato), S.
cheesmanii Riley, S. chmielewskii Rick, Kes., Fob. and Holle, S. chilense Dun.,
S. neorickii Rick, Kes., Fob. and Holle, L. peruvianum(L.)Mill., S. habrochaites
Humb. and Bonpl., and S. pennellii (Corr.)D’Arcy (Rick, 1976). All tomato
species are diploid (2n = 2x = 24) and are similar in chromosome number and
structure. Fruit colour varies depending on the species, from red to yellow to
green. The cultivated tomato has limited variability, largely because of several
population bottlenecks in the forms of founder events and natural and artificial
selections that occurred during domestication and evolution of modern cultivars.
Compared with the rich reservoir in wild species, the cultivated tomato is
42%
15%
13%
10%
10%
10%
World Tomato Production
42%
15%
13%
10%
10%
10%
World Tomato Production
Figure 1.1 World tomato production. Major tomato producing countries in the world(http://faostat.fao.org).

Introduction
3
genetically poor. It is estimated that the genomes of tomato cultivars contain 5%
of the genetic variation of their wild relatives (Miller and Tanksley, 1990). The
lack of diversity in the cultivated tomato can be visualized using DNA
technologies. Very few polymorphisms within the cultivated tomato genepool
have been identified, even using sensitive molecular markers (Van der Beek et
al., 1992; Villand et al., 1998; Park et al., 2004; Garcia-Martinez et al., 2005;
Tam et al., 2005).
1.2 The tomato quality
The improvement of crop species has been a fundamental human pursuit since
cultivation began. Tomato is a major economic important crop, displaying
several characteristics which have established it as a model system for
dissection of genetic determinants of quantitative trait loci (QTL). In tomato
numerous wild-related species have been demonstrated to be untapped
sources of valuable genetic variability, including pathogen-resistance genes,
and nutritional and industrial quality traits. Actually, crop improvement strategies
are focused not only on the traditional areas of yield enhancement and disease
resistance but, driven by recent medical research, also on fruit compositional
quality for human health. In particular, during the past century most research
were focused on the enhancement of antioxidant compounds, given that
antioxidants present in fruit and vegetables may help prevent chronic diseases
such as cancer, arthritis and heart disease (Fernie et al., 2006; Harrigan et al.,
2007a). Genetic determinants of nutritional quality have long been studied.
However, it is only recently that these studies have largely focused on single, or
at most, a handful of metabolites, such as carotenoid content in tomato (Liu et
al., 2003a), protein content in maize (Zea mays) (Moose et al., 2004), starch
content in potato (Solanum tuberosum) and rice (Oryza sativa) (Fernie and
Willmitzer, 2004), and tocopherol levels in Arabidopsis (Gilliland et al., 2006).
Today, fruit quality is a major focus of most tomato breeding programs. In
particular, major fruit quality traits of interest to both fresh market and
processing tomato industries include fruit size, shape, total solids, colour,

Introduction
4
firmness, nutritional quality and flavor. Other important fruit quality
characteristics of tomato include pH, titratable acidity, and vitamin contents
(Foolad, 2007). Tomato fruit is an important source of lipid-soluble antioxidants
in the human diet because of their relatively high content of carotenoids.
Lycopene presence in plasma has been related to a reduction in the risk of
prostate cancer (Giovannucci et al., 1995). Other carotenoids present in ripe
tomato fruits include b-carotene and small amounts of phytoene, phytofluene, d-
carotene, z-carotene, neorosporene, and lutein (Khachik et al., 2002). Tomato
fruit is also an important source of the water-soluble antioxidants, particularly
ascorbic acid (AsA) and phenols. Because tomatoes represent a major
contribution to dietary nutrition worldwide, there is a growing interest in the
potential of genetic improvement for tomato antioxidant levels either by
traditional breeding methods (Ronen et al., 1999, 2000; Zhang and Stommel
2000) or by transgene incorporation (Giuliano et al., 2000; Romer et al., 2000).
Improvement in tomato nutritional traits also offers the opportunity to determine
basic information about the regulation of antioxidants in fruit crops.
1.2.1 Apocarotenoid volatiles
Apocarotenoids are terpenoid compounds derived from the oxidative cleavage
of carotenoids. They are generated when double bonds in a carotenoid are
cleaved by molecular oxygen, forming an aldehyde or ketone in each product at
the cleavage site. Carotenoid can be cleaved at any of their conjugated double
bonds, resulting in a diverse set of apocarotenoids. This structural diversity is
the consequence of the large number of carotenoid precursors (more then 600)
and subsequent modifications such as oxidation, reduction, and conjugation
(Vogel et al., 2008). Apocarotenoids perform essential biological functions in
plants, animals and photosynthetic bacteria. Examples of biologically active
apocarotenoids include the phytohormone abscisic acid (ABA) and retinol
(vitamin A), an essential component of the visual cycle in animals.
Economically, apocarotenids are valued as colorants and spices. Examples are
bixin, an apocarotenoid used as a colorant in foods and cosmetics, and saffron,

Introduction
5
a spice extracted from the styles of crocus flowers (Winter-halter and Rouseff,
2002). In particular, in tomato fruit these compounds form a part of the fruit
flavour. In fact, tomato fruit flavour is the sum of the interaction between sugars,
acids, and multiple volatile compounds. While several hundred volatiles have
been identified in tomato, only about 15-20 actually impact our perception of the
fruit. Most of these important volatiles are derived from the oxidative cleavage of
carotenoids. These include: b-ionone, b-damascenone and 6-methyl-5-heptene-
2-one. Additional carotenoid-derived volatiles are geranylacetone and
pseudoionone. Despite their importance to flavour of tomato and many other
fruit and vegetables, less work has focused on the formation and the role of
apocarotenoids in plant, except ABA (Tieman et al., 2006). The first gene
encoding a carotenoid cleavege dioxygenase was isolated from the maize (Zea
mays) ABA-deficient viviparous mutant, vp 14. VP14 catalyzes the first step in
ABA biosynthesis, the cleavage of either of two 9-cis-epoxycarotenids,
violoxanthin or neoxanthin at the 11,12 double bond. Because of its preferred
substrate, VP14 is called a 9-cis-epoxycarotenid dioxygenase (NCED)
(Schwartz et al., 1997). In the A. thaliana genome, nine putative carotenoid
cleavage dioxygenases have been identified based on sequence homology to
VP14. Four of the Arabidopsis dioxygenases (NCED2, NCED3, NCED6 and
NCED9) have the same activity as VP14 and are designated NCEDs. NCED5
has high homology to VP14, though its activity has not been determined (Iuchi
et al., 2001; Tan et al., 2003). The remaining four proteins diverge from the
NCEDs and have been given the generic designation carotenoid cleavage
dioxygenases (CCDs). These include CCD1, CCD4, CCD7 and CCD8
(Auldridge et al., 2006). Even if, in the last years more works have focused on
the role of these enzymes and their substrates and final products, much more
should be done to manipulate the biosynthetic pathways to enhance the
production of a desirable volatile.
1.2.2 Total soluble solids
There are two main markets for tomato as a food crop, as a fresh fruit product

Introduction
6
and as a processed foodstuff (primarily tomato pastes and sauces) (Gould,
1992). Economic success in the latter market is dictated in part by a
combination of total fruit yield and fruit soluble solids content (°Brix). Ripe fruit
with high soluble solids require the removal of less water to produce tomato-
based food products of the appropriate consistency and taste. In addition, since
sugar is a major constituent of total soluble solids, such fruit are also likely to be
sweeter and therefore require the addition of less sugar during processing.
These processing savings can have a significant bearing on the profitability of
processed tomato products and, thus, from a commercial standpoint, there is
considerable interest in manipulating the soluble solids content of tomato
varieties (Baxter et al., 2005). The total solids of the cultivated tomato comprise
4–7.5% of its fresh weight, though this percentage can be much higher in some
wild species (Fridman et al., 2000). The total solids are composed of all fruit
components except water and volatiles. In the cultivated tomato, the soluble
(SS) and insoluble solids (ISS) account for about 75% and 25%, respectively, of
the total solids. Reducing sugars glucose and fructose are the major
components of the SS. Sucrose is also present but in very small quantities,
although some wild species of tomato, including S. chmielewskii and S.
habrochaites, have higher concentration of sucrose. The remaining soluble
solids are composed of organic acids, lipids, minerals, and pigments. The ISS
include proteins, cellulose, hemicellulose, pectins, and polysaccharides, which
determine fruit viscosity. Quality of tomato juice, catsup, sauce, soup, and paste
are influenced by viscosity of the product. Both SS and ISS are related to yield
of concentrated tomato products, and yield and quality of certain processed
products are determined by sugar contents of the fruit. For tomato products that
are sold on the basis of solids content, the higher the solids of the raw products
the greater the value of crop yields. For example, an increase in solids of just
1% represents ~20% increase in yield of certain processed products. High
sugar content also increases the overall taste and flavor of the fresh fruit. For
these reasons, increasing fruit solids content has been the focus of numerous
tomato breeding programs (Foolad, 2007).

Introduction
7
1.2.3 Fruit firmness
The fruit and vegetable market has become an international market. Consumers
demand well developed produce at the peak of ripeness and possess the
organoleptic characteristics expected for the species and variety. The
development and condition of the produce must be such as to enable them to
withstand transport and handling, and to arrive in satisfactory condition at their
destination. Texture is one of the critical components for the consumer’s
perception of tomato fruit quality (Causse et al., 2003; Serrano-Megias and
Lopez-Nicolas, 2006). Many traits are involved in fruit texture, mainly sensory
attributes such as flesh firmness, mealiness, meltiness, juiciness, and crispness
(Harker et al., 1997; Redgwell and Fischer, 2002; Szczesniak, 2002). Major
changes in texture occur during fruit ripening, mainly associated with softening
which considerably influences post-harvest performance, i.e. transportation,
storage, shelf life and pathogen resistance (Brummell and Harpster, 2001). So
far, particularly important is fruit firmness, an overall estimation of fruit
resistance to compression, to be more precise a combination of skin resistance
and flesh firmness (Grotte et al., 2001). A number of works have been
published on tomato fruit firmness measurements, and different instruments for
measuring firmness has been illustrated (Batu, 1998). Instrumental
measurements are generally used to evaluate firmness related to the
mechanical properties of fruit tissues. The most widely used measurement of
fruit texture is the Magness–Taylor firmness test, which assesses the maximum
force needed to compress the sample in a specific way (Abbott, 2004). This
system was mainly developed to evaluate commercial quality with respect to the
tactile assessment of fruit firmness by consumers at the time of purchase. Many
other types of destructive or non-destructive mechanical measurements exist,
including compression, puncture, tension, and vibration. Rheological
measurements inform about the mechanical properties of the fruit or of a
localized part of the fruit (peel, pericarp, etc.).

Introduction
8
1.2.4 L-ascorbic acid
Fresh fruit and vegetables are the principal source of ascorbic acid (AsA or
vitamin C) for humans, primates and a few other mammals and passerines who
are unable to synthesise this vitamin because of mutations in the enzyme
catalysing the final step of its biosynthesis, L-gulono-1,4-lactone
dehydrogenase. The vitamin C has numerous properties, including as an
antioxidant and an enzyme cofactor for example in collagen synthesis (Arrigoni
and De Tullio, 2002). Ascorbic acid is also an essential compound for plants,
having a primary role as an antioxidant preventing oxidative stress as well as
playing a role in plant development and hormone signalling (Pastori et al.,
2003), the activation of the cell cycle (Potters et al., 2002) and possibly cell wall
loosening during cell expansion or fruit ripening (Fry, 1998). Fruit ascorbic acid
content is also valuable from an agronomic point of view, as well as
documented evidence exists that the molecule can contribute to both biotic and
abiotic stress tolerance response, and also to post-harvest fruit quality (Stevens
et al., 2008). However, the mechanism of how AsA levels are regulated in plant
cells remains unknown. Plants contain variable amount of L-ascorbic acid that
may range from low micromolar to 0.3 molar concentration, depending on the
plant species, organ, tissue, cell, and the environmental conditions. The
variability of ascorbate content is related to specific functions of vitamin C in
plants and, probably, reflects the activity of different biosynthetic but also
catabolic pathways in a given plant cell or even cell compartment (Wolucka and
Van Montagu, 2007). In plants the major ascorbic acid biosynthesis pathway
involves activated forms of the sugars GDP-D-mannose, GDP-L-galactose and
L-galactose, before finally L-galactono-1,4-lactone is derived and converted to
L-ascorbic acid (Wheeler et al., 1998; Valpuesta and Botella, 2004; Wolucka et
al., 2005). The identification of low ascorbic acid (vtc) mutants in Arabidopsis
(Conklin et al., 2000) has helped to confirm the intermediates of the pathway
and the essential role of enzymes such as GDP-mannose pyrophosphorylase
(GMP; vtc1) (Conklin et al., 1999) and L-galactose-1-P phosphatase (vtc4)
(Conklin et al., 2006). An alternative pathway has been proposed that uses
GDP-gulose and L-gulose instead of the corresponding galactose sugars
Introduction
9
(Wolucka et al., 2005) and in strawberry a third pathway has been identified
involving the conversion of D-galacturonic acid to L-ascorbic acid via L-
galactono-1,4-lactone (Agius et al., 2003). A recycling pathway also exists for
ascorbic acid: because of its role as an antioxidant, reduced ascorbate is
oxidised into an unstable radical (monodehydroascorbate) which
disproportionate into ascorbate and dehydroascorbate, the latter representing
the second oxidised form. Dehydroascorbate is also unstable and rapidly
degrades so the ascorbate pool can be depleted if the oxidised forms are not
recovered by two reductases: monodehydroascorbate reductase (MDHAR) and
dehydroascorbate reductase (DHAR) (Noctor and Foyer, 1998; Smirnoff and
Wheeler, 2000). Modulation of DHAR activity may control the levels of
ascorbate in tissues. Overexpression of this enzyme in tobacco increases
ascorbic acid levels 2- to 4-fold (Chen et al., 2003) and significantly increased
the ascorbate redox state (Chen et al., 2003; Kwon et al., 2003). The regulation
of ascorbate levels in cells is therefore tightly controlled by the level of synthesis
and recycling as well as degradation (Pallanca and Smirnoff, 2000; Green and
Fry, 2005) and the transport of this molecule within the cell (Horemans et al.,
2000) although little is known about the details of the latter two processes.
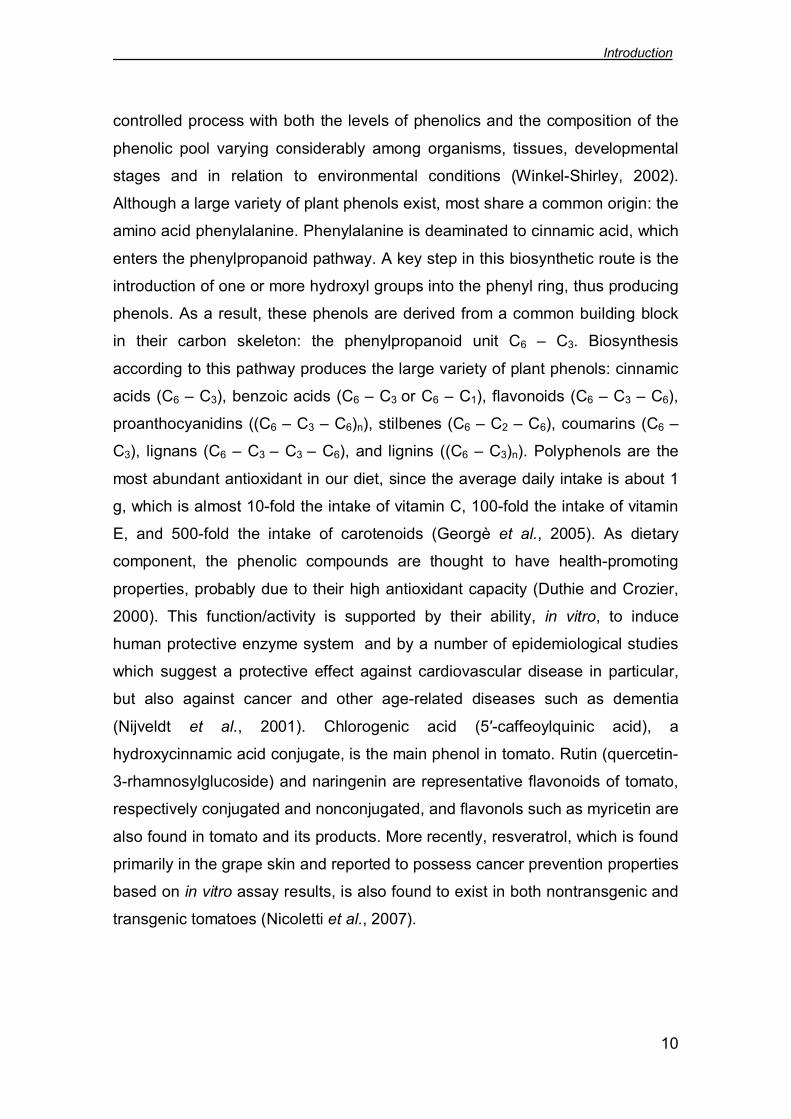
1.2.5 Phenolic compounds
Phenylpropanoid-derived compounds are ubiquitous plant secondary products.
These compounds are involved in a broad range of physiological and ecological
processes, ranging from recruitment of pollinators and seed dispersers,
interactions with pathogens, nitrogen-fixing bacteria and parasitic roots in the
rhizosphere, control of male fertility, UV-tolerance, antioxidant based defence,
auxin transport, and defence against microbes and grazers (Grotewold, 2006).
This wide range of biological functions is matched by an equally vast structural
diversity. It has been estimated that around 8000 different phenolic compounds
are synthesized by plants, via a variety of polymerization, hydroxylation,
methylation, glycosylation, acylation, prenylation, and condensation reactions
(Pourcel et al., 2006). The accumulation of phenolic compounds is a carefully
Introduction
10
controlled process with both the levels of phenolics and the composition of the
phenolic pool varying considerably among organisms, tissues, developmental
stages and in relation to environmental conditions (Winkel-Shirley, 2002).
Although a large variety of plant phenols exist, most share a common origin: the
amino acid phenylalanine. Phenylalanine is deaminated to cinnamic acid, which
enters the phenylpropanoid pathway. A key step in this biosynthetic route is the
introduction of one or more hydroxyl groups into the phenyl ring, thus producing
phenols. As a result, these phenols are derived from a common building block
in their carbon skeleton: the phenylpropanoid unit C6 – C3. Biosynthesis
according to this pathway produces the large variety of plant phenols: cinnamic
acids (C6 – C3), benzoic acids (C6 – C3 or C6 – C1), flavonoids (C6 – C3 – C6),
proanthocyanidins ((C6 – C3 – C6)n), stilbenes (C6 – C2 – C6), coumarins (C6 –
C3), lignans (C6 – C3 – C3 – C6), and lignins ((C6 – C3)n). Polyphenols are the
most abundant antioxidant in our diet, since the average daily intake is about 1
g, which is almost 10-fold the intake of vitamin C, 100-fold the intake of vitamin
E, and 500-fold the intake of carotenoids (Georgè et al., 2005). As dietary
component, the phenolic compounds are thought to have health-promoting
properties, probably due to their high antioxidant capacity (Duthie and Crozier,
2000). This function/activity is supported by their ability, in vitro, to induce
human protective enzyme system and by a number of epidemiological studies
which suggest a protective effect against cardiovascular disease in particular,
but also against cancer and other age-related diseases such as dementia
(Nijveldt et al., 2001). Chlorogenic acid (5′-caffeoylquinic acid), a
hydroxycinnamic acid conjugate, is the main phenol in tomato. Rutin (quercetin-
3-rhamnosylglucoside) and naringenin are representative flavonoids of tomato,
respectively conjugated and nonconjugated, and flavonols such as myricetin are
also found in tomato and its products. More recently, resveratrol, which is found
primarily in the grape skin and reported to possess cancer prevention properties
based on in vitro assay results, is also found to exist in both nontransgenic and
transgenic tomatoes (Nicoletti et al., 2007).
Introduction
11
1.3 Tomato breeding
Breeding new cultivars of tomato with improved characteristics started more
than 200 years ago in Europe (mainly in Italy). Although the process of plant
breeding is theoretically simple, it does create novelty. The art of tomato
breeding is identifying and combining the specific traits for each market. The
goals of public and private tomato breeding programmes vary widely depending
on location, need and resources. In general, breeding goals in tomato have
gone through four phases: breeding for yield in the 1970s, for shelf-life in the
1980s, for taste in the 1990s and for nutritional quality currently (Bai and
Lindhout 2007). Recently, recovery of these quality phenotypes in food crops
has benefited from renewed research activity (Goff and Klee 2006), a trend
driven both by the efforts of public health agencies and health professionals to
add more nutritious, ‘functional’ foods to our diets and by the willingness of
consumers to pay for them. The key challenge is to subsequently introduce this
specific genetic material (DNA) into elite production varieties through breeding
while retaining their performance attributes (Giovannoni, 2006). The advent of
genomics has brought a real boost to the generation of data, knowledge and
tools that can be applied to breeding, and that transformed breeding from a rate
individually based activity to a multidisciplinary teamwork which is most suited
to exploit genes from tomato germplasm in an efficient way. As a result, it is
expected that the improvement of tomato cultivars will continue in the future.
With advances in genome mapping and quantitative genetic analyses, the
genetic basis is being dissected for traits that are related to domestication in
many crops (Poncet et al., 2004). The advent of molecular markers and linkage
maps has made it possible to find associations between markers and
phenotypes. Breeders can use a known association of molecular markers with a
trait or a chromosome segment to select the presence of molecular markers
rather than the phenotype. Nowadays, dozens of genes, important for tomato
breeding, have been mapped and molecular markers have been made available
online (http://sgn.cornell.edu). Breeders use these markers to a great extent
with the main aim of increasing the efficiency of breeding programmes. Via
marker-assisted selection, the paradigm of plant breeding has changed from

Introduction
12
selection of phenotypes towards selection of genes, either directly or indirectly.
With the advance of tomato genome sequences and genomics, the genetic
basis of plant growth and development are expected to be better understood.
Knowing the candidate genes for important traits and having the knowledge of
exact functional nucleotide polymorphism within the gene, breeders can easily
identify useful alleles in the wild germplasm and create novel genotypes by
introgressing and pyramiding favourite unused natural alleles and/or even by
shuffling and re-organization of genomic sequences. Learning from
domestication and with more and more available knowledge on genomics, plant
breeders might consider manipulating transcription and regulation factors in the
genome to generate a pool of new trait variation. Very recently, Davuluri et al.
(2005) demonstrated that manipulation of a plant regulatory gene can influence
the production of several phytonutrients generated from independent
biosynthetic pathways and lead to a novel genotype that cannot be achieved by
a conventional breeding approach
1.4 Biotechnological approaches to tomato breeding for quality traits
Tomato has been an excellent model system for both basic and applied plant
research. This has been due to many reasons, including ease of culture under a
wide range of environments, short life cycle, photoperiod insensitivity, high self
fertility and homozygosity, great reproductive potential, ease of controlled
pollination and hybridization. Additionally, tomato is a diploid species with a
rather small genome (0.95 pg/1C, 950 Mbp), lacks of gene duplication, has an
amenable to asexual propagation and whole plant regeneration, allows to
develop haploids, and account for availability of a wide array of mutants and
genetic stocks (including wild species; http://tgrc.ucdavis.edu;
http://www.sgn.cornell.edu). Tomato’s regenerative plasticity also allows easy
grafting, an attribute that facilitates certain developmental and practical studies.
Recent availability of high molecular weight insert genomic libraries, including
both YAC and BAC libraries, has facilitated map-based or positional cloning.
Furthermore, members of Solanum are easily transformed, and transgenic

Introduction
13
tomatoes are routinely produced using co-cultivation with Agrobacterium
tumefaciens. Tomato was the first food crop in the U.S. for which a genetically
engineered variety was marketed and also for which a disease resistance gene
was positionally coloned (Fooland, 2007). Tomato is not only a major crop but
also a model for fruit development with a wealth of data available at
physiological and genetic levels. Research on this species is set to continue
with the current genome-sequencing project (Mueller et al., 2005). The plant
lends itself to studies on fruit architecture, ripening and all aspects of fruit
quality; for this reason different ILs populations have been created and
evaluated (Eshed and Zamir, 1995; Causse et al., 2002). Particularly, many
efforts have been addressed to improve both organoleptic and nutritional quality
in tomato fruit (Verhoeyen et al., 2002; Fraser and Bramely, 2004; Levin et al.,
2004). Strategies to achieve the goal focused mainly on transgenic approaches
and on characterization of mutant or quantitative trait loci with pronounced
effects on such traits. Consistent with public concerns and policy limitation on
widespread cropping of genetically modified plants, alternative approaches to
breeding for quality traits are desirable. In particular, the –omics technologies
could help to resolve the complex traits in major genes and link higher
performing genotypes to polymorphic QTLs. This may allow tracking quality-
associated superior allelic combinations in assisted breeding programs, despite
QTL show low heredity and high environmental interaction. Many –omics
approaches used in tomato for dissecting genetic determinants of fruit quality
have focused on ripening processes because of the high magnitude of
metabolic modifications they imply. In fact, ripening confers desirable flavour,
colour, and texture, increases fruit pathogen susceptibility, imparts numerous
quality and nutritional characteristics including fiber content and composition,
lipid metabolism and antioxidant composition. The ability to understand key
control point in global ripening regulation or within specific ripening processes,
such as carotenoid, flavonoid, vitamin, and flavour volatiles, will allow for
manipulation of nutrition and quality characteristics associated with ripening.
Among –omics strategies, comparative transcriptomic performed on phenotypes
of interest is a powerful strategy for identification of key genetic regulatory
mechanism.

Introduction
14
1.5 Tomato introgression lines and quantitative traits loci
Traditionally, quantitative trait mapping studies in plants and animals involve
whole genome segregating populations, but epistatic interactions in F2 or
recombinant inbred lines (RILs) make it difficult to fully define and characterize
individual loci. Introgression lines (ILs) are a set of nearly isogenic lines
developed through a succession of backcrosses, where each line carries a
single marker-defined chromosome segment from a divergent genome (Zamir,
2001). The term ILs, often used in plant biology, is synonymous with
chromosome substitution strains (CSS) or ‘congenics’, which have been
constructed for mice (Lhote et al., 2007; Singer et al., 2004). A complete IL
population reconstitutes the donor parent genome in overlapping chromosomal
segments and is permanent since it can be maintained by self-pollination.
Consequently, these populations are very effective in identifying and stabilizing
quantitative traits loci (QTL), because any phenotypic difference between an IL
and the recurrent parent is attributed solely to one or more donor parent genes
within the introgressed chromosomal segment (Lippman et al., 2007). The
principles of the IL approach were first demonstrated in tomato. Solanum
lycopersicum (domesticated tomato) is one of the 17 core species in the tomato
clade. The small green-fruited desert species Solanum pennellii is a distant
relative of S. lycopersicum, having evolved unique adaptations in terms of
morphology, mating system, chemistry (especially secondary compounds) and
responses to biotic/abiotic stress. Despite these drastic ecological differences,
S. pennellii is sexually compatible and produces fertile hybrids with S.
lycopersicum, making it the founding donor parent of the first IL population used
for interspecific QTL identification, cloning, and plant breeding. The ILs,
representing whole-genome coverage of S. pennellii in overlapping segments in
the genetic background of S. lycopersicum (cv. M82) presently consists of 76
genotypes. The S. pennellii ILs have been publicly available and have been
phenotyped for hundreds of traits including repeated measurements of the
same traits, thus allowing for the identification of 2795 QTL (Lippman et al.,
2007). The stability of the ILs has allowed multiple years of phenotyping over
different environments, which has led to the reproducible identification of QTL

Introduction
15
for more integrated traits. The S. pennellii ILs have recently gone beyond
standard QTL identification studies, and ventured into a multifaceted systems-
level analysis to address a classical biological question relating to plant
architecture and physiology. A large-scale association study linking plant
structure and biochemistry was carried out by phenotyping the ILs for a wide
range of plant morphology and fruit metabolic profiles (Schauer et al., 2006).
Plant geneticists, realizing the value of wild species diversity to the genetic
improvement of plants, have generated over the past decade numerous
populations that segregate for genetically mapped complex phenotypic
variation. IL populations are now available for many wild tomato species
(Brouwer and St Clair, 2004; Finkers et al., 2007; Frary et al., 2004; Monforte
and Tanksley, 2000; and Peleman and van der Voort, 2003). Similarly, the
power of the IL approach is now being realized in other model systems,
including major food and biofuel crops such as pepper (Ben Chaim et al., 2003),
rice (Ashikari and Matsuoka 2006), barley (von Korff et al., 2004), wheat (Liu et
al., 2006), maize (Szalma et al., 2007), soybean (Concibido et al., 2003) and
Arabidopsis (Keurentjes et al., 2007). These populations are being phenotyped
widely, but only a small fraction of the raw data finds its way to existing
databases. Achieving multilayered phenotypic integration in all model systems
will be necessary in the future to realize the full discovery potential of genomics-
assisted comparative QTL studies.
1.6 Aim of the study
Tomato fruit quality for fresh consumption is determined by tomato organoleptic
quality, which can be defined by physical-chemical and sensorial parameters
that make the product satisfactory for consumers, and by nutritional quality,
characterized by a number of parameters responsible for properties related to
human health.
Organoleptic quality involves taste and flavour, but also the colour and texture
of the fruit. Most of these quality traits show a continuous variation, strongly
induced by environmental condition. The genetic variation of such traits was

Introduction
16
attributed to the joint action of many genes (QTLs), which can be mapped on
the genome with genetic markers.
Tomato nutritional quality is characterized by the biomolecules (carotenoids,
vitamins, and phenols) with antioxidant proprieties present in fruits, leading to
the beneficial role of tomato intake in human diseases. In the last few years,
one of the main object in tomato breeding programmes was to select genotypes
with better total quality characteristics.
The aims of the present thesis were:
1. to study the AtCCD7 and AtCCD8 genes involvement in the volatile
apocarotenoid production to clarify the key point of the biosynthetic carotenoid
pathway using E. coli as model biological system in which genes could be over-
express
2. to identify genomic regions controlling the antioxidant capacity in tomato
fruit by detecting new QTLs for ascorbic acid, phenolic compounds, soluble
solids content, and fruit firmness in the S. pennellii IL population that can be
introgressed into desirable genetic backgrounds;
3. to clarify by means of comparative transcriptomics analysis the plant
biosynthetic AsA pathway in order to identify key sequences directly involved in
fruit ascorbate content or genes underlying the accumulation regulative
mechanisms.
Materials & Methods
17
2. Materials and Methods
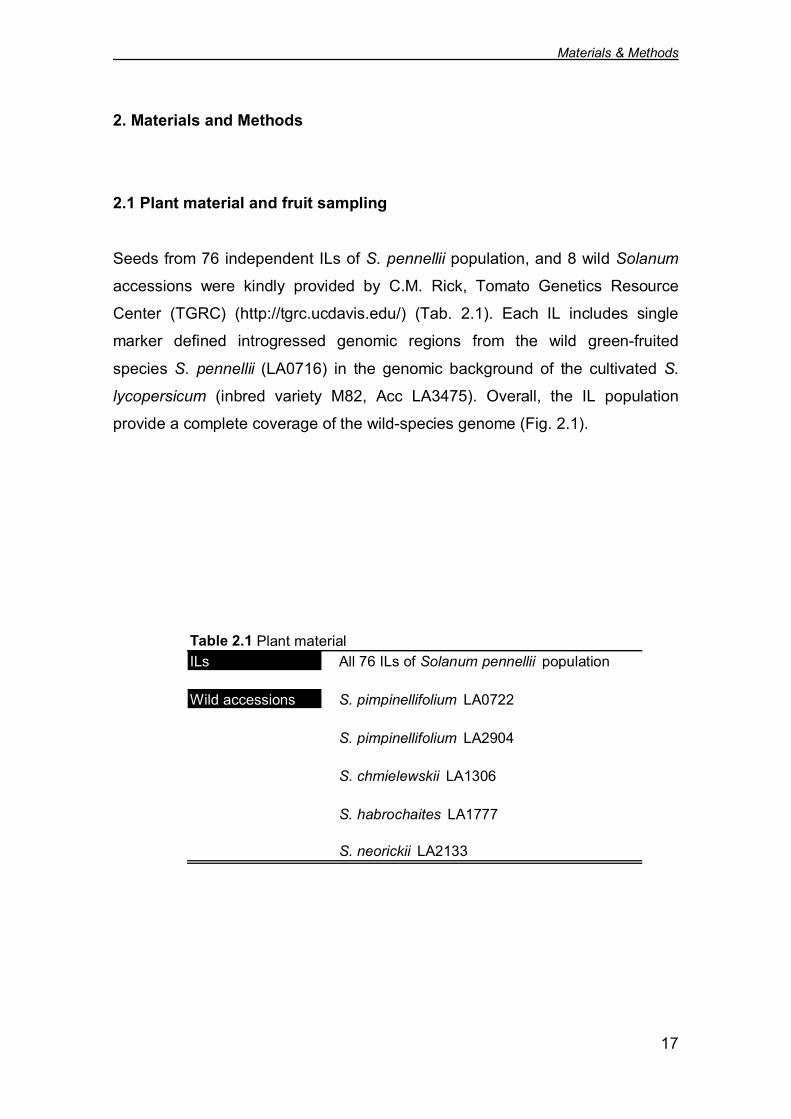
2.1 Plant material and fruit sampling
Seeds from 76 independent ILs of S. pennellii population, and 8 wild Solanum
accessions were kindly provided by C.M. Rick, Tomato Genetics Resource
Center (TGRC) (http://tgrc.ucdavis.edu/) (Tab. 2.1). Each IL includes single
marker defined introgressed genomic regions from the wild green-fruited
species S. pennellii (LA0716) in the genomic background of the cultivated S.
lycopersicum (inbred variety M82, Acc LA3475). Overall, the IL population
provide a complete coverage of the wild-species genome (Fig. 2.1).
Table 2.1 Plant materialILs All 76 ILs of Solanum pennellii population
Wild accessions S. pimpinellifolium LA0722
S. pimpinellifolium LA2904
S. chmielewskii LA1306
S. habrochaites LA1777
S. neorickii LA2133

Materials & Methods
18
Plants were grown in a controlled cold greenhouse at 20°C temperature. Ten
seeds for each line were placed on water-soaked paper in Petri disc and
incubated in growth chamber at 25°C in the dark until germination. Then the
plantule were transplanted in a tray until 10-15 cm of height was reached. Three
to five plants from each genotype were transplanted in cold greenhouse,
located in Portici (NA) Italy, for three consecutive summer trials (2006, 2007
and 2008). Individual tomato plants were grown in pots (20cm diameter)
containing sterilized soil supplemented with Nitrophoska slow release fertilizer.
Plants were laid down according to a completely randomized design and were
watered daily. In order to provide an estimate of S. pennellii homozygote and
heterozygote values the F1 hybrid (S. pennellii X S. lycopersicum cv. M82) was
Figure 2.1 Development of S. pennellii introgression lines. TheILs have been produced through successive introgressionbackcrossing and marker-assisted selection to generate a set ofrecurrent parent lines with a single homozygous introgressedsegment (Eshed and Zamir, 1995). Sublines were obtained as theproduct of backcrossing selected introgressed lines with M82, sogenerating smaller introgressed sections. The S. pennelli ILs thussubdivide the tomato genome into 107 “bins”.

Materials & Methods
19
also grown. Samples were made by pooling red ripe fruit from the same plant.
At least three samples per IL were collected and each sample consisted of a
number of fruit as higher as possible.
Intact fruit were used for measuring firmness and soluble solids content. 50-200
g of whole fruit were also longitudinally cut, seeds and locular jelly removed,
and flesh frozen by immersion in liquid nitrogen. Frozen tissues were ground by
a laboratory WARUING® Commercial blander. Resulted powder was frozen
again in liquid nitrogen and stored at -80 °C until required for AsA and phenols
measurement and RNA extraction and purification.
2.2 Phenotypic measurements
°Brix
Ripe fruit mesocarp was squeezed and the soluble solids content of the
resulting juice measured on a portable refractometer ATAGO Model ATC-1.
Soluble solids content were expressed on a °Brix scale. For each genotype the
average of 10-20 measures was considered.
Fruit firmness
The firmness value of tomatoes was determined by using a T.R. TURIONI
penetrometer. A probe was applied at as many as possible points on the fruit
equator, the displacement of the probe when compressing the fruit was
recorded, and the average of 10-20 measures was used for each genotype.
Ascorbic acid and total ascorbic acid
Ascorbic acid (AsA) and total ascorbic acid (AsA + dehydroascorbate) were
measured using a modified version of the enzymatic method described by
Kampfenkel et al. (1995). The assay is based on the reduction of Fe3+ to Fe2+
by AsA and the spectrophotometric detection of Fe2+ complexed with 2,2’-
dipyridyl. Deydroascorbate is reduced to AsA by preincubation of the sample
with dithiothreitol (DTT). Subsequently, the excess DTT is removed with N-
ethylmaleimide (NEM), and total AsA is determined by 2,2’-dipyridyl method.

Materials & Methods
20
250 mg of frozen powder were weighted in a 1.5 ml tube with a bead and 200 ml
of ice-cold 6% trichloroacetic acid (TCA) added. Samples were homogenized
twice in a Tissue Lyzer (Qiagen) at 50 Hz for 1 min. Tubes were centrifuged for
25 min at 25000 g at 4°C. Recovered supernatant was brought to 500 ml with
6% TCA and 50 ml were used in the assay. The assay procedure is shown in
Table 2.2. The absorbance was read at 525 nm using water as reference with a
UV spectrophotometer (Beckman DU-640). The ascorbic acid concentration
was expressed as µmol g-1 of fresh weight based on the following standard
curve: Abs = 3,6593 x µmol AsA designed over a dynamic range 0 to 0.7 µmol
AsA (R2 = 0.9982). The total AsA In the same way the total AsA concentration
was expressed as µmol g-1 of fresh weight based on the standard curve: Abs =
0.495 x µmol DHA designed over a dynamic range 0 to 0.7 µmol DHA (R2 =
0.97).
Table 2.2 Pipette scheme in protocol used for AsA and total AsA determination
Component in assay (ml) Test Blank Test Blank
Standard/Sample 0.05 - 0.05 -10 mM DTT - 0.05 0.056% TCA - 0.05 - 0.050.2 M phosphate buffer (pH 7.4) 0.15 0.15 0.1a 0.1a
0.5% NEM - - 0.05b 0.05b
H2O double distilled 0.05 0.05 - -10% TCA 0.25 0.25 0.25 0.2542% H3PO4 0.2 0.2 0.02 0.024% 2,2'-dipyridyl 0.2 0.2 0.02 0.023% FeCl3
c 0.1d 0.1d 0.1d 0.1d
a Mix and incubate 15 min at 42 °C in water bathb Mix and incubate 1 min at room temperaturec Mix immediately and vigorously after addition of FeCl3, otherwise turbidity resultsd Incubate at 42 °C in water bath for 40 min and read absorbance at 525 nm
AsA Total AsAtissue

Materials & Methods
21
Total phenols
The amount of total phenolics compound was determined according to Folin-
Ciocalteu’s procedure (Singleton and Rossi, 1965). 1 ml of 60% methanol was
added to 250 mg of ground tissue in a 1.5 ml tube with a bead. Samples were
homogenized twice in a Tissue Lyzer (Qiagen) at 50 Hz for 1 min. Extracts were
placed on ice 3 min in the dark and vortexed. The extraction was transferred in
a 15 ml tube and volume brought to 5 ml with 60% methanol. Samples were
centrifuged at 3000 g for 5 min. 62.5 microliters of the supernatant, 62.5 µl of
Folin-Ciocalteu’s reagent (Sigma), and 250 µl of deionizated water were
incubated for 6 min. After addition of 625 ml of 7.5% sodium carbonate and 500
ml of deionizated water, samples were incubated for 90 min at room temperature
in the dark. Absorbance was measured at 760 nm. The total phenolics
concentration was expressed in terms of µg of gallic acid equivalents mg-1 of
fresh weight, based on a gallic acid standard curve designed over a dynamic
range 0 to 125. Abs 760nm = (0.0234 x µg gallic ac.) – 0.0776 (R2 = 0.995).
2.3 Statistical analysis of phenotypic data
Physical and chemical data collected on the IL population and wild accessions
were analyzed by mean of parametric test by using SPSS (Statistical Package
for Social Sciences) Package 6 version 15.0. Significance of QTL was
determined by comparing mean values of individual ILs to the control M82
through a factorial analysis of variance (One-way-ANOVA) with LSD post-hoc
test at significance level of 0.05. ANOVA was performed to assess year and
genotype effects. Analysis of variance was used to study the differences
between ILs and M82 for firmness, soluble solids content, ascorbate and total
phenolics concentration. The presence of a QTL was hypothesized when an
introgression had a significant effect at least over two trial seasons.

Materials & Methods
22
2.4 Gene expression analysis
2.4.1 RNA isolation
Total RNA was isolated from homogenized powdered tomato fruit
stored at -80°C according to Griffiths and co-workers (1999)
procedure. Approximately, 4 g of ground flesh were added to 12
ml of Extraction Buffer (Solution A) and an equal volume of
phenol/chloroform (Solution B) in an Oakridge tube. Tubes were
vigorously shaken and then centrifuged at 10000 rpm (15 min,
Room Temperature (RT)). 11 ml of the aqueous phase was then
transferred to a clean Oakridge tube, the nucleic acid was
precipitated in the aqueous phase for 1 h at -20°C with the
addition of 27.5 ml of ice-cold 100% ethanol and 1.1 ml of 3 M
sodium acetate (pH 6.0). Following centrifugation at 10000 rpm
(15 min, 4 °C) the pellet was washed in 70% ethanol. The samples
were then redissolved in 2 ml of DEPC-treated water, followed by
the addition of 2 ml of 2X cetyltrimethylammonium bromide
(CTAB) Extraction Buffer (Solution C). Nucleic acids were
precipitated by the addition of 4 ml of CTAB Precipitation Buffer
(Solution D) and centrifuged at 12000 rpm (30 min. RT). The pellet
was re-suspend in 400 ml of 1.4 M NaCl, followed by the addition
of 1 ml of ice-cold 100% ethanol and precipitated at -20°C for 1 h
to over-night. The samples were then centrifuged at max speed
(10 min, 4 °C), the pellets washed in 500 ml of 70% ethanol,
redissolved in 400 ml of DEPC-treated water and incubated at 50
°C for 5 min. 400 ml of phenol/chloroform (Solution B) were added
twice. The nucleic acid was precipitated in 0.1 volume of 3 M
sodium acetate (pH 6.0) and 3 volumes of ice-cold 100% ethanol
for 1 h to over-night at -20 °C. The samples were washed with 500
ml of 70% ethanol. The pellet was redissolved in 180 µl of DEPC-
treated water, followed by addition of 20 µl of RQ1 DNase
Reaction Buffer (Solution E) and 1 µl of RQ1 DNase (Promega)

Materials & Methods
23
and incubated at 37°C for 30 min. The RNA samples were finally
collected for spectrophotometric quantification and stored at -80
°C. The purity of the RNA was determined using a Bio Rad Smart
Spec 3000 spectrophotometer and integrity was confirmed using
the AGILENT 2100 Nano Bioanalyzer with RNA 6000 nano chip
RNA Extraction Buffer (Solution A)
6% (w/v) 4-aminosalicylic acid1% (w/v) 1,5-naphthalenedisulphonic acid50mM Tris-HCL pH 8.35% (w/v) Phenol Solution
Phenol Solution
100 g Phenol crystals14 ml m-cresol0.1 g 8-hydroxy-quinoline30 ml DEPC-treated water
Phenol/Chloroform Solution (Solution B)
500 g Phenol crystals0.5 g 8-hydroxy-quinoline500 ml Chloroform20 ml Iso-amyl alcohol200 ml 100mM Tris-HCLpH 8.0
2X CTAB Extraction Buffer (Solution C)
1.4 M NaCl2% (w/v) CTAB0.1 M Tris-HCL pH 8.020 mM EDTA pH 8.0
CTAB Precipitation Buffer (Solution D)
1% CTAB (w/v)50 mM Tris-HCL pH 8.010 mM EDTA pH 8.0
10X RQ1 DNase Reaction Buffer (Solution E)
400 mM Tris-HCL pH 8.0100 mM MgSO4

Materials & Methods
24
10 mM CaCl2
2.4.2 Synthesis antisense RNA
The aRNA was synthesised using SuperScript™ Indirect RNA
Amplification System Kit (Invitrogen Catalog no. L1016-02) and
labeled with fluorescent dye Alexa Fluor 647 Reactive Dye. In
particular, the first step was to synthesise the cDNA. In a 1.5-ml
RNase-free tube, was added:
Component Sample
1 µg of mRNAT7-Oligo(dT) Primer 1 µlDEPC-treated water to 10 µl
The mix was incubated at 70°C for 10 min, and then placed on ice
for 1 min, and centrifuged briefly to collect the contents. After that
was added:
Component Volume
5X First-Strand buffer 4 µl0.1 M DTT 2 µl10 mM dNTP Mix 1 µlRNaseOUT (40 U/µl) 1 µlSuperSript III RT (200 U/µl) 2 µlTotal Reaction Volume 20 µl
The tube was centrifuged briefly and then incubated at 46°C for 2
min, following an incubation at 70°C for 10 min. After incubation
the synthesis of the Second-Strand cDNA was performed To the
tube placed on ice was added:
Component Sample
DEPC-treated water 91 µl5X Second-Strand buffer 30 µl

Materials & Methods
25
10 mM dNTP Mix 3 µlE. coli DNA Polymerase I (10 units/µl) 4 µlE. coli DNA Ligase (10 units/µl) 1 µlE. coli RNase H (2 units/µl) 1 µlTotal Volume 150 µl
The reaction mixture was incubated at 16°C for 2 hours, and then
placed on ice. To purify the cDNA 500 µl of cDNA Loading Buffer
were added to the reaction tube, and then the mixture was loaded
directly onto the Spin Column. The samples were then centrifuged
at 6000 g at RT for 1 min, and the flow-through discarded. cDNA
was washed twice with 700 µl of Wash Buffer, following two
centrifugation steps at 6000 g at RT for 1 min and 2 min
respectively. To eluate the cDNA 24 µl of DEPC-treated water
were added and incubation was done at RT for 2 min. Finally,
samples were centrifuged at 10000 g at RT for 1 min to collect the
purified cDNA. To obtain the aRNA the in vitro transcription was
performed adding the following components at room temperature:
Component Sample
100 mM ATP 1.5 µl100 mM CTP 1.5 µl100 mM GTP 1.5 µl100 mM UTP 0.75 µl50 mM aa-UTP 2 µl10X T7 Reaction Buffer 4 µlT7 Enzyme Mix 7 µl
The samples were incubated at 37°C over-night. aRNA Binding
Buffer was added to bring the total volume to 200 µl, and then 100
µl of 100% ethanol. The entire aRNA/Buffer Solution was loaded
directly onto the Spin Column and centrifuged at 12000 g for 15
sec at RT. The flow-through was discarded and 500 µl of a RNA
Wash Buffer added, following centrifuge at 12000 g for 15 sec.
This step was performed twice. To eluate the aRNA 100 µl of
DEPC-treated water were added and then incubated at RT for 1

Materials & Methods
26
min and centrifuged at 12000 g for 2 min. The aRNA was labelled
with Alexa Fluor 647 Reactive Dye. 3 µg of aRNA were placed in a
speed-vacum to evaporate the samples at low heat until the
volume was reduced to ≤ 3 µl. The dye was resuspended in 8 µl of
2X Coupling Buffer and dye solution was added to the aRNA. The
solution was mixed thoroughly. The samples were incubated at RT
in the dark for 30 min. To purify the dye-coupled aRNA the same
procedure mentioned above for the RNA purification was used.
2.5 Chip design
The 90k TomatoArray1.0 microarray chip has been synthesized on Combimatrix
platform to the Facoltà di Scienze Matematiche Fisiche e Naturali at the
Università di Verona (Italy), in the frame of a collaboration with prof. M. Pezzotti
(Dipartimento di Scienze Tecnologie e Mercati della Vite e del Vino) and prof.
M. Delledonne (Dipartimento Scientifico e Tecnologico). The TomatoArray1.0
chip contains 90k siliceous electrodes supporting 20200 in situ synthesized
DNA probes with 4 replications. Each probe consists of 35-mer oligonucleotides
designed to be specific for a different Tentative Consensus (TC) from TIGR S.
lycopersicum Gene Index Release 11.0 (June 21, 2006). As negative control
nine bacterial oligonucleotide sequences provided by Combimatrix were
utilized. The Custom Array™ 90K was designed with four replicates of each
probe randomly distributed across the array to allow measurement of the
variability within the array.
2.6 Hybridization and imaging
Labeled aRNA was hybridized on the TomatoArray 1.0. The microarray slides
were pre-hybridized, onto the rotisserie in the hybridization oven, for 30 min at
45°C in the Pre-hybridization Solution (Solution A). The microarray was then

Materials & Methods
27
hybridized filling the hybridization chamber with the Hybridization Solution
(Solution B), , and incubated for 14 h at 45°C in the hybridization oven. After
hybridization the slides were iteratively washed with different Wash Solution
(Solution C, D, E) until the final wash with PBST Wash Solution (Solution F),
and incubated at room temperature for 1 min. Three hybridization replica per
each genotype (M82, IL 12-4) per two years (2007-2008) for a total of six replica
per genotype were performed. In particular within each genotype, an
hybridization replica was done using RNA extracted from fruit coming from a
single plant. Slides were then scanned using a Perkin Elmer ScanArray 4000
XL scanner and acquisition software (ScanArray Express Microarray Analysis
System Version 4.0) according to the manufacturer's instructions For more
detailes see CustomArray® 90K Microarray - Hybridization and Imaging
Protocol (PTL020) available at website
http://www.combimatrix.com/support_docs.htm.
Pre-hybridization Solution (Solution A) Volume for 120 µl
2X Hyb Solution stocka 60 µlNuclease-free water 41 µl50X Denhart’s solution 12 µlSalmon sperm DNA (10 mg ml-1) 1 µl1% SDS 6 µl
a2X Hyb Solution stock Volume for 10 ml
20X SSPE 6 ml10% Tween-20 100 µl0.5 M EDTA 560 µlNuclease-free water 3.34 ml
Hybridization Solution (Solution B) Volume for 120 µl
2X Hyb Solution stocka 60 µlDI Formamide 30 µlLabeled RNA 10 µlSalmon sperm DNA (10 mg ml-1) 1 µl1% SDS 5 µlNuclease-free water to 120 µl

Materials & Methods
28
6X SSPET Wash Solution (Solution C) Volume for 10 ml
20X SSPE 3 ml10% Tween-20 50 µlNuclease-free water 6.95 ml
3X SSPET Wash Solution (Solution D) Volume for 10 ml
20X SSPE 1.5 ml10% Tween-20 50 µlNuclease-free water 8.45 ml
0.5X SSPET Wash Solution (Solution E) Volume for 10 ml
20X SSPE 250 µl10% Tween-20 50 µlNuclease-free water 9.7 ml
PBST Wash Solution (Solution F) Volume for 10 ml
10X PBS 2 ml10% Tween-20 100 µlNuclease-free water 7.9 ml
2.7 Data extraction, normalization and filtring
After scanning microarray TIF images were processed to generate numerical
data using the CombiMatrix Microarray Imager Software version 5.8.0
copy@right 2001. The Quick Start Guide or the Microarray Imager User's
Manual is available at the website https://webapps.combimatrix.com. Signal
probe medians and standard deviations were further imported in SPSS
software.
Normalization between arrays was achieved by correcting each probe median
based on the ratio between the median of the array and the average median of
arrays. Following data normalization and quality control all values were log
transformed (log base 2).
Finally, probe signals having a variability coefficient higher than 0.5, as well as
spikes and factory probes, were filtered out. Also, probe showing the 10%
Materials & Methods
29
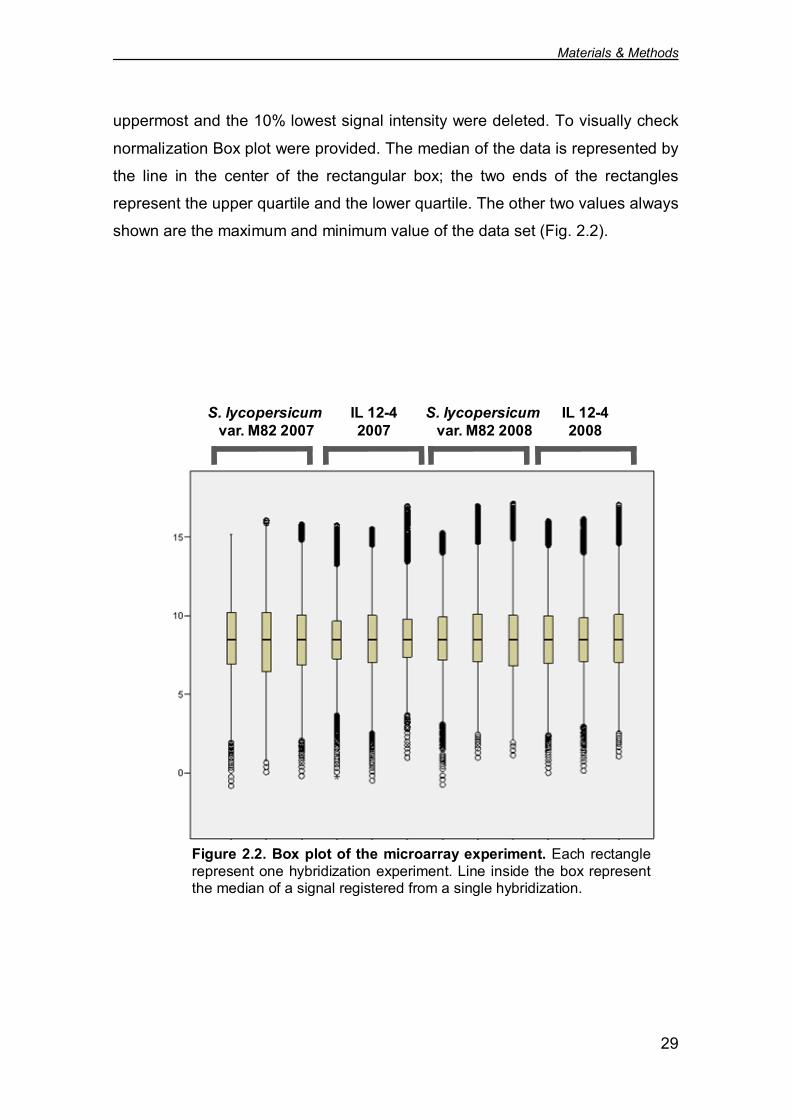
uppermost and the 10% lowest signal intensity were deleted. To visually check
normalization Box plot were provided. The median of the data is represented by
the line in the center of the rectangular box; the two ends of the rectangles
represent the upper quartile and the lower quartile. The other two values always
shown are the maximum and minimum value of the data set (Fig. 2.2).
S. lycopersicumvar. M82 2007
S. lycopersicumvar. M82 2008
IL 12-42007
IL 12-42008
Figure 2.2. Box plot of the microarray experiment. Each rectanglerepresent one hybridization experiment. Line inside the box representthe median of a signal registered from a single hybridization.

Materials & Methods
30
2.8 Statistical analysis and bioinformatics procedures
Differentially expressed signals were identified using the t-test module
contained within the TIGR Multiple Experiment Viewer version 4.0
(http://www.tigr.org/software/tm4/ - Saeed et al., 2003). In particular, the
between-subject algorithm with a statistical significance of P <0.01 was used for
comparing transcriptomic profiles of IL12-4 with the M82 counterpart (Tusher et
al., 2001).
Blast2GO (http://blast2go.bioinfo.cipf.es/ - Conesa et al., 2005) was used to
provide automatic and high-throughput annotation, gene ontology mapping, and
categorization of TCs showing differential transcription signal. An expectation
value < E 10-10 was used.
2.9 E. coli transformation
pDEST-15 empty vector (Invitrogen) and pDEST-15 derived expression clone
containing a coding sequence (CDS) cassette of the genes AtCCD7 and
AtCCD8 were transformed into chemically competent E. coli BL21-AI
(Invitrogen) cells harbouring plasmids encoding carotenoid biosynthetic genes
(Cunningham and Gatt, 2001, 2007) (Tab. 2.3).
In BL21-AI cells the araBAD promoter regulated by L-arabinose is used to
control expression of T7 RNA polymerase promoter present into pDEST-15
vector. Cells have been transformed by a Heat Shock procedure. 50 ml of E. coli
cells were thawed on ice, then 50 ng of vector were added and tubes were
incubated on ice for 10 min. The samples were incubated into water bath at
42°C for 45 seconds and back on ice for 2 min. 900 ml of SOC broth (Solution
A) were added and the samples were incubated at 37°C with shaking at ~250
rpm for 1 h. 100 ml of resulting culture were spreaded in plate on LB containing
100 mg ml-1 carbencillin (Sigma) and 34 mg ml-1 chloramphenicol (Sigma) and
incubated over-night at 37 °C.

Materials & Methods
31
SOC broth 1 (Solution A) 1 Litre
Bacto-tryptone 20 gBacto yeast extract 5 gNaCl 0.6 gKCl 0.5 gMgCl2 10mMMgSO4 10mMGlucose 20mM
2.10 Volatile analysis from E. coli cultures
Three individual colonies for each transformed bacterial strain were used to
inoculate three different 3-ml cultures of liquid LB containing 100 mg ml-1
carbenicillin and 34 mg ml-1 chloramphenicol. The 3 ml cultures were grown
overnight at 37°C. On the next day, 1 ml of overnight culture was used to
inoculate 100 ml of LB containing 100 mg ml-1 carbenicillin and 34 mg ml-1
chloramphenicol in a 250-ml baffle flask. The cultures were grown at 200 rpm
for 2.5–3 h at 33°C in darkness until an absorbance at 600 nm of 0.8–1.0 was
reached. The flask was then chilled on ice for 5 min and induced with a final
concentration of 0.1% L-arabinose (Fischer Scientific).
Table 2.3 E. coli strains producing different carotenoidsE. coli strain code Type of carotenoid
BL21-AI a GGPPBL21-AI b PhytoeneBL21-AI c Zeta-caroteneBL21-AI d LycopeneBL21-AI e Delta-caroteneBL21-AI f Beta-caroteneBL21-AI g Zeaxanthin
Materials & Methods
32
The cultures were placed back on the shaker and grown for an additional 3 h
(200 rpm at 25°C). The cultures were then placed on a bench and capped with
a rubber stopper, and partially purified air (the filter consisted of 0.5 mg of
activated charcoal in a 0.6 x 10 cm glass tube) was bubbled through the
cultures (~175 ml min-1) for 2 h using a dual diaphragm air pump (General
Hydroponics, Sebastopol, CA). The volatile head space was collected on a 30
mg Super Q column (80/100 mesh; Alltech Associates, Inc., Deerfield, IL).
After volatile collection, the A600 was recorded. The Super Q columns were
eluted with 150 µl of methylene chloride (Fischer Scientific) after addition of 400
ng of nonyl acetate (in 5 µl of methylene chloride) as an internal standard.
Nitrogen was blown over the samples to evaporate solvent until they reached a
volume of 300 µl. Separation of volatiles was performed on an Agilent DB-5
column (Palo Alto, CA) and an Agilent 6890N gas chromatograph according to
Schmelz et al., (2001). The volatiles were compared with known standards
(Sigma-Aldrich) and calculated as nmol A600-1 h-1. Any background present in
control reactions was subtracted, and values were normalized on the percent
recovery of each volatile. Percent recovery was calculated as the average
amount of volatiles recovered from flasks with 100 ml of LB treated exactly as
described above except than at the point of "induction" a known amount of each
volatile compound was added. The identity of each peak was confirmed by gas
chromatography/mass spectrometry using an Agilent 5975 mass detector in
electron ionization mode.
2.11 Protein blot analysis
One ml of bacteria samples from each culture was recovered after volatiles
collection. A600 was determine and samples were re-suspended in an amount of
2X SDS-PAGE Buffer (Solution A) equal to culture optical density. 20 µl of
sample was then loaded onto 10% Ready Gel Tris-HCL (Bio-Rad),
Electrophoresis chamber was filled with 1X Running Buffer (Solution B) and the
run set at 200V until tracking dye reached the bottom of gel. Proteins were
transferred to a nitrocellulose membrane using the Bio-Rad Mini Trans-Blot cell.

Materials & Methods
33
Membranes were blocked overnight in 10% Carnation milk/TBST at 4°C
(Nestle; http://www.nestle.com). Membranes were washed twice for 5 min in
TBST, and then incubated with primary anti-GST(1:2000) or anti-HIS (1:5000)
antibody diluted in 5% Carnation milk/TBST for 1 h. Membranes were
subsequently washed three times for 10 min in TBST, and then incubated with
peroxidase-conjugated goat anti-rabbit (1:5000) secondary antibody
(Kirkegaard & Perry Laboratories; http://www.kpl.com) diluted in 5% Carnation
milk/TBST for 45 min. Membranes were finally washed three times for 10 min in
TBST. Visualization of signal was performed using Amersham ECL detection
reagents (http://www.amershambiosciences.com/) before exposure to film for
30 secons.
2X SDS-PAGE Buffer (Solution A) Volume for 8 ml
Deionized water 2.9 ml0.5 M Tris-HCL pH 6.0 1.0 mlGlycerol 2.0 ml10% SDS 1.6 mlβ-mercaptoethanol 0.4 ml1.0% bromophenol blue 0.1 ml
10X Running Buffer (Solution B) Volume for 500 ml
Tris base 15.0 gGlycine 72.0 gSDS 5.0 gDeionized water 500 ml

Results
34
3. RESULTS
3.1 QTL analysis in tomato S. pennellii IL population
In order to screen genetic resources for QTLs involved in controlling AsA and
phenols concentration, total soluble solids content, and fruit firmness, chemical
and physical analysis were performed on red ripe fruit of S. pennelli IL
population and parental line. Missing genotypes are caused by lack of plant or
fruit replications per trial. This was due to different constraint such as biotic and
abiotic stress. Moreover, for fruit firmness the reduced size of fruit produced by
different ILs often caused the measurement to fail. Because the flash collapse
before been inflicted by the penetrometric probe. AsA accumulation and total
phenols content were also analyzed in different tomato wild accessions.
3.1.1 Total soluble solids
On average, total soluble solids into S. lycopersicum cv. M82 fruit was 4.24
°Brix. In the IL population the total soluble solids content of red ripe fruit showed
to vary over the range from 3.07 °Brix (IL 2-1) to 6.5 °Brix (IL 2-3). One-way
ANOVA test displayed no significant interaction between genotype and year
(Tab 3.1). Analysis of the total soluble solids content in the IL population over
two growing seasons (2007 and 2008) allowed to identify eight lines expressing
QTLs for different fruit °brix content (Fig 3.1).

Results
35
Table 3.1 One-way ANOVA results of total soluble solids in fruit from IL population andS. lycopersicum cv. M82 grown over two years trials.Source Sum of Square df Maen Square F PCorrected Model 69,751 39 1,788 4,73 0,00Year 0,186 1 0,186 0,49 0,49Genotype 59,124 37 1,598 4,23 0,00Year * Genotype 0,571 10-4 1 0,571 10-4 0,00 0,99Error 44,968 119 0,378Total 3739,78 159
0
1
2
3
4
5
6
7
8
M 8
2
1-3
1-4
2-1
2-2
2-3
2-4
2-5
2-6
3-4
3-5
4-1
4-3
4-4
5-3
5-4
5-5
6-1
6-4
7-1
7-2
7-3
7-4
7-5
8-2
9-2-
5
9-3
10-1
10-2
11-3
12-1
12-2
12-3
12-4
°Brix
Introgression line number
***
***
*****
**
***
**
***
Figure 3.1 Total soluble solids content (°Brix) of red ripe tomatoes from S. pennellii ILpopulation and S. lycopersicum cv. M82 control. Data shown are comprehensively referredto two growing seasons (2007-2008) with three replica per line each year. Mean value andstandard error are represented. Asterisks indicate ILs accumulating fruit soluble solids levelsstatistically different from M82 at LSD post-hoc test: *: P<0.05; **: 0.01< P < 0.05; ***: P<0.001.

Results
36
Seven detected QTLs showed a positive effect, whereas one a negative effect.
A summary of the identified QTLs for °Brix are provided in Table 3.2. As
observed the °Brix content in the fruit of IL 2-1 expressing the only negative
QTL was 27% lower than the S. lycopersicum cv. M82 control. The positive
QTLs ranged from 51% to 20% higher than the control.
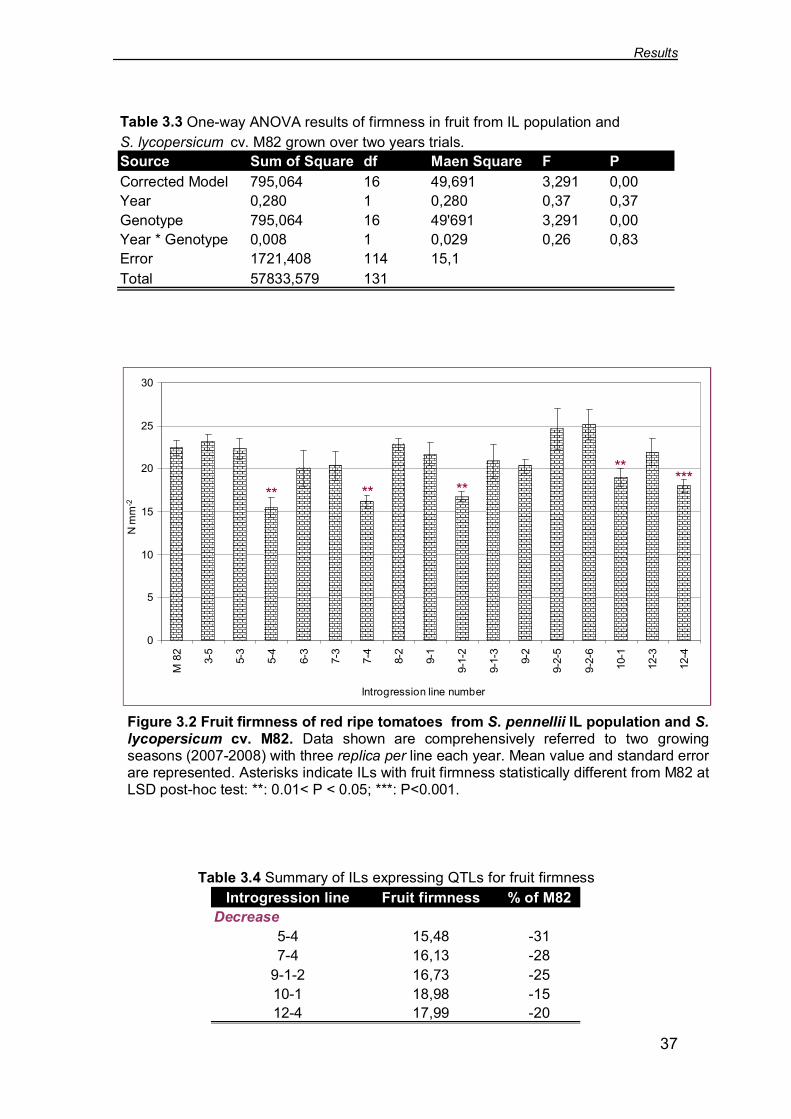
3.1.2 Fruit firmness
S. lycopersicum cv. M82 showed on average penetrometric index equal to 22.46
N mm-2. One-way ANOVA test for fruit firmness displayed no significant
interaction between genotype and year (Tab 3.3). Over the two trial seasons
(2007-2008) five ILs with decreased fruit firmness were identified (Fig. 3.2). In
particular, the lowest penetrometric index was recorded for IL 5-4 (on average
15.48 N mm-2; P<0.05), that is 31 % less than S. lycopersicum cv. M82,
whereas the IL 10-1 performed on average a penetrometric index of 18.98 N
mm-2 (P<0.05), that is only 15% lower than the M82 (Tab. 3.4).
Table 3.2 Summary of ILs expressing QTLs fortotal soluble solids content in the fruit
Introgression line °Brix % of M82Increase
1-3 5,40 272-3 6,50 532-5 5,08 206-1 5,87 387-2 6,40 517-3 5,73 3510-1 5,73 35
Decrease2-1 3,07 -27
Results
37
Figure 3.2 Fruit firmness of red ripe tomatoes from S. pennellii IL population and S.lycopersicum cv. M82. Data shown are comprehensively referred to two growingseasons (2007-2008) with three replica per line each year. Mean value and standard errorare represented. Asterisks indicate ILs with fruit firmness statistically different from M82 atLSD post-hoc test: **: 0.01< P < 0.05; ***: P<0.001.
0
5
10
15
20
25
30
M 8
2
3-5
5-3
5-4
6-3
7-3
7-4
8-2
9-1
9-1-
2
9-1-
3
9-2
9-2-
5
9-2-
6
10-1
12-3
12-4
N m
m-2
Introgression line number
** ** ****
***
Table 3.3 One-way ANOVA results of firmness in fruit from IL population andS. lycopersicum cv. M82 grown over two years trials.Source Sum of Square df Maen Square F PCorrected Model 795,064 16 49,691 3,291 0,00Year 0,280 1 0,280 0,37 0,37Genotype 795,064 16 49'691 3,291 0,00Year * Genotype 0,008 1 0,029 0,26 0,83Error 1721,408 114 15,1Total 57833,579 131
Introgression line Fruit firmness % of M82Decrease
5-4 15,48 -317-4 16,13 -28
9-1-2 16,73 -2510-1 18,98 -1512-4 17,99 -20
Table 3.4 Summary of ILs expressing QTLs for fruit firmness

Results
38
3.1.3 Ascorbic acid and total ascorbic acid content
The average ascorbic acid (AsA) concentration observed was 0.71 µmol g-1
fresh weight (FW) in ripe fruit from S. lycopersicum cv. M82, while was 2.13
µmol g-1 FW in S. pennellii LA0716 fruit. Fruit from interspecific hybrid F1
showed a higher ascorbic acid accumulation (3.34 µmol g-1 FW) than it was in
fruit of S. lycopersicum cv. M82, as well as higher than the wild parent fruit.
One-way ANOVA test for AsA content displayed significant interaction between
genotype and year (Tab 3.5).
Thirteen lines with significantly different ascorbic acid concentration were
identified through the IL population over a three years (2006, 2007 and 2008) of
greenhouse trials (Fig. 3.3). Among these thirteen lines four QTLs were
detected that affect ascorbic acid concentration compared to the control. Three
were positive QTLs (IL 7-3; IL 8-2; IL 12-4), corresponding to an increase of
AsA concentration, while the other one was negative (IL 10-1), corresponding to
a decrease in AsA concentration. As shown in Figure 3.3 two of these QTLs
were observed during two years experimental seasons, whereas the other two
were detected in all growing trials. The highest AsA concentration was observed
in the IL 7-3 fruit (0.01<P<0.05) displaying an average of 1.40 µmol g-1 FW, that
is 97% higher than the S. lycopersicum cv. M82 control. Conversely, the lowest
Table 3.5 One-way ANOVA results of AsA content in fruit from IL population andS. lycopersicum cv. M82 grown over three years trials.Source Sum of Square df Maen Square F P
Corrected Model 85,382 81 1,054 18,01 0,00Year 1,335 2 0,667 11,40 0,00Genotype 35,180 59 0,596 10,19 0,00Year * Genotype 8,597 20 0,430 7,34 0,00Error 23,530 402 0,059Total 452,942 484
Results
39
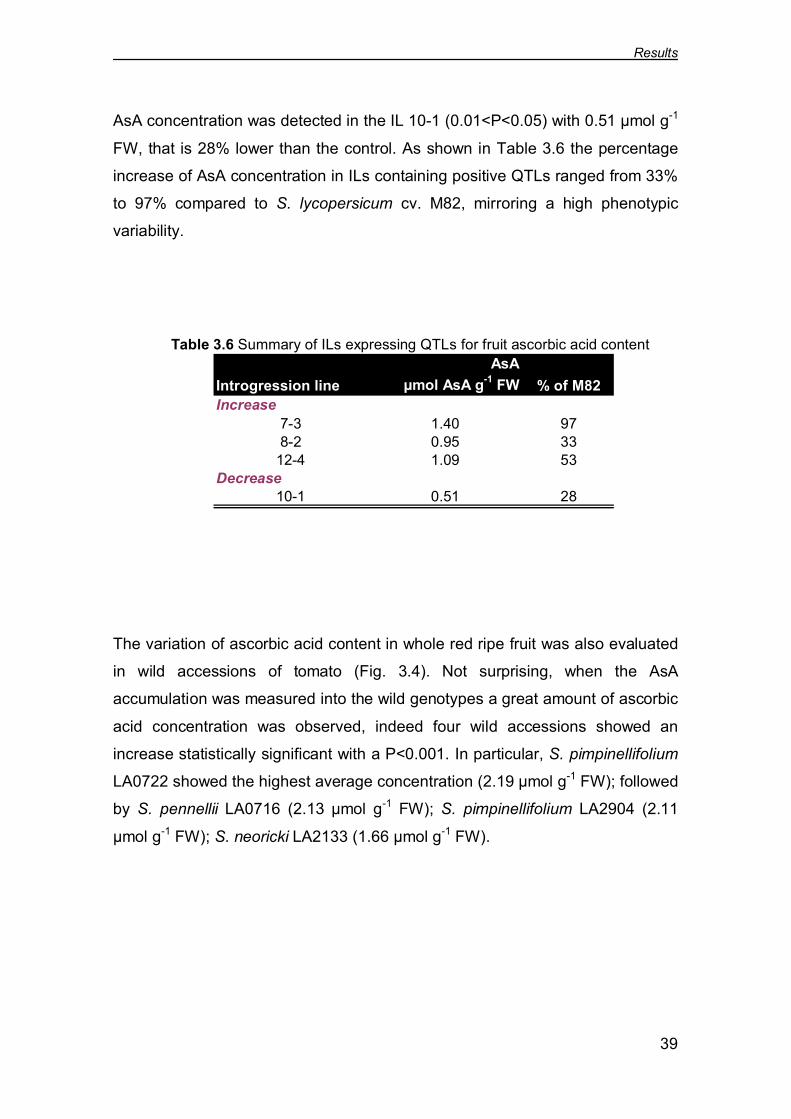
AsA concentration was detected in the IL 10-1 (0.01<P<0.05) with 0.51 µmol g-1
FW, that is 28% lower than the control. As shown in Table 3.6 the percentage
increase of AsA concentration in ILs containing positive QTLs ranged from 33%
to 97% compared to S. lycopersicum cv. M82, mirroring a high phenotypic
variability.
The variation of ascorbic acid content in whole red ripe fruit was also evaluated
in wild accessions of tomato (Fig. 3.4). Not surprising, when the AsA
accumulation was measured into the wild genotypes a great amount of ascorbic
acid concentration was observed, indeed four wild accessions showed an
increase statistically significant with a P<0.001. In particular, S. pimpinellifolium
LA0722 showed the highest average concentration (2.19 µmol g-1 FW); followed
by S. pennellii LA0716 (2.13 µmol g-1 FW); S. pimpinellifolium LA2904 (2.11
µmol g-1 FW); S. neoricki LA2133 (1.66 µmol g-1 FW).
Introgression line µmol AsA g-1 FW % of M82Increase
7-3 1.40 978-2 0.95 33
12-4 1.09 53Decrease
10-1 0.51 28
AsATable 3.6 Summary of ILs expressing QTLs for fruit ascorbic acid content

Results
40
Figu
re3.
3A
scor
bate
cont
enti
nrip
eto
mat
oes
from
S.pe
nnel
liiIL
popu
latio
n,pa
rent
allin
eS.
lyco
pers
icum
cv.M
82,a
ndin
ters
peci
ficF 1
hybr
id.D
ata
show
nar
ere
ferre
dto
thre
egr
owin
gse
ason
s(2
006-
2007
-200
8)w
ithth
ree
repl
ica
perl
ine
each
year
.AsA
conc
entra
tion
over
all
trial
sis
also
show
n.M
ean
valu
ean
dst
anda
rder
ror
are
repr
esen
ted.
Ast
eris
ksin
dica
teIL
sac
cum
ulat
ing
fruit
asco
bate
leve
lsst
atis
tical
lydi
ffere
ntfr
omM
82at
LSD
post
-hoc
test
:*:P
<0.0
5;**
:0.0
1<P
<0.
05;*
**:P
<0.0
01.
0
0,51
1,52
2,53
3,54
M 82S. pennellii
1-11-21-31-42-12-22-32-42-53-13-23-33-43-54-14-24-34-45-15-35-45-56-16-26-47-17-27-37-47-58-18-28-39-19-29-3
10-110-211-111-211-311-412-112-212-312-4
2006
*** *
***
****
***
**
***
****
***
****
**
0
0,51
1,52
2,53
3,54
M 82F1 hybrid
3-55-36-37-37-48-29-1
9-1-29-1-3
9-29-2-59-2-612-4
2007
***
**
****
**
***
*
00,
511,
522,
533,
544,
55
M 82
F1 hybrid
7-3
10-1
12-3
12-4
2008
***
*
*
**
0
0,51
1,52
2,53
3,54
M 82
S. pennellii
F1 hybrid
1-1
1-2
1-3
1-4
2-1
2-2
2-3
2-4
2-5
3-1
3-2
3-3
3-4
3-5
4-1
4-2
4-3
4-4
5-1
5-3
5-4
5-5
6-1
6-2
6-3
6-4
7-1
7-2
7-3
7-4
7-5
8-1
8-2
8-3
9-1
9-1-2
9-1-3
9-2
9-2-5
9-2-6
9-3
10-1
10-2
11-1
11-2
11-3
11-4
12-1
12-2
12-3
12-4
3 ye
ars
aver
age
***
**
***
*
****
***
***
***
* *
***
*
µmol AsAperg-1FW
Intro
gres
sion
line
num
ber

Results
41
IL population fruit were also profiled for total AsA concentration. The average
total AsA concentration was 3.53 µmol g-1 FW in ripe fruit from S. lycopersicum
cv. M82; 9.94 µmol g-1 FW in fruit from S. pennellii; and 16.01 µmol g-1 FW in
fruit from F1 hybrid. As for the AsA content one-way ANOVA test displayed
significant interaction between genotype and year ab. 3.7). Two QTLs were
detected (IL 7-3; IL 12-4) affecting total AsA concentration over two trial years
(2006-2007) (Fig.3.5).
µmol
AsA
per
g-1FW
0
0,5
1
1,5
2
2,5
3
3,5
4
4,5
M 8
2
LA
1777
LA
2133
LA
2904
LA
0722
LA
0716
*
****** ***
Genotype
Figure 3.4 Ascorbic acid (AsA) content of ripe tomatoes from wild accessionsand S. lycopersicum cv. M82. Bars represent mean values and standard errors.Asterisks indicate difference statistically significant at LSD post-hoc test for P<0.05(*) and P<0.001 (***) compared to S. lycopersicum var. M82. Three replicas pergenotype were used.
Table 3.7 One-way ANOVA results of total AsA content in fruit from IL population andS. lycopersicum cv. M82 grown over two years trials.Source Sum of Square df Maen Square F PCorrected Model 1357,756 64 21,215 20,42 0,00Genotype 1047,536 59 19,765 19,02 0,00Year 56,931 2 28,466 27,40 0,00Year * Genotype 121,250 9 13,472 12,97 0,00Error 380,279 366 1,039Total 9141,834 431

Results
42
024681012141618
M 82
S. pennellii
1-1
1-2
1-3
1-4
2-1
2-2
2-3
2-4
2-5
3-1
3-2
3-3
3-4
3-5
4-1
4-2
4-3
4-4
5-3
5-4
5-5
6-1
6-2
6-4
7-1
7-2
7-3
7-4
7-5
8-1
8-2
8-3
9-1
9-2
9-3
10-1
10-2
11-1
11-2
11-3
11-4
12-1
12-2
12-3
12-4
***
2006
***
*** *
****
**
****
****
***
****
**
**
***
*
µmol Total AsA mg-1FW
024681012141618
M 82
F1 hybrid
3-5
5-3
6-3
7-3
7-4
8-2
9-1
9-1-2
9-1-3
9-2
9-2-5
9-2-6
12-4
***
***
***
***
***
***
**
2007
024681012141618
M 82
S. pennellii
F1 hybrid
1-1
1-2
1-3
1-4
2-1
2-2
2-3
2-4
2-5
3-1
3-2
3-3
3-4
3-5
4-1
4-2
4-3
4-4
5-3
5-4
5-5
6-1
6-2
6-3
6-4
7-1
7-2
7-3
7-4
7-5
8-1
8-2
8-3
9-1
9-1-2
9-1-3
9-2
9-2-5
9-2-6
9-3
10-1
10-2
11-1
11-2
11-3
11-4
12-1
12-2
12-3
12-4
***
****
**
****
***
***
***
**
2 ye
ars
aver
age
Intro
gre
ssio
n lin
e nu
mb
er
Fig
ure
3.5
To
tal
asco
rbat
eco
nte
nt
inri
pe
tom
ato
esfr
omS
.p
enn
elli
iIL
pop
ulat
ion,
pare
nta
llin
eS
.ly
cop
ersi
cum
cv.
M82
,an
din
ters
pec
ific
F1
hyb
rid.
Dat
ash
owed
are
refe
rred
totw
og
row
ing
seas
ons
(200
6-20
07)
with
thre
ere
plic
ap
erlin
eea
chye
ar.
Mea
nva
lue
and
stan
dard
erro
rar
ere
pre
sent
ed.
Ast
eris
ksin
dic
ate
ILs
accu
mul
atin
gfr
uit
asco
bat
ele
vels
stat
istic
ally
diff
eren
tfr
om
M82
atLS
Dpo
st-h
octe
st:
*:P
<0.
05;*
*:0.
01<
P<
0.05
;**
*:P
<0.
001.
**
*
µmol Total AsA mg-1FW µmol Total AsA mg-1FW

Results
43
The total AsA concentration in the fruit of the two ILs 7-3 (6.00 µmol g-1 FW)
and 12-4 (5.05 µmol g-1 FW) expressing a QTL was 69% and 43% higher than
the control, respectively. As observed for the AsA concentration, the highest
total AsA concentration was found in fruit from wild genotypes (Fig. 3.6)
Particularly, S. pimpinellifolium LA 2904 (6.11 µmol g-1 FW) showed an increase
statistically significant with a P<0.001.
3.1.4 Phenolic content
The average concentration of total phenolics in fruit from S.lycopersicum cv.
M82 was 0.99 µg gallic acid equivalents mg-1 FW, while fruit from the F1 hybrid
displayed an average total phenolics of 2.13 µg gallic acid mg-1 FW. One-way
ANOVA test displayed no significant interaction between genotype and year
(Tab 3.8).
µmol
Tot
al A
sAm
g-1FW
0
2
4
6
8
10
12
14
16
18
M 8
2
LA
1777
LA07
22
LA29
04
LA07
16
*** ***
Genotype
Figure 3.6 Total Ascorbic acid (AsA) content of ripe tomatoes fromwild accessions and S. lycopersicum cv. M82. Bars represent meanvalues and standard errors. Asterisks indicate difference statisticallysignificante at LSD post-hoc test for P<0.001 (***) compared to S.lycopersicum cv. M82. Three replicas per genotype were used.

Results
44
When we compare the ILs with M82 we detect a QTL controlling the
accumulation of total phenolics in the IL 7-3 (P <0.05) over two growing
seasons (2007 and 2008), with 71% increase content compared to S.
lycopersicum cv. M82, (Fig. 3.7).
0
0,5
1
1,5
2
2,5
3
M 8
2
F1 h
ybrid 3-
5
5-3
6-3
7-3
7-3-
1
7-4
8-2
9-1
9-1-
2
9-1-
3
9-2
9-2-
5
9-2-
6
10-1
12-3
12-4
µg g
allic
acid
mg-
1FW
Introgression line number
***
**
Figure 3.7. Total phenolics content of red ripe tomatoes from S. pennellii ILpopulation and S. lycopersicum var. M82 control. Data shown are comprehensivelyreferred to two growing seasons (2007-2008) with three replica per line each year. Meanvalue and standard error are represented. Asterisks indicate ILs accumulating fruit totalphenol levels statistically different from M82 at LSD post-hoc test: *: P<0.05; **: 0.01< P <0.05; ***: P<0.001.
Table 3.8 One-way ANOVA results of total phenolics in fruit from IL population andS. lycopersicum cv. M82 grown over two years trialsSource Sum of Square df Maen Square F PCorrected Model 10,571 26 0,407 6,71 0,00Year 0,092 1 0,092 1,51 0,22Genotype 8,469 22 0,385 6,35 0,00Year * Genotype 0,087 3 0,029 0,48 0,70Error 4,060 67 0,061Total 110,442 94
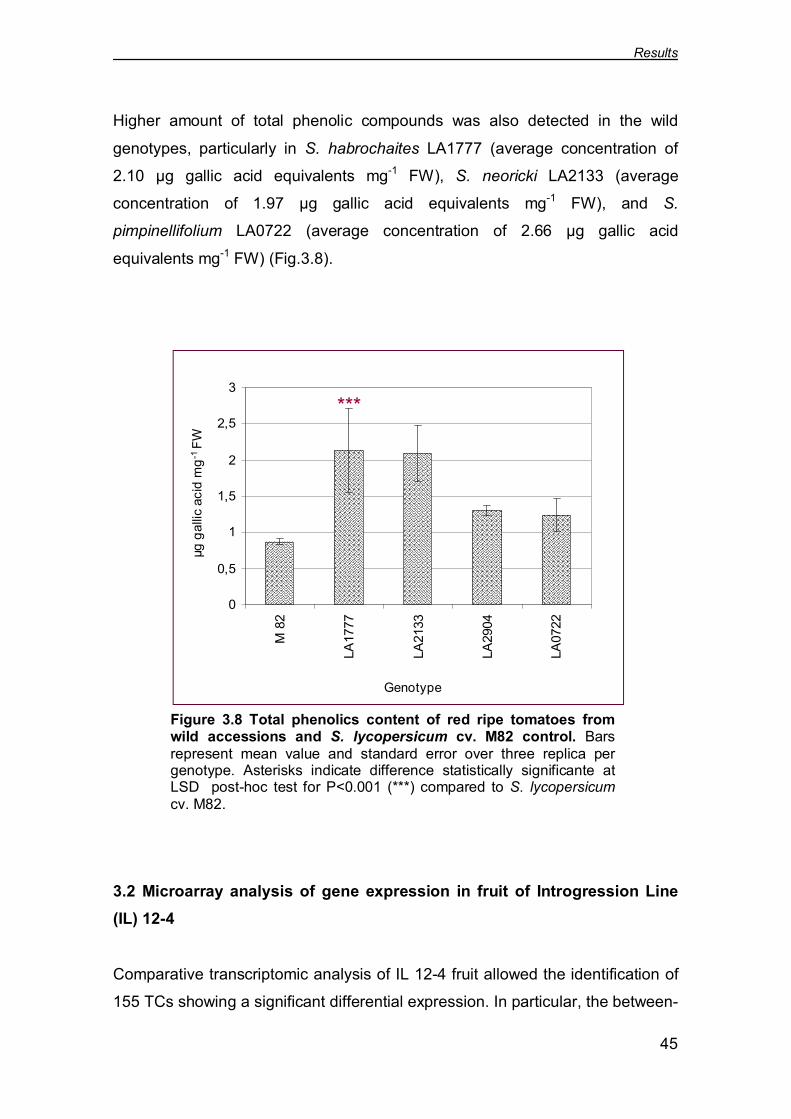
Results
45
Higher amount of total phenolic compounds was also detected in the wild
genotypes, particularly in S. habrochaites LA1777 (average concentration of
2.10 µg gallic acid equivalents mg-1 FW), S. neoricki LA2133 (average
concentration of 1.97 µg gallic acid equivalents mg-1 FW), and S.
pimpinellifolium LA0722 (average concentration of 2.66 µg gallic acid
equivalents mg-1 FW) (Fig.3.8).
3.2 Microarray analysis of gene expression in fruit of Introgression Line(IL) 12-4
Comparative transcriptomic analysis of IL 12-4 fruit allowed the identification of
155 TCs showing a significant differential expression. In particular, the between-
0
0,5
1
1,5
2
2,5
3
M 8
2
LA17
77
LA21
33
LA29
04
LA07
22
µg g
allic
acid
mg-1
FW
Genotype
***
Figure 3.8 Total phenolics content of red ripe tomatoes fromwild accessions and S. lycopersicum cv. M82 control. Barsrepresent mean value and standard error over three replica pergenotype. Asterisks indicate difference statistically significante atLSD post-hoc test for P<0.001 (***) compared to S. lycopersicumcv. M82.

Results
46
subject T-test identified 27 probe with higher hybridization signal and 128 with
lower signal compared to M82 fruit transcriptome (P<1%). The Volcano plot
(Fig. 3.9) shows the difference between the means of log2 M82 signal (groups
A) and log2 IL 12-4 signal (group B) for each gene plotted against the negative
log10 of the P-value.
Hierarchical clustering of all the differential transcripts were also grouped
according to their signal pattern.(Fig. 3.10). The tree allowed to indentify groups
of sequences showing similar expression profiles. Sequences annotated as
glutathione reductase (#Probe 11949) and glutathione s-transferase (#Probe
17266) were co-regulated with two transcription factors, (#Probe 138 and
Negative significance
-Log
10(P
)
Positive significanceMean (Group B) – Mean (Group A)
Figure 3.9 Volcano plot. The horizontal axis is the fold change between the twogroups (on a log scale, so that up and down regulation appear symmetric), and thevertical axis represents the negative log scale of the p-value for a t-test of differencesbetween samples. The first axis indicates biological impact of the change; the secondindicates the statistical evidence, or reliability of the change.

Results
47
#Probe 3573, respectively). Figure 3.11 shows a graphical categorization of
differentially expressed probes. According to cellular component GO vocabulary
terms the plastid category accounted for the largest group (29.13%) followed by
unknown genes (22.33%) and mitochondrion genes (14.56%). Similarly, in
categorization for molecular function GOs the largest group was represented by
unknown category (25.27%) and the second largest group was hydrolase
activity category (13.19%). Finally, categorization for biological process terms
allowed to assign most sequences to the unknown category (15.33%) followed
by cellular component organization and biogenesis (10.67%) and transport
category (10%). Table 3.9 lists differentially expressed probes, their BLAST
annotation, GO mapping, and the rate of transcriptional signal compared to the
M82 counterpart as resulted from microarray data processing.

Results
48
M822007
M822008
12-42007
12-42008
Figure 3.10 Hierarchical clusteringof 155 tomato fruit differentiallyexpressed genes in S. pennelli IL12-4. Each gene is represented by asingle row of colored boxes. Thetwelve columns represent the differentchip hybridization replica of twodifferent years. The color line abovethe samples indicates the expressionkey, the abundance of each gene inthe samples correlates with colorintensity, goin from green (down-regulates) to red (up-regulates).

Results
49
endoplasmic reticulumvacuoleribosomeplastidnuclear partcytoskeletonthylakoidcell wallcytosolmitochondrionplasma membraneunknown
1,94 1,94 10,68
29,13
1,942,913,88
1,942,91
14,56
5,83
22,33
transporter activitysignal transducer activityRNA bindinglipid bindingnucleotide bindingtranslation factor activity, nucleic acidDNA bindingkinase activityhydrolase activitytranscription regulator activitystructural molecule activityprotein bindingunknown
5,492,20 5,49
2,20
9,89
2,20
6,59
2,20
13,192,20
12,09
10,99
25,27
1,33 1,33 4,671,33
2,67
10,00
2,00
4,00
1,33
1,33
2,00
3,331,33
2,004,00
10,673,33
1,332,00
7,33
1,33
2,67
8,00
2,00
3,33
15,33
cellular homeostasiselectron transportlipid metabolic processDNA metabolic processcatabolic processtransportphotosynthesisprotein modification processrespons to external stimuluspost-embryonic developmentrespons to endogenous stimulusrespons to abiotic stimulusgrowthgeneration of precursor metabolites and energyamino acid and derivative metabolic processcellular component organization and biogenesistranscriptioncell cyclecarbohydrate metabolic processresponse to stresscell deathsecondary metabolic processtranslationembrionic developmentsignal transductionunknown
a)
b)
c)
Cellular component
Molecular function
Biological process
Figure 3.11 Categorization of 155 differentially expressed sequences provided throughtranscriptomic comparision of fruit from S. pennellii IL 12-4 and the parent line S.lycopersicum cv. M82. Corresponding GOs were classified for terms from: a) cellularcomponent; b) molecular function; and c) biological process vocabularies.

Results
50
Tabl
e 3.
9 Se
quen
ces
diff
eren
tially
exp
ress
ed in
the
frui
t fro
m IL
12-
4 co
mpa
re to
M82
.Pr
obe
#Fo
ld c
hang
ese
q de
scrip
tion
sim
mea
n#G
O ID
sEn
zym
e 1
2-4
vs. M
8213
480
-8,6
4zi
nc fi
nger
73,4
4%F:
GO
:000
5488
6199
-4,5
4fa
mily
pro
tein
80,6
5%C:
GO
:000
5739
C:G
O:0
0095
36 C
:GO
:001
6020
7378
-7,8
8pr
otei
n78
,55%
-10
834
-2,7
4ru
b1 c
onju
gatin
g en
zym
e91
,00%
F:G
O:0
0038
24 F
:GO
:000
5515
P:G
O:0
0195
38 P
:GO
:000
6464
EC:6
.3.2
.19,
5794
-3,3
1ac
0224
72_2
pigp
en p
rote
in fr
om m
us m
uscu
lus
gb69
,15%
C:G
O:0
0057
3773
556,
60--
-NA-
---
1320
32,
43tr
ypto
phan
syn
thas
e su
buni
t bet
a84
,55%
P:G
O:0
0090
58 P
:GO
:000
6519
F:G
O:0
0038
24 C
:GO
:000
9536
3373
-1,9
6ca
lmod
ulin
99,3
0%F:
GO
:000
5515
F:G
O:0
0054
88 P
:GO
:000
8150
1422
3-2
,93
ubc3
2 (u
biqu
itin-
conj
ugat
ing
enzy
me
32)
73,8
0%F:
GO
:000
3824
P:G
O:0
0064
64EC
:6.3
.2.1
9, u
biqu
itin-
prot
ein
ligas
e14
026
-1,8
0se
c14
cyto
solic
fact
or fa
mily
pro
tein
77,4
0%C:
GO
:000
5622
P:G
O:0
0068
10 p
hosp
hogl
ycer
ide
tran
sfer
fam
ily p
rote
in19
498
-1,4
5--
-NA-
---
-12
346
-3,4
5nu
cleo
tide
bind
ing
prot
ein
80,8
0%F:
GO
:000
0166
1817
8-4
,45
phlo
em-s
peci
fic le
ctin
60,6
0%P:
GO
:000
0003
P:G
O:0
0097
9014
715
-6,0
9sl
owm
o ho
mol
og 2
64,9
5%F:
GO
:000
3700
F:G
O:0
0054
88 C
:GO
:000
5654
P:G
O:0
0063
5017
017
-1,1
8qu
inon
e ox
idor
educ
tase
-like
pro
tein
84,1
0%P:
GO
:000
8152
C:G
O:0
0056
34 F
:GO
:000
5488
EC:1
.3.1
.74,
F:G
O:0
0038
24 P
:GO
:000
6950
1508
5-1
,79
60s
ribos
omal
pro
tein
bbc1
pro
tein
91,3
5%C:
GO
:000
5840
C:G
O:0
0058
29 P
:GO
:001
6043
EC:3
.6.5
.3,
F:G
O:0
0051
98 P
:GO
:000
6412
C:G
O:0
0057
3914
27-4
,47
gcn5
-rel
ated
n-a
cety
ltran
sfer
asef
amily
pro
tein
63,6
7%P:
GO
:000
8152
1299
6-0
,73
aldo
ket
o re
duct
ase
77,4
0%C:
GO
:001
6020
C:G
O:0
0095
36 C
:GO
:000
9579
F:G
O:0
0038
2436
8-1
,47
prot
ein
77,6
2%C:
GO
:000
9536
4798
-3,3
0zi
nc fi
nger
pro
tein
80,1
5%C:
GO
:000
5622
F:G
O:0
0036
77 F
:GO
:000
5488
P:G
O:0
0063
5058
09-1
,15
atp
synt
hase
sub
unit
h fa
mily
pro
tein
89,0
6%C:
GO
:001
6020
P:G
O:0
0068
10 P
:GO
:000
6091
EC:3
.6.3
.14,
P:G
O:0
0061
39 C
:GO
:000
5737
F:G
O:0
0001
66 F
:GO
:001
6787
F:G
O:0
0052
15 C
:GO
:000
5739
C:G
O:0
0056
2239
-1,3
0ho
moa
coni
tate
hyd
rata
se fa
mily
pro
tein
82,1
0%P:
GO
:000
8152
C:G
O:0
0095
3627
32-1
,25
---N
A---
75,5
5%F:
GO
:000
3674
P:G
O:0
0081
50-
7000
-1,7
2ac
0121
90_1
1 it
is a
mem
ber o
f an
86,4
5%-
unch
arac
teris
ed p
rote
in fa
mily
pf
1907
6-1
,39
ubiq
uitin
-ass
ocia
ted
ts-n
dom
ain-
cont
aini
ng p
rote
in72
,90%
F:G
O:0
0036
74 P
:GO
:000
8150
-65
08-4
,51
diac
ylgl
ycer
ol a
cyltr
ansf
eras
e57
,50%
C:G
O:0
0125
05 F
:GO
:000
3674
-28
24-1
,38
nucl
eotid
e-bi
ndin
g pr
otei
n90
,90%
C:G
O:0
0057
37 F
:GO
:000
0166
C:G
O:0
0056
3475
41-0
,84
smal
l nuc
lear
ribo
nucl
eopr
otei
n e
93,0
5%P:
GO
:000
6139
C:G
O:0
0056
22 F
:GO
:000
3723
1696
4-5
,17
prob
able
pho
tosy
stem
i ch
ain
xi p
recu
rsor
87,8
0%C:
GO
:001
6020
P:G
O:0
0060
91 P
:GO
:001
5979
C:G
O:0
0095
36 C
:GO
:000
9579

Results
51
Tabl
e 3.
9 (C
ontin
ued
from
pre
viou
s pa
ge.)
Prob
e #
Fold
cha
nge
seq
desc
riptio
nsi
m m
ean
#GO
IDs
Enzy
me
12-
4 vs
. M82
7634
-2,0
360
s ri
boso
mal
pro
tein
l29
92,9
5%C:
GO
:000
5840
P:G
O:0
0160
43 F
:GO
:000
5198
EC:3
.6.5
.3,
P:G
O:0
0064
12 C
:GO
:000
5739
1873
0-1
,59
non-
spec
ific
lipid
tran
sfer
pro
tein
77,5
0%P:
GO
:000
6950
F:G
O:0
0082
89 P
:GO
:000
6810
7763
5,80
---N
A---
--
1211
8-8
,43
glut
athi
one
s-tr
ansf
eras
e79
,60%
F:G
O:0
0167
40 P
:GO
:000
8152
P:G
O:0
0099
87EC
:2.5
.1.1
8,69
0-1
,16
elon
gatio
n fa
ctor
p82
,30%
C:G
O:0
0095
36 P
:GO
:000
6412
1063
04,
93--
-NA-
---
-16
602
-2,0
5po
tass
ium
cha
nnel
bet
a su
buni
t87
,55%
F:G
O:0
0038
24 F
:GO
:000
5215
P:G
O:0
0068
10C:
GO
:000
5739
C:G
O:0
0058
8619
914
7,49
hist
one
h2a
96,4
0%C:
GO
:000
5622
F:G
O:0
0036
77 P
:GO
:001
6043
F:G
O:0
0055
15 C
:GO
:000
5634
C:G
O:0
0095
3618
516
-1,1
9--
-NA-
--71
,75%
F:G
O:0
0036
74 P
:GO
:000
8150
-30
55-1
,63
lipoi
c ac
id s
ynth
etas
e87
,25%
P:G
O:0
0097
91 F
:GO
:001
6740
F:G
O:0
0054
88 F
:GO
:000
3824
EC:2
.8.1
.8,
P:G
O:0
0097
90 C
:GO
:000
9536
C:G
O:0
0057
39P:
GO
:004
0007
P:G
O:0
0090
58 P
:GO
:000
9987
1285
5-0
,80
---N
A---
79,0
0%F:
GO
:000
3674
C:G
O:0
0095
07-
1858
9-0
,92
glyc
osyl
hyd
rola
se fa
mily
17
prot
ein
64,5
5%F:
GO
:001
6787
C:G
O:0
0057
37 C
:GO
:000
5739
EC:3
.2.1
,C:
GO
:000
5886
P:G
O:0
0059
7517
793
-0,9
9ub
x do
mai
n-co
ntai
ning
pro
tein
63,9
5%F:
GO
:000
3674
C:G
O:0
0055
75-
1500
1-0
,91
at5g
1491
0 f2
g14_
3082
,58%
P:G
O:0
0068
10 C
:GO
:000
5739
C:G
O:0
0095
3614
293
-4,6
8pr
otei
n74
,45%
P:G
O:0
0064
6420
39-0
,92
60s
ribo
som
al p
rote
in l3
690
,65%
C:G
O:0
0058
40 F
:GO
:000
5198
P:G
O:0
0064
12EC
:3.6
.5.3
,C:
GO
:000
9536
P:G
O:0
0160
4391
49-0
,85
pde2
25 p
tac7
(pig
men
t def
ectiv
e 22
5)77
,47%
C:G
O:0
0095
3614
955
-0,7
4pr
olin
e im
inop
eptid
ase
82,1
0%F:
GO
:001
6787
EC:3
.4.1
1,14
392
1,91
tryp
toph
an s
ynth
ase
subu
nit b
eta
81,1
5%F:
GO
:000
3824
F:G
O:0
0054
88 P
:GO
:000
9058
EC:4
.2.1
.20,
P:G
O:0
0065
19 C
:GO
:000
9536
8738
-1,3
650
s ri
boso
mal
pro
tein
l13
84,3
0%C:
GO
:000
5840
F:G
O:0
0051
98 C
:GO
:000
9536
EC:3
.6.5
.3,
P:G
O:0
0064
12 P
:GO
:001
6043
1631
0-2
,70
tran
slat
iona
l ini
tiatio
n fa
ctor
194
,75%
F:G
O:0
0037
23 F
:GO
:000
8135
C:G
O:0
0095
36C:
GO
:000
5840
P:G
O:0
0160
43 P
:GO
:000
6412
1891
9-1
,13
ac02
2472
_2pi
gpen
pro
tein
from
mus
mus
culu
s gb
69,2
0%C:
GO
:000
5737
6969
-0,4
5ac
yl-t
hioe
ster
ase
ii73
,35%
P:G
O:0
0099
87 P
:GO
:000
6629
F:G
O:0
0167
8732
79-0
,99
---N
A---
75,1
3%F:
GO
:000
3674
-83
61-1
,76
rpt2
(roo
t pho
totr
opis
m 2
) pro
tein
bin
ding
65,6
0%C:
GO
:000
5634
F:G
O:0
0055
1512
089
-0,6
1le
ucin
e-ri
ch r
epea
t fam
ily p
rote
in67
,75%
F:G
O:0
0055
15 C
:GO
:000
5886
5341
-1,0
6py
roph
osph
ate-
depe
nden
t pho
spho
fruc
to-1
-kin
ase
87,0
5%F:
GO
:000
5515
C:G
O:0
0058
29 P
:GO
:000
5975
P:G
O:0
0060
91 P
:GO
:000
9056
C:G
O:0
0095
3619
288
-0,6
0--
-NA-
---
-

Results
52
Tabl
e 3.
9 (C
ontin
ued
from
pre
viou
s pa
ge.)
Prob
e #
Fold
cha
nge
seq
desc
riptio
nsi
m m
ean
#GO
IDs
Enzy
me
12-
4 vs
. M82
8150
-1,0
4xs
dom
ain
cont
aini
ngex
pres
sed
60,4
0%-
7673
-0,6
0am
plifi
ed in
ost
eosa
rcom
a63
,50%
C:G
O:0
0057
3715
758
0,28
squa
lene
syn
thas
e93
,10%
C:G
O:0
0160
20 C
:GO
:000
5783
F:G
O:0
0167
40EC
:2.5
.1.2
1,F:
GO
:000
3824
F:G
O:0
0054
88P:
GO
:000
9058
P:G
O:0
0099
87 P
:GO
:000
6629
P:G
O:0
0197
4818
935
1,04
---N
A---
--
9696
-1,4
1at
3g61
200
t20k
12_1
0067
,23%
F:G
O:0
0167
87 P
:GO
:000
9987
P:G
O:0
0066
2998
6-1
,90
fiber
pro
tein
fb2
69,6
0%C:
GO
:000
5634
F:G
O:0
0055
15 P
:GO
:000
7165
1865
20,
49--
-NA-
--76
,62%
C:G
O:0
0095
3613
471
-0,7
0or
nith
ine
amin
otra
nsfe
rase
86,3
5%P:
GO
:000
6950
P:G
O:0
0096
28 P
:GO
:000
6519
EC:2
.6.1
.13,
F:G
O:0
0054
88 F
:GO
:001
6740
C:G
O:0
0057
3916
693
-0,5
5al
pha
beta
fold
fam
ily p
rote
in74
,00%
C:G
O:0
0057
83 F
:GO
:001
6787
1102
9-2
,14
pto
kina
se in
tera
ctor
189
,35%
P:G
O:0
0064
64 F
:GO
:000
0166
F:G
O:0
0163
01 P
:GO
:000
6519
EC:2
.7.1
1, E
C:2.
7.10
,11
949
-0,7
9gl
utat
hion
e re
duct
ase
87,4
5%P:
GO
:000
9987
F:G
O:0
0038
24 F
:GO
:000
5488
F:G
O:0
0001
66EC
:1.8
.1.7
,P:
GO
:000
9628
P:G
O:0
0069
50 P
:GO
:000
9056
P:G
O:0
0062
59P:
GO
:000
9058
P:G
O:0
0059
75 P
:GO
0019
725
P:G
O:0
0070
49C:
GO
:000
9536
P:G
O:0
0061
18 P
:GO
:000
8152
1405
-1,6
5al
coho
l deh
ydro
gena
se81
,30%
F:G
O:0
0054
88 P
:GO
:000
8152
F:G
O:0
0038
2417
266
-0,8
8gl
utat
hion
e s-
tran
sfer
ase
79,9
0%P:
GO
:000
9056
P:G
O:0
0099
87 P
:GO
:001
9748
F:G
O:0
0167
40EC
:2.5
.1.1
8,P:
GO
:000
6950
P:G
O:0
0097
19 P
:GO
:000
7165
C:G
O:0
0095
36 P
:GO
:000
8152
F:G
O:0
0055
1512
870
0,73
---N
A---
73,0
0%-
5839
0,77
mem
bran
e re
late
d pr
otei
n cp
565
,30%
F:G
O:0
0036
74 P
:GO
:000
8150
-12
998
-0,4
3po
lyub
iqui
tin99
,50%
C:G
O:0
0056
34 P
:GO
:000
6464
3573
-0,8
1dn
a bi
ndin
g tr
ansc
ript
ion
fact
or87
,69%
C:G
O:0
0056
34 F
:GO
:000
3677
P:G
O:0
0063
5029
110,
54al
pha
tubu
lin99
,40%
P:G
O:0
0068
10 P
:GO
:001
6043
C:G
O:0
0055
75 F
:GO
:000
0166
EC:3
.6.5
.1, E
C:3.
6.5.
2,F:
GO
:001
6787
C:G
O:0
0058
56 F
:GO
:000
5198
EC:3
.6.5
.3, E
C:3.
6.5.
4,18
94-0
,73
atp
bind
ing
dom
ain
1mem
ber b
84,9
5%F:
GO
:000
0166
P:G
O:0
0097
90 C
:GO
:000
5856
P:G
O:0
0099
8775
68-0
,67
ribo
som
al p
rote
in l1
381
,25%
F:G
O:0
0051
98 C
:GO
:000
5840
P:G
O:0
0064
12EC
:3.6
.5.3
,C:
GO
:000
5739
P:G
O:0
0160
4358
10-1
,05
at5g
4067
0 m
nf13
_190
76,7
0%C:
GO
:001
6020
8017
-0,7
4m
rna
capp
ing
enzy
me
fam
ily p
rote
in74
,10%
F:G
O:0
0167
40 P
:GO
:000
6139
EC:2
.7.7
.50,
1336
2-2
,19
leuc
ine-
rich
repe
at re
cept
or-li
ke k
inas
e55
,05%
C:G
O:0
0056
2326
90-0
,62
prot
ein
68,0
0%F:
GO
:000
3674
P:G
O:0
0081
50-
6634
0,91
ac00
6341
_1es
ts g
b79
,05%
C:G
O:0
0057
3918
6-0
,78
bras
sino
ster
oid
sign
allin
g po
sitiv
e re
gula
tor-
rela
ted
72,0
0%C:
GO
:000
9536
2731
5,45
pero
xida
se 1
69,3
5%F:
GO
:000
5488
C:G
O:0
0057
37 F
:GO
:000
3824
P:G
O:0
0069
50EC
:1.1
1.1.
7,16
661
-1,1
9va
cuol
ar p
roce
ssin
g en
zym
e87
,50%
P:G
O:0
0195
38 P
:GO
:000
9987
C:G
O:0
0057
73EC
:3.4
.22.
34,
P:G
O:0
0082
19 C
:GO
:000
5829

Results
53
Tabl
e 3.
9 (C
ontin
ued
from
pre
viou
s pa
ge.)
Prob
e #
Fold
cha
nge
seq
desc
ripti
onsi
m m
ean
#GO
IDs
Enzy
me
12-
4 vs
. M82
1686
4-0
,87
3-hy
drox
yiso
buty
rate
deh
ydro
gena
se69
,50%
F:G
O:0
0054
88 P
:GO
:000
8152
P:G
O:0
0099
87 F
:GO
:000
3824
EC:1
.1.1
,16
721
-7,9
7at
3g16
910
k14a
17_3
81,9
0%C:
GO
:001
2505
-11
739
-0,7
2in
tegr
al m
embr
ane
prot
ein
84,0
5%C:
GO
:001
6020
F:G
O:0
0052
15 P
:GO
:000
6810
1824
3-1
,16
vap2
7-2
77,4
0%P:
GO
:000
6810
P:G
O:0
0099
87
1353
9-0
,95
unch
arac
teris
ed p
rote
in fa
mily
con
tain
inge
xpre
ssed
71,5
0%-
1658
-0,4
5se
rine
thre
onin
e pr
otei
n ki
nase
92,3
5%F:
GO
:001
6301
P:G
O:0
0064
6489
93-0
,86
dim
ethy
l-8-r
ibity
llum
azin
e sy
ntha
se p
recu
rsor
77,7
0%F:
GO
:001
6740
P:G
O:0
0090
58 P
:GO
:000
9987
EC:2
.5.1
.9,
C:G
O:0
0056
23 C
:GO
:000
9536
1790
7-0
,81
c9h6
orf1
15 p
rote
in85
,05%
F:G
O:0
0036
74 P
:GO
:000
8150
-35
04-0
,89
2-ph
osph
ogly
cera
te k
inas
e-re
late
d76
,00%
F:G
O:0
0036
74 C
:GO
:000
9507
-61
19-0
,38
prot
eina
se in
hibi
tor
i80
,45%
C:G
O:0
0055
76 F
:GO
:003
0234
P:G
O:0
0096
05P:
GO
:000
6950
F:G
O:0
0167
876
-1,2
7cy
toch
rom
e f
97,4
5%F:
GO
:000
3674
F:G
O:0
0054
88 C
:GO
:001
6020
C:G
O:0
0095
79P:
GO
:000
6810
C:G
O:0
0095
36 P
:GO
:001
5979
P:G
O:0
0061
1813
8-1
,10
tran
scri
ptio
n in
itiat
ion
fact
or71
,93%
-14
062
-0,7
9re
troe
lem
ent p
ol p
olyp
rote
in61
,55%
C:G
O:0
0057
3919
910
-1,5
4he
v b
367
,60%
F:G
O:0
0036
74 C
:GO
:000
5737
P:G
O:0
0069
50 P
:GO
:000
8150
-14
15-0
,68
atpa
se-li
ke p
rote
in78
,65%
C:G
O:0
0095
3616
774
-1,2
1ri
boso
mal
pro
tein
l18
79,7
0%C:
GO
:000
5840
P:G
O:0
0160
43 F
:GO
:000
5198
EC:3
.6.5
.3,
F:G
O:0
0037
23 P
:GO
:000
6412
C:G
O:0
0095
3610
417
2,39
pect
ines
tera
se fa
mily
pro
tein
60,0
0%C:
GO
:000
5618
1327
6-0
,52
calc
ium
-bin
ding
ef h
and
fam
ily p
rote
in83
,90%
C:G
O:0
0056
23 C
:GO
:000
5634
F:G
O:0
0054
8810
306
-0,7
9te
trat
ricop
eptid
e re
peat
dom
ain
554
,95%
F:G
O:0
0054
88 P
:GO
:000
6974
P:G
O:0
0062
81 C
:GO
:000
5634
-52
541,
05tp
a: a
-typ
e re
spon
se r
egul
ator
78,0
0%P:
GO
:000
7165
F:G
O:0
0036
77 F
:GO
:003
0528
F:G
O:0
0048
71 P
:GO
:000
9719
P:G
O:0
0063
5062
07-0
,70
---N
A--
--
-38
490,
58--
-NA
---
--
1927
2-0
,96
---N
A--
--
-10
183
-0,9
7--
-NA
---
46,0
0%-
1241
0-0
,73
chro
mod
omai
n he
licas
e dn
a bi
ndin
g pr
otei
n 1
53,0
0%F:
GO
:000
5488
1466
81,
22au
xin
influ
x ca
rrie
r pr
otei
n79
,50%
C:G
O:0
0160
20 P
:GO
:000
9719
P:G
O:0
0071
65P:
GO
:000
6810
C:G
O:0
0058
86 F
:GO
:000
5215
3389
-0,6
6ga
mm
a tu
bulin
84,3
5%C:
GO
:000
5635
F:G
O:0
0051
98 C
:GO
:000
5737
F:G
O:0
0001
66EC
:3.6
.5.1
, EC:
3.6.
5.2,
P:G
O:0
0096
53 P
:GO
:003
0154
P:G
O:0
0072
75EC
:3.6
.5.3
, EC:
3.6.
5.4,
P:G
O:0
0160
43 P
:GO
:000
7049
C:G
O:0
0055
75P:
GO
:000
6810
F:G
O:0
0167
87 C
:GO
:000
5886
P:G
O:0
0160
49 C
:GO
:000
5618
P:G
O:0
0097
91 C
:GO
:000
5856
2592
0,71
prol
ine-
rich
apg-
like
prot
ein
82,5
0%C:
GO
:000
5739
F:G
O:0
0167
87 P
:GO
:000
6629
EC:3
.1.1
, EC:
3.1.
1.1,

Results
54
Tabl
e 3.
9 (C
ontin
ued
from
pre
viou
s pa
ge.)
Prob
e #
Fold
cha
nge
seq
desc
riptio
nsi
m m
ean
#GO
IDs
Enzy
me
12-
4 vs
. M82
2380
-0,9
94-
nitr
ophe
nylp
hosp
hata
se-li
ke p
rote
in79
,10%
F:G
O:0
0167
87 C
:GO
:000
5634
C:G
O:0
0095
36EC
:3.1
.3.1
8,P:
GO
:000
8152
P:G
O:0
0099
8716
25-1
,20
got1
-like
fam
ily p
rote
in72
,84%
C:G
O:0
0160
20 P
:GO
:000
6810
P:G
O:0
0099
8716
090
-0,7
4va
cuol
ar s
ortin
g re
cept
or83
,64%
P:G
O:0
0195
38 C
:GO
:000
5737
C:G
O:0
0057
94 C
:GO
:001
6020
F:G
O:0
0167
87 F
:GO
:000
5488
F:G
O:0
0036
76 P
:GO
:000
6810
C:G
O:0
0058
86 P
:GO
:000
7165
P:G
O:0
0099
87 F
:GO
:000
4872
1180
7-0
,90
alan
ine
race
mas
e fa
mily
pro
tein
82,9
0%F:
GO
:000
5488
6599
-0,9
2at
3g22
430
mcb
17_1
769
,63%
-15
210
-0,8
4pr
otei
n92
,40%
C:G
O:0
0160
2015
942
0,66
---N
A--
--
-16
808
-0,4
3m
itoc
hond
rial s
ubst
rate
car
rier
fam
ily p
rote
in77
,25%
C:G
O:0
0160
20 C
:GO
:000
5739
P:G
O:0
0068
10 P
:GO
:000
9987
3617
-0,5
1he
para
nase
-like
pro
tein
2ex
pres
sed
67,3
0%C:
GO
:001
2505
-90
-1,1
5ch
loro
plas
t pho
tosy
stem
ii re
actio
n ce
nter
pro
tein
81,4
0%C:
GO
:001
6020
C:G
O:0
0095
36 C
:GO
:000
9579
F:G
O:0
0054
88 P
:GO
:001
5979
1256
40,
63ch
aper
one
prot
ein
dnaj
-rel
ated
-like
81,3
0%P:
GO
:001
6043
P:G
O:0
0090
58 P
:GO
:000
9987
P:G
O:0
0066
29 P
:GO
:001
9748
C:G
O:0
0095
3610
583
-1,2
9af
1906
34_1
udp-
gluc
ose:
63,3
0%F:
GO
:001
6740
P:G
O:0
0081
52 F
:GO
:001
6758
-sa
licyl
ic a
cid
gluc
osyl
tran
sfer
ase
C:G
O:0
0055
75 F
:GO
:001
6757
1662
3-0
,65
elon
gatio
n fa
ctor
bet
a-1
85,7
0%F:
GO
:000
8135
C:G
O:0
0057
37 C
:GO
:000
5840
P:G
O:0
0064
1219
108
-1,1
3rib
osom
al p
rote
in s
1496
,95%
C:G
O:0
0058
40 F
:GO
:000
5198
C:G
O:0
0095
36EC
:3.6
.5.3
,P:
GO
:000
6412
F:G
O:0
0037
23 P
:GO
:001
6043
1120
90,
56su
lfate
tra
nspo
rter
70,8
5%F:
GO
:000
5215
C:G
O:0
0160
20 P
:GO
:000
6810
1354
1,23
3-hy
drox
y-3-
met
hylg
luta
ryl c
oenz
yme
a sy
ntha
se90
,15%
P:G
O:0
0197
25 C
:GO
:001
6020
P:G
O:0
0081
52 P
:GO
:000
9056
EC:2
.3.3
.10,
P:G
O:0
0069
50 P
:GO
:000
9605
P:G
O:0
0096
28 F
:GO
:000
8289
F:G
O:0
0055
15 P
:GO
:000
9058
P:G
O:0
0099
87 P
:GO
:000
6629
P:G
O:0
0065
19 F
:GO
:001
6740
P:G
O:0
0081
5022
4-1
,70
orni
thin
e ca
rbam
oyltr
ansf
eras
e59
,80%
F:G
O:0
0167
40 F
:GO
:000
5488
C:G
O:0
0057
37 P
:GO
:000
6519
EC:2
.1.3
.3,
1136
9-1
,05
at5g
4569
0 m
ra19
_872
,50%
C:G
O:0
0095
3617
387
-0,5
9ho
mog
enti
sate
phy
tyltr
ansf
eras
e vt
e2-2
75,4
5%C:
GO
:001
6020
3774
-0,7
7rin
g-h2
fing
er p
rote
inex
pres
sed
72,6
0%-
1522
9-2
,19
cons
tans
-like
pro
tein
57,3
5%F:
GO
:000
5488
4601
-0,9
2ol
eosi
n lo
w m
olec
ular
wei
ght i
sofo
rm87
,00%
C:G
O:0
0057
37 C
:GO
:001
6020
P:G
O:0
0066
2917
200
-0,7
4an
thoc
yani
din
synt
hase
56,1
5%P:
GO
:001
9748
F:G
O:0
0038
24 P
:GO
:000
8219
EC:1
.14.
11,
5361
-0,6
8m
gc82
051
prot
ein
66,0
0%P:
GO
:001
6043
P:G
O:0
0301
54 P
:GO
:000
7275
1744
7-1
,67
---N
A--
-80
,05%
P:G
O:0
0069
5099
50-3
,70
dna
ligas
e iv
58,8
8%P:
GO
:000
9628
P:G
O:0
0069
50 F
:GO
:000
5515
P:G
O:0
0062
5925
53-4
,50
bzip
tran
scri
ptio
n fa
ctor
57,1
3%F:
GO
:000
3677
P:G
O:0
0063
5035
68-0
,47
rna-
bind
ing
prot
ein
69,8
5%F:
GO
:000
3723
C:G
O:0
0095
36 P
:GO
:000
6139
1014
20,
84--
-NA
---
--

Results
55
Tabl
e 3.
9 (C
ontin
ued
from
pre
viou
s pa
ge.)
Prob
e #
Fold
cha
nge
seq
desc
ript
ion
sim
mea
n#G
O ID
sEn
zym
e 1
2-4
vs. M
8274
40-0
,76
lg12
7 30
like
gen
e72
,25%
C:G
O:0
0125
05 P
:GO
:000
8150
C:G
O:0
0055
75-
1654
3-1
,15
syna
ptob
revi
n-lik
e pr
otei
n85
,20%
C:G
O:0
0160
20 C
:GO
:000
5773
P:G
O:0
0069
50P:
GO
:000
9628
P:G
O:0
0160
4317
912
-1,2
2m
onot
erpe
ne g
luco
syltr
ansf
eras
e71
,30%
F:G
O:0
0167
40 P
:GO
:000
8152
EC:2
.4.1
,33
53-0
,52
---N
A--
--
-14
932
-0,6
8ke
lch
repe
at-c
onta
inin
g f-
box
fam
ily p
rote
in74
,00%
F:G
O:0
0036
74 P
:GO
:000
8150
-33
27-1
,31
60s
ribo
som
al p
rote
in l1
799
,25%
C:G
O:0
0058
40 F
:GO
:000
5198
P:G
O:0
0064
12EC
:3.6
.5.3
,C:
GO
:000
5739
P:G
O:0
0160
4311
174
0,36
---N
A--
-87
,00%
-83
00-0
,62
rna
poly
mer
ase
ii as
soci
ated
pro
tein
368
,00%
P:G
O:0
0081
52 F
:GO
:001
6740
1431
2-0
,48
repl
icat
ion
fact
or c
sub
unit
383
,10%
F:G
O:0
0001
6614
065
-0,5
360
s ri
boso
mal
pro
tein
l27a
91,4
0%C:
GO
:000
5840
F:G
O:0
0051
98 P
:GO
:000
6412
P:G
O:0
0160
43EC
:3.6
.5.3
,17
394
0,52
---N
A--
--
-95
030,
93te
trac
yclin
e tr
ansp
orte
r65
,87%
C:G
O:0
0160
2016
501
-1,1
9ub
iqui
tin a
ssoc
iate
d ts
n do
mai
n co
ntai
ning
pro
tein
76,0
0%F:
GO
:000
3674
P:G
O:0
0081
50-

Results
56
3.3 AtCCD7 and AtCCD8 apocarotenoid volatile products
A variable amount of apocarotenoid volatiles were identified from the culture
head space collected from E. coli strains accumulating different carotenoids
also carring the construct for the expression of AtCCD7 and AtCCD8. As shown
in Figure 3.12, GGPP-accumulating strain produced 0.09 nmol OD-1 h-1 of 6-
methyl-5-hepten-2-one (MHO) and 0.10 nmol OD-1 h-1 of b-ionone as result of
the transformation with the double construct for AtCCD7 and AtCCD8. By
contrast trace levels of the others volatiles analyzed were found. On the other
hand very low level of all apocarotenoid volatiles analyzed were detected into
phytoene- and zeta-carotene-accumulating strains. Similarly, zeaxanthin-
accumulating strain showed low level of MHO and geranylacetone, whereas the
production of b-ionone was detected in 0.15 nmol OD-1 h-1 and pseudoionone in
0.11 nmol OD-1 h-1. Lycopene-accumulating E. coli produced the highest
production of MHO and pseudoionone reaching 0.65 nmol OD-1 h-1 and 0.55
nmol OD-1 h-1 respectively, but there was not production of geranylacetone, b-
ionone, and a-ionone. Only delta-carotene-accumulating strain provided a
considerable higher production of a-ionone (0.98 nmol OD-1 h-1). In addition it
showed a little less production of MHO and pseudoionone compared to the
lycopene-accumulating strain. Lastly, the beta-carotene-accumulating strain
provided the highest amount of b-ionone (2.58 nmol OD-1 h-1) and very low
production levels of others analyzed apocarotenoid volatiles.
To ensure that the proteins were expressed in the transformed E. coli strains a
protein blot analysis was performed after volatiles collection using His-tag
antibody and GST-tag antibody for AtCCD7 and AtCCD8, respectively. As
showed in Figure 3.13, AtCCD7 protein was not detected although the cleavage
products were present. By contrast the expression of AtCCD8 was confirmed.

Results
57
0
0,5
1
1,5
2
2,5
3
GGPP phytoene zeta-carotene lycopene delta-carotene beta-carotene zeaxanthin
nmol
OD
-1 h
-1
6-methyl-5-hepten-2-onegeranylacetone #1a-iononeB-iononepseudoionone
GGPP Phytoene Zeta-carotene Lycopene Delta-carotene Beta-carotene Zeaxanthin
Figure 3.12 Volatiles produced by carotenoid-accumulating E. coli strainstransformed for co-expression of AtCCD7 and AtCCD8 CDs. Volatiles werecollected from E. coli strains accumulating different carotenoids and harboring eitheran empty vector or the expression construct for AtCCD7 and AtCCD8. Separetion ofthe peaks was performed by GC and GC-MS. Bars showed the mean value of threeobservations and standard error.
b)
His-tag
GST-tag
a)
Figure 3.13 Protein blot analysis of AtCCd7 and AtCCD8expression. a) analysis of AtCCD8 expression postvolatilecollection using GST antibody, b) ) analysis of AtCCD7expression postvolatile collection using His antibody

Discussion
58
4. Discussion
4.1 QTLs for tomato fruit quality
In recent years, there has been much renewed interest in the possibility of
breeding not only higher yielding but also better quality crops. One potential
approach to this end is the combined use of transcriptional profiling and
introgression breeding. While there has been much interest in influencing fruit
size and shape as well as improving the organoleptic properties of tomato
(Frary et al., 2003; van der knaap et al., 2004; Chaib et al., 2006), nutritional
quality has largely been overlooked in tomato breeding programs. However, the
compositional fruit quality is receiving increasing interest, particularly given the
results of recent studies highlighting the nutritional importance of lycopene,
flavonoids, and chlorogenic acid in the human diet (Davuluri et al., 2005; Dixon,
2005; Niggeweg et al., 2006; Rein et al., 2006). Such improvements are
particularly important in tomato, since, in this species, the flavour components
associated with nutrition have been depleted through breeding (Goff and Klee,
2006; Morris and Sands, 2006). One such approach to identify genetic material
suitable for reintroducing these traits is the introgression approach, whereby
wild allelic variance is introduced back into cultivated species by marker-
assisted selection of a single chromosome segment substitutions (Zamir, 2001;
Giovannoni, 2006). In this study the AsA and phenols concentration, soluble
solids content and fruit firmness were evaluated in an IL population in which
marker-defined regions of the cultivated variety M82 (S. lycopersicum) are
replaced with homologous regions of wild species S. pennellii. The power for
identifying genomic regions that are significantly associated with quantitative
traits is higher in the ILs than in populations that segregate simultaneously for
multiple QTLs scattered throughout the genome, where independent loci can
mask the effect of one another through epistatic interaction (Schauer et al.,
2006). In the IL population, the lines are identical across their whole genome
except for a single introgressed region. As result, all of the phenotypic variation
is associated with the introduced segment and the efficiency for identifying

Discussion
59
individual QTLs is increased. In addition, owing to the permanent nature of the
population experiments are generally reproducible, thereby facilitating the
integration of data from independent groups.
QTL mapping became very popular in tomato genetics and breeding research,
where QTL have been identified for numerous agriculturally and biologically
important complex traits. Practically, it is difficult to provide a complete account
of all genes and QTLs that have been identified and/or mapped in tomato
chromosomes and the mapping population that have been used. Most mapping
populations have been based on interspecific crosses between the cultivated
tomato and relative wild species. In fact, almost all wild species of tomato have
been used for gene and/or QTL mapping, although with different frequencies. In
particular, the S. pennellii interspecific introgression lines population were
shown to be powerful material to dissect plant yield and fruit quality (Eshed and
Zamir, 1995; Eshed et al., 1996). This population has already been used for
mapping candidate genes and QTLs for carotenoids (Liu et al., 2003), fruit
weight and composition in sugars and acids (Causse et al., 2004), antioxidant
compounds (Rousseaux et al., 2005), volatiles aromas (Tadmor et al., 2002) or
various metabolites (Schauer et al., 2006). In the current study, the S. pennellii
ILs population has been used to identify QTL underlying tomato fruit quality
composition that could be used in a breeding program aimed to pyramiding
desirable characteristic in a single elite variety. The levels annual variability of
the different biochemical compounds in the ILs compared in this study point to
the importance of making multiple-year comparisons to establish the QTL
stability and the role of exogenous factors such as environment. Many studies
reported that most of the traits of interest have a continuous variation, strongly
influenced by environmental conditions. Temperature and light intensity exert a
direct influence on the QTL expression, indeed find the location of such QTL is
only the first step, and for “target breeding“ the underlying physiological
consequences of genetic variation needs to be defined in terms of specific and
general adaptation, so that varieties can be “tuned” to their target environment
(Snape et al., 2007). Our results are in agreement with findings reported in
literature. Indeed, as concern the QTL detected for each characteristic, some of
them have already been related, whereas other have not been mentioned. On

Discussion
60
the other hand, some QTL already well-known for fruit AsA content and °brix
has not been found in our experimental conditions. Moreover, given the strong
effect of the seasons, the expression of a certain phenotypic characteristic was
not detected every year.
Total soluble solids
Within soluble solids determinants, sucrose, glucose, and fructose are the major
sugars found in tomato fruit with high hexose accumulation being characteristic
of domesticated tomato (S. lycopersicum). Together with quinic and citric acid,
these compounds are the principal quality components for processing tomatoes,
determining the soluble solids content or °Brix index (Carrari and Fernie 2006).
The genetic bases of the sucrose-accumulation trait of the wild species tomato
has highly been studied by means of introgressing wild germoplasms into
domesticared cultivars (Yelle et al., 1991; Fridman et al., 2000, 2004). With a
large range of variation for fruit composition, several QTLs for sugar and acid
content have been mapped (Causse et al., 2002, 2004; Fulton et al., 2002;
Lecomte et al., 2004). Eshed and Zamir (1995) have evaluated 50 of the S.
pennelli ILs in Israel, and reported a minimum number of 23 QTLs for °brix
content. These results were compared with those obtained in France with the
same subset of ILs. Fewer QTLs were detected in France but, eight among the
nine soluble solids content QTLs found were also detected in Israel (Eshed and
Zamir 1995). In our work 8 QTLs that increase the °brix content were found,
most of them shared with results from Eshed and Zamir (1995). In addition,
°brix QTLs detected in our experiment also overlapping those identified by
Causse and colleagues (2004) in a S. pennelli population grown in the
southeast France. Moreover, summarizing all data available in literature S.
pennelli alleles increased the line mean for all the sugar-related QTLs, whereas
positive and negative alleles were found for acids. In particular, Fulton and co-
workers (2002) found in several interspecific populations that wild alleles
increased the sugar content for the majority of QTLs, whilst both positive and
negative effects were found for organic acids. In this study for the first time a
negative QTL for total soluble solids was detected. The comparison with other

Discussion
61
QTL approaches for acid and sugar-related traits (Sabila-Colombani et al.,
2001; Fulton et al., 2002) revealed a few chromosomal regions where QTLs for
the same trait could be found in different populations. Some QTLs controlling
acid or sugar-related traits were observed in the same bin regions in seven
cases for acids and in four cases for sugars (Fulton et al., 2002).
By contrast to results from many studies aimed to look for °brix QTLs in S.
pennellii IL population the IL 9-2-5 did not show a positive QTL for total soluble
solids in our experimental conditions. A detailed biochemical characterization of
vegetative and fruit tissues of this introgression line carrying the Lin5 wild allele
and harbouring the moderate °brix QTL was recently reported (Baxter et al.,
2005a). Finding of an increased capacity of IL 9-2-5 to take up sucrose from the
phloem adds physiological support to the conclusions drawn by Fridman and
colleagues (2004) concerning the key role played by the apoplastic invertase
LIN5.
Fruit firmness
The fruit morphology and the combination of diverse tissues play a crucial role
in fruit texture of which firmness is one of the mainly traits involved (Dupart et
al., 1991). In the face of such complexity, very few studies have described fruit
texture as a whole (Seymuor et al., 2002). Most studies have focused on a
single aspect of the fruit texture (Liebhard et al., 2003), and more specifically on
cell wall properties (Waldron et al., 2003; Devaux et al., 2005; Brummell, 2006).
Indeed, a decline in fruit firmness typically coincides with dissolution of the
middle lamella, depolymerization, and solubilization of hemicellulosic and pectic
cell wall polysaccharides and, in some cases, wall swelling (Brummell and
Harpster, 2001). Finally, genetic control of such traits in tomato is poorly
understood (Fulton et al., 2000; Doganlar et al., 2002; Frary et al., 2003). In
order to improve our understanding of the physical component involved in
changes of fruit texture the fruit firmness of the S. pennelli IL population was
analyzed using instrumental measurements, which inform about the mechanical
properties of the fruit. Five negative QTLs corresponding to a decrease of fruit
firmness were detected. One of them showed by IL 9-1-5. QTLs for fruit

Discussion
62
firmness (evaluated by a penetrometer) on chromosome 9 and 4 have been
previously detected (Sabila-Colombani et al., 2001) in a population of RILs
derived from the cross between a cherry tomato line S. lycopersicum var.
cerasiforme (Cervil) and a round larger-fruited tomato line S. lycopersicum
(Levovil). Moreover, QTLs for fruit firmness on chromosome 4 and chromosome
9 were detected in the same regions as fruit firmness (evaluated by hand
squeezing) QTLs detected in crosses with S. pimpinellifolium (Tanksley et al.,
1996) and S. peruvianum (Fulton et al., 1997). Recently, results from two QTL-
NILs population showed that the idividual effect of QTLs 4 and 9 on texture
parameters were generally not significant in QTL-NILs compared with the
parental lines (Chaib et al., 2007). Conversely, significant individual effect on
firmness was observed for the QTL located on chromosome 9 in the VilB
genetic background. The same effect was not detected in a previous study by
Chaib and co-workers (2006). These results demonstrated the impact of genetic
background and/or environment on the expression of texture-related QTLs and
possible interactions between them. This lack of consistency of QTLs for
firmness was in part explained by the different instrumental methods that were
used in the determination of the firmness. Moreover, such variation, confirm that
firmness interacts strongly with environmental conditions such as year of
cultivation or location (Bernacchi et al., 1998; Chaib et al., 2006).
Ascorbic acid
AsA is essential for cardiovascular function, immune cell development,
connective tissue, and iron utilization. Although plants and most animals can
synthesize ascorbic acid, humans lack L-gulono-1,4-lactone oxidoreductase
activity, which is required for the final step in AsA synthesis. Because AsA
cannot be synthesized and stored in the human body, the vitamin must be
acquired regularly from dietary sources (Zou et al., 2005). Tomatoes are an
important source of water-soluble antioxidant, particularly AsA. Due to the high
consumption levels of tomatoes and the substantial ascorbic acid content
(approximately 4 mg/100 g FW), these fruit represent a major contribution to
dietary nutrition worldwide (Willcox et al., 2003). In the present work fruit AsA

Discussion
63
concentration in the ILs population exhibited the typical distribution of
quantitative traits that are controlled by several QTLs. To our knowledge, no null
mutants have been identified for AsA content in fruit, and only four mutant loci
have been identified in Arabidopsis after an ozone screen (Conklin et al., 2000).
Of these mutants, vtc1 corresponds to a mutation in the GMP gene (Conklin et
al., 1999), and the positional cloning of the vtc2 mutation led to an unknown
protein. The vtc4 mutant has been recently shown to encode L-Gal-1-P
phosphate, a plant AsA biosynthetic enzyme (Conklin et al., 2006). These
mutants contain reduced levels of AsA, and no null mutants are found,
presumably because plants without ascorbate would not be viable. In tomato,
by screening 118 M82 tomato mutant families, a few mutants with reduced or
increased fruit ascorbic acid content compared to M82 have been identified
(Stevens et al., 2006). Fruit from the 118 families contained between 6.1 and
31.4 mg ascorbic acid per 100 g fresh weight, which is similar to the range of
natural variation observed in the population studied here. Indeed, in the S.
pennellii IL population the AsA content ranging from 8.85 to 24.3 mg ascorbic
acid per 100 g of fresh weight. Improvement of AsA content may be a target for
tomato breeders. Improvement of vitamin content in species of agronomic
interest is cited as an important criterion (Agius et al., 2003; Dalvuluri et al.,
2005; Paine et al., 2005). Moreover, it is interesting to note that the total AsA
(i.e. reduced + oxidized forms) showed the same trend of the ascorbate in the
ILs analyzed. Indeed, fruit from IL with a higher AsA content also displayed a
higher total AsA concentration, leading to a completely overlapping of the two
analysis. For this reason, in the year 2008, the total AsA content of the IL
population was not analyzed. The total AsA pool measured in tomatoes in this
study reflects what a consumer would expect when eating a fresh tomato. The
presence of several transgressive lines has revealed the potential use of the
wild relatives to improve this trait. When we compare our QTLs controlling the
AsA content with those already related in literature contrasting results were
obtained. Probably because as shown by Toor and collegues (2006) fruit AsA
content is highly influenced by the environment. Moreover, the experimental
conditions for measuring the trait may be subject to variation. Indeed, analysis
of the same IL population grown over two years in Israel for a range of fruit

Discussion
64
metabolites showed 4 positive QTLs for AsA, of which only 1 (IL 12-4) was
common with our study (Schauer et al., 2006). In a previously work focused on
IL population grown over two years in California (Rousseax et al., 2005), AsA
content was analyzed, and positive QTL was detected in IL12-4, as in our
research. Negative QTL were also found in 5 ILs, of which 1 (IL 10-1) was
common with the present results. Moreover, Rousseaux and co-workers (2005)
did not detect any AsA in S. pennelli fruit. On discussing this result they also
associated it to the extraction procedure carried out by grinding fresh fruit on
ice. They mention that by grinding fresh fruit in liquid nitrogen S. pennelli fruit
AsA levels were restored to 1.9 mg per 100 g, which is still slightly lower that
our value. This result is also in disagreement with reported average AsA
concentration in S. pennellii ripe fruit of 71 mg per 100 g of FW (Stevens et al.,
2007). Consistent with higher fruit AsA concentration in S. pennellii, other
papers showed this specie as a good source of vitamins (Schauer et al., 2005)
confirming the potential of wild species as a source of genetic variation to bring
up crop improvement (Fernie et al., 2006). In agreement with these latter , our
results showed an average AsA concentration of 37.2 mg per 100 g of FW in S.
pennellii red ripe fruit. High AsA levels were also found in the other wild species
analyzed. Noteworthy as S. pennellii fruit remain green over ripening, it is
difficult to evaluate its ripe stage. So the incorrect identification of the ripe stage
may be cause of wide differences observed.
Analysis of the same IL population grown in France for three years led to the
detection of 12 QTLs for fruit total ascorbic acid content (reduced + oxidized
forms) (Stevens et al., 2007). Of these QTLs none was common to QTLs
detected in our study. Given that a complete overlapping of AsA and total AsA
QTLs was found in the IL population, contrasting results from different studies
may be due to the sample selection. Indeed, our quantification was performed
on fruit including pericarp and depleted of locular jelly, seeds, and colummella.
Conversely, Stevens and colleagues (2007) used whole fruit in their study,
detecting higher concentrations of ascorbic acid in the locular jelly than in the
pericarp of M82 at the red ripe stage.
Recently, fourteen genes associated with tomato ascorbic acid biosynthesis and
metabolism were mapped (Zou et al., 2006). The gene map included 15 loci,

Discussion
65
mapping on nine chromosomes. Most of the genes were mapped on
introgressed regions already known to contain QTL for fruit AsA content.
Total phenols
Despite tomato is the principal source in human diet of phenolic compounds,
such as flavonoids and hydroxycinnamic acids, and evidences for their
beneficial properties as health-promoting compounds (Duthie and Crozier,
2000; Pietta, 2000; Nijveldt et al., 2001), only limited data are available on their
occurrence and distribution in tomatoes. In tomato, most of the studies for
phenolic compounds have been focused on over-expression of the genes
encoding biosynthetic enzymes (Verhoeyen et al., 2002), or transcription factors
(Bovy et al., 2002), or by suppressing regulatory gene (Davuluri et al., 2005).
Phenolic compounds present in different tomatoes were evaluated in fruit
samples from nine commercial varieties finding a range of distribution from
259.15 to 498.60 mg Kg-1 FW (Martinez-Varlverde et al., 2002). These values
are tipycal of the extractable phenolic concentration seen in other fruit and
vegetables, that can vary from 2 to 500 mg Kg-1 (Scalbert and Williamson,
2000). The IL population showed a total phenols concentration ranging from
740 to 1700 mg Kg-1 FW. Observed inconsistency may be explained because
there is no single analytical method that, collectively and accurately, is able to
measure the total polyphenol content of a food. Reason for this, include the
structural diversity found amongst phenolic compounds and the large variation
in content depending on the nature of the food and the plant part from which it
derives (Bravo, 1988). The total phenolics assay used in our experiments, as
well as in the quoted study, usually overestimates the content of phenolic
compounds, since other reducing agents present in the food, can interfere.
Moreover, the distribution of phenolic compounds in tomatoes varies greatly
between the various parts of the plant, at the organ, tissue and cellular level
(Scalbert and Williamson, 2000). Martinez-Varlverde and co-workers (2002)
assayed whole fruit without distinguish between the different parts of the fruit,
whereas we assayed the fruit depleted of the locular jelly, seeds and
colummella. Also cultural and environmental factors may affect phenolic

Discussion
66
concentration, as showed by Raffo and colleagues (2006) reporting on
variations in phenol levels associated with seasonal influences.
Moreover, in contrast to the relative abundant information on QTL for
carotenoids, fruit weight and composition in sugars and acids, and various
metabolites in tomato fruit, very little has been done about QTL for phenolic
compounds in tomato and particularly in IL populations. As far as we know, in
only one previous report focused on S. pennellii IL population (Rousseax et al.,
2005), phenol content was analyzed leading to the identification of nine QTLs,
one positive QTL and eight negative QTLs. In the present work one positive
QTL (IL 7-3) controlling phenol content was detected but, it was not the same
found by Rousseaux and colleagues (2005). Reasons of this inconsistency may
be probably due to different environmental conditions used in the trails.
The phenols content of wild accessions of tomato was also analyzed. They all
displayed higher phenolics content than cultivated tomato confirming the value
of wild species as source of natural variability to improve fruit quality. The
metabolic profiles of leaves and fruit of S. lycopersicum and five wild species
tomatoes that can be crossed with this elite variety (S. pimpinellifolium, S.
neorickii, S. habrochaites, S. chmielewskii, and S. pennellii) has been reported
by Schauer and colleagues (2005). A tremendous variance in metabolite
content in both leaves and fruit of the wild species was showed. In particular,
wild species showed higher levels of metabolic variation in fruit than in leaves,
probably due to the higher degree of morphological variation in these organs.
So far it is evident that these wild species represent a valuable resource to
increase tomato nutritional properties.
4.2 Comparative transcriptomic analysis
Physical and chemical assay performed on S. pennellii IL population allowed
the identification of QTLs involved in fruit organoleptic and nutritional traits. In
particular, the IL 12-4 displayed at the same time a QTL for increased fruit AsA
concentration and a QTL for decrease fruit firmness. To identify transcripts (or
cluster of transcripts) involved in the higher AsA content and lower fruit firmness
Discussion
67
showed by IL 12-4 compared to S. lycopersicum cv. M82, and gain insight into
the role of transcriptional regulation in tomato fruit a comparative microarray
analysis on COMBIMATRIX TomatoArray1.0 was performed.
Tomato genomic resources have been widely exploited for developing new
microarray-based technologies. Many arrays are currently available worldwide
for tomato transcriptome analysis, each combining different technologies and
properties. TOM1 array was developed by the Center for Gene Expression
Profiling (CGEP) of the Boyce Thompson Institute for Plant Research and made
publicly available. Each spot on its glass slide corresponds to a single unigene.
Each gene was random selected from different cDNA libraries including a range
of tissues as leaf, root, fruit, and flower. Recently, the CGEP has released the
new tomato array TOM2. Tomato transcriptome analysis is also feasible using
the Affymetrix GeneChip Tomato Genome Array wherein sequence information
was selected from public data sources including S. lycopersicum UniGeneBuild
#20 (October 3, 2004) and GenBankR mRNAs up to November 5, 2004. TOM1,
TOM2 and Affimetrix arrays have already been used for functional genomics
studies, whose results are available at the Tomato Functional Genomics
Database website (http://ted.bti.cornell.edu). On the other hand, Agilent tomato
gene expression microarrays are synthesized on demand as custom
microarrays. Finally, TomatArray1.0 provides through COMBIMATRIX
technology combines phosphoramidite chemistry and semiconductors to
digitally control probe synthesis at the chip surface. The 90k TomatArray1.0
contains 90,000 siliceous electrodes (features) overall supporting 20200 in situ
synthesized DNA probes with 4 replications. Probes have been designed to
match specifically with 21550 Tentative Consensus (TCs) from TIGR database
S. lycopersicum Gene Index Release 11.0 (June 21, 2006). Combimatrix slides
can be easily stripped and re-hybridized 4 to 6 times, so economizing the costs
of experiments.
The tomato transcriptomic analysis through Combimatrix chip led to the
identification of 155 differentially expressed sequences between IL 12-4 and
M82. Actually, the expansion in the use of functional genomics technologies,
such as microarray experiments, in biological research had specific
consequences in computational biology. Functional interpretation is a key step

Discussion
68
in the analysis of this data which cannot be done without the availability of
extensive functional annotation of the datasets. This makes standardized
functional annotation essential. The most widespread and probably most
extensive functional annotation schema for gene and protein sequences is the
Gene Ontology (GO) (Ashburner et al., 2000) which has become the standard
in nearly all public data-bases. The accurate assignment of functional
information to gene products is a complex, laborious and time-consuming task
often performed manually. Moreover, the functional annotation of
uncharacterized sequences is the balance between accuracy and intensity. All
these elements have been driving guidelines in the development of Blast2GO
application (Gotz et al., 2008). Indeed, through Blast2GO bioinformatic suite,
blast annotation, GO mapping, and graphical categorization of all different
expressed sequences can be performed automatically. Using Blast2GO
program, categoritation of the 155 differentially expressed transcripts was
performed. In particular, cellular component categorization showed that the
largest groups of transcripts belonged to the mitochondrion and plastid
category. From the literature we know that ascorbate occurs in the cytosol,
chloroplasts, vacuoles, mitochondria and cell wall (Rauten-Kranz et al., 1994).
Indeed, AsA is present at high-millimolar levels in all subcellular
compartements; in particular, it is found in chloroplasts, at concentrations of 20
mM or more (Ishikawa and Shigeoka, 2008). It has also become apparent that
AsA has multiple roles in metabolism particularly as an in vitro electron donor
for photosynthetic and mitochondrial electron transport (Smirnoff, 1996).
Moreover, it is interesting to note, amongst the differentially expressed
sequences, the presence of two down-regulated glutathione-s-transferase (#
Probe 17266 and 12118), and one up-regulated peroxidase (# Probe 2731)
(Tab. 3.9). Indeed, AsA pool size is the result of the balance between the rates
of synthesis/catabolism and turnover. Turnover results from further metabolism
or from oxidation followed by non-enzymatic degradation. AsA is readily
oxidized to monodehydroascorbate (MDA) as part of its antioxidant function.
Oxidation is catalysed by two enzymes: ascorbate peroxidase (APX) and
ascorbate oxidase (AO). MDA disproportionates to dehydroascorbate (DHA)
and AsA if it is not immediately reduced. DHA is unstable above pH 7 and

Discussion
69
irreversibly delactonizes to 2,3-diketogulonate (Loewus, 1988; Smirnoff, 1995).
Under normal circumstances the AsA pool is at least 90% reduced. This is
achieved by the action of two enzymes: NAD(P)-dependent
monodehydroascorbate reductase (MDAR) and glutathione (GSH)-dependent
DHAR. The observation that reduced glutathione (GSH) was capable of
reducing DHA to AsA led Foyer and Halliwell (1976) to propose a role of GSH in
the regeneration of AsA. Recycling of GSH is achieved by glutathione reductase
reducing glutathione disulphide (GSSH) by consumption of NADPH: In contrast,
glutathione transferase reduce the GSH level leading to an increase of GSSH.
Probably, the results obtained from comparative transcriptomic analysis may
indicate an involvement of a reduced activity of the glutathione transferases in
enabling more GSH availability for the regeneration of AsA.
Also, microarray data can potentially be used to identify regulatory genes
associated with coordinating expression of the pathways of interest (Janseen et
al., 2008) such as, in this study, AsA metabolism. Indeed, using hierarchical
clustering, two transcription factors (# Probe 3573 and 138) (Tab. 3.9) were
identified with a similar expression pattern to glutathione reductase (# Probe
11949) and glutathione transferase (# Probe 17266) both down-regulates into IL
12-4.
Finally, sequences annotation allowed to identify a pectin-methyl esterase (#
Probe 10417) among the up-regulates differentially expressed genes probably
involved in the different AsA content and fruit firmness showed by IL12-4.
Besides previous evidences (Carrari et al., 2006) focused on the central role of
the Smirnoff-Wheeler pathway (Wheeler et al., 1998) in the tomato fruit
ascorbate control, alternative AsA pathway (Valpuesta and Botella, 2004) may
lead to metabolic modifications of AsA level observed into IL 12-4. These
include processing involving D-glucurono-1-4-lactone (GlcUL), D-galacturonate
(GalUA), methyl D-galacturonate (MeGalUA), and L-gulono-1,4-lactone (GulL),
putative intermediates first considered by Isherwood et al., (1954) and more
recently, in the case of GulL, in transformed plants (Jain and Nessler, 2000)
(Fig. 4.1)

Discussion
70
In particular, feeding experiments using precursors have shown that the methyl
ester of D-galacturonic acid causes a significant increase in the L-ascorbic acid
content of cress seedlings and Arabidopsis cultured cells (Davey et al., 1999). It
is also known that D-galacturonic acid-1-14C is metabolized to L-ascorbic acid-
6-14C by an inversion pathway in detached ripening strawberry fruit (Loewus
and Kelly, 1961). A uronic acid pathway that accommodates both findings, the
Figure 4.1 Biosynthetic pathways of L-ascorbic acid in animals (reactions 1–8) and plants (reactions 9-24). Enzymes catalyzing the numbered reactions are:1, phosphoglucomutase; 2, UDP-glucose pyrophosphorylase; 3, UDP-glucosedehydrogenase; 4, glucuronate-1-phosphate uridylyltransferase; 5, glucuronokinase; 6, glucuronate reductase; 7, aldono-lactonase; 8, gulono-1,4-lactonedehydrogenase; 9, glucose-6-phosphate isomerase; 10, mannose-6-phosphateisomerase; 11, phosphomannomutase; 12, GDP-mannose pyrophosphorylase(mannose-1-phosphate guanylyltransferase); 13, GDP-mannose-30,50-epimerase;14, phosphodiesterase; 15, sugar phosphatase; 16, L-galactose dehydrogenase;17, L-galactono-1,4-lactone dehydrogenase; 18, methylesterase; 19, D-galacturonate reductase; 20, aldono-lactonase; 21, phosphodiesterase; 22, sugarphosphatase; 23, L-gulose dehydrogenase; 24, myo-Inositol oxygenase.
24
24
135’ epimerization 3’-5’ epimerization
TRENDS in Plant Science (Valpuesta and Botella, 2004).

Discussion
71
role played by methyl ester of D-galacturonic acid as precursor and the
occurrence of an inversion pathway in some plant tissues, was previously
proposed (Smirnoff et al., 2001). Molecular evidences for this pathway came
with the cloning and characterization of a D-galacturonic acid reductase from
strawberry fruit (Agius et al., 2003). In this pathway, pectin-derived D-
galacturonic acid is reduced to L-galactonic acid, which in turn is spontaneously
converted to L-galactono-1,4 lactone. This compound is the substrate of the L-
galactono-1,4-lactone dehydrogenase enzyme (Fig. 4.1, yellow background). It
is likely that the flux through this branch is dependent upon the availability of the
substrate D-galacturonate. This compound appears as a product of the turnover
of cell wall pectins in senescing cells. D-glucuronic acid, can follow two
pathways in plant cells, either the biosynthesis of L-ascorbic acid or the supply
of precursors for the synthesis of cell wall polymers such as pectin and
hemicellulose (Loewus and Murthy, 2000).
That said, we supposed that the higher AsA content of the IL 12-4 compared to
M82 may also be due to the increased pectin-methyl esterase activity leading to
a major availability of AsA precursors (Fig. 4.2). This would also explain the less
fruit firmness showed from IL 12-4. Indeed, the primary plant cell wall consists
of cellulose, hemicellulose, pectin and proteins (Carpita and Gibeaut, 1993).
Cellulose and hemicellulose are the main load-bearing polysaccharides in the
cell wall, maintaining the cell shape and turgor pressure. Pectin is not load
bearing, but may control the mobility and access of enzymes to load-bearing
hemicellulose molecules (.Blamey, 2003; Filisetti-Cozzi and Carpita, 1991;
Konno et al., 1999; and Ma et al., 1999), thereby modulating cell elongation.
Pectin contains negatively charged galacturonic acid residues, which contribute
to the cell wall cation exchange capacity. Cation binding to pectin therefore
affects the charge, pH, swelling behaviour (pore size) and buffer capacity of the
cell wall. This can have direct effects on the mobility of cell wall-degrading
enzymes and cell elongation (Cosgrove, 2000). Modifications in cell wall
polymers are intricate and considered to involve the co-ordinated and
interdependent action of a range of cell wall-modifying enzymes and proteins
such as polygalacturonase (PG), pectin-methyl esterase (PME), β-
galactosidase, α-L-arabinofuranosidase, endo-(1,4) β-D-glucanase, expansin,

Discussion
72
and xyloglucan endotransglycosylase (Brummell and Harpster, 2001). Given
that, the breaking up of cell wall by pectin-methyl esterase activity may lead to
the release of galacturonic acid with consequences for both fruit firmness and
AsA accumulation.
Currently, efforts are being undertaken to validate the differential transcriptional
profile of single mRNA by Real-Time qPCR. Further investigations, by means of
functional analysis, will focus on testing the hypothesis that fruit ascorbate
biosynthetic flux may increase through the poligalacturonate pathway.
24
24
135’ epimerization 3’-5’ epimerization
modified from TRENDS in Plant Science
Figure 4.2 Proposed involvement of pectin-methyl esterase activity intoAsA biosynthetic pathwas.

Discussion
73
4.3 AtCCD7 and AtCCD8 cleave multiple carotenoids to generate
apocarotenoid volatiles
In recent years, a family of enzymes that cleave carotenoid substrates at
different double positions have been described in plants. This family, the
carotenoid cleavage dioxigenases (CCDs), are specific for the location of
double bond in the molecule they cleave, but many are promiscuous in their
carotenoid substrate choice and for other the specific substrate is still unclear
(Auldridge et al., 2006). Particularly, the hypothetical proteins AtCCD7 and
AtCCD8 are the most disparate members of this protein family in Arabidopsis. It
has been shown that two carotenoid cleveage dioxygenases, LeCCD1A and
LeCCD1B, can cleave multiple linear and cyclic carotenoids at the 9,10 position
generating geranylacetone, pseudoionone, and b-ionone. Antisense reduction
of the tomato genes led to ~50% reduced emissions of geranylacetone and b-
ionone, confirming roles of these enzymes. By contrast, no QTLs for any of
these volatiles was associated with the map positions of LeCCD1A or
LeCCD1B in the S. pennellii IL population. Despite great importance has been
given to these enzymes because of their involvement in the production of
important fruit flavour volatiles as geranylacetone, pseudoionone, and b-ionone
(Tieman et al., 2006), their biochemical characterization is an important step in
identifying the biologically active products. Previous finding demonstrated that
AtCCD7 cleave multiple carotenoid substrates leading to the mainly production
of the apocarotenoid volatile b-ionone (Booker et al., 2004; Schwartz et al.,
2004). Different studies indicated that CCD1 and CCD7 have similar activities,
the former oxidatively cleaving multiple carotenoids symmetrically at the 9,10
and 9’,10’ positions and the latter only at the 9,10 position (Booker et al., 2004;
Schwartz et al., 2001, 2004). Conversely, studies carried out in the Klee’s
laboratory (University of Florida), tested the activity of AtCCD8 on carotenoid
substrates by expressing the Arabidopsis CCD8 genomic sequence in E. coli
strains engineered to accumulate b-carotene, lycopene or zeaxanthin. When
expression of AtCCD8 was induced, accumulation of each of these carotenoids
was significantly reduced. Despite this reduction in carotenoid accumulation the
cleavage product was not detected, either by HPLC analysis of cell or growth

Discussion
74
media extracts or by gas chromatography analysis of the collected volatiles
(unpublished data). Moreover, because the max3 and max4 mutants in A.
thaliana resulted from lesions in AtCCD7 and AtCCD8 genes, and both mutants
display a dramatic increase in lateral branching (Booker et al., 2004), it is likely
that the two gene products function in the same pathway. For these reasons, a
construct for the co-expression of AtCCD7 and AtCCD8 was transformed into
the carotenoid-accumulating strains.
Particularly, to determine the substrate specificities and bond cleavage
preferences of AtCCD7 and AtCCD8, we undertook a systematic analysis of the
volatile products generated by the enzymes in various carotenoid-accumulating
strains of E. coli, because the volatile products are indicative of these cleavage
activities (Tab. 4.1).
Besides the protein expression analysis did not detect the AtCCD7 protein in
the double engineered strains, the presence of the final products derived from
AtCCD7 activity was enough to suppose that the gene was expressed.
Work by Schwartz and colleagues (2004) showed the presence of a new C9
product in experiment of co-expression of the two genes AtCCD7 and AtCCD8,
but this product has not yet been identified. Referring to the Table 4.1, the
results indicate a preferential substrate for AtCCD7 enzyme. In particular, given
Table 4.1 Volatiles predicted to be generated by carotenoid cleavage at various bond positions
5,6 or 5',6' 7,8 or 7',8' 9,10 or 9',10'GGPP 6-Methyl-5-hepten-2-one GeranylacetonePhytoene 6-Methyl-5-hepten-2-one Geranylacetoneζ-Carotene 6-Methyl-5-hepten-2-one GeranylacetoneLycopene 6-Methyl-5-hepten-2-one Citral Pseudoiononeδ-Carotene Citral α-Ionone, pseudoiononeβ-Carotene β-Cyclocitral β-IononeZeaxanthin 3-Hydroxy-β-cyclocitral 3-Hydroxy-β-ionone
Position of the double bond

Discussion
75
the so high production of b-ionone in beta-carotene-accumulating strain, we
could state the preferential 9,10 or 9’,10’ bond cleavage of AtCCD7 protein
using beta-carotene as substrate, such as already reported in literature.
Unfortunately, we did not detected any new volatile compound as expected
from the cleavage action of AtCCD8. It is likely that the product was further
catabolised in E. coli, as it has been previously observed by others von Lintig
and Vogt (2000).

Conclusion
76
5. Conclusion
The objective of this study was to identify genomic regions involved in the
control of tomato fruit quality traits. In particular, this study focused on fruit
antioxidant and soluble solids content and fruit firmness. Also, aimed to
elucidate molecular mechanisms of the phenotypic variation. Evaluated traits
showed a continuous distribution over wide ranges in genetic resources tested.
Total soluble solids varied from 3.07 °Brix to 6.5 °Brix on average. Fruit
firmness ranged from 25.14 N mm-2 to 15.48 N mm-2. AsA and phenols content
ranged, from 0.51 µmol g-1 FW to 1.40 µmol g-1 FW, and from 0.76 µg gallic acid
equivalents mg-1 FW to 1.28 µg gallic acid equivalents mg-1 FW, respectively.
Moreover, IL fruit with physical and chemical properties significantly different
from the M82 parental line, were detected. In particular, eight QTLs for total
soluble solids, five QTLs for fruit firmness, four QTLs for AsA content and one
QTL for total phenols content were identified.
Wild introgressions showed to be effective either in increasing and decreasing
AsA, whereas only increasing and decreasing effects, respectively for total
phenols and fruit firmness, were detected. As resulted from the phenotypic
profiling, the IL 12-4 showed at the same time a QTL for increased fruit AsA
content and a QTL for reduced fruit firmness. This IL was selected for
comparative transcriptomic analysis aimed at the identification of transcripts
underlying the phenotypic difference observed. In particular, microarray
hybridization was performed on the Combimatrix 90K TomatArray1.0 slides.
This chip was designed and synthesized on Combimatrix platform to the Center
for Plant Functional Genomics of the University of Verona in the frame of a
collaboration with Prof. Massimo Delledonne and Prof. Mario Pezzotti.
Comparative transcriptomic of IL12-4 fruit allowed the identification of
transcripts potentially relevant to AsA biosynthesis and cell wall metabolism in
tomato fruit. Among all, a differential hybridization signal was observed for:
· two glutathione s-transferase (# Probe 17266 and 12118), and one
glutathione reductase (#Probe 11949) that were down-regulated
· one peroxidase (# Probe 2731) up-regulated
· one pectin-methyl esterase (# Probe 10417) up regulated

Conclusion
77
Currently, validation of expression patterns through Real-Time qPCR are in
progress and further functional characterization of differential expressed
sequences will help in elucidating their involvement in fruit quality-related traits.
However, the identification of ILs carrying QTLs for fruit quality traits, suggest
strategies for improving tomato through introgression breeding by pyramiding
desirable characteristic in a single elite variety.
In addition, two available sequences, AtCCD7 and AtCCD8, previously involved
in the apocarotenoid volatiles metabolism, were functionally investigated
through co-expression in E. coli. Results provided evidences for the preferential
substrate for AtCCD7 enzyme. In particular, given the so high production of b-
ionone in b-carotene-accumulating E. coli strain, it was possible to state the
preferential 9,10 or 9’,10’ bond cleavage of AtCCD7 protein using b-carotene as
substrate, such as already reported in literature. Unfortunately, we did not
detected any new volatile compound as expected from the cleavage action of
AtCCD8 had been detected. It is likely that the product was further catabolised
in E. coli, as this was previously observed.

78
Acknowledgements
Many thanks to prof. Luigi Frusciante, who supervised my activities concerning
the PhD project.
Particular thanks to Antonio Di Matteo, who directed my work and helped me to
develop the analysis and experimental procedures and to prof. Amelie Barone
for her willingness and suggestions.
I’m grateful to all members of Frusciante’s group, who have played a decisive
role in supporting me.
Also to my family, who always stand by me.

References
79
6. References
Abbott J.A. (2004). Textural quality assessment for fresh fruits and vegetables. Qualityof Fresh and Processed Foods 542, pp. 265–279.
Agius F., Gonzalez-Lamothe R., Caballero J.L., Munoz-Blanco J., Botella M.A.,Valpuesta V. (2003). Engineering increased vitamin C levels in plants byoverexpression of a Dgalacturonic acid reductase. Nat Biotechnol 21, pp. 177–181.
Arrigoni O., De Tullio M.C. (2002). Ascorbic acid: much more than just an antioxidant.Biochim Biophys Acta 1569, pp. 1–9.
Ashburner M., Ball C.A., Blake J.A., Botstein D., Butler H., Cherry J.M., DavisA.P., Dolinski K., Dwight S.S., Eppig J.T. (2000). Gene ontology: tool for theunification of biology. The Gene Ontology Consortium. Nat. Genet. 25, pp.25–29.
Auldridge M.E., McCarty D.R., Klee H.J. (2006). Plant carotenoid cleavageoxygenases and their apocarotenoid products. Curr. Opin. Plant Biol. 9, pp. 315–321.
Bai Y., Lindhout P. (2007). Domestication and Breeding of Tomatoes: What have WeGained and What Can We Gain in the Future? Annals of Botany 100, pp. 1085–1094.
Batu A. (1998). Some Factors Affeting on Determination and Measurement of TomatoFirmness. J. of Agriculture and Forestry 22, pp. 411–418.
Baxter C.J., Carrari F., Bauke A., Overy S., Hill S.A., Quick P.W., Fernie A.R.,Sweetlove L.J. (2005a). Fruit carbohydrate metabolism in an introgression line oftomato with increased fruit soluble solids. Plant and Cell Physiology 46, pp. 425–437.
Ben Chaim A., Borovsky E., De Jong W., Paran I. (2003). Linkage of the A locus forthe presence of anthocyanin and fs10.1, a major fruit-shape QTL in pepper. Theor ApplGenet 106, pp. 889–894
Bernacchi D., Beck-Bunn T., Emmatty D., Eshed Y., Inai S., Lopez J., Petiard V.,Sayama H., Uhlig J., Zamir D., Tanksley S.D. (1998). Advanced backcross QTLanalysis of tomato. II. Evaluation of near isogenic lines carrying single-donorintrogressions for desirable wild QTL-alleles derived from Lycopersicon hirsutum and L.pimpinellifolium. Theor. Appl. Genet. 97, pp. 170–180.
Blamey F.P.C. (2003). A role for pectin in the control of cell expansion. Soil Sci. PlantNutr. 49, pp. 775–783.
Booker J., Auldridge M., Wills S., McCarty D., Klee H., Leyser O. (2004).MAX3/CCD7 is a carotenoid cleavage dioxygenase required for the synthesis of anovel plant signaling molecule. Curr Biol 14, pp. 1232–1238.
Bovy A., de Vos R., Kemper M., Schijlen E., Pertejo M.A., Muir S., Collins G.,Robinson S., Verhoeyen M., Hughes S., Santos-Buelga C., van Tunen A. (2002).High-Flavonol Tomatoes Resulting from the Heterologous Expression of the MaizeTranscription Factor Genes LC and C1. Plant Cell. 14, pp. 2509–2526.
Bravo L. (1988). Polyphenols: chemistry, dietary sources, metabolism and nutritional

References
80
significance. Nutr Rev 56, pp. 317-333.
Brouwer D.J., St Clair D.A. (2004). Fine mapping of three quantitative trait loci for lateblight resistance in tomato using near isogenic lines (NILs) and sub-NILs. Theor ApplGenet 108, pp. 628–638.
Brummell D.A., Harpster M.H. (2001). Cell wall metabolism in fruit softening andquality and its manipulation in transgenic plants. Plant Molecular Biology 47, pp. 311–340.
Brummell DA. (2006) Cell wall disassembly in ripening fruit. Functional Plant Biology33 103–119.
Carpita N.C., Gibeaut D.M. (1993). Structural models of primary cell walls in floweringplants: consistency of molecular structure with the physical properties of the wallsduring growth. Plant J. 3, pp. 1–30.
Carrari F., Baxter C., Usadel B., Urbanczyk-Wochniak E., Zanor M., et al. (2006).Integrated analysis of metabolite and transcript levels reveals the metabolic shifts thatunderlie tomato fruit development and highlight regulatory aspects of metabolicnetwork behavior. Plant Physiol. 142, pp. 1380–1396.
Carrari F., Fernie A.R. (2006). Metabolic regulation underlying tomato fruitdevelopment. Journal of Experimental Botany 57, pp. 1883–1897.
Causse M., Buret M., Robini K., Verschave P. (2003). Inheritance of nutritional andsensory quality traits in fresh market tomato and relation to consumer preferences.Journal of Food Science 68, pp. 2342–2350.
Causse M., Duffe P., Gomez M.C., Buret M., Damidaux D., Zamir D., Gur A.,Chevalier M., Lemaire-Chamley M., Rothan C. (2004). A genetic map of candidategenes and QTLs involved in tomato fruit size and composition. Journal of ExperimentalBotany 403, pp. 1671–1685.
Causse M., Saliba-Colombani V., Lecomte L., Duffe P., Rousselle P., Buret M.(2002). QTL analysis of fruit quality in fresh market tomato: a few chromosome regionscontrol the variation of sensory and instrumental traits. Journal of Experimental Botany53, pp. 2089–2098.
Chaib J., Lecomte L., Buret M., Causse M. (2006). Stability over geneticbackgrounds, generations and years of quantitative trait locus (QTLs) for organolepticquality in tomato. Theor. Appl. Genet. 112, pp. 934–944.
Chen Z., Young T.E., Ling J., Chang S.C., Gallie D.R. (2003). Increasing vitamin Ccontent of plants through enhanced ascorbate recycling. Proc Natl Acad Sci USA 100,pp. 3525–3530.
Concibido V.C., La Vallee B., McLaird P., Pineda N., Meyer J., Hummel L., Yang J.,Wu K., Delannay X. (2003). Introgression of a quantitative trait locus for yield fromGlycine soja into commercial soybean cultivars. Theor Appl Genet 106, pp. 575–582.
Conesa A., Götz S., García-Gómez J.M., Terol J., Talón M., Robles M. (2005).Blast2GO: a universal tool for annotation, visualization and analysis in functionalgenomics research. Bioinformatics 21, pp. 3674-3676.

References
81
Conklin P.L., Gatzek S., Wheeler G.L., Dowdle J., Raymond M.J., Rolinski S.,Isupov M., Littlechild J.A., Smirnoff N. (2006). Arabidopsis thaliana VTC4 encodesL-galactose-1-P phosphatase, a plant ascorbic acid biosynthetic enzyme. J Biol Chem281, pp. 15662–15670.
Conklin P.L., Norris S.R., Wheeler G.L., Williams E.H., Smirnoff N., Last R.L.(1999). Genetic evidence for the role of GDP-mannose in plant ascorbic acid (vitaminC) biosynthesis. Proc Natl Acad Sci USA 96, pp. 4198–4203.
Conklin P.L., Saracco S.A., Norris S.R., Last R.L. (2000). Identification of ascorbicacid-deficient Arabidopsis thaliana mutants. Genetics 154, pp. 847–856.
Cosgrove D.J. (2000). Expansive growth of plant cell walls. Plant Physiol. Biochem.38, pp. 109–124.
Cunningham F.X., Gantt E. (2001). One ring or two? Determination of ring number incarotenoids by lycopene ε-cyclases. PNAS 98, pp. 2905-2910.
Cunningham F.X., Gantt E. (2007). A portfolio of plasmids for identification andanalysis of carotenoid pathway enzymes: Adonis aestivalis as a case study.Photosynthesis Research 92, pp. 245–259
Davey M.W., Gilot C., Persiau G., Ostergaard J., Han Y., Bauw G.C., Van MontaguM.C. (1999). Ascorbate biosynthesis in Arabidopsis cell suspension culture. PlantPhysiol. 121, pp. 535–543.
Davuluri G.R., van Tuinen A., Fraser P.D., Manfredonia A., Newman R., BurgessD., Brummell D.A., King S.R., Palys J., Uhlig J., et al (2005). Fruit-specific RNAi-mediated suppression of DET1 enhances carotenoid and flavonoid content intomatoes. Nat Biotechnol 23, pp. 890–895.
Devaux MF, Barakat A, Robert P, Bouchet B, Guillon F, Navez B, Lahaye M.(2005). Mechanical breakdown and cell wall structure of mealy tomato pericarp tissue.Postharvest Biology and Technology 37 209–221.
Dixon R.A. (2005). Engineering of plant natural product pathways. Curr. Opin. PlantBiol. 8, pp. 329–336.
Doebley, J. (2006). Plant science. Unfallen grains: How ancient farmers turned weedsinto crops. Science 312, pp. 1318–1319.
Doganlar S, Frary A, Ku HM, Tanksley SD. (2002) Mapping quantitative trait loci ininbred backcross lines of Lycopersicon pimpinellifolium (LA1589). Genome 45, pp.1189–1202.
Doganlar S., Frary A., Tanksley S.D. (2000). The genetic basis of seedweightvariation: tomato as a model system. Theoretical and Applied Genetics 100, pp. 1267–1273.
Duthie G., Crozier A. (2000). Plant-derived phenolic antioxidants. Current Opinion inLipidology 11, pp. 43–47.

References
82
Eshed Y., Gera G., Zamir D. (1996). A genome-wide search for wild-species allelesthat increase horticultural yield of processing tomato. Theoretical and Applied Genetics93, pp. 877–886.
Eshed Y., Zamir D. (1995). An introgression line population of Lycopersicon pennelliiin the cultivated tomato enables the identification and fine mapping of yield-associatedQTLs. Genetics 141, pp. 1147–1162.
FAOSTAT (2005). FAOSTAT statistics division. FAOSTAT/Food and AgricultureOrganization of the United Nations. Vol. 2007.
Fernie, A.R., and Willmitzer, L. (2004). Carbohydrate metabolism. In The Handbookof Plant Biotechnology, P. Christou and H.K. Klee, eds (Chichester, UK: Wiley), pp.1230–1262.
Fernie, A.R., Tadmor, Y., Zamir, D. (2006). Natural genetic variation for improvingcrop quality. Curr. Opin. Plant Biol. 9, pp. 196–202.
Filisetti-Cozzi T.M.C.C., Carpita N.C. (1991). Measurement of uronic acids withoutinterference from neutral sugars. Anal. Biochem. 197, pp. 157–162.
Finkers R., van Heusden A.W., Meijer-Dekens F., van Kan J.A., Maris P., LindhoutP. (2007). The construction of a Solanum habrochaites LYC4 introgression linepopulation and the identification of QTLs for resistance to Botrytis cinerea. Theor ApplGenet 114, pp. 1071–1080.
Foolad M.R. (2007). Genome Mapping and Molecular Breeding of Tomato. Int J PlantGenomics pp. 1–52.
Foyer C.H., Halliwell B. (1976). The presence of glutathione and glutathionereductase in chloroplasts: a proposed role in ascorbic acid metabolism. Planta 133, pp.21–25.
Frary A, Doganlar S, Frampton A, Fulton T, Uhlig J, Yates H, Tanksley S. (2003)Fine mapping of quantitative trait loci for improved fruit characteristics fromLycopersicon chmielewskii chromosome 1. Genome 46, 235–243.
Frary A., Doganlar S. (2003). Comparative genetics of crop plant domestication andevolution. Turkish Journal of Agricultural Forestry 27, pp. 59–69.
Frary A., Fulton T.M., Zamir D., Tanksley S.D. (2004). Advanced backcross QTLanalysis of a Lycopersicon esculentum × L. pennellii cross and identification of possibleorthologs in the Solanaceae. Theor Appl Genet 108, pp. 485–496.
Fraser P.D., Bramley P.M. (2004). The biosynthesis and nutritional uses ofcarotenoids. Prog Lipid Res 43, pp. 228–265.
Fridman E., Carrari F., Liu Y.S., Fernie A.R., Zamir D. (2004) Zooming in on aquantitative trait for tomato yield using interspecific introgressions. Science 305, pp.1786–1789.
Fridman E., Pleban T., and Zamir D. (2000). A recombination hotspot delimits a wild-species quantitative trait locus for tomato sugar content to 484 bp within an invertase
References
83
gene. Proceedings of the National Academy of Sciences of the United States ofAmerica 97, pp. 4718–4723.
Fridman E., Zamir D. (2003). Functional divergence of a syntetic invertase gene familyin tomato, potato, and Arabidopsis. Plant Physiol. 131, pp. 603–609.
Fry S.C. (1998). Oxidative scission of plant cell wall polysaccharides by ascorbate-induced hydroxyl radicals. Biochem J 332, pp. 507–515.
Fulton T.M., Bucheli P., Voirol E., Lopez J., Pétiard V., Tanksley S.D. (2002).Quantitative trait loci (QTL) affecting sugars, organic acids, and other biochemicalproperties possibly contributing to flavor, identified in four advanced backcrosspopulations of tomato. Euphytica 127, pp. 163–177.
Fulton TM, Beck-Bunn T, Emmatty D, Eshed Y, Lopez J, Petiard V, Uhlig J, ZamirD, Tanksley SD (1997) QTL analysis of an advanced backcross of Lycopersiconperuvianum to the cultivated tomato and comparisons with QTLs found in other wildspecies. Theor Appl Genet 95, 881–894.
Fulton TM, Grandillo S, Beck-Bunn T, Fridman E, Frampton A, Lopez J, Petiard V,Uhlig J, Zamir D, Tanksley SD. (2000) Advanced backcross QTL analysis of aLycopersicon esculentumxLycopersicon parviflorum cross. Theoretical and AppliedGenetics 100, 1025–1042.
Garcia-Martinez S., Andreani L., Garcia-Gusano M., Geuna F., Ruiz J.J. (2005).Evolution of amplified length polymorphism and simple sequence repeats for tomatogermplasm fingerprinting: utility for grouping closely related traditional cultivars.Genome 49, pp. 648–656.
Georgé S., Brat P., Alter P., Amiot M.J. (2005). Rapid determination of polyphenolsand vitamin C in plant derived products. J Agric Food Chem. 53, pp. 1370–1373.
Gilliland, L.U., Magallanes-Lundback, M., Hemming, C., Supplee, A., Koornneef,M., Bentsink, L., and Dellapenna, D. (2006). Genetic basis for natural variation inseed vitamin E levels in Arabidopsis thaliana. Proc. Natl. Acad. Sci. USA 103, pp.18834–18841.
Giovannoni J.J. (2006). Breeding new life into plant metabolism. Nat. Biotechnol. 24,pp. 418–419.
Giovannucci E., Ascherio A., Rimm E., Stampfer M., Colditz G., Willett W. (1995).Intake of carotenoids and retinol in relationship to risk of prostate cancer. J Natl CancerInst 87, pp. 1767– 1776.
Giuliano G., Aquilani R., Dharmapuri S. (2000). Metabolic engineering of plantcarotenoids. Trends Plant Sci 5, pp. 406–409.
Godt D.E., Roitsch T. (1997). Regulation and tissue-specific distribution of mRNAs forthree extracellular invertase isoenzymes of tomato suggests an important function inestablishing and maintaining sink metabolism. Plant Physiol. 115, pp. 273–282.
Goff S., Klee H. (2006). Plant Volatile Compounds: Sensory Cues for Health andNutritional Value? Science 311, pp. 815–819.

References
84
Götz S., Miguel J., Gómez G., Terol J., Williams T.D., Nagaraj S.H., Nueda M.J.,Robles M., Talón M., Dopazo J. and Conesa A. (2008). High-throughput functionalannotation and data mining with the Blast2GO suite. Nucleic Acids Research 36, pp.3420–3435.
Gould W.A. (1992). Tomato Production, Processing, and Technology. CTI Publishing,Baltimore, MD.
Green M.A., Fry S.C. (2005). Vitamin C degradation in plant cells via enzymatichydrolysis of 4-Ooxalyl- L-threonate. Nature 433, pp. 83–87.
Griffiths R.I., Whiteley A.S., O'Donnell A.G., Bailey M.J. (1999). Rapid Method forCoextraction of DNA and RNA from Natural Environments for Analysis of RibosomalDNA- and rRNA-Based Microbial Community Composition. Applied and EnvironmentalMicrobiology 66, pp. 5488–5491.
Grotewold E. (2006). The genetics and biochemistry of floral pigments. Annu RevPlant Biol. 57, pp. 761–80.
Grotte M., Cadot Y., Poussier A., Loonis D., Piétri E., Duprat F., Barbeau G.(2001). Détermination du degré de maturité des baies de raisin par des mesuresphysiques: aspects méthodologiques. J. Int. Sci. Vigne Vin 35, pp. 87–98.
Harker F.R., Redgwell R.J., Hallett I.C., Murray S.H., Carter G. (1997). Texture offresh fruit. Horticultural Reviews 20, pp. 121–224.
Harrigan G.G., Stork L.G., G. Riordan S., Reynolds T.L., Ridley W.P., MasucciJ.D., MacIsaac S., Halls S.C., Orth R., Smith R.G., Wen L., Brown W.E., Welsch M.,Riley R., McFarland D., Pandravada A., Glenn K.C. (2007a). Impact of genetics andenvironment on nutritional and metabolite components of maize grain. J. Agric. FoodChem. 55, pp. 6177–6185.
Horemans N., Foyer C.H., Asard H. (2000). Transport and action of ascorbate at theplant plasma membrane. Trends Plant Sci 5, pp. 263–267.
Isherwood F.A., Chen Y.T., Mapson L.W. (1954b). Synthesis of L-ascorbic acid inplants and animals. Biochemical Journal 56, pp. 1–15.
Ishikawa T., Shigeoka S. (2008). Recent Advances in Ascorbate Biosynthesis and thePhysiological Significance of Ascorbate Peroxidase in Photosynthesizing Organisms.Bioscience Biotechnology and Biochemistry 72, pp. 1143–1147.
Iuchi S., Kobayashi M., Taji T., Naramoto M., Seki M., Kato T., Tabata S., KakubariY., Yamaguchi-Shinozaki K., Shinozaki K. (2001). Regulation of drought tolerance bygene manipulation of 9-cis-epocarotenoid dioxygenase, a key enzyme in abscisic acidbiosynthesis in Arabidopsis. Plant J. 27, pp. 325–333.
Jain A.K., Nessler, C.L. (2000). Metabolic engineering of an alternative pathway forascorbic acid biosynthesis in plants. Mol. Breed. 6, pp. 73–78.
Janssen B.J., Thodey K., Schaffer R.J., Alba R., Balakrishnan L., Bishop R., HBowen J., Crowhurst R.N., Gleave A.P., Ledger S., McArtney S., Pichler F.B.,Snowden K.C., Ward S. (2008). Global gene expression analysis of apple fruit

References
85
development from the floral bud to ripe fruit. BMC Plant Biology 8, doi:10.1186/1471-2229-8-16.
Kampfenkel K., Van Montagu M., Inze D. (1995). Effects of Iron Excess on Nicotianaplumbaginifolia Plants (Implications to Oxidative Stress). Plant Physiology 107, pp.725-735.
Keurentjes J.J., Bentsink L., Alonso-Blanco C., Hanhart C.J., Blankestijn-De VriesH., Effgen S., Vreugdenhil D., Koornneef M. (2007). Development of a near-isogenicline population of Arabidopsis thaliana and comparison of mapping power with arecombinant inbred line population. Genetics 175, pp. 891–905.
Khachik F., Carvalho L., Bernstein P.S., Muir G.J., Zhao D.Y., Katz N.B. (2002).Chemistry, distribution, and metabolism of tomato carotenoids and their impact onhuman health. Exp Biol Med (Maywood) 227, pp. 845–851.
Knapp S., Bohs L., Nee M., Spooner D.M. (2004). Solanaceae-a model for linkinggenomics with biodiversity. Comp. Funct. Genom. 5, 285–291.
Konno H., Nakashima S., Maitani T., Katoh K. (1999). Alteration of pecticpolysaccharides in cell walls, extracellular polysaccharides, and glycan-hydrolyticenzymes of growth-restricted carrot cells under calcium deficiency. Physiol. Plant. 107,pp. 287–293.
Kwon S.Y., Choi S.M., Ahn Y.O., Lee H.S., Lee H.B., Park Y.M., Kwak S.S. (2003).Enhanced stresstolerance of transgenic tobacco plants expressing a humandehydroascorbate reductase gene. J Plant Physiol 160, pp. 347–353.
Lecomte L., Duffe P., Buret M., Servin B., Hospital F., Causse M. (2004). Marker-assisted introgression of five QTLs controlling fruit quality traits into three tomato linesrevealed interactions between QTLs and genetic backgrounds. Theoretical and AppliedGenetics 109, pp. 658–668.
Levin I., Lalazar A., Bar M., Schaffer A.A. (2004). Non GMO fruit factories strategiesfor modulating metabolic pathways in the tomato fruit. Industrial Crops and Products20, pp. 29–36.
Lhote D., Serres C., Laissue P., Oulmouden A., Rogel-Gaillard C., Montagutelli X.,Vaiman D. (2007). Centimorgan-range one-step mapping of fertility traits usinginterspecific recombinant congenic mice. Genetics 176, pp. 1907–1921.
Liebhard R, Kellerhals M, Pfammatter W, Jertmini M, Gessler C. (2003) Mappingquantitative physiological traits in apple (Malusxdomestica Borkh.). Plant MolecularBiology 52 511–526.
Lippman Z.B., Semel Y., Zamir D. (2007). An integrated view of quantitative traitvariation using tomato interspecific introgression lines. Current Opinion in Genetics &Development 17, pp. 545–542.
Liu S., Zhou R., Dong Y., Li P., Jia J. (2006). Development, utilization of introgressionlines using a synthetic wheat as donor. Theor Appl Genet 112, pp. 1360–1373.

References
86
Liu YS., Gur A., Ronen G., Causse M., Damidaux R., Buret M., Hirschberg J.,Zamir D. (2003). There is more to fruit colour than candidate carotenoid genes. PlantBiotechnology Journal 1, pp. 195–207.
Liu, J., Cong, B., and Tanksley, S.D. (2003a). Generation and analysis of an artificialgene dosage series in tomato to study the mechanisms by which the clonedquantitative trait locus fw2.2 controls fruit size. Plant Physiol. 132, pp. 292–299.
Loewus F.A. (1988). Ascorbic acid and its metabolic products. In: Preiss, J. (Ed.). Thebiochemistry of plants, Vol. 14, Carbohydrates (p. 85). Boca Raton, FL: AcademicPress.
Loewus F.A., Kelly S. (1961). Identity of L-ascorbic acid formed from D-glucose by thestrawberry (Frageria). Nature 191, pp. 1059–1061.
Loewus F.A., Murthy P.P.N. (2000). myo-Inositol metabolism in plants. Plant Sci 150,pp. 1–19.
Lorence A., Chevone B.I., Mendes P., Nessler C.L. (2004). myo-inositol oxygenaseoffers a possible entry point into plant ascorbate biosynthesis. Plant Physiol 134, pp.1200–1205.
Ma J.F., Yamamoto R., Nevins D.J., Matsumoto H., Brown P.H. (1999). Al binding inthe epidermis cell wall inhibits cell elongation of okra hypocotyl. Plant Cell Physiol. 40,pp. 549–556.
Martinez-Valverde I., Periago M.J., Provan G., Chesson A. (2002). Phenoliccompounds, licopene and antioxidant activity in commercial varieties of tomato(Lycopersicum esculentum). J Sci Food Agric 82, pp. 323–330.
McCouch, S. (2004). Diversifying selection in plant breeding. PLoS Biol. 2, pp. 1507–1512.
Miller J.C., Tanksley S.D. (1990). RFLP analysis of phylogenetic relationships andgenetic variation in the genus Lycopersicon. Theoretical and Applied Genetics 80, pp.437–448.
Monforte A.J., Tanksley S.D. (2000). Development of a set of near isogenic andbackcross recombinant inbred lines containing most of the Lycopersicon hirsutumgenome in a L. esculentum genetic background: a tool for gene mapping and genediscovery. Genome 43, pp. 803–813.
Moose, S.P., Dudley, J.W., and Rocheford, T.R. (2004). Maize selection passes thecentury mark: A unique resource for 21st century genomics. Trends Plant Sci. 9, pp.358–364.
Morris C.E., and Sands D.C. (2006). The breeder's dilemma—Yield or nutrition? Nat.Biotechnol. 24, pp. 1078–1080.
Mueller L.A., Solow T.H., Taylor N., Skwarecki B., Buels R., Binns J., Lin C.,Wright M.H., Ahrens R., Wang Y., Herbst E.V., Keyder E.R., Menda N., Zamir D.,Tanksley S.D. (2005). The SOL Genomics Network. A Comparative Resource forSolanaceae Biology and Beyond. Plant Physiology 138, pp. 1310-1317.

References
87
NETTOX, (1998). Compilation of Consumption Data, EU Report No.4. DanishVeterinary and Food Administration.
Nicoletti I., De Rossi A., Giovinazzo G., Corradini D. (2007). Identification andquantitation of stilbenes in fruits of transgenic tomato plants (Lycopersion esculentumMill.) by reversed phase HPLC with photodiode array and mass spectrometrydetection. J Agric Food Chem. 55, pp. 3304–3311.
Niggeweg R., Kocher T., Gentzel M., Buscaino A., Taipale M., Akhtar A., Wilm, M.(2006). A general precursor ion-like scanning mode on quadrupole-TOF instrumentscompatible with chromatographic separation. Proteomics 6, pp. 41–53.
Nijveldt R.J., van Nood E., van Hoorn D.E.C., Boelens P.G., van Norren K., vanLeeuwen P.A.M. (2001). Flavonoids: a review of probable mechanisms of action andpotential applications. American Journal of Clinical Nutrition 74, pp. 418–425.
Noctor G., Foyer C.H. (1998). Ascorbate and Glutathione: Keeping Active OxygenUnder Control. Annu Rev Plant Physiol Plant Mol Biol 49, pp. 249–279.
Paine J.A., Shipton C.A., Chaggar S., Howells R.M., Kennedy M.J., Vernon G.,Wright S.Y., Hinchliffe E., Adams J.L., Silverstone A.L., et al (2005). Improving thenutritional value of Golden Rice through increased pro-vitamin A content. NatBiotechnol 23, pp. 482–487.
Pallanca J.E., Smirnoff N. (2000). The control of ascorbic acid synthesis and turnoverin pea seedlings. J Exp Bot 51, pp. 669–674.
Pandey D.K., Shekelle R., Selwyn B.J., Tangney C., Stamler J. (1995). Dietaryvitamin C and beta carotene and risk of death in middle-aged men. The AmericanJournal Epidemiology 142, pp. 1269–1278.
Park Y.H., West M.A.L., St Clair D.A. (2004). Evolution of AFLPs for germplasmfingerprinting and assessment of genetic diversity in cultivars of tomato (Lycopersiconesculentum L.). Genome 47, pp. 510–518.
Pastori G.M., Kiddle G., Antoniw J., Bernard S., Veljovic-Jovanovic S., VerrierP.J., Noctor G., Foyer C.H. (2003). Leaf vitamin C contents modulate plant defensetranscripts and regulate genes that control development through hormone signaling.Plant Cell 15, pp. 939–951.
Peleman J.D., van der Voort J.R. (2003). Breeding by design. Trends Plant Sci 8, pp.330–334.
Pietta P.G. 2000. Flavonoids as antioxidants. Journal of Natural Products 63, pp.1035–1042.
Poncet V., Robert T., Sarr A., Gepts P. (2004). Quantitative trait loci analyses of thedomestication syndrome and domestication process. In Goodman R, ed. Encyclopediaof plant and crop science New York, NY: Marcel Dekker, 1069–1073.
Potters G., de Gara L., Asard H., Horemans N. (2002). Ascorbate and glutathione:guardians of the cell cycle, partners in crime? Plant Physiol. Biochem. 40, pp. 537–548.
References
88
Pourcel L., Routaboul J.M., Cheynier V., Lepiniec L., Debeaujon I. (2006).Flavonoid oxidation in plants: from biochemical properties to physiological functions.Trends Plant Sci. 8, pp. 29–36.
Raffo A., La Malfa G., Fogliano V., Maiani G., Quaglia, G. (2006). Seasonalvariations in antioxidant components of cherry tomatoes (Lypersicon esculentum cv.Naomi F1). Journal of Food Composition and Analysis, 19, pp. 11–19.
Rautenkranz A.A.F., , Machler L.L. F, Martinoia E., Oertli J.J. (1994). Transport ofascorbic and dehydroascorbic acids across protoplast and vacuole membranesisolated from barley (Hordeum .ulgare L. cv Gerbel) leaves. Plant Physiology 106, pp.187–193.
Redgwell R.J., Fischer M. (2002). Fruit texture, cell wall metabolism and consumerperceptions. In Knee M (Ed.). Fruit quality and its biological basis Oxford Blackwell pp.46–88.
Rein D., Schijlen E., Kooistra T., Herbers K., Verschuren L., Hall R., SonnewaldU., Bovy A., Kleemann, R. (2006). Transgenic flavonoid tomato intake reduces C-reactive protein in human C-reactive protein transgenic mice more than wild-typetomato. J. Nutr. 136, pp. 2331–2337.
Rick C. M. (1976). Natural variability in wild species of Lycopersicon and its bearing ontomato breeding. Genet Agraria 30, pp. 249–259.
Romer S., Fraser P.D., Kiano J.W., Shipton C.A., Misawa N., Schuch W., BramleyP.M. (2000). Elevation of the provitamin A content of transgenic tomato plants. NatBiotechnol 18, pp. 666– 669.
Ronen G., Carmel-Goren L., Zamir D., Hirschberg J. (2000). An alternative pathwayto beta-carotene formation in plant chromoplasts discovered by map-based cloning ofBeta and oldgold color mutations in tomato. Proc Natl Acad Sci USA 97, pp. 11102–11107.
Ronen G., Cohen M., Zamir D., Hirschberg J. (1999). Regulation of carotenoidbiosynthesis during tomato fruit development: expression of the gene for lycopeneepsilon-cyclase is downregulated during ripening and is elevated in the mutant Delta.Plant J 17, pp. 341–351.
Rousseaux M.C., Jones C.M., Adams D. (2005). QTL analysis of fruit antioxidants intomato using Lycopersicon pennellii introgression lines. Theor. Appl. Genet. 111, pp.1396–1408.
Saeed AI, Sharov V, White J, Li J, Liang W, Bhagabati N, Braisted J, Klapa M,Currier T, Thiagarajan M, et al (2003) TM4: a free, open-source system for microarraydata management and analysis. Biotechniques 34: 374–378.
Saliba-Colombani V., Causse M., Langlois D., Philouze J., Buret M. (2001). Geneticanalysis of organoleptic quality in fresh market tomato. 1. Mapping QTLs for physicaland chemical traits. Theoretical and Applied Genetics 102, pp. 259–272.
Scaltber A., Williamson G. (2000). Dietary intake and bioavailability of polyphenols. JNutr 130, pp. 2073S-2085S.

References
89
Schauer N., Semel Y., Roessner U., Gur A., Balbo I., Carrari F., Pleban T., Perez-Melis A., Bruedigam C., Kopka J., Willmitzer L., Zamir D., Fernie A.R. (2006).Comprehensive metabolic profiling and phenotyping of interspecific introgression linesfor tomato improvement, Nat Biotechnol 24, pp. 447–454.
Schauer N., Zamir D., Fernie A.R. (2005). Metabolic profiling of leaves and fruit ofwild species tomato: a survey of the Solanum lycopersicum complex. J Exp Bot 56, pp.297–307.
Schmelz E.A., Alborn H.T., Tumlinson J.H. (2001). The influence of intact-plant andexcised-leaf bioassay designs on volicitin- and jasmonic acid-induced sesquiterpenevolatile release in Zea mays. Planta 214, pp. 171–179.
Schwartz S.H., Qin X., Loewen M.C. (2004). The biochemical characterization of twocarotenoid cleavage enzymes from Arabidopsis indicates that a carotenoid-derivedcompound inhibits lateral branching. J Biol Chem 279, pp. 46940–46945.
Schwartz S.H., Qin X.Q., Zeevaart J.A.D. (2001) Characterization of a novelcarotenoid cleavage dioxygenase from plants. J Biol Chem 276, pp. 25208–25211.
Schwartz S.H., Tan B.C., Gage D.A., Zeevaart J.A.D., McCarty D.R. (1997). SpecificOxidative Cleavage of Carotenoids by VP14 of Maize. Science 276, pp. 1872–1874.
Serrano-Megias M., Lopez-Nicolas J.M. (2006). Application of agglomerativehierarchical clustering to identify consumer tomato preferences: influence ofphysicochemical and sensory characteristics on consumer response. Journal of theScience of Food and Agriculture 86, pp. 493–499.
Seymour GB, Manning K, Eriksson EM, Popovich AH, King GJ. (2002) Geneticidentification and genomic organization of factors affecting fruit texture. Journal ofExperimental Botany 53 2065–2071.
Singer J.B., Hill A.E., Burrage L.C., Olszens K.R., Song J., Justice M., O’BrienW.E., Conti D.V., Witte J.S., Lander E.S. et al. (2004). Genetic dissection of complextraits with chromosome substitution strains of mice, Science 304, pp. 445–448.
Singleton V.L., Rossi J.A (1965). Colorimetry of total phenolics withphosphomolybdic–phosphotungstic acid reagents. American Journal of Enology andViticulture 16, pp. 144–158.
Smirnoff N. (1995). Antioxidant systems and plant response to the environment. In:Smirnoff N, ed. En.ironment and plant metabolism. Flexibility and acclimation. Oxford:Bios Scienti®c Publishers, 217–243.
Smirnoff N. (1996). The Function and Metabolism of Ascorbic Acid in Plant. Annals ofBotany 78, pp. 661–669.
Smirnoff N., Conklin P.L., Loewus F.A. (2001). Biosynthesis of ascorbic acid inplants: a renaissance. Annual Review of Plant Physiology and Plant Molecular Biology52, pp. 437–467.
Smirnoff N., Wheeler G.L. (2000). Ascorbic acid in plants: biosynthesis and function.Crit Rev Biochem Mol Biol 35, pp. 291–314.

References
90
Snape J.W., Foulkes M.J., Simmonds J., Leverington M., Fish L.J., Wang Y.,Ciaravella M. (2007). Dissecting gene X environmental effects on wheat yields viaQTL and physiological analysis. Euphytica 154, pp. 401–408.
Stevens M.A. (1986). Inheritance of tomato fruit quality components. Plant BreedingReviews 4, pp. 273–311.
Stevens R., Buret M., Duffé P., Garchery C., Baldet P., Rothan C., Causse M.(2007). Candidate Genes and Quantitative Trait Loci Affecting Fruit Ascorbic AcidContent in Three Tomato Populations. Plant Physiology 143, pp.1943-1953.
Stevens R., Buret M., Garchery C., Carretero Y., Causse M. (2006). Technique forrapid, small-scale analysis of vitamin C levels in fruit and application to a tomatomutant collection. J Agric Food Chem 54, pp. 6159–6165.
Stevens R., Page D., Gouble B., Garchery C., Zamir D., Causse M. (2008). Tomatofruit ascorbic acid content is linked with monodehydroascorbate reductase activity andtolerance to chilling stress. Plant, Cell & Environment 31, pp. 1086–1096.
Szalma S.J., Hostert B.M., Ledeaux J.R., Stuber C.W., Holland J.B. (2007). QTLmapping with near-isogenic lines in maize. Theor Appl Genet 114, pp. 1211–1228.
Szczesniak A.S. (2002). Texture is a sensory property. Food Quality and Preference13, pp. 215–225.
Tadmor Y., Fridman E., Gur, A., Larkov O., Lastochkin E., Ravid U., Zamir D.,Lewinsohn E. (2002). Identification of malodorous, a wild species allele affectingtomato aroma that was selected against during domestication. J. Agric. Food Chem.50, pp. 2005-2009.
Tam S.M., Mhiri C., Vogelaar A., Kerkveld M., Pearce S.R. Grandbastien M.A.(2005). Comparative analysis of genetic diversities within tomato and peppercollections detected by retrotransposon-based SSAP,AFLPandSSR. Theoretical andApplied Genetics 110, pp. 819–831.
Tan B.C., Joseph L.W., Deng W.T., Lin L., Li Q.B., Cline K., McCarty D.R. (2003).Molecular characterization of the Arabidopsis 9-cis-epocarotenoid dioxygenase genefamily. Plant J. 35, pp. 44–56.
Tanksley S.D, Ganal M.W., Prince J.P., De Vicente M.C., Bonierbale M.W., BrounP., et al. (1992). High density molecular linkage maps of the tomato and potatogenomes. Genetics 132, pp. 1141–1160.
Tanksley S.D. (2004). The genetic, developmental and molecular bases of fruit sizeand shape variation in tomato. The Plant Cell 16, pp. 181–189.
Tanksley SD, Grandillo S, Fulton TM, Zamir D, Eshed Y, Petiard V, Lopez J, Beck-Bunn T (1996) Advanced backcross QTL analysis in a cross between an eliteprocessing line of tomato and its wild relative L. pimpinellifolium. Theor Appl Genet 92,pp. 213–224.
Tanksley, S.D., and McCouch, S.R. (1997). Seed banks and molecular maps:Unlocking genetic potential from the wild. Science 277, pp. 1063–1066.

References
91
Tieman D.M., Zeigler M., Schmelz E.A., Taylor M.G., Bliss P., Kirst M., Klee H.J.(2006). Identification of loci affecting flavour volatile emissions in tomato fruits. Journalof Experimental Botany 57, pp. 887–896.
Toor R.K., Savage G.P., Lister C.E. (2006). Seasonal variations in the antioxidantcomposition of greenhouse grown tomatoes. J Food Compos Anal 19, pp. 1–10.
Turrini A., Saba A., Perrone D., Cialfa E., D’Amicis A. (2001). Food consumptionpatterns in Italy: the INN-CA study 1994–1996. European Journal of Clinical Nutrition55, pp. 571–588.Tusher, V.G., R. Tibshirani and G. Chu. (2001). Significance analysis of microarraysapplied to the ionizing radiation response. Proceedings of the National Academy ofSciences USA 98, pp. 5116–5121.
Valpuesta V., Botella M.A. (2004). Biosynthesis of L-ascorbic acid in plants: newpathways for an old antioxidant. Trends Plant Sci 9, pp. 573–577.
Van der Beek J.G., Verkerk R., Zabel P., Lindhout P. (1992). Mapping strategy forresistance genes in tomato based on RFLPs between cultivars: Cf9 (resistance toCladosporium fulvum) on chromosome 1. Theoretical and Applied Genenetics 84, pp.106–112.
van der Hoeven R. S., Ronning C., Giovannoni J. J., Martin G., and Tanksley S. D.(2002). Deductions about the number, organization, and evolution of genes in thetomato genome based on analysis of a large expressed sequence tag collection andselective genomic sequencing. The Plant Cell 14, pp. 1441–1456.
van der Knaap E., Sanyal A., Jackson S.A., Tanksley S.D. (2004). High-ResolutionFine-Mapping and FISH analysis of sun, a Locus Controlling Tomato Fruit Shape,Reveals a Region of the Tomato Genome Prone to DNA Rearrangements. Genetics168, pp. 2127–2140.
Verhoeyen M.E., Bovy A., Collins G., Muir S., Robinson S., de Vos C.H.R., ColliverS. (2002). Increasing antioxidant levels in tomatoes through modification of theflavonoid biosynthetic pathway. Journal of Experimental Botany 53, pp. 2099-2106.
Villand J., Skroch P.W., Lai T., Hanson P., Kuo C.G., Nienhuis J. (1998). Geneticvariation among tomato accessions from primary and secondary centers of diversity.Crop Science 38, pp. 1339–1347.
Vogel J.T., Tan B., McCarty D.R., Klee H.J. (2008). The Carotenoid CleavageDioxygenase 1 Enzyme Has Broad Substrate Specificity, Cleaving MultipleCarotenoids at Two Different Bond Positions. J. Biol. Chem. 283, pp. 11364–11373.
von Korff M., Wang H., Leon J., Pillen K. (2004). Development of candidateintrogression lines using an exotic barley accession (Hordeum vulgare ssp.spontaneum) as donor. Theor Appl Genet 109, pp. 1736–1745.
von Lintig J., Vogt K. (2000). Filling the Gap in Vitamin A Research. J Biol Chem 275,pp. 11915–11920.
Waldron K.W., Parker M.L., Smith A.C. (2003). Plant cell walls and food quality.Comprehensive Reviews in Food Science and Food Safety 2, pp. 101–119.

References
92
Wheeler G.L., Jones M.A., Smirnoff N. (1998). The biosynthetic pathway of vitamin Cin higher plants. Nature 393, pp. 365–369.
Willcox J.K., Catignani G.L., Lazarus S. (2003). Tomatoes and cardiovascular health.Crit Rev Food Sci Nutr 43, pp. 1–18.
Winkel-Shirley B. (2002). Biosynthesis of flavonoids and effects of stress. Curr OpinPlant Biol. 5, pp. 218–23.
Winterhalter P., Rouseff R. (2002). Carotenoid-derived aroma compounds: anintroduction. ACS Symp. Ser. 802. In: Winterhalter P, Rouseff RL (eds) Carotenoidderived aroma compounds. American Chemical Society, Washington, DC, pp 1–19.
Wolucka B.A., Goossens A., Inze D. (2005). Methyl jasmonate stimulates the denovo biosynthesis of vitamin C in plant cell suspensions. J Exp Bot 56, pp. 2527–2538.
Wolucka B.A., Van Montagu M. (2007). The VTC2 cycle and the de novobiosynthesis pathways for vitamin C in plants: an opinion. Phytochemistry 68, pp.2602–13.Yelle S., Chetelat R.T., Dorais M., Deverna J.W., Bennett A.B. (1991). Sinkmetabolism in tomato fruit. 4. Genetic and biochemical analysis of sucroseaccumulation. Plant Physiology 95, pp. 1026–1035.
Zamir D. (2001). Improving plant breeding with exotic genetic libraries. Nat Rev Genet2, pp. 983–989.
Zhang Y., Stommel J.R. (2000). RAPD and AFLP tagging and mapping of Beta (B)and Beta modifier (Mo-B), two genes which influence beta-carotene accumulation infruit of tomato (Lycopersicon esculentum Mill.). Theor Appl Genet 100, pp. 368–375.
Zou L., Ouyang L.H., Zhang B., Ye J.Z. (2006). Cloning and mapping of genesinvolved in tomato ascorbic acid biosynthesis and metabolism. Plant Sci 170, pp. 120–127.