eneric ata uality ramework pplied to he roduct …
TRANSCRIPT

A GENERIC DATA QUALITY FRAMEWORK APPLIED TO THE PRODUCT DATA FOR NAVAL VESSELS
Jørgen Stang Det Norske Veritas, Norway
Tore Christiansen Det Norske Veritas, Norway [email protected]
David Skogan
Det Norske Veritas, Norway [email protected]
Atle Kvalheim
Det Norske Veritas, Norway [email protected]
Tor Arne Irgens
Norwegian Defence Logistics Organisation, Norway [email protected]
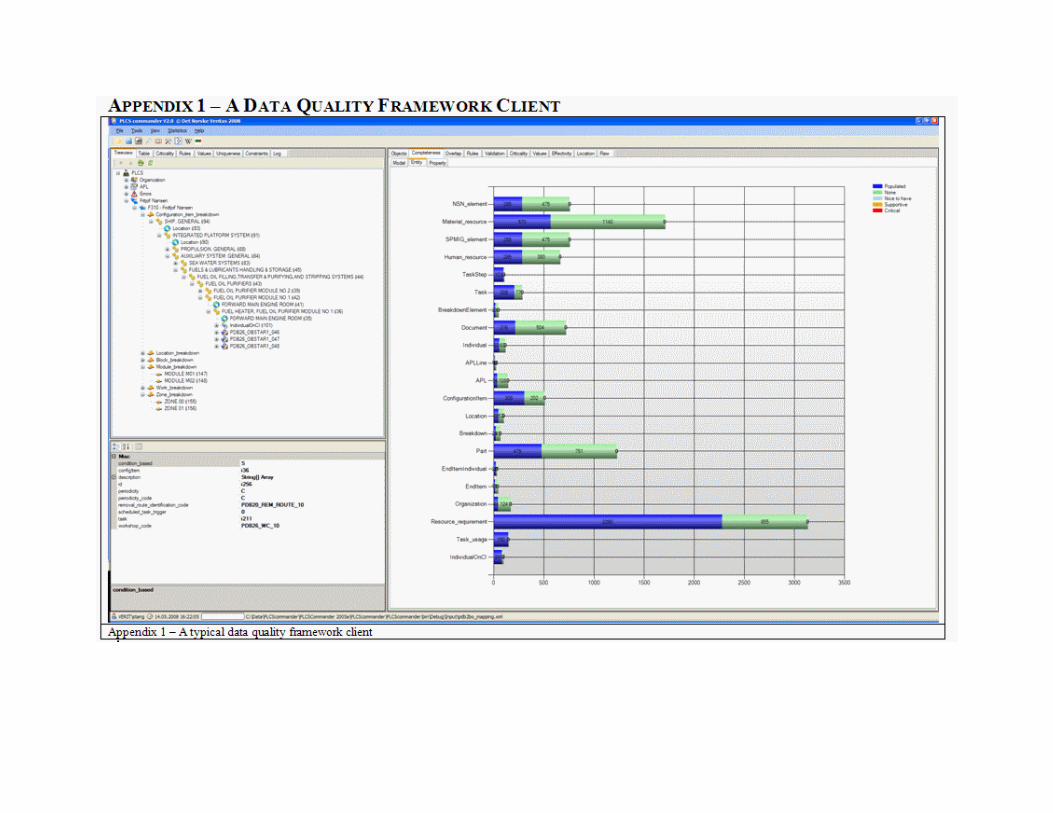
Abstract: The data quality framework presented here is a set of tools and methods providing services for the data quality assessment along the presented data quality dimensions. Thin adapters connect the framework to the underlying data sources such as Part 21 [21], xml or relational databases. In the other end, domain specific business rules defined by UML/OCL, Schematron or java/C# extends the framework. Client applications can provide rich graphics to visualize views on the data quality dimensions such as completeness, validation and overlap. If present, 3D models and external reference data libraries can be linked to the data to verify part locations and general lexical meaning of attributes. The semiotic information quality framework suggested by Price and Shanks in [15] is used to categorize some of the data quality dimensions described here. . Key Words: Data Quality, Product Data, Metadata, Reflection
INTRODUCTION A data quality framework has been defined and implemented using metadata reflection [16] to be able to meet the requirements for a thorough and comprehensive report on the data quality for product data for naval vessels and also for a means to keep track of historical data to report changes in the data quality over time. The data quality framework described here works primarily by reflection [16] on the metadata for the product data model ensuring generic measures for quality which can be assessed regardless of the nature or format of the model. To facilitate domain specific measures such as constraint consistency checks, the framework can be extended with custom rules defined in OCL [20], Schematron [9] or a programming language such as C# [16] or Java [3]. In addition, visual feedback in the form of hyperlinked completeness and error charts providing instant overviews of the data quality state as well as
drilldowns to the particular elements reporting errors or discrepancies are implemented. On the extreme end of data visualization, 3D models can be loaded into the systems and linked to the data source to both localize particular elements in the virtual world and to perform basic virtual semantic checks. BACKGROUND Product data deliveries for naval vessels acquired by the Norwegian Defense are subject to rigorous data quality assessments prior to being incorporated in in-house data systems. The delivered data is transformed to a Product Life Cycle Support (PLCS) compliant store to be able to track historical data. This article describes a subset of the performed data quality assessments which has been defined as generic measurements applied to the meta model for the naval vessels product model.
ISO 10303 STEP (Standard for the exchange of product model data) and ISO 10303-239 PLCS (Product Life Cycle Support) provides comprehensive documentation and protocols enabling data producers and data consumers to store and exchange data for the complete product throughout the entire life cycle in a well defined format enjoying a world wide consensus [13]. STEP has already been adopted extensively by the aerospace, automotive, shipbuilding and construction industries whereas PLCS is still considered in its infancy, however, showing a great potential in the current areas of application as reported by Irgens [8] and Gibson [6]. The product data used in this article represent a snapshot of the underlying PLCS data, not currently including the life cycle data and introducing some abstractions to aid the intended use of the model. PLCS compliance is ensured by bi-directional transformations.
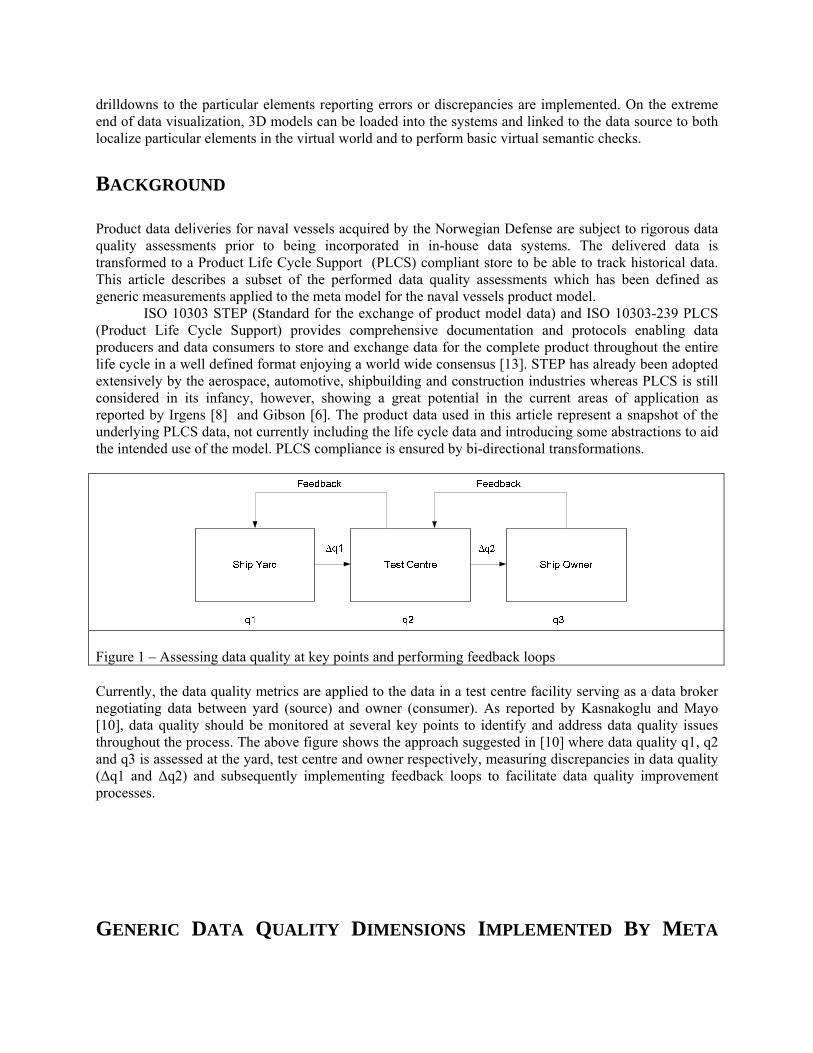
Figure 1 – Assessing data quality at key points and performing feedback loops Currently, the data quality metrics are applied to the data in a test centre facility serving as a data broker negotiating data between yard (source) and owner (consumer). As reported by Kasnakoglu and Mayo [10], data quality should be monitored at several key points to identify and address data quality issues throughout the process. The above figure shows the approach suggested in [10] where data quality q1, q2 and q3 is assessed at the yard, test centre and owner respectively, measuring discrepancies in data quality (Δq1 and Δq2) and subsequently implementing feedback loops to facilitate data quality improvement processes. GENERIC DATA QUALITY DIMENSIONS IMPLEMENTED BY META
DATA REFLECTION Metadata is commonly described as data describing other data and is often implemented as schemas with table, view and column definitions. The metadata provides general information about the data facilitating evaluations of the data instances with respect to the data definitions.
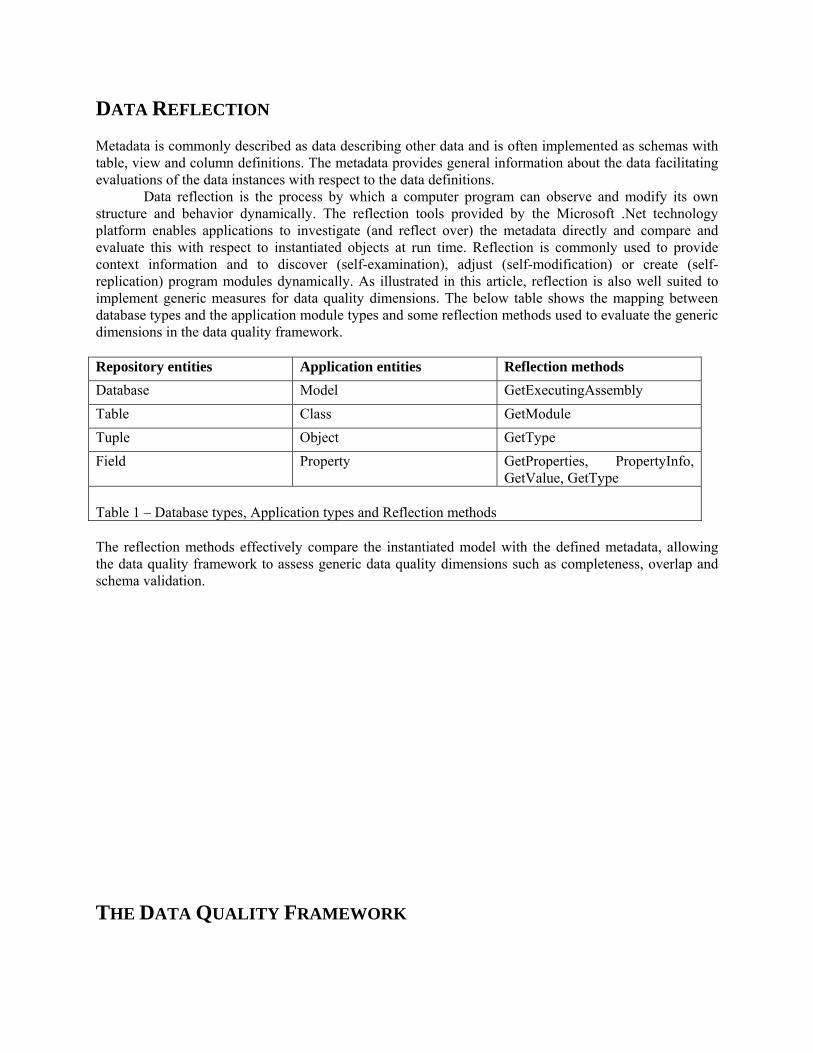
Data reflection is the process by which a computer program can observe and modify its own structure and behavior dynamically. The reflection tools provided by the Microsoft .Net technology platform enables applications to investigate (and reflect over) the metadata directly and compare and evaluate this with respect to instantiated objects at run time. Reflection is commonly used to provide context information and to discover (self-examination), adjust (self-modification) or create (self-replication) program modules dynamically. As illustrated in this article, reflection is also well suited to implement generic measures for data quality dimensions. The below table shows the mapping between database types and the application module types and some reflection methods used to evaluate the generic dimensions in the data quality framework. Repository entities Application entities Reflection methods Database Model GetExecutingAssembly Table Class GetModule Tuple Object GetType Field Property GetProperties, PropertyInfo,
GetValue, GetType
Table 1 – Database types, Application types and Reflection methods The reflection methods effectively compare the instantiated model with the defined metadata, allowing the data quality framework to assess generic data quality dimensions such as completeness, overlap and schema validation. THE DATA QUALITY FRAMEWORK

The figure below shows an overview of the architecture of our data quality framework. Thin adapters can be implemented for any data source such as RDBMS, P21 or XML providing a mapping from the given data model to the generic base model of the data quality framework. At the other end of the scale, rich clients using modern GUI components can be leveraged from the framework to provide data model views in order to enhance the pragmatic quality along the navigation, interpretation and visualization dimensions.
Figure 2 – Data Quality Framework Overview The internals of the framework is further detailed in Figure 3. The adapters consist of three partial class/table definitions: (i) Automatically generated class and property definitions from the database schema or xml schema, (ii) semiautomatic web service consumption connecting reference data to the defined properties and (iii) manual application of predefined rules and breakdown information for ambiguous table relations (ie. Primary Key/Foreign Key in database not strictly parent/child in DQF meta model). Further, the data quality metrics are implemented as generic measures on the meta model by reflection [16], and hence the data quality dimensions can theoretically be applied to any arbitrary data source with an appropriate adapter implementation. Finally, custom rules specific to a particular data model can be defined in a suitable external rule language such as Schematron and loaded independently of the internals of the framework, providing customized and extensible validation. The rules will normally validate the data according to the syntactic semiotic categories (allowable values and cardinality).
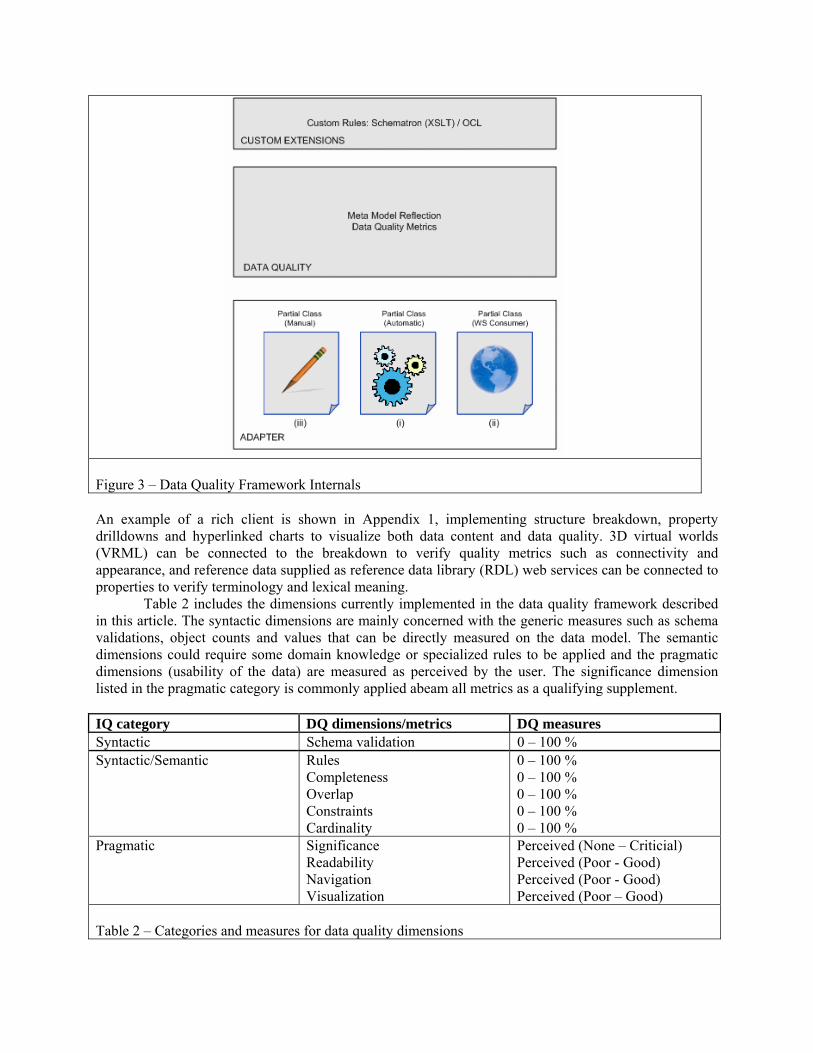
Figure 3 – Data Quality Framework Internals An example of a rich client is shown in Appendix 1, implementing structure breakdown, property drilldowns and hyperlinked charts to visualize both data content and data quality. 3D virtual worlds (VRML) can be connected to the breakdown to verify quality metrics such as connectivity and appearance, and reference data supplied as reference data library (RDL) web services can be connected to properties to verify terminology and lexical meaning.
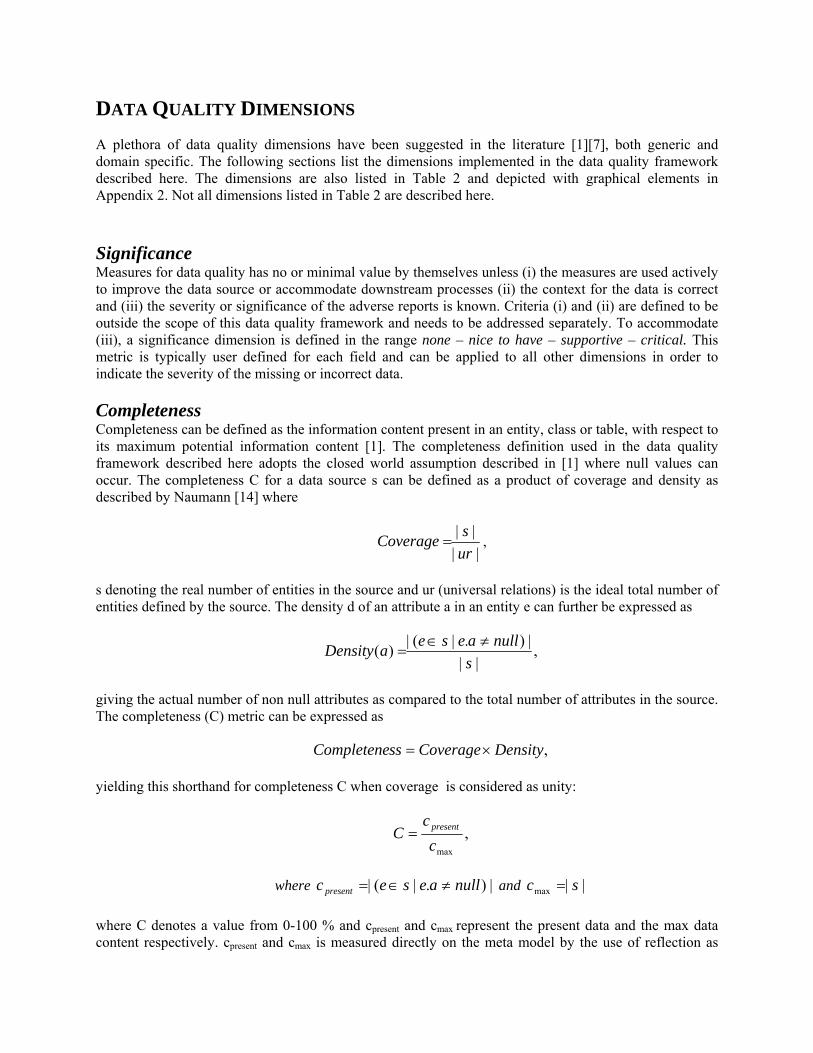
Table 2 includes the dimensions currently implemented in the data quality framework described in this article. The syntactic dimensions are mainly concerned with the generic measures such as schema validations, object counts and values that can be directly measured on the data model. The semantic dimensions could require some domain knowledge or specialized rules to be applied and the pragmatic dimensions (usability of the data) are measured as perceived by the user. The significance dimension listed in the pragmatic category is commonly applied abeam all metrics as a qualifying supplement.
IQ category DQ dimensions/metrics DQ measures Syntactic Schema validation 0 – 100 % Syntactic/Semantic Rules
Completeness Overlap Constraints Cardinality
0 – 100 % 0 – 100 % 0 – 100 % 0 – 100 % 0 – 100 %
Pragmatic Significance Readability Navigation Visualization
Perceived (None – Criticial) Perceived (Poor - Good) Perceived (Poor - Good) Perceived (Poor – Good)
Table 2 – Categories and measures for data quality dimensions
DATA QUALITY DIMENSIONS A plethora of data quality dimensions have been suggested in the literature [1][7], both generic and domain specific. The following sections list the dimensions implemented in the data quality framework described here. The dimensions are also listed in Table 2 and depicted with graphical elements in Appendix 2. Not all dimensions listed in Table 2 are described here. Significance Measures for data quality has no or minimal value by themselves unless (i) the measures are used actively to improve the data source or accommodate downstream processes (ii) the context for the data is correct and (iii) the severity or significance of the adverse reports is known. Criteria (i) and (ii) are defined to be outside the scope of this data quality framework and needs to be addressed separately. To accommodate (iii), a significance dimension is defined in the range none – nice to have – supportive – critical. This metric is typically user defined for each field and can be applied to all other dimensions in order to indicate the severity of the missing or incorrect data. Completeness Completeness can be defined as the information content present in an entity, class or table, with respect to its maximum potential information content [1]. The completeness definition used in the data quality framework described here adopts the closed world assumption described in [1] where null values can occur. The completeness C for a data source s can be defined as a product of coverage and density as described by Naumann [14] where
||||
ursCoverage = ,
s denoting the real number of entities in the source and ur (universal relations) is the ideal total number of entities defined by the source. The density d of an attribute a in an entity e can further be expressed as
,||
|).|(|)(s
nullaeseaDensity ≠∈=
giving the actual number of non null attributes as compared to the total number of attributes in the source. The completeness (C) metric can be expressed as
,DensityCoveragessCompletene ×=
yielding this shorthand for completeness C when coverage is considered as unity:
,maxc
cC present=
where |).|(| nullaesec present ≠∈= and ||max sc =
where C denotes a value from 0-100 % and cpresent and cmax represent the present data and the max data content respectively. cpresent and cmax is measured directly on the meta model by the use of reflection as
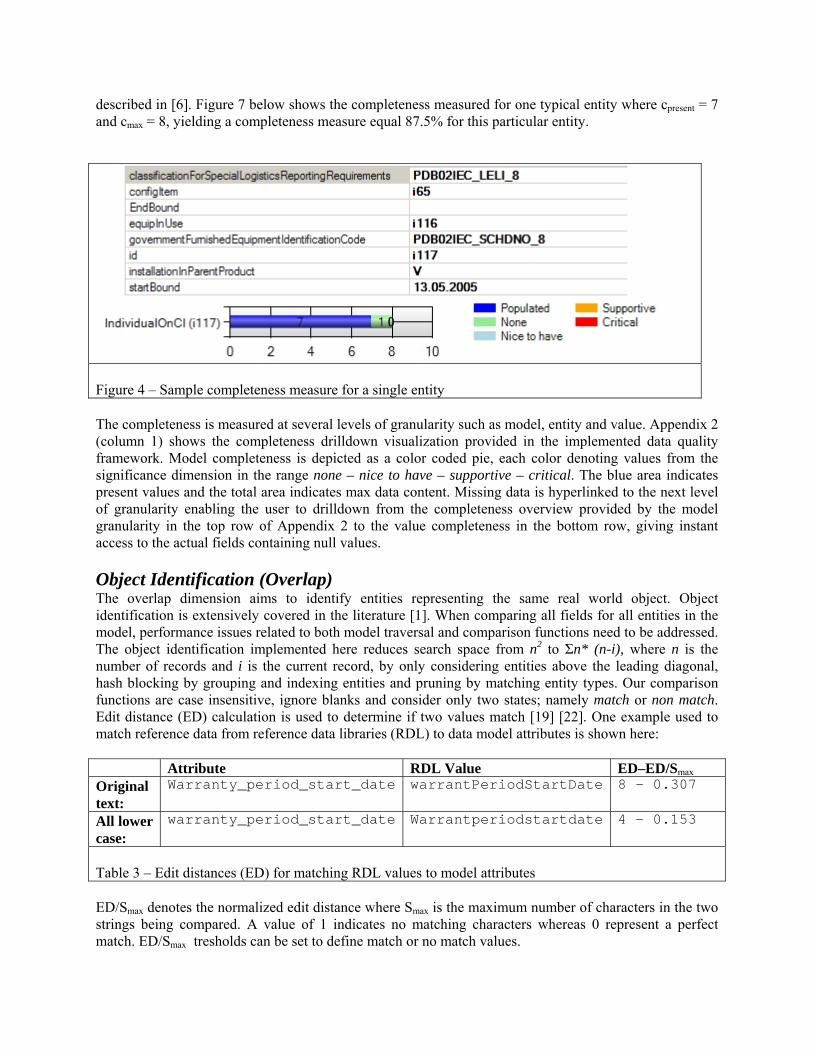
described in [6]. Figure 7 below shows the completeness measured for one typical entity where cpresent = 7 and cmax = 8, yielding a completeness measure equal 87.5% for this particular entity.
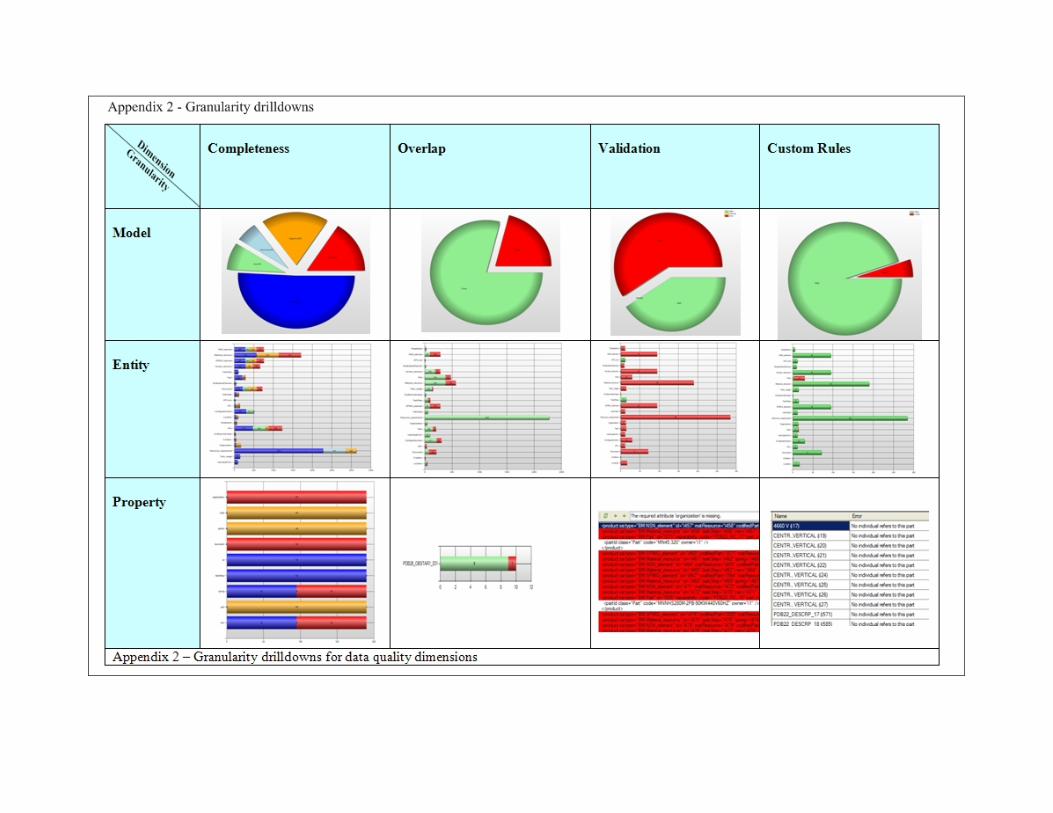
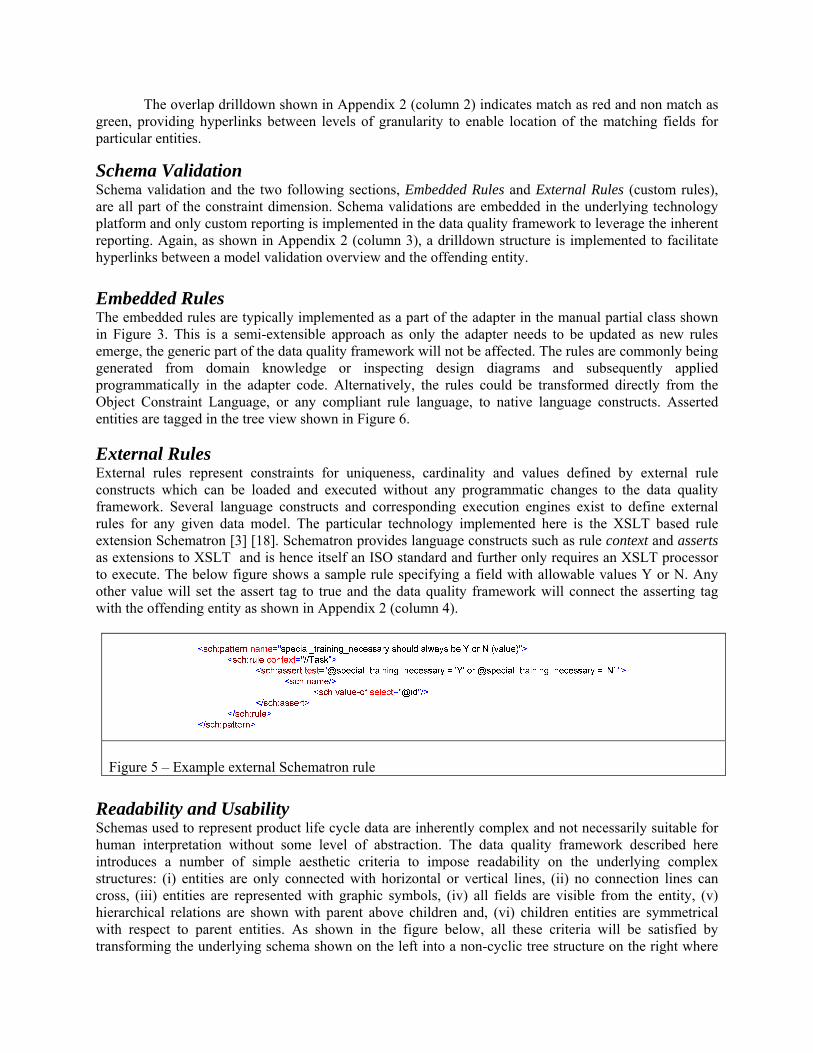
Figure 4 – Sample completeness measure for a single entity The completeness is measured at several levels of granularity such as model, entity and value. Appendix 2 (column 1) shows the completeness drilldown visualization provided in the implemented data quality framework. Model completeness is depicted as a color coded pie, each color denoting values from the significance dimension in the range none – nice to have – supportive – critical. The blue area indicates present values and the total area indicates max data content. Missing data is hyperlinked to the next level of granularity enabling the user to drilldown from the completeness overview provided by the model granularity in the top row of Appendix 2 to the value completeness in the bottom row, giving instant access to the actual fields containing null values. Object Identification (Overlap) The overlap dimension aims to identify entities representing the same real world object. Object identification is extensively covered in the literature [1]. When comparing all fields for all entities in the model, performance issues related to both model traversal and comparison functions need to be addressed. The object identification implemented here reduces search space from n2 to Σn* (n-i), where n is the number of records and i is the current record, by only considering entities above the leading diagonal, hash blocking by grouping and indexing entities and pruning by matching entity types. Our comparison functions are case insensitive, ignore blanks and consider only two states; namely match or non match. Edit distance (ED) calculation is used to determine if two values match [19] [22]. One example used to match reference data from reference data libraries (RDL) to data model attributes is shown here: Attribute RDL Value ED–ED/Smax Original text:
Warranty_period_start_date warrantPeriodStartDate 8 – 0.307
All lower case:
warranty_period_start_date Warrantperiodstartdate 4 – 0.153
Table 3 – Edit distances (ED) for matching RDL values to model attributes
ED/Smax denotes the normalized edit distance where Smax is the maximum number of characters in the two strings being compared. A value of 1 indicates no matching characters whereas 0 represent a perfect match. ED/Smax tresholds can be set to define match or no match values.
The overlap drilldown shown in Appendix 2 (column 2) indicates match as red and non match as green, providing hyperlinks between levels of granularity to enable location of the matching fields for particular entities.
Schema Validation Schema validation and the two following sections, Embedded Rules and External Rules (custom rules), are all part of the constraint dimension. Schema validations are embedded in the underlying technology platform and only custom reporting is implemented in the data quality framework to leverage the inherent reporting. Again, as shown in Appendix 2 (column 3), a drilldown structure is implemented to facilitate hyperlinks between a model validation overview and the offending entity. Embedded Rules The embedded rules are typically implemented as a part of the adapter in the manual partial class shown in Figure 3. This is a semi-extensible approach as only the adapter needs to be updated as new rules emerge, the generic part of the data quality framework will not be affected. The rules are commonly being generated from domain knowledge or inspecting design diagrams and subsequently applied programmatically in the adapter code. Alternatively, the rules could be transformed directly from the Object Constraint Language, or any compliant rule language, to native language constructs. Asserted entities are tagged in the tree view shown in Figure 6.
External Rules External rules represent constraints for uniqueness, cardinality and values defined by external rule constructs which can be loaded and executed without any programmatic changes to the data quality framework. Several language constructs and corresponding execution engines exist to define external rules for any given data model. The particular technology implemented here is the XSLT based rule extension Schematron [3] [18]. Schematron provides language constructs such as rule context and asserts as extensions to XSLT and is hence itself an ISO standard and further only requires an XSLT processor to execute. The below figure shows a sample rule specifying a field with allowable values Y or N. Any other value will set the assert tag to true and the data quality framework will connect the asserting tag with the offending entity as shown in Appendix 2 (column 4).
Figure 5 – Example external Schematron rule Readability and Usability Schemas used to represent product life cycle data are inherently complex and not necessarily suitable for human interpretation without some level of abstraction. The data quality framework described here introduces a number of simple aesthetic criteria to impose readability on the underlying complex structures: (i) entities are only connected with horizontal or vertical lines, (ii) no connection lines can cross, (iii) entities are represented with graphic symbols, (iv) all fields are visible from the entity, (v) hierarchical relations are shown with parent above children and, (vi) children entities are symmetrical with respect to parent entities. As shown in the figure below, all these criteria will be satisfied by transforming the underlying schema shown on the left into a non-cyclic tree structure on the right where
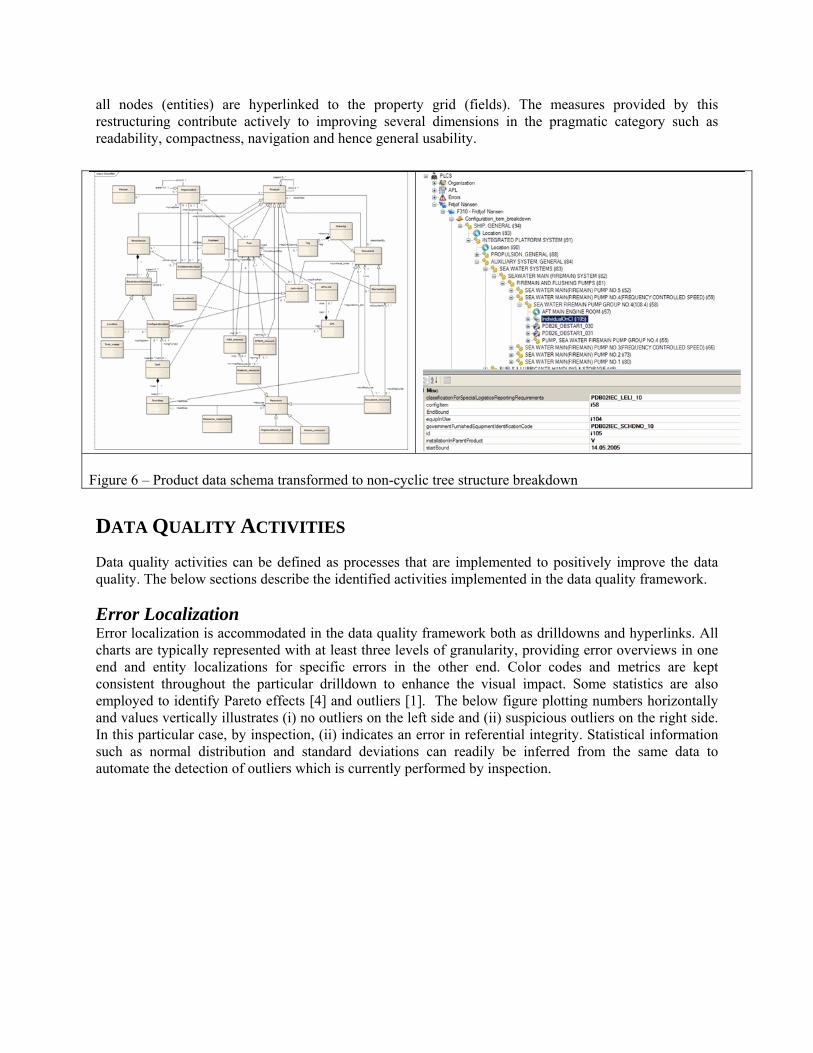
all nodes (entities) are hyperlinked to the property grid (fields). The measures provided by this restructuring contribute actively to improving several dimensions in the pragmatic category such as readability, compactness, navigation and hence general usability.
DATA QUALITY ACTIVITIES Data quality activities can be defined as processes that are implemented to positively improve the data quality. The below sections describe the identified activities implemented in the data quality framework. Error Localization Error localization is accommodated in the data quality framework both as drilldowns and hyperlinks. All charts are typically represented with at least three levels of granularity, providing error overviews in one end and entity localizations for specific errors in the other end. Color codes and metrics are kept consistent throughout the particular drilldown to enhance the visual impact. Some statistics are also employed to identify Pareto effects [4] and outliers [1]. The below figure plotting numbers horizontally and values vertically illustrates (i) no outliers on the left side and (ii) suspicious outliers on the right side. In this particular case, by inspection, (ii) indicates an error in referential integrity. Statistical information such as normal distribution and standard deviations can readily be inferred from the same data to automate the detection of outliers which is currently performed by inspection.
Figure 6 – Product data schema transformed to non-cyclic tree structure breakdown

Figure 7 – Localization of outliers: (i) no outliers and (ii) one outlier (red circle) Error Correction Frequently error corrections are only allowed to be performed at master data level according to a given data governance. Hence, the data quality framework will not automatically be allowed to permit changes or corrections to the data. If data governance facilitates updates performed outside the master data source, the data quality framework automates updating common fields in multiple entities thus improving dimensions such as completeness. The updated data is persisted by the data quality framework according to the submitted database schema and can be reapplied in the master data for bi-directional adapters. Visualization One of the main objectives of the data quality framework is to provide human readable views on both the data and the data quality for complex product life cycle data models. The effort to improve readability through visualization contributes directly to the data quality dimensions defined in the pragmatic category, such as navigation by tree views and tables, localizations by drilldowns and hyperlinks and conformance by terminology lookups using web services. To address the visualization dimension, 3D graphical product models can be connected to the product breakdown for visual inspection of connected parts and tasks. The figure below depicts how the location of the propulsion system can be linked from the tree view breakdown structure in a 3D model of the ship.
Figure 8 – 3D visualization of breakdown structure
Consistency Reference data libraries (RDL) have been used to avail a coherent definition of property names in the model. As illustrated for object overlap, edit distance have been used to map property names to reference data to identify descriptions of resembling terms. To some extent, this could abate discrepancies in definitions between data producer and data consumer and hence improve consistency.
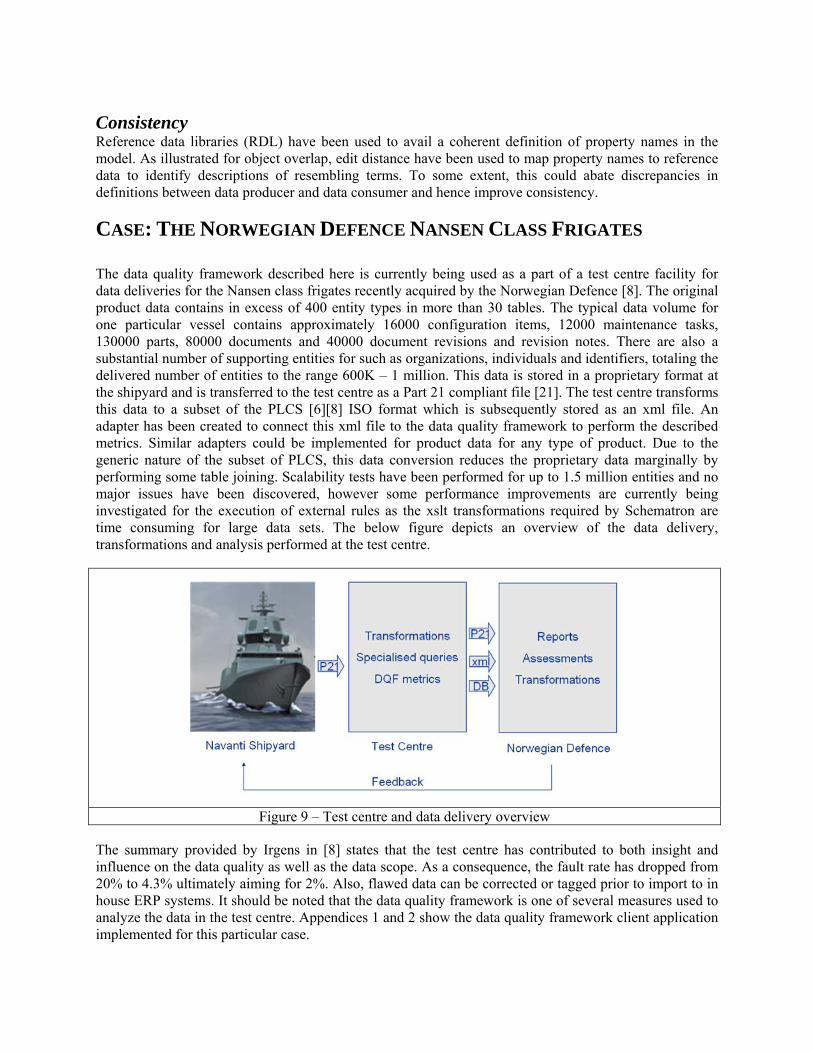
CASE: THE NORWEGIAN DEFENCE NANSEN CLASS FRIGATES The data quality framework described here is currently being used as a part of a test centre facility for data deliveries for the Nansen class frigates recently acquired by the Norwegian Defence [8]. The original product data contains in excess of 400 entity types in more than 30 tables. The typical data volume for one particular vessel contains approximately 16000 configuration items, 12000 maintenance tasks, 130000 parts, 80000 documents and 40000 document revisions and revision notes. There are also a substantial number of supporting entities for such as organizations, individuals and identifiers, totaling the delivered number of entities to the range 600K – 1 million. This data is stored in a proprietary format at the shipyard and is transferred to the test centre as a Part 21 compliant file [21]. The test centre transforms this data to a subset of the PLCS [6][8] ISO format which is subsequently stored as an xml file. An adapter has been created to connect this xml file to the data quality framework to perform the described metrics. Similar adapters could be implemented for product data for any type of product. Due to the generic nature of the subset of PLCS, this data conversion reduces the proprietary data marginally by performing some table joining. Scalability tests have been performed for up to 1.5 million entities and no major issues have been discovered, however some performance improvements are currently being investigated for the execution of external rules as the xslt transformations required by Schematron are time consuming for large data sets. The below figure depicts an overview of the data delivery, transformations and analysis performed at the test centre.
Figure 9 – Test centre and data delivery overview
The summary provided by Irgens in [8] states that the test centre has contributed to both insight and influence on the data quality as well as the data scope. As a consequence, the fault rate has dropped from 20% to 4.3% ultimately aiming for 2%. Also, flawed data can be corrected or tagged prior to import to in house ERP systems. It should be noted that the data quality framework is one of several measures used to analyze the data in the test centre. Appendices 1 and 2 show the data quality framework client application implemented for this particular case.
DISCUSSION This article describes the implementation and practical use of a system that attempts to provide a generic and coherent data quality framework facilitating both measures for defined data quality dimensions as well as contributing actively in some pragmatic quality activities. Aesthetic requirements are imposed on the data models to transform complex design patterns to human comprehensible parent – child based breakdown structures (tree views) facilitating both top – down as well as bottom – up traversal of the model. The system implements color coded and hyperlinked charts extensively to aid navigation and fault drilldowns. The graphical reports can be used actively to abate faults in the source as well as to prepare the receiving part for what to expect as an aid to design downstream processes accordingly. The generic nature of the data quality measures is achieved by leveraging the meta model reflection implemented in the Microsoft .NET Common Language Runtime described by Richter [16].
In addition to reporting issues and tracking history along the previously described dimensions, the data quality framework also has been used to report several domain specific issues such as
- language inconsistencies (internationalization) such as Y(Yes) versus Si(S) for true/false values (identified by constraints),
- referential mismatches, keys in the master data pointing to external tables rather than documents or drawings (identified by value inspection), and
- unit/value mismatch, (eg. wrong currency used for cost fields, typically identified by matching cost fields and non-matching currency fields)
The above data flaws have been detected by reporting on the generic dimension values as well as by developing custom rules to assert all value, uniqueness and cardinality constraints. Detailed reports on all aspects of the data quality for the naval vessels are not provided here.
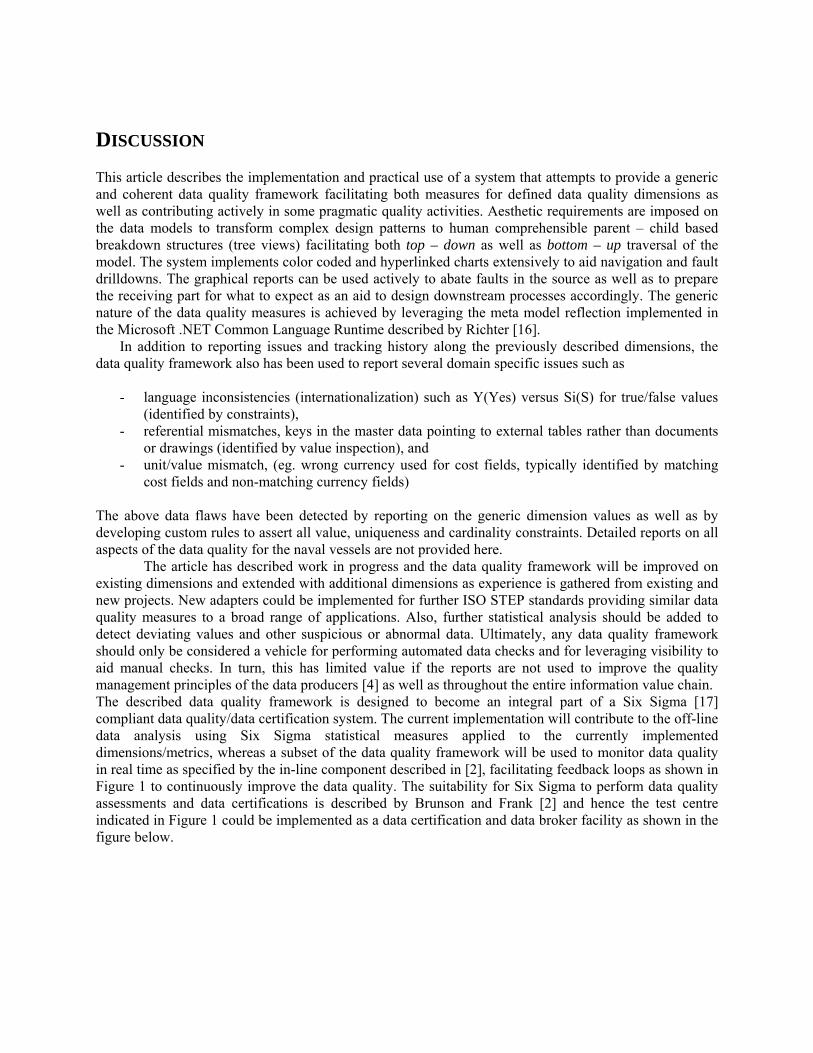
The article has described work in progress and the data quality framework will be improved on existing dimensions and extended with additional dimensions as experience is gathered from existing and new projects. New adapters could be implemented for further ISO STEP standards providing similar data quality measures to a broad range of applications. Also, further statistical analysis should be added to detect deviating values and other suspicious or abnormal data. Ultimately, any data quality framework should only be considered a vehicle for performing automated data checks and for leveraging visibility to aid manual checks. In turn, this has limited value if the reports are not used to improve the quality management principles of the data producers [4] as well as throughout the entire information value chain. The described data quality framework is designed to become an integral part of a Six Sigma [17] compliant data quality/data certification system. The current implementation will contribute to the off-line data analysis using Six Sigma statistical measures applied to the currently implemented dimensions/metrics, whereas a subset of the data quality framework will be used to monitor data quality in real time as specified by the in-line component described in [2], facilitating feedback loops as shown in Figure 1 to continuously improve the data quality. The suitability for Six Sigma to perform data quality assessments and data certifications is described by Brunson and Frank [2] and hence the test centre indicated in Figure 1 could be implemented as a data certification and data broker facility as shown in the figure below.
Figure 10 – Test centre facilitating data certification and data quality assessment
CONCLUSION Meta data reflection has successfully been used to implement several general data quality metrics. The generic metrics are applied to domain specific product data by deploying thin adapters to map the domain model to the generic internals of the data quality framework. User defined rules can be defined and applied to the domain specific models by leveraging xml based standards such as xslt and Schematron. The described framework has proved to provide a rapid and extensible application of generic data quality measures to disparate data sources. REFERENCES
[1] Batini, C. and Scannapieco, M., “Data Quality, Concepts, Methodologies and Techniques”, Springer , 2006
[2] Brunson, D. and Frank, S. , “Six Sigma Data Quality Processes”, http://www.b-eye- network.com/view/2756, May 2, 2006
[3] Eckel, B., “Thinking in Java”, Second Edition, Prentice Hall Inc., 2000 [4] English, L., “Improving Data Warehouse and Business Information Quality”, Wiley Computer
Publishing, 1999 [5] EuroStep, “Product Life Cycle Support”,http://www.plcs-resources.org/ [6] Gibson, M., “UK MoD Implementation of PLCS”, DoD PLCS Meeting, Arlington, USA, 2006 [7] Helfert, M., “Managing and Measuring Data Quality in Data Warehousing”, Institute of
Information Management, University of St. Gallen, Switzerland

[8] Irgens, T. A., “Exploiting Product Life Cycle Support”, Transatlantic PLCS/10303 Meeting, 2006
[9] Jeliffe, R., Resource Directory for Schematron 1.5, http://xml.ascc.net/schematron/ [10] Kasnakoglu, H. and Mayo, R., “FAO Statistical Data Quality Framework: A multi-layered
approach to monitoring and assessment”, Conference on Data Quality for International Organizations, Wiesbaden, Germany, 27 and 28 May 2004
[11] Loshin, D., “Data Profiling, Data Integration and Data Quality: The Pillars of Master Data Management”, Business Intelligence Network Research Report, Powell Media, 2007
[12] Masaaki, I., “Gemba Kaizen”, McGraw-Hill, 1997 [13] Mason, H., “ISO 10303 – STEP, A key standard for the global market”, ISO Bulletin, 2002 [14] Naumann, F., Freytag, J.C. and Leser, U., “Completeness of Integrated Information Sources”,
Information Systems 29 (7), 583-615, 2004 [15] Price, R. and Shanks, G., ”Empirical Refinement of a Semiotic Information Quality
Framework”, Proceedings of the 38th Hawaii International Conference on System Sciences, 2005. [16] Richter, J., “CLR via C#”, Microsoft Press, 2006 [17] Shroyer, L., “Motorolas Six Steps to Six Sigma”, John Wiley & Sons, 1991 [18] Stang, J., “STEP and XML: Expressing and Validating STEP Constraints in XML”, DNV,
Internal Report, 2007 [19] Toub, S., “Generic Levenshtein edit distance with C#”,
http://blogs.msdn.com/toub/archive/2006/05/05/590814.aspx#591140 [20] Warmer, J. and Kleppe, A., “The Object Constraint Language – Precise Modelling with UML”,
Addison Wesley, 1999 [21] Wikipedia,”ISO 10303 - 21”, http://en.wikipedia.org/wiki/ISO_10303-21 [22] Zackwehdex, S., “Super Fast String Edit Distance Algorithm”,
http://siderite.blogspot.com/2007/01/super-fast-string-distance-algorithm.html#top, Jan. 09, 2007