energystoragediscover effective control, testing and ... · energystoragediscover effective...
TRANSCRIPT

EnergyStorageDiscoverEffective control, testing and evaluation: Software for energy storage tests

Extensive tests are necessary for successful development and production of batteries. This requires a test, control and evaluation software that offers the users a wide range of different options as well as an intuitive operating concept and also provides meaningful and reproducible test results.
The Scienlab solutionThe software application EnergyStorageDiscover (ESD) meets these high requirements. The software is being continuously further developed and adapted to new requirements based on continuous exchange of information and experiences with Scienlab customers. ESD allows time-synchronous control of all Scienlab battery test systems for cells, modules and packs as well as all test environment components and also permits validation of all energy storage types. Customized test scenarios can be created, edited, controlled and monitored. The standard-ized remote interface allows straightforward integration of test benches into a higher-level control and monitoring system.
Test scenarios
Function, aging, environment and performance tests
Standardized and standard-compliant tests (e.g. ISO, DIN EN, SAE)
Determination of internal resistance, charge, energy, capacity, efficiency, cyclic and calendrical durability, temperature behavior
and mechanical resistance
Analysis of durability, range and efficiency
Investigation of electrical and thermal properties
Electrochemical impedance measurement and cyclic voltammetry
Integration of all test bench components in the test sequenceIn addition to the battery test systems, it is also possible to integrate other components into the ESD environment and test sequence if required. Their measured values can already be logged, monitored and evaluated as variables during the test sequence and then incorporated in the rest of the test procedure. These components include, for example:
Battery Management System Climate/temperature chambers and DUT conditioning Customer chargers Scienlab Measurement & Control Modules for flexible recording of voltages, temperatures and use of additional digital inputs and outputs
Scienlab Test Bench Guard as a higher-level, independent safety system for monitoring the entire test bench
Transparency, intuitive operation and easy-to-learn ...... these are the most important features that allow our customers to work smoothly and efficiently. ESD offers an extensive range of options: from intuitive creation of simple and complex tests and user-friendly evaluation through to individual assignment of names and units for any parameters (mapping).
Test programming made easyIn spite of the large range of functions available for test creation, ESD is intuitive, extremely user- friendly and requires only short familiarization times. The syntax check flags any errors directly during programming and therefore allows these to be corrected immediately without the need for time- consuming debugging. Complex test sequences can be structured clearly through creation of (sub-)routines and management of these routines in libraries.
Targeted evaluation without post-processingIntelligently designed functions make data evalua-tion much easier – and this is already possible while tests are running. Extensive measurement data is also visualized clearly in tables and graphs. It is possible to zoom in and out of graphs and mark relevant values by means of the mouse scroll function. The user defines the values which are to be output and exported. Time-consuming post-processing is not required.
Highlights – What our customers value about ESD
2
EnergyStorageDiscoverEffective control, testing and evaluation: Software for energy storage tests

3
Efficient use of electrical energy
Safety of device under test (DUT), test bench and test bench operator The user can individually define limit values as part of test creation or during the actual test. Limit monitoring (e.g. when using the Scienlab Test Bench Guard) takes place redundantly and results in automatic shut-down of the test systems if the upper or lower limit values are exceeded.
Programming, control and evaluation
System and test controlESD offers an extensive test control tool for live observation of the measurement data. This allows the user to react directly to anomalies in the test sequence, make any necessary correc-tions and also integrate calculated variables and arithmetic results. In addition, the overall and detailed views of the individual channels allow monitoring of the complete test environment, which can be controlled by start, stop, pause and reset functions as well as jumps to any test steps.
Test programming
Programming is performed using commands based on common high-level language elements. Loops, nesting and subroutines are possible. Tests, subroutines, battery data and parameters can be managed in libraries and combined with each other.
Simple and intuitive programming language and clear tabular representation
Use of chronological value tables or real driving profiles (import of .csv or .txt files possible) for simulation of current, voltage and power characteristics with minimum increments of up to 1 ms
"Dynamic source parametrization": modification of source parameters while the source is active. Values can be supplied by calculation, reading out variable content or external input signals in order to follow the limit settings of a BMS, for example
Communication with the BMS directly in the test sequence (CCP/XCP utilization)
Determination of DUT values by means of integrated impedance spectroscopy and cyclic voltammetry
DUT-independent creation of test sequences using variables for different DUT types
Dynamic parallel connection of power stages to increase the output current temporarily during the test phase
Definition of parallel processes: independent execution of different actions during the test procedure (e.g. control of DUT temperature conditioning)
Measurement data evaluation
The user defines which values are to be measured and recorded. Evaluation is already possible during measurement and is made much easier by extensive scaling and measurement tools. Powerful measurement data graphs during the entire test for fast and convenient evaluation of also very large data volumes
Direct evaluation and immediate comparison of several test runs in one graph
Static measurement data recording (up to 20 kHz) with constant rate or dynamic recording for reduced measurement data volume
Common time stamp for time-synchronous measurement data analysis in millisecond intervals
Execution of comprehensive statistical and arithmetic calculations directly in the test sequence: averaging, integral/differential value, minimum/maximum value, logical operations, comparative operations, interpolations and extrapolations by means of linear interpolation/extrapolation or linear regression
Export of selected measured values in common file formats (.mdf, .csv, .txt) as well as graphics as .jpg, .png etc.
Recording and evaluation of all CAN communication during the test period time-synchronized with all other measured variables by means of optional CANLogger
Optional ESD ReportViewer for measurement data evaluation independently of ESD

4
Test programming Measurement evaluationTest scenario
Example test scenarios realized with ESD Ce
ll pr
otot
ype
Reference electrodes used for analysis of electrode processes (e.g. in cyclic voltammetry) can be actively integrated in the test program for measurement purposes. This means that it is possible to select the voltage measurement between anode/cathode, cathode/reference electrode or anode/reference electrode for each control mode and carry out active adjustment based on the potential of the reference electrode, for example.
Characterization of cell specimens Ongoing research is dedicated to identifying new material combinations for battery cells with the goal of optimizing power and energy density, safety, durability and costs of energy storage devices. Cell specimens are set up and characterized to achieve this. In addition to the typical test methods, cyclic voltammetry is used as an analytical method for determining the electrode processes.
Cell
Charge and energy meters integrated in the test system allow precise determination of the supplied and removed charge and energy and the resultant efficiency. Calculations such as internal resistance determination in accordance with VDA can be performed in ESD and the results output in the report. Impedance spectroscopy is also directly pro-grammable in the test sequence.
Characterization of the cell The cell is the basis for every energy storage device. For this reason, it is therefore charac-terized extensively and its performance capability evaluated at an early stage in development. A so-called benchmark test is performed for this purpose where suitable cells are selected on the basis of the datasheets and compared with each other. The analysis of parameters such as internal resistance, capacity, efficiency, cyclical and calendrical durability, temperature behavior and mechanical resistance is of particular interest here. An impe- dance measurement (EIS) may be helpful here, for example.

5
Measurement evaluation Advantages of ESD
Separate connection for one reference electrode in each test channel in the Scienlab test system
Control based on all 3 voltages possible: anode/cathode, cathode/reference electrode, anode/reference electrode
No additional program required for the I(U) representation of cyclic voltammetry since this is already integrated in ESD
Scienlab test systems also suit-able for high-voltage materials up to 8 V
The left screenshot shows a delta-shaped potential change between two arbitrary electrodes (cyclic voltammetry). The right screenshot visualizes the measured current of the cell prototype as a function of the defined voltage. Both representations are already available to the user for analysis during the test sequence.
The results of impedance spectroscopy can be visualized in both Bode and Nyquist plots. The left part of the illustration shows the real and imaginary parts plotted over time so that the rest of the test can be clearly represented in one graph. The right part of the graph shows a pulse power profile in accordance with ISO12405-1. The calculations required for this can be performed directly in the test program and output in the graph. Evaluation is particu-larly convenient due to output and labeling of all test-relevant parameters and calculated values. This also eliminates the need for sub-sequent processing of the measured values.
Separate impedance spectros-copy integrated in each channel of Scienlab test systems: directly programmable in the test sequence without the need to change DUT contacting
Direct evaluation of data possible: high level of comfort and enor-mous time savings since no post-processing is required
Simple and user-friendly analy-sis of large amounts of data by zooming in and out using the mouse scroll function

6
Test programmingTest scenario
Mod
ule
incl
. BM
S
BMS values can be written or used as read variables in the test sequence. It is therefore possible for the BMS to control the output source directly. This allows dynamic limits to be tested. It is possible to switch the power supply terminals and also additionally record and control ana-log and digital inputs and outputs. Since these measured values are integrated time-synchronously in the test sequence, they can also be used as a substitute for a BMS, including load balancing.
Interaction of module and BMSSeveral battery cells and the BMS are combined to produce battery systems for automotive 12 V or 48 V on-board electrical systems and power tools or for installation in HV battery systems for electric vehicles. It is interesting here to know how much the module heats up, the extent to which the BMS influences the module performance (balancing, shut-down thresholds, etc.) and how well the BMS functions (accuracy, com-pleteness and plausibility of the measured values, function and plausibility of operating modes, etc.).
Pack
incl
. BM
S
All relevant battery system and laboratory components can be integrated in the test sequence: BMS, temperature and climate chambers, digital and analog signals, terminals (e.g. terminals 15, 30), safety-relevant components such as the Scienlab Test Bench Guard, etc.
Interaction of all battery system and test bench components A battery pack must be tested as an overall system with all its functions and with the interaction of all components such as BMS, cooling system and electrical system. This includes in particular functioning and internal communication of all electrical and mechanical components, external commu-nication, functioning of the cooling system as well as the thermal and electrical beha-vior of the pack. Reproducible electrical and climatic conditions must be created for this so that it is possible to draw conclusions about the durability, range and efficiency.
In ESD, the user can import profiles via .csv or .txt files or create them manually. Profiles such as real measured charging and discharge profiles or New European Driving Cycle (NEDC) can then be used to specify different parameters such as current, voltage or power. Tracking of the test sequences with a level of accuracy in the millisecond range is possible without any problems. Parameters such as charge and energy throughput, state of charge or statistical means can be calculated during profile execution.
Driving profiles On pack level, the focus of testing is realistic replication of the future applica-tion so that the system behavior can be analyzed before the first field application. Profiles (e.g. driving profiles for automotive applications or load profiles for stationary storage devices) are used in order to carry out testing as specifically as possible.
Measurement evaluation
7The texts, photos, and illustrations contained within this document are protected by copyright laws. Their use, distribution, or duplication is only permitted in agreement with Scienlab electronic systems GmbH.
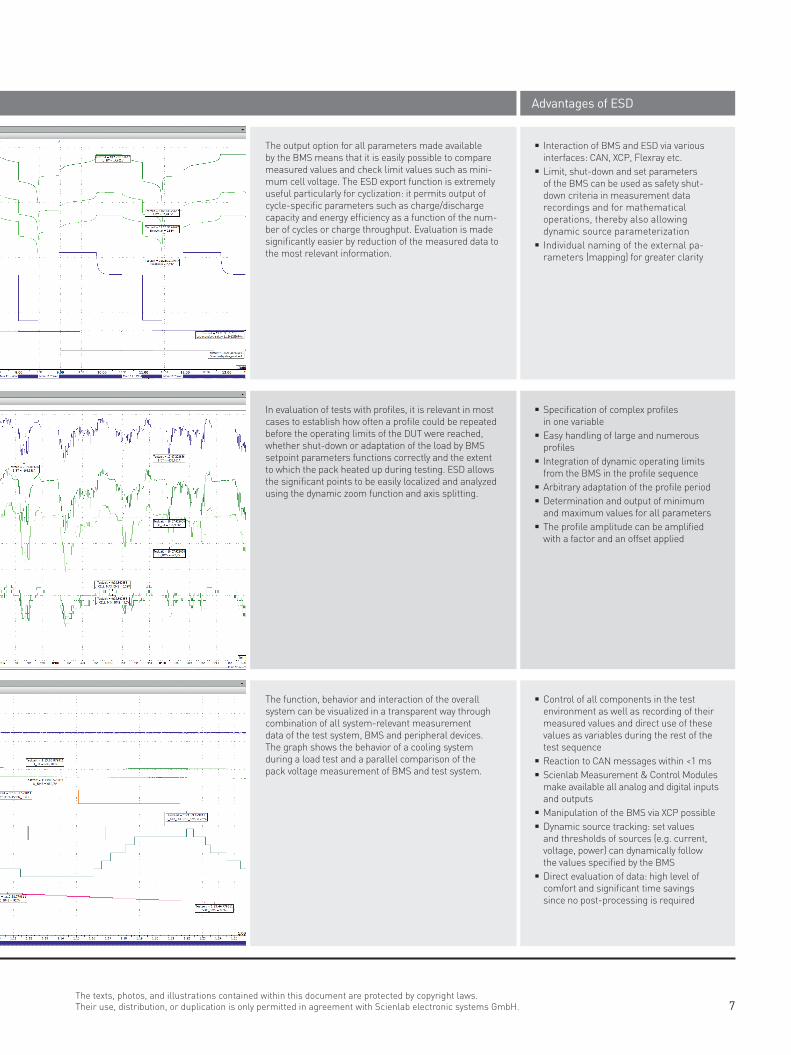
The output option for all parameters made available by the BMS means that it is easily possible to compare measured values and check limit values such as mini-mum cell voltage. The ESD export function is extremely useful particularly for cyclization: it permits output of cycle-specific parameters such as charge/discharge capacity and energy efficiency as a function of the num-ber of cycles or charge throughput. Evaluation is made significantly easier by reduction of the measured data to the most relevant information.
Interaction of BMS and ESD via various interfaces: CAN, XCP, Flexray etc.
Limit, shut-down and set parameters of the BMS can be used as safety shut- down criteria in measurement data recordings and for mathematical operations, thereby also allowing dynamic source parameterization
Individual naming of the external pa-rameters (mapping) for greater clarity
The function, behavior and interaction of the overall system can be visualized in a transparent way through combination of all system-relevant measurement data of the test system, BMS and peripheral devices. The graph shows the behavior of a cooling system during a load test and a parallel comparison of the pack voltage measurement of BMS and test system.
Control of all components in the test environment as well as recording of their measured values and direct use of these values as variables during the rest of the test sequence
Reaction to CAN messages within <1 ms Scienlab Measurement & Control Modules make available all analog and digital inputs and outputs
Manipulation of the BMS via XCP possible Dynamic source tracking: set values and thresholds of sources (e.g. current, voltage, power) can dynamically follow the values specified by the BMS
Direct evaluation of data: high level of comfort and significant time savings since no post-processing is required
In evaluation of tests with profiles, it is relevant in most cases to establish how often a profile could be repeated before the operating limits of the DUT were reached, whether shut-down or adaptation of the load by BMS setpoint parameters functions correctly and the extent to which the pack heated up during testing. ESD allows the significant points to be easily localized and analyzed using the dynamic zoom function and axis splitting.
Specification of complex profiles in one variable
Easy handling of large and numerous profiles
Integration of dynamic operating limits from the BMS in the profile sequence
Arbitrary adaptation of the profile period Determination and output of minimum and maximum values for all parameters
The profile amplitude can be amplified with a factor and an offset applied
Measurement evaluation Advantages of ESD

Scienlab electronic systems GmbHLise-Meitner-Allee 2744801 BochumGermanyphone +49 234 41 75 78 0fax +49 234 41 75 78 10web www.scienlab.demail [email protected]
P-ES
D-1E
-914