energypoint research-ratings-tables-july... · stock price returns of publicly traded u.s.-listed...
TRANSCRIPT

Supplier Name
Survey
End Date
Survey
Type Ticker
Total Sat
Quartile
Relative Total
Satisfaction
Rating
12-Mo
Relative
Return
24-Mo
Relative
Return
Grey Wolf 1/16/04 Services GW 1 0.69 -5.3% -20.2%
Helmerich & Payne 1/16/04 Services HP 1 0.66 -9.6% 32.2%
Precision Drilling 1/16/04 Services PDS 1 1.07 5.6% 22.0%
Smith International 1/16/04 Services SII 1 0.47 4.1% -38.3%
Transocean 1/16/04 Services RIG 1 0.64 38.7% 71.3%
Grant Prideco 3/18/05 Products GRP 1 0.43 2.3% 2.0%
Lufkin Industries 3/18/05 Products LUFK 1 0.78 64.3% 64.1%
Natco Group 3/18/05 Products NTG 1 0.69 52.8% 67.6%
Smith International 3/18/05 Products SII 1 0.68 -45.8% -40.4%
Core Laboratories 7/5/06 Services CLB 1 0.57 50.5% 73.2%
ENSCO International 7/5/06 Services ESV 1 0.97 22.3% 17.2%
Helmerich & Payne 7/5/06 Services HP 1 0.69 1.2% 85.5%
Noble Drilling 7/5/06 Services NE 1 0.72 13.3% 16.3%
Rowan Companies 7/5/06 Services RDC 1 1.04 -1.9% -26.6%
Newpark Resources 7/5/07 Products NR 1 0.71 -33.2% -21.6%
Smith International 7/5/07 Products SII 1 1.43 12.5% -16.1%
ENSCO 12/31/08 Services ESV 1 0.54 26.1% 21.3%
Helmerich & Payne 12/31/08 Services HP 1 1.30 28.2% 36.8%
Lufkin Industries 12/31/08 Products LUFK 1 1.15 35.7% 31.2%
Newpark Resources 12/31/08 Products NR 1 0.53 -67.2% 4.5%
Precision Drilling 12/31/08 Services PDS 1 0.79 -61.2% -62.7%
Rowan Companies 12/31/08 Services RDC 1 0.73 -24.8% 47.3%
Smith International 12/31/08 Products SII 1 1.11 -73.0% **
ENSCO 12/31/09 Services ESV 1 0.67 35.4% 43.2%
Helmerich & Payne 12/31/09 Services HP 1 1.44 -0.7% 25.7%
Lufkin Industries 12/31/09 Products LUFK 1 1.07 32.2% 16.2%
Newpark Resources 12/31/09 Products NR 1 0.45 5.6% 61.7%
Noble Drilling 12/31/09 Services NE 1 0.65 -11.9% -3.5%
Core Laboratories 12/31/10 Services CLB 1 0.56 28.4% 24.4%
ENSCO 12/31/10 Services ESV 1 0.78 -9.2% 18.0%
Gardner Denver 12/31/10 Products GDI 1 0.98 11.8% -0.3%
Helmerich & Payne 12/31/10 Services HP 1 1.51 19.9% 15.8%
Newpark Resources 12/31/10 Services NR 1 0.45 54.5% 27.6%
Noble Drilling 12/31/10 Services NE 1 0.41 -13.0% 1.6%
Oceaneering 12/31/10 Products OII 1 0.43 26.2% 49.1%
TETRA Technologies 12/31/10 Services TTI 1 1.22 -22.9% -37.4%
ENSCO 12/31/11 Services ESV 1 0.92 29.9% **
Gardner Denver 12/31/11 Products GDI 1 1.10 -10.8% **
Helmerich & Payne 12/31/11 Services HP 1 1.03 -3.5% **
Newpark Resources 12/31/11 Services NR 1 0.58 -17.4% **
Pason Systems 12/31/11 Products PSYTF 1 1.50 42.8% **
Rowan Companies 12/31/11 Services RDC 1 0.46 3.1% **
TETRA Technologies 12/31/11 Services TTI 1 1.31 -18.7% **
FIRST QUARTILE AVERAGE 0.83 5.1% 17.4%
ENERGYPOINT RESEARCH
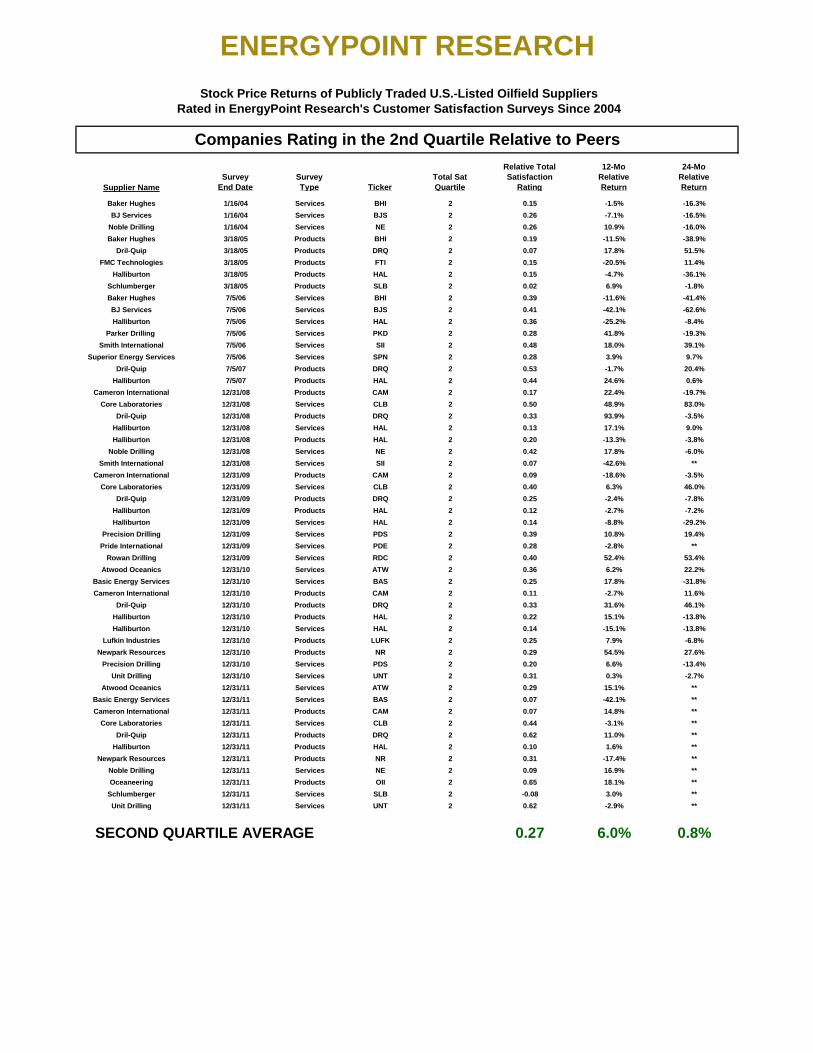
Stock Price Returns of Publicly Traded U.S.-Listed Oilfield Suppliers
Rated in EnergyPoint Research's Customer Satisfaction Surveys Since 2004
Companies Rating in the 1st Quartile Relative to Peers
ENERGYPOINT RESEARCH
Stock Price Returns of Publicly Traded U.S.-Listed Oilfield Suppliers
Rated in EnergyPoint Research's Customer Satisfaction Surveys Since 2004
Supplier Name
Survey
End Date
Survey
Type Ticker
Total Sat
Quartile
Relative Total
Satisfaction
Rating
12-Mo
Relative
Return
24-Mo
Relative
Return
Baker Hughes 1/16/04 Services BHI 2 0.15 -1.5% -16.3%
BJ Services 1/16/04 Services BJS 2 0.26 -7.1% -16.5%
Noble Drilling 1/16/04 Services NE 2 0.26 10.9% -16.0%
Baker Hughes 3/18/05 Products BHI 2 0.19 -11.5% -38.9%
Dril-Quip 3/18/05 Products DRQ 2 0.07 17.8% 51.5%
FMC Technologies 3/18/05 Products FTI 2 0.15 -20.5% 11.4%
Halliburton 3/18/05 Products HAL 2 0.15 -4.7% -36.1%
Schlumberger 3/18/05 Products SLB 2 0.02 6.9% -1.8%
Baker Hughes 7/5/06 Services BHI 2 0.39 -11.6% -41.4%
BJ Services 7/5/06 Services BJS 2 0.41 -42.1% -62.6%
Halliburton 7/5/06 Services HAL 2 0.36 -25.2% -8.4%
Parker Drilling 7/5/06 Services PKD 2 0.28 41.8% -19.3%
Smith International 7/5/06 Services SII 2 0.48 18.0% 39.1%
Superior Energy Services 7/5/06 Services SPN 2 0.28 3.9% 9.7%
Dril-Quip 7/5/07 Products DRQ 2 0.53 -1.7% 20.4%
Halliburton 7/5/07 Products HAL 2 0.44 24.6% 0.6%
Cameron International 12/31/08 Products CAM 2 0.17 22.4% -19.7%
Core Laboratories 12/31/08 Services CLB 2 0.50 48.9% 83.0%
Dril-Quip 12/31/08 Products DRQ 2 0.33 93.9% -3.5%
Halliburton 12/31/08 Services HAL 2 0.13 17.1% 9.0%
Halliburton 12/31/08 Products HAL 2 0.20 -13.3% -3.8%
Noble Drilling 12/31/08 Services NE 2 0.42 17.8% -6.0%
Smith International 12/31/08 Services SII 2 0.07 -42.6% **
Cameron International 12/31/09 Products CAM 2 0.09 -18.6% -3.5%
Core Laboratories 12/31/09 Services CLB 2 0.40 6.3% 46.0%
Dril-Quip 12/31/09 Products DRQ 2 0.25 -2.4% -7.8%
Halliburton 12/31/09 Products HAL 2 0.12 -2.7% -7.2%
Halliburton 12/31/09 Services HAL 2 0.14 -8.8% -29.2%
Precision Drilling 12/31/09 Services PDS 2 0.39 10.8% 19.4%
Pride International 12/31/09 Services PDE 2 0.28 -2.8% **
Rowan Drilling 12/31/09 Services RDC 2 0.40 52.4% 53.4%
Atwood Oceanics 12/31/10 Services ATW 2 0.36 6.2% 22.2%
Basic Energy Services 12/31/10 Services BAS 2 0.25 17.8% -31.8%
Cameron International 12/31/10 Products CAM 2 0.11 -2.7% 11.6%
Dril-Quip 12/31/10 Products DRQ 2 0.33 31.6% 46.1%
Halliburton 12/31/10 Products HAL 2 0.22 15.1% -13.8%
Halliburton 12/31/10 Services HAL 2 0.14 -15.1% -13.8%
Lufkin Industries 12/31/10 Products LUFK 2 0.25 7.9% -6.8%
Newpark Resources 12/31/10 Products NR 2 0.29 54.5% 27.6%
Precision Drilling 12/31/10 Services PDS 2 0.20 6.6% -13.4%
Unit Drilling 12/31/10 Services UNT 2 0.31 0.3% -2.7%
Atwood Oceanics 12/31/11 Services ATW 2 0.29 15.1% **
Basic Energy Services 12/31/11 Services BAS 2 0.07 -42.1% **
Cameron International 12/31/11 Products CAM 2 0.07 14.8% **
Core Laboratories 12/31/11 Services CLB 2 0.44 -3.1% **
Dril-Quip 12/31/11 Products DRQ 2 0.62 11.0% **
Halliburton 12/31/11 Products HAL 2 0.10 1.6% **
Newpark Resources 12/31/11 Products NR 2 0.31 -17.4% **
Noble Drilling 12/31/11 Services NE 2 0.09 16.9% **
Oceaneering 12/31/11 Products OII 2 0.65 18.1% **
Schlumberger 12/31/11 Services SLB 2 -0.08 3.0% **
Unit Drilling 12/31/11 Services UNT 2 0.62 -2.9% **
SECOND QUARTILE AVERAGE 0.27 6.0% 0.8%
Companies Rating in the 2nd Quartile Relative to Peers

ENERGYPOINT RESEARCH
Stock Price Returns of Publicly Traded U.S.-Listed Oilfield Suppliers
Rated in EnergyPoint Research's Customer Satisfaction Surveys Since 2004
Supplier Name
Survey
End Date
Survey
Type Ticker
Total Sat
Quartile
Relative Total
Satisfaction
Rating
12-Mo
Relative
Return
24-Mo
Relative
Return
Diamond Offshore 1/16/04 Services DO 3 0.08 65.4% 144.7%
GlobalSantaFe 1/16/04 Services GSF 3 0.00 -33.6% -68.2%
Halliburton 1/16/04 Services HAL 3 -0.17 21.6% 31.7%
Parker Drilling 1/16/04 Services PKD 3 0.03 -13.7% 105.1%
Schlumberger 1/16/04 Services SLB 3 -0.14 -10.1% -24.3%
BJ Services 3/18/05 Products BJS 3 -0.10 -36.5% -75.4%
Hydril 3/18/05 Products HYDL 3 -0.09 -41.0% -21.6%
Precision Drilling 3/18/05 Services PDS 3 -0.41 -21.1% -71.0%
Basic Energy Services 7/5/06 Services BAS 3 -0.36 -34.8% -44.1%
Precision Drilling 7/5/06 Services PDS 3 0.24 -34.5% -47.7%
Pride International 7/5/06 Services PDE 3 0.23 3.5% -8.4%
Schlumberger 7/5/06 Services SLB 3 0.22 19.0% 14.3%
Tesco Corp 7/5/06 Services TESO 3 -0.29 28.0% -5.4%
Transocean 7/5/06 Services RIG 3 0.25 15.7% 30.4%
Weatherford Int'l 7/5/06 Services WFT 3 -0.11 -7.0% 28.0%
Baker Hughes 7/5/07 Products BHI 3 0.31 -25.4% -16.4%
BJ Services 7/5/07 Products BJS 3 0.14 -13.9% -10.8%
Cameron International 7/5/07 Products CAM 3 0.39 21.7% 16.4%
Oceaneering 7/5/07 Products OII 3 -0.07 10.7% 25.6%
Schlumberger 7/5/07 Products SLB 3 0.05 -6.5% 4.1%
Weatherford Int'l 7/5/07 Products WFT 3 -0.06 33.2% 7.7%
Baker Hughes 12/31/08 Products BHI 3 0.05 -53.3% 1.9%
Baker Hughes 12/31/08 Services BHI 3 0.06 -22.8% -38.6%
BJ Services 12/31/08 Products BJS 3 -0.16 -16.0% **
BJ Services 12/31/08 Services BJS 3 0.06 14.4% **
Oceaneering 12/31/08 Products OII 3 -0.21 19.3% -15.3%
Patterson-UTI 12/31/08 Services PTEN 3 -0.35 -12.6% 13.7%
Pride Int'l 12/31/08 Services PDE 3 -0.09 7.6% 0.7%
Schlumberger 12/31/08 Products SLB 3 -0.30 -25.3% -11.1%
Schlumberger 12/31/08 Services SLB 3 -0.07 5.1% -18.9%
Transocean 12/31/08 Services RIG 3 -0.41 8.0% -25.2%
Weatherford Int'l 12/31/08 Products WFT 3 -0.25 -16.0% -13.8%
Baker Hughes 12/31/09 Products BHI 3 -0.03 3.0% -14.6%
Baker Hughes 12/31/09 Services BHI 3 -0.20 -3.1% -28.3%
Basic Energy Services 12/31/09 Services BAS 3 0.06 39.0% 70.2%
BJ Services 12/31/09 Products BJS 3 -0.55 13.7% 25.0%
Key Energy Services 12/31/09 Services KEG 3 -0.15 1.5% 24.9%
Oceaneering 12/31/09 Products OII 3 -0.29 -14.2% 33.9%
Schlumberger 12/31/09 Products SLB 3 -0.38 -10.0% -9.6%
Schlumberger 12/31/09 Services SLB 3 -0.11 -16.1% -43.4%
Unit Drilling 12/31/09 Services UNT 3 -0.11 -13.5% -12.9%
Weatherford Int'l 12/31/09 Products WFT 3 -0.33 -12.7% -28.3%
Weatherford Int'l 12/31/09 Services WFT 3 -0.35 -18.8% -69.4%
Baker Hughes 12/31/10 Products BHI 3 -0.11 -13.6% -26.5%
Baker Hughes 12/31/10 Services BHI 3 -0.10 13.6% -26.5%
FMC Technologies 12/31/10 Products FTI 3 -0.46 18.0% -3.2%
Nabors Industries 12/31/10 Services NBR 3 -0.80 -25.5% -37.9%
Rowan Companies 12/31/10 Services RDC 3 -0.06 -12.8% -10.1%
Schlumberger 12/31/10 Products SLB 3 -0.15 -17.0% -14.5%
Schlumberger 12/31/10 Services SLB 3 0.06 -17.0% -14.5%
Transocean 12/31/10 Services RIG 3 -0.27 -41.9% -31.4%
Weatherford Int'l 12/31/10 Services WFT 3 -0.10 35.6% -50.8%
Baker Hughes 12/31/11 Products BHI 3 -0.12 -14.9% **
Diamond Offshore 12/31/11 Services DO 3 -0.58 29.6% **
FMC Technologies 12/31/11 Products FTI 3 -0.51 -18.0% **
Halliburton 12/31/11 Services HAL 3 -0.15 1.6% **
Key Energy Services 12/31/11 Services KEG 3 -0.37 -55.1% **
Lufkin Industries 12/31/11 Products LUFK 3 -0.09 -13.6% **
Precision Drilling 12/31/11 Services PDS 3 0.23 -18.8% **
Schlumberger 12/31/11 Products SLB 3 -0.25 3.0% **
Tesco 12/31/11 Products TESO 3 -0.45 -9.9% **
Transocean 12/31/11 Services RIG 3 -0.23 18.2% **
Weatherford Int'l 12/31/11 Products WFT 3 -0.11 -23.6% **
Weatherford Int'l 12/31/11 Services WFT 3 -0.16 -23.6% **
THIRD QUARTILE AVERAGE -0.14 -5.8% -7.2%
Companies Rating in the 3rd Quartile Relative to Peers

ENERGYPOINT RESEARCH
Stock Price Returns of Publicly Traded U.S.-Listed Oilfield Suppliers
Rated in EnergyPoint Research's Customer Satisfaction Surveys Since 2004
Supplier Name
Survey
End Date
Survey
Type Ticker
Total Sat
Quartile
Relative Total
Satisfaction
Rating
12-Mo
Relative
Return
24-Mo
Relative
Return
ENSCO International 1/16/04 Services ESV 4 -1.05 -13.4% -42.3%
Key Energy Services 1/16/04 Services KEG 4 -1.28 -24.9% -93.6%
Nabors Industries 1/16/04 Services NBR 4 -0.67 -12.2% -41.4%
Patterson-UTI 1/16/04 Services PTEN 4 -0.59 -19.1% -8.1%
Weatherford Int'l 1/16/04 Services WFT 4 -0.48 4.2% -21.7%
Cooper Cameron 3/18/05 Products CAM 4 -0.53 -15.3% 28.7%
Varco 3/18/05 Products NOV 4 -1.50 -44.7% -36.9%
Weatherford Int'l 3/18/05 Products WFT 4 -0.55 -18.5% -33.1%
Diamond Offshore 7/5/06 Services DO 4 -0.77 12.2% 25.2%
GlobalSantaFe 7/5/06 Services GSF 4 -0.46 3.6% **
Grey Wolf 7/5/06 Services GW 4 -1.16 -17.9% -25.9%
Key Energy Services 7/5/06 Services KEG 4 -0.53 -0.7% -28.0%
Nabors Industries 7/5/06 Services NBR 4 -1.46 -21.4% -1.7%
Patterson-UTI 7/5/06 Services PTEN 4 -0.66 -26.3% -18.4%
Unit Drilling 7/5/06 Services UNT 4 -1.22 -9.6% -0.9%
FMC Technologies 7/5/07 Products FTI 4 -0.32 52.6% 36.4%
National Oilwell Varco 7/5/07 Products NOV 4 -1.39 34.0% -46.3%
Oil States International 7/5/07 Products OIS 4 -0.53 13.9% -2.0%
Technip-Coflexip 7/5/07 Products TKPPY.PK 4 -0.79 -20.8% 5.2%
Tesco 7/5/07 Products TESO 4 -0.81 -27.3% -34.2%
Basic Energy Services 12/31/08 Services BAS 4 -0.66 -82.8% -95.6%
Diamond Offshore 12/31/08 Services DO 4 -1.17 17.4% -38.1%
FMC Technologies 12/31/08 Products FTI 4 -0.47 61.3% 12.6%
Key Energy Services 12/31/08 Services KEG 4 -0.65 48.2% 72.4%
Nabors Industries 12/31/08 Services NBR 4 -1.13 34.7% 17.1%
National Oilwell Varco 12/31/08 Products NOV 4 -1.14 3.6% 12.9%
Oil States International 12/31/08 Products OIS 4 -0.57 28.7% 22.0%
Tesco 12/31/08 Products TESO 4 -0.79 -70.0% -18.1%
Unit Drilling 12/31/08 Services UNT 4 -0.60 10.9% -4.9%
Weatherford Int'l 12/31/08 Services WFT 4 -0.46 14.4% -11.3%
Diamond Offshore 12/31/09 Services DO 4 -0.44 -29.1% -17.5%
Nabors Industries 12/31/09 Services NBR 4 -1.33 -15.7% -42.9%
National Oilwell Varco 12/31/09 Products NOV 4 -1.64 14.0% 9.3%
Oil States International 12/31/09 Products OIS 4 -0.87 23.1% 26.7%
Patterson-UTI 12/31/09 Services PTEN 4 -1.02 19.2% 10.7%
Seadrill 12/31/09 Services SDRL 4 -1.14 -29.1% -43.5%
Tesco 12/31/09 Products TESO 4 -1.22 -17.0% -12.9%
Transocean 12/31/09 Services RIG 4 -0.45 -17.8% -32.1%
Diamond Offshore 12/31/10 Services DO 4 -0.37 -12.0% 14.1%
Key Energy Services 12/31/10 Services KEG 4 -0.23 18.4% -46.6%
MRC Global 12/31/10 Services MRC 4 -1.10 -25.5% -37.9%
National Oilwell Varco 12/31/10 Products NOV 4 -0.47 2.3% 3.5%
Patterson-UTI 12/31/10 Services PTEN 4 -1.20 -7.1% -12.3%
Seadrill 12/31/10 Services SDRL 4 -0.86 8.2% 34.3%
Superior Energy Services 12/31/10 Services SPN 4 -0.50 -18.7% -40.8%
Tesco 12/31/10 Products TESO 4 -0.61 -21.1% -28.9%
Tesco 12/31/10 Services TESO 4 -1.50 -21.1% -28.9%
Weatherford Int'l 12/31/10 Products WFT 4 -0.46 -35.6% -50.8%
Baker Hughes 12/31/11 Services BHI 4 -0.39 -14.9% **
Nabors Industries 12/31/11 Services NBR 4 -0.61 -16.7% **
National Oilwell Varco 12/31/11 Products NOV 4 -0.63 1.2% **
Patterson-UTI 12/31/11 Services PTEN 4 -1.27 -5.6% **
Seadrill 12/31/11 Services SDRL 4 -0.93 24.1% **
Tesco 12/31/11 Services TESO 4 -0.65 -9.9% **
FOURTH QUARTILE AVERAGE -0.82 -5.0% -14.2%
Companies Rating in the 4th Quartile Relative to Peers