energy usage and greenhouse gas emissions of...
TRANSCRIPT

C H A P T E R 1 : PA P E R 6 5
Energy Usage and Greenhouse Gas Emissionsof Pavement Preservation Processes for
Asphalt Concrete Pavements
Jim ChehovitsCrafco, Inc., Chandler, Arizona, United States
Larry GalehouseNational Center for Pavement Preservation, Okemos, Michigan, United States
A B S T R A C T
Use of pavement preservation treatments extends the remaining service life of asphalt concrete pavements.These treatments typically include spray applied surface seals, thin overlays, crack treatments, chip seals, slurryseal/micro surfacing, surface recycling and others. Each preservation treatment reduces damaging effects ofaging and deterioration of the pavement surface layer and helps protect the integrity of the underlying pave-ment structure. If proactive preservation treatments are not used, pavements deteriorate more rapidly andrequire major rehabilitation with structural overlays or reconstruction much earlier.
Every type of pavement strategy requires a series of energy using processes that impacts greenhouse gasemissions. Pavement rehabilitation and reconstruction require large amounts of energy to obtain and processraw materials, transport, mix and apply the final product, while pavement preservation processes requiremuch less energy to apply the final product to the road surface. This paper presents information on energyusage per unit area by comparing pavement life extensions of pavement preservation treatments to typicaldesign lives of reconstruction and rehabilitation techniques. Results show that pavement preservation treat-ments have significantly reduced energy use and greenhouse gas emissions compared to traditional rehabili-tation and reconstruction strategies.
K E Y W O R D S
Pavement Preservation, Energy Usage, Sustainability, Greenhouse Gasses, Asphalt Concrete Pavement
I N T R O D U C T I O N
Construction, rehabilitation, and maintenance of highway pavements require obtaining, processing, trans-porting, manufacturing, and placement of large amounts of construction materials. These activities use
27
P A P E R 6 5
27
Compendium of Papers from the First International Conference on Pavement Preservation
substantial amounts of energy and generate greenhouse gasses (GHG). Differing philosophies have existed, andstill exist, on the proper approach of managing, rehabilitating, and maintaining pavements. Methods rangefrom one extreme of allowing the pavement to deteriorate and then reconstructing; to using preservationtreatments to minimize effects of aging and maximize pavement life. Vastly different amounts of energy areconsumed with different construction, rehabilitation, and preservation techniques. These various techniquesalso provide differing amounts of pavement design lives and life extensions. For each preservation treatmentthe life extension can be compared to the required energy and GHG emissions to determine an annualizedenergy use and GHG emission level. To minimize energy and GHG emissions over the life of the pavement,treatments can be chosen as having the lowest annualized energy use and GHG emissions.
L I T E R A T U R E R E V I E W
Energy use and GHG emissions for the construction industry have been receiving increasing attention in re-cent years. The terms “Green”, “Sustainable Development”, “Environmental Impact”, “Energy Efficiency”,“Global Warming”, “Greenhouse Gases”, and “Eco-efficiency”, are becoming more widely recognized andused.
For buildings, the Leadership in Energy and Environmental Design (LEED) system has been developedto aid in design and construction to minimize environmental impacts. The LEED-ND (for NeighborhoodDevelopment) system includes some basic paving considerations in the analysis for multi-unit developments(US Green Building Council, 2008). The Greenroads system has been developed as a method to assess road-way sustainability. Greenroads enables owners, consultants and contractors to make informed decisions by pro-viding a sustainability performance metric for roadway design and construction. The system defines roadwaysustainability attributes, provides a system for evaluation of roadway sustainability, and includes a collectionof sustainable design and construction practices. The system includes 11 project requirements, including itemsranging from having pavement preservation and environmental maintenance plans to construction qualitycontrol and life cycle cost analysis. Credit can be given for several pavement technologies including warm mixasphalt, cool pavements, and quiet pavements, to name a few. Additional voluntary credits are available thatcan be added to produce a final Greenroads score. The score can be used for tracking and evaluating roadwayproject and system sustainability (Greenroads, 2009). BASF has developed an Eco-efficiency analysis methodthat can be applied to many products or systems (Uhlman, 2009). The process considers and evaluates six as-pects of a system including raw materials, land use, energy consumption, emissions, toxicity potential, and riskpotentials. This procedure has been used to compare eco-efficiency of several paving processes including hotmix overlays, micro-surfacing, and chip seals (Wall, 2004). Cold mix systems, such as micro-surfacing werefound to use less energy and to be more eco-efficient than hot-mix asphalt concrete, and emulsion chip sealswere found to require less energy and be more eco-efficient than hot-applied chip seals. The publication “RoadRehabilitation Energy Reduction Guide for Canadian Road Builders” (Canadian Construction Association,2005) was developed to provide information on methods to reduce energy usage during road construction andmaintenance operations. Suggestions are provided for reducing energy use during plant operations and con-struction operations. Chappat and Bilal (2003) reported an in-depth analysis of energy consumption andGHG emissions of over 20 different paving product types by ton of material placed. Their comparisons showthat PCC paving materials and processes demand the most energy, followed by hot mix asphalt (HMA) paving.The report also showed that cold in-place recycling (CIR) is the least energy intensive process. Dorchies (2008)reported on software that has been developed to quantify energy use and GHG emissions for various pave-ment structures based on material types and quantities. Terrel and Hicks (2008) analyzed energy use for hot
28

C H A P T E R 1 : PA P E R 6 5
in-place recycling (HIR) and determined the process utilizes less energy than hot mix asphalt (HMA) paving.Miller and Bahia (2009) in a report on sustainable pavements revealed that proactive maintenance is the leastenergy intensive process because minimal improvements are made to the pavement structure and surfacecourse. The authors suggest that cold process patching and surface treatments are the most energy efficient.
Extensive analysis of energy use and GHG emissions for the major construction processes was frequentlymentioned in the literature review. For preventive maintenance processes, there is limited reporting of en-ergy use and GHG emissions for several treatments with suitable conclusions. However, available reports donot always use the same base data and analysis methods, so comparisons between processes cannot readily bemade.
E N E R G Y U S E A N D G H G E M I S S I O N S F O R C O N S T R U C T I O N M A T E R I A L S
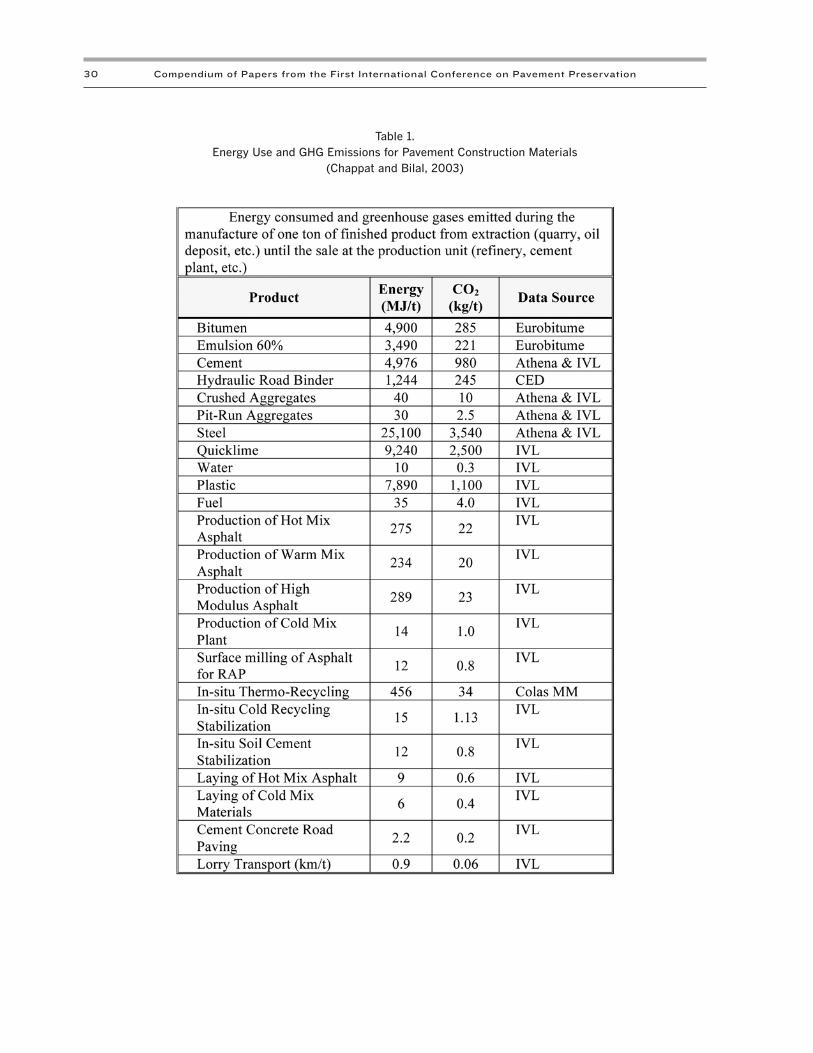
When determining energy use and GHG emissions of various preventive maintenance treatments, the firstissue is to determine the components of the process to measure. Some comparisons have been reported whichonly consider parts of the process, such as manufacturing or product placement. These comparisons can leadto misleading conclusions. A more accurate and realistic measure of energy use and GHG emissions of a spe-cific type of work, is to begin with obtaining the raw materials from the earth and adding all the operationsteps, such as transport, refining, manufacturing, mixing and placement. Table 1 was compiled by Chappat andBilal (2003) of energy consumption and GHG emissions for various construction products. The followingdiscussions of energy use for materials and processes are based on information from Table 1.
Materials
Most materials used in asphalt pavement construction, rehabilitation, and maintenance processes consist ofaggregates, of various gradations, and asphalt binders of different performance grades. The total energy usedis obtained by starting with the raw material extraction and progressing to transportation and processing/re-fining.
Aggregates
Energy consumption for aggregate production includes the quarrying, hauling, crushing, and screening. En-ergy consumption for aggregate production ranges from 25,850 to 34,470 BTU/t (30 to 40 MJ/t), and GHGemissions range from 5 to 20 lb CO2/t (2.5 to 10 kg CO2/t).
Asphalt
Energy consumption for asphalt binder production includes crude oil extraction, transport, and refining. En-ergy consumption for asphalt binders has been determined to be 4.2 mmBTU/t (4900 MJ/t), and GHG emis-sions are 570 lb CO2/t (285 kg CO2/t). For asphalt emulsions, energy consumption is 3.0 mmBTU/t (3490MJ/t) and GHG emissions are 442 lb CO2/t (221 kg CO2/t).
Manufacturing
Manufacturing includes all steps involved with handling, storing, drying, mixing, and preparation of materi-als for installation. Energy consumed varies depending on the specific material or product type. Typical man-ufacturing products for highway use include hot mix asphalt (HMA), cold mix, crack sealant, and drying
29
Compendium of Papers from the First International Conference on Pavement Preservation30
Table 1.Energy Use and GHG Emissions for Pavement Construction Materials
(Chappat and Bilal, 2003)
C H A P T E R 1 : PA P E R 6 5
surface dressing aggregate. Production of HMA consumes 237,000 BTU/t (275 MJ/t) and produces 44 lb CO2/t(22 kg CO2/t). Warm mix asphalt production, as reported in Table 1, consumes 201,000 BTU/t (234 MJ/t),approximately 15% less than HMA. It is noted that there are several warm mix asphalt processes for which en-ergy use varies depending on required production temperatures. Cold mix asphalt production only requires12,000 BTU/t (14 MJ/t) because of not needing to heat the aggregate to elevated mixing temperatures.
Transport to Work Site
The produced construction materials must be transported to the work site. Energy consumed on transportvaries with the distance and the quantity of material moved. Transport energy has been reported as 1,250BTU/t-mile (0.9 MJ/km-t) with 0.2 lb CO2/t-mile (0.06 kg CO2/km-t).
Placement and Construction
Placement and construction consists of all activities required to install the materials or products. This in-cludes traffic control, site and product preparation, compacting, finishing, clean up, waste disposal, etc. Thehighest energy consuming process for placement is hot in-place recycling (HIR) at 393,000 BTU/t (456 MJ/t)with 68 lb CO2/t (34 kg CO2/t) of GHG. This is due to the required heating to soften and reclaim the exist-ing pavement. Placement of asphalt concrete and cold mixes require between 5,170 and 7,750 BTU/t (6 to 9MJ/t) with 0.8 to 2.2 lb CO2/t (0.4 to 1.1 kg CO2/t) of GHG. Placement energy for PCC is the lowest at 1,900BTU/t (2.2 MJ/t) with 0.4 lb CO2/t (0.2 kg CO2/t) of GHG.
Total Energy Use and GHG Emissions
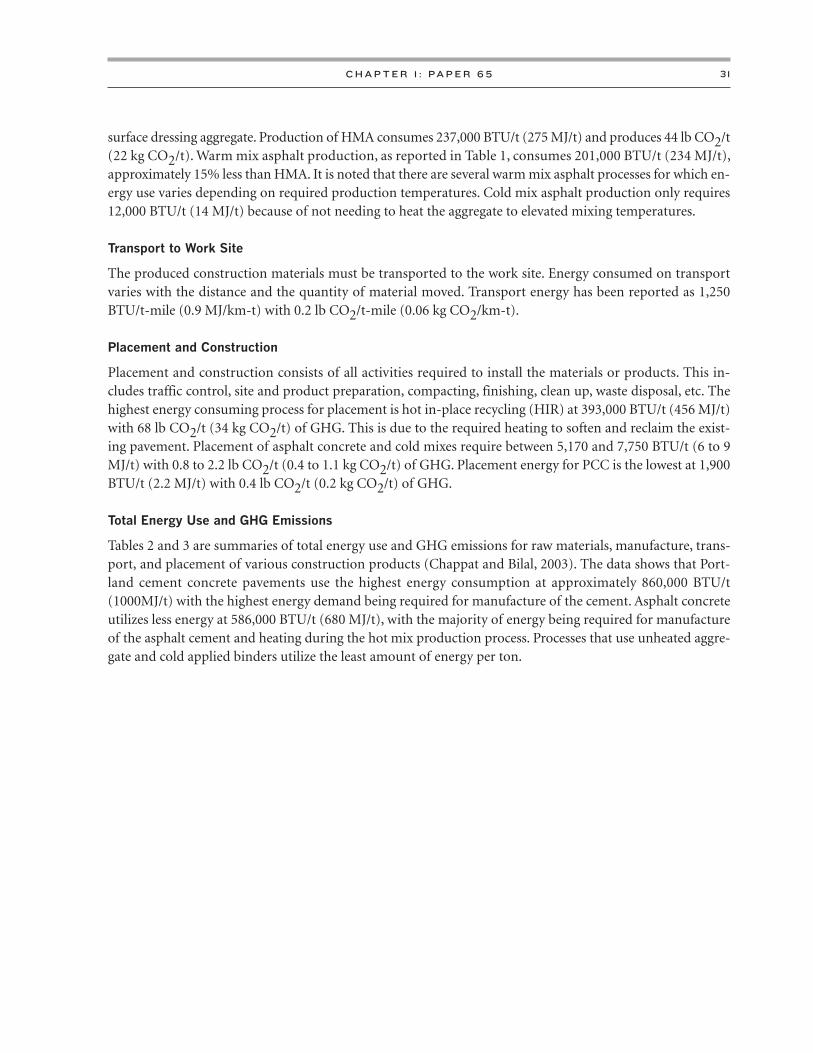
Tables 2 and 3 are summaries of total energy use and GHG emissions for raw materials, manufacture, trans-port, and placement of various construction products (Chappat and Bilal, 2003). The data shows that Port-land cement concrete pavements use the highest energy consumption at approximately 860,000 BTU/t(1000MJ/t) with the highest energy demand being required for manufacture of the cement. Asphalt concreteutilizes less energy at 586,000 BTU/t (680 MJ/t), with the majority of energy being required for manufactureof the asphalt cement and heating during the hot mix production process. Processes that use unheated aggre-gate and cold applied binders utilize the least amount of energy per ton.
31

Compendium of Papers from the First International Conference on Pavement Preservation32
Table 2. Total Energy Use for PavementConstruction Materials (Chappat and Bilal, 2003)
C H A P T E R 1 : PA P E R 6 5 33
Table 3. Total GHG Emissions for Pavement Construction Materials (Chappat and Bilal, 2003)

Compendium of Papers from the First International Conference on Pavement Preservation
E N E R G Y C O N S U M P T I O N A N D G H G E M I S S I O N S F O R C O N S T R U C T I O N ,
R E H A B I L I T A T I O N , A N D P R E S E R V A T I O N P R O C E S S E S
Different types of pavement construction, rehabilitation, and preservation operations consume differentamounts of energy. Energy use and GHG emissions per ton of product provide only a relative comparison ofproducts. The specific pavement structure or work type together with the actual quantities of materials mustbe evaluated to more accurately compare energy use and GHG emissions for construction, rehabilitation andpreservation. Dorchies (2008) performed several comparisons for different structured pavement sections, anddetermined that for different structures yielding the same structural performance, energy use and GHG emis-sions can vary as much as 80%.
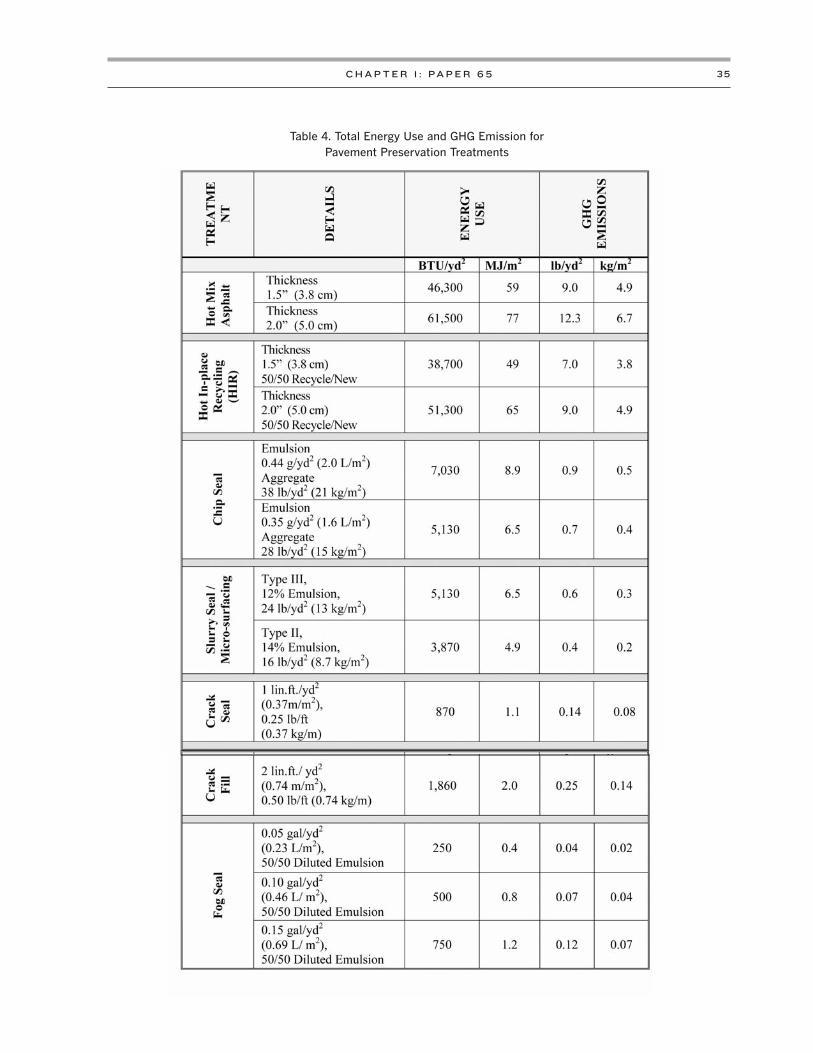
For some pavement preservation treatments, including thin HMA overlays and HIR, energy use and GHGemissions are available. There have been some specific comparisons performed for various types of chip sealsand for micro-surfacing. No references could be found for fog sealing and crack treatments. To provide uni-form comparisons, the information developed by Chappat and Bilal (2003), from Tables 1, 2, and 3 was usedto calculate energy use and GHG emissions for typical preservation treatments. Energy use and GHG emis-sions were calculated per unit area of the pavement surface, using typical quantities of raw materials for eachtreatment. Preservation treatments considered include the HMA overlay, HIR, chip seal, micro-surfacing/slurryseal, crack fill, crack seal and fog seal. For some treatments, several different application rates of the treatmentwere considered. Table 4 shows calculated energy use and GHG emissions for these pavement preservationtreatments. The analysis of energy use and GHG emissions considered the entire process for each treatmentincluding raw materials, transport, processing, mixing and installation as appropriate. Further details on en-ergy determinations are listed in the following discussions for each treatment type. For comparative purposes,Table 5 shows energy and GHG emissions for typical pavement construction and rehabilitation work types.
34
C H A P T E R 1 : PA P E R 6 5 35
Table 4. Total Energy Use and GHG Emission forPavement Preservation Treatments

Compendium of Papers from the First International Conference on Pavement Preservation
The following are descriptions and findings of the pavement preservation work analyzed:
Hot Mix Asphalt (HMA) Overlay
Thin HMA overlays, placed approximately 1.5 to 2.0 inches (3.8 to 5.0 cm) thick, are commonly used as apavement preservation treatment. GHG data are calculated based on using a 140 lb/ft3 (2240kg/m3) in-placedensity. Results are shown in Table 7 for both a 1.5 and 2.0 inch (3.8-5.0 cm) thickness. The 1.5 inch (3.8 cm)thickness uses 0.079 t/yd2 (86 kg/m2) and the 2.0 inch (5.0 cm) thickness uses 0.105 t/yd2 (114 kg/m2). Theanalysis used an energy use of 586,000 BTU/t (680 MJ/t) for the entire process.
Hot In-Place Recycling (HIR)
HIR consists of heating, removing and remixing of one inch of the existing pavement surface followed by in-stallation of a new one inch thick asphalt concrete overlay producing a two inch (5.0 cm) thick treatment.For comparison purposes a 1.5 inch (3.8 cm) total thickness is also shown. Energy use basis is 491,000 BTU/t(570 MJ/t). Data are calculated using a 140 lb/ft3 (2240 kg/m3) in-place density.
36
Table 5. Energy Use and GHG Emissions forAsphalt Concrete Pavement Construction and Rehabilitation
C H A P T E R 1 : PA P E R 6 5
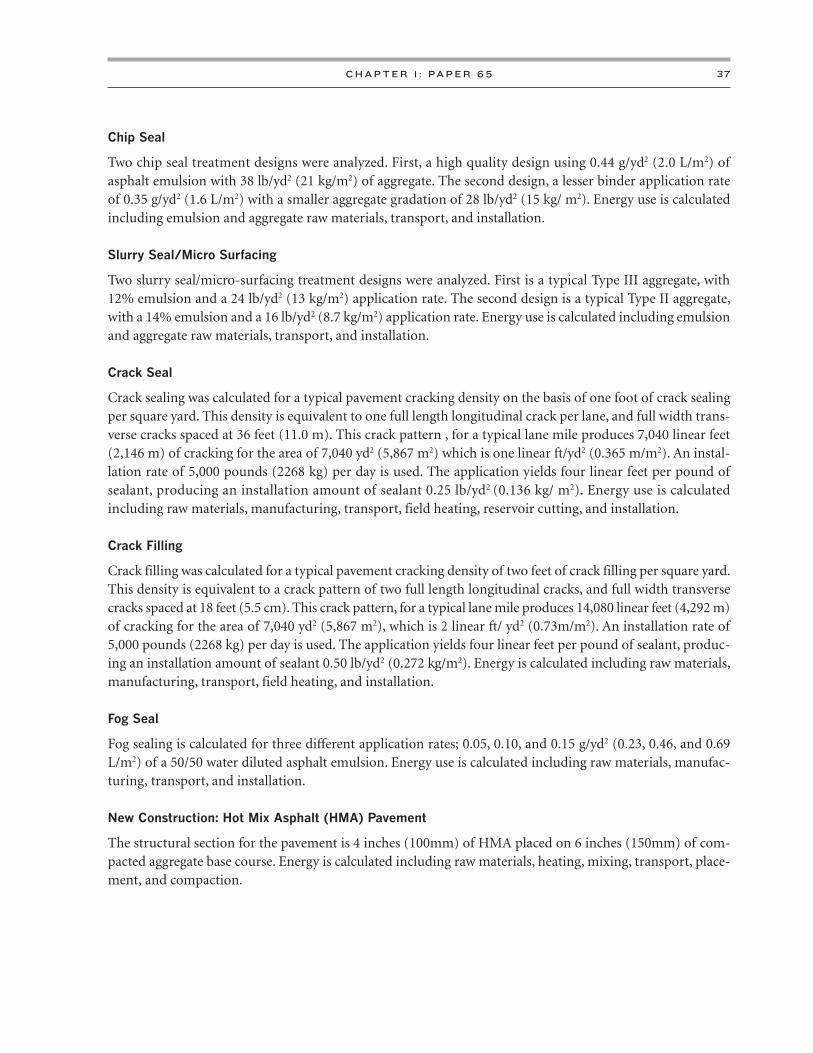
Chip Seal
Two chip seal treatment designs were analyzed. First, a high quality design using 0.44 g/yd2 (2.0 L/m2) ofasphalt emulsion with 38 lb/yd2 (21 kg/m2) of aggregate. The second design, a lesser binder application rateof 0.35 g/yd2 (1.6 L/m2) with a smaller aggregate gradation of 28 lb/yd2 (15 kg/ m2). Energy use is calculatedincluding emulsion and aggregate raw materials, transport, and installation.
Slurry Seal/Micro Surfacing
Two slurry seal/micro-surfacing treatment designs were analyzed. First is a typical Type III aggregate, with12% emulsion and a 24 lb/yd2 (13 kg/m2) application rate. The second design is a typical Type II aggregate,with a 14% emulsion and a 16 lb/yd2 (8.7 kg/m2) application rate. Energy use is calculated including emulsionand aggregate raw materials, transport, and installation.
Crack Seal
Crack sealing was calculated for a typical pavement cracking density on the basis of one foot of crack sealingper square yard. This density is equivalent to one full length longitudinal crack per lane, and full width trans-verse cracks spaced at 36 feet (11.0 m). This crack pattern , for a typical lane mile produces 7,040 linear feet(2,146 m) of cracking for the area of 7,040 yd2 (5,867 m2) which is one linear ft/yd2 (0.365 m/m2). An instal-lation rate of 5,000 pounds (2268 kg) per day is used. The application yields four linear feet per pound ofsealant, producing an installation amount of sealant 0.25 lb/yd2 (0.136 kg/ m2). Energy use is calculatedincluding raw materials, manufacturing, transport, field heating, reservoir cutting, and installation.
Crack Filling
Crack filling was calculated for a typical pavement cracking density of two feet of crack filling per square yard.This density is equivalent to a crack pattern of two full length longitudinal cracks, and full width transversecracks spaced at 18 feet (5.5 cm). This crack pattern, for a typical lane mile produces 14,080 linear feet (4,292 m)of cracking for the area of 7,040 yd2 (5,867 m2), which is 2 linear ft/ yd2 (0.73m/m2). An installation rate of5,000 pounds (2268 kg) per day is used. The application yields four linear feet per pound of sealant, produc-ing an installation amount of sealant 0.50 lb/yd2 (0.272 kg/m2). Energy is calculated including raw materials,manufacturing, transport, field heating, and installation.
Fog Seal
Fog sealing is calculated for three different application rates; 0.05, 0.10, and 0.15 g/yd2 (0.23, 0.46, and 0.69L/m2) of a 50/50 water diluted asphalt emulsion. Energy use is calculated including raw materials, manufac-turing, transport, and installation.
New Construction: Hot Mix Asphalt (HMA) Pavement
The structural section for the pavement is 4 inches (100mm) of HMA placed on 6 inches (150mm) of com-pacted aggregate base course. Energy is calculated including raw materials, heating, mixing, transport, place-ment, and compaction.
37
Compendium of Papers from the First International Conference on Pavement Preservation
Rehabilitation: Hot Mix Asphalt (HMA) Pavement
Both a 4 inch (100 mm) thick HMA overlay and a 3 inch (75 mm) thick overlay were investigated. Energy iscalculated including raw materials, heating, mixing, transport placement, and compaction.
Rehabilitation: Warm Mix Asphalt Pavement
Both a 4 inch (100mm) thick warm mix asphalt overlay and a 3 inch (75mm) thick overlay are examined.Energy is calculated including raw materials, heating, mixing, transport placement, and compaction.
A N N U A L I Z E D E N E R G Y U S E A N D G H G E M I S S I O N S F O R C O N S T R U C T I O N ,
R E H A B I L I T A T I O N A N D P R E S E R V A T I O N P R O C E S S E S
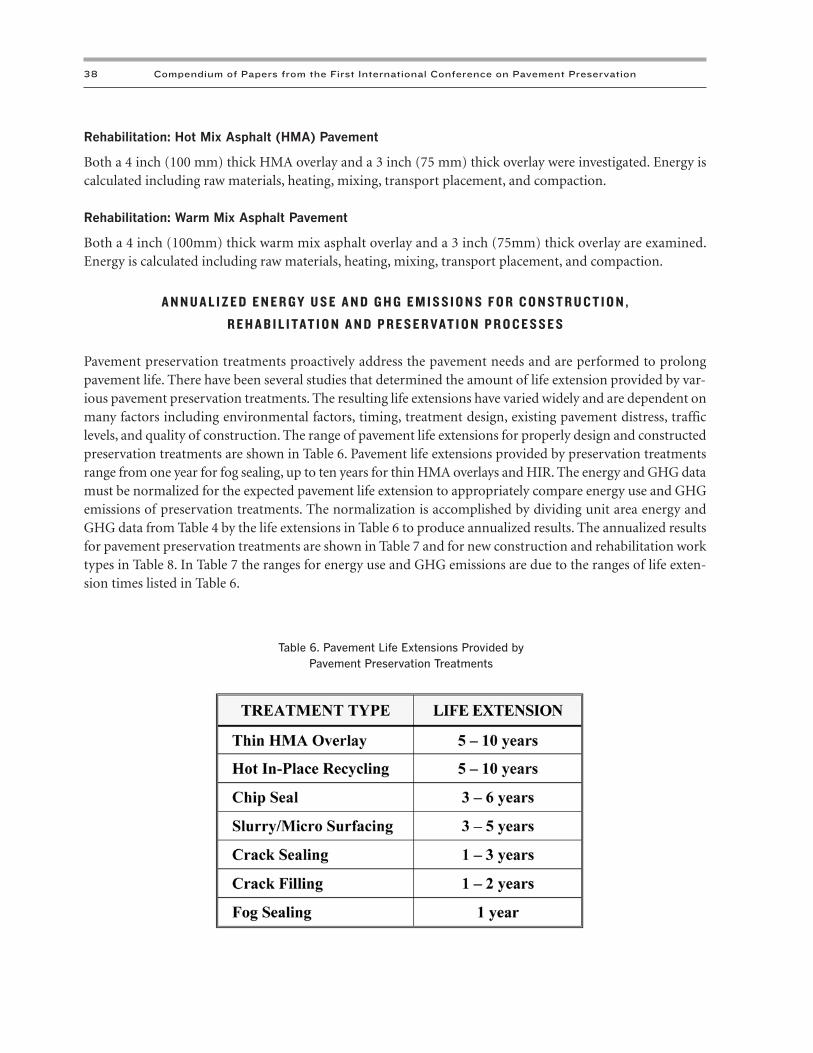
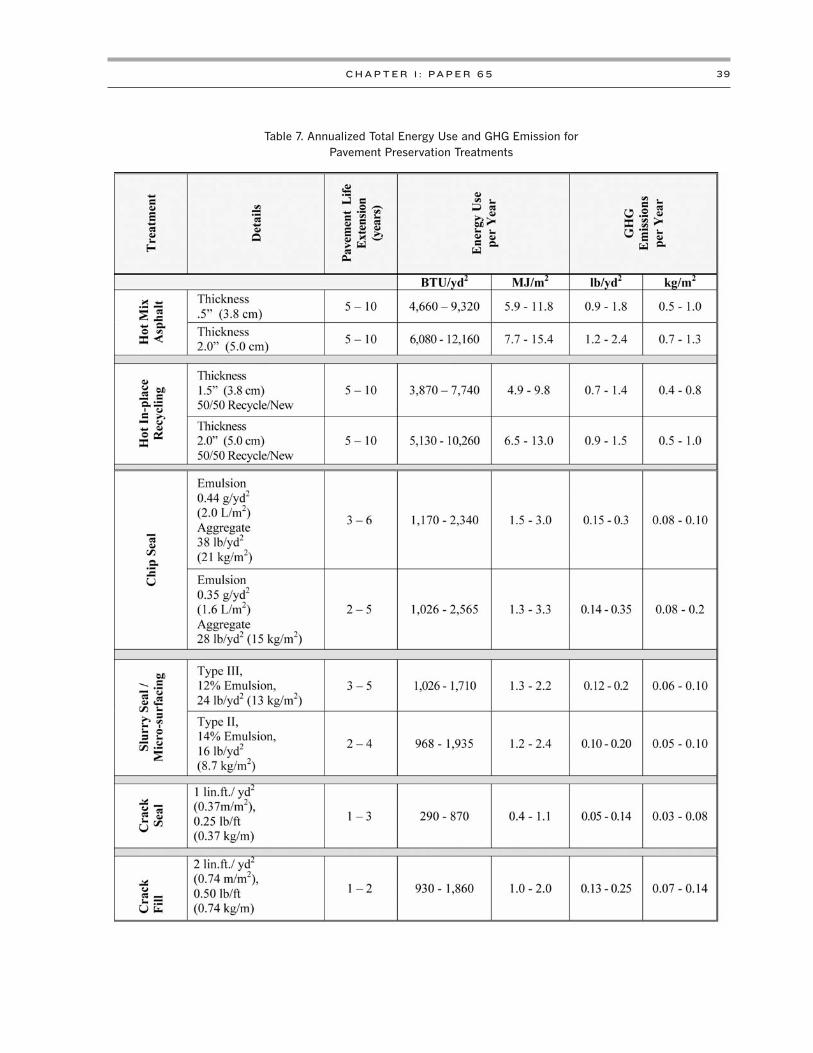
Pavement preservation treatments proactively address the pavement needs and are performed to prolongpavement life. There have been several studies that determined the amount of life extension provided by var-ious pavement preservation treatments. The resulting life extensions have varied widely and are dependent onmany factors including environmental factors, timing, treatment design, existing pavement distress, trafficlevels, and quality of construction. The range of pavement life extensions for properly design and constructedpreservation treatments are shown in Table 6. Pavement life extensions provided by preservation treatmentsrange from one year for fog sealing, up to ten years for thin HMA overlays and HIR. The energy and GHG datamust be normalized for the expected pavement life extension to appropriately compare energy use and GHGemissions of preservation treatments. The normalization is accomplished by dividing unit area energy andGHG data from Table 4 by the life extensions in Table 6 to produce annualized results. The annualized resultsfor pavement preservation treatments are shown in Table 7 and for new construction and rehabilitation worktypes in Table 8. In Table 7 the ranges for energy use and GHG emissions are due to the ranges of life exten-sion times listed in Table 6.
38
Table 6. Pavement Life Extensions Provided by Pavement Preservation Treatments
C H A P T E R 1 : PA P E R 6 5 39
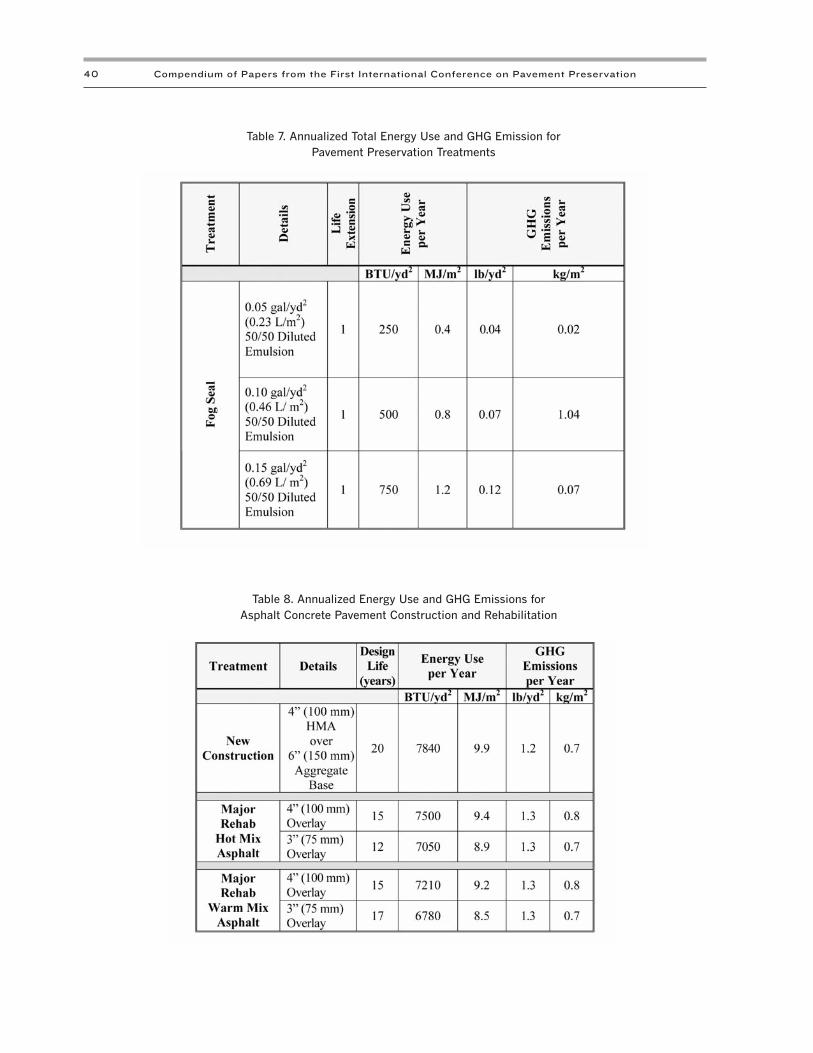
Table 7. Annualized Total Energy Use and GHG Emission for Pavement Preservation Treatments
Compendium of Papers from the First International Conference on Pavement Preservation40
Table 7. Annualized Total Energy Use and GHG Emission for Pavement Preservation Treatments
Table 8. Annualized Energy Use and GHG Emissions forAsphalt Concrete Pavement Construction and Rehabilitation

C H A P T E R 1 : PA P E R 6 5
The annualized energy and GHG data for pavement preservation treatments ranges from 250 BTU/yd2-yr (0.4MJ/m2-yr) for a 0.05 g/yd2 (0.23 l/m2) fog seal application upwards to 12,160 BUT/yd2-yr (15.4 MJ/m2-yr) for 2.0 inch (5.0 cm) of HMA overlay. Annualized results for the new construction and rehabilitation worktypes range from 6,780 to 7,840 BTU/yd2-yr (8.5-9.9 MJ/m2-yr). The results group into three categories. Thefirst category includes the thin HMA overlay, HIR, new construction, and rehabilitation, have the highestannualized results ranging from 3,870 to 12,160 BTU/yd2-yr (4.9-15.4 MJ/yd2-yr) energy and 0.9 to 2.4 lb/yd2-yr (0.4-1.3 kg/m2-yr) of GHG. The second category includes chip seal, micro-surface, and crack fill at 930 to2,565 BTU/yd2-yr (1.0-3.3 MJ/yd2-yr) energy and 0.13 to 0.35 lb/yd2-yr (0.07-0.20 kg/m2-yr) of GHG. Thethird and final category includes fog sealing and crack sealing with 250 to 870 BTU/yd2-yr (0.4-1.1 MJ/m2-yr)energy and 0.04 to 0.14 lb/yd2-yr (0.02-0.08 kg/m2-yr) of GHG.
The annualized energy and GHG emission results in Table 7 show that the different pavement preserva-tion treatments provide a year of life extension with differing energy requirements and GHG emissions. Eachtype of pavement treatment will not always be appropriate for all pavements, distresses, traffic, climate, desiredresults, etc.
C O N C L U S I O N S
Comparisons of energy use and GHG emissions for the construction, rehabilitation and preservation ofasphalt concrete pavements are calculated and compared. Results show that on an annualized basis, differentprocess types require differing amounts of energy per year of pavement life. New construction, major reha-bilitation, thin HMA overlay, and HIR have the highest energy use and range from 5,000 to 10,000 BTU/yd2-yr (6.3-12.6 MJ/m2-yr). Chip seals, slurry seals, micro-surfacing, and crack filling utilize lower amounts ofenergy per year of extended pavement life and range from 1,000 to 2,500 BTU/yd2-yr (1.3-3.3 MJ/m2-yr).Crack seals and fog seals use the least amount of energy per year of extended pavement life at less than 1,000BTU/yd2-yr (1.3MJ/m2-yr).
Energy use and GHG emissions for the different products depend primarily on the type and quantity ofmaterials placed per unit area. Products that use lower amounts of asphalt per unit area and products that donot require heating of aggregate use the least amounts of energy. Additionally, products having the lowestquantity of material applied to the pavement per unit area utilize less energy, simply because not as muchmaterial needs to be produced, processed, transported and installed. To minimize energy use and GHG emis-sions over the life of a pavement, all preservation treatments should be utilized as appropriate to the maximumextent possible for the existing pavement conditions.
41
Compendium of Papers from the First International Conference on Pavement Preservation
R E F E R E N C E S
Canadian Construction Association (2005). Road Rehabilitation Energy Reduction Guide for Canadian Road Builders. CCA- Ontario.2005. http://www.cca-acc.com/homepage_e.asp
Chappat, M. & Bilal, J. (2003). The Environmental Road of the Future: Life Cycle Analysis, Energy Consumption and GreenhouseGas Emissions. Colas Group. 2003.http://www.colas.co.uk/about-colas-detail.asp?pageId=14
Dorchies, P.T. (2008). The Environmental Road of the Future: Analysis of Energy Consumption and Greenhouse Gas Emissions. The2008 Annual Conference of the Transportation Association of Canada, Toronto, Ontario. 2008.
Greenroads (2009). Greenroads v0.95 Manual. University of Washington & CH2MHill. January 2009.http://www.greenroads.us/
Miller, T. & Bahia, H. (2009). Sustainable Asphalt Pavements Technologies, Knowledge Gaps and Opportunities. Modified AsphaltResearch Center, University of Wisconsin Madison. 2009.
Terrel, R.L. & Hicks, R.G. (2008). Viability of Hot In-Place Recycling as a Pavement Preservation Strategy. California Pavement Preser-vation Center, Chico, California, Report Number: CP2C-2008-106. 2008.
Uhlman, B. (2009). Principals of Eco-Efficiency Analysis in Construction Applications. ARRA-AEMA-ISSA Annual Meeting, PalmSprings, California. February 17-21, 2009.
US Green Building Council (2008). Leadership in Energy and Environmental Design (LEED). Green Building Rating System,Washington, D.C. 2008. http://www.usgbc.org/
Wall, C. (2004). Eco-Efficiency Analysis of Chip Seals, BASF Corporation Report. 2004.http://www.basf.com/group/corporate/en/
42