energy strategy implementation plan 2020 2025
TRANSCRIPT

Energy Strategy &
Implementation Plan
2020 – 2025 Adopted by Dubbo Regional Council 24 February 2020
2
Contents
1 INTRODUCTION ....................................................................................................................................... 5
2 BACKGROUND PAPER .............................................................................................................................. 6
2.1 THE IMPORTANCE OF ENERGY CONSERVATION AND RENEWABLE ENERGY – THE BASICS ............................................. 6 2.1.1 Understanding energy ...................................................................................................................... 6 2.1.2 The impact of energy consumption on costs..................................................................................... 6 2.1.3 The impact of fossil fuels on our environment .................................................................................. 6
2.2 WHAT IS CONSIDERED BEST PRACTICE IN ENERGY MANAGEMENT? ........................................................................ 7 2.3 INTERNATIONAL TO LOCAL RESPONSES TO ENERGY MANAGEMENT OR CONSERVATION .............................................. 8
2.3.1 Global context ................................................................................................................................... 8 2.3.2 National context ............................................................................................................................... 9 2.3.3 NSW State context .......................................................................................................................... 11 2.3.4 Regional trends ............................................................................................................................... 12 2.3.5 Examples of how other councils have implemented energy management..................................... 14 2.3.6 Dubbo region .................................................................................................................................. 17
2.4 COUNCIL’S RESPONSE SO FAR TO MANAGING ENERGY ...................................................................................... 19 2.4.1 Previous studies and plans .............................................................................................................. 19 2.4.2 Previous and current energy initiatives ........................................................................................... 20 2.4.3 Council’s energy use snapshot ........................................................................................................ 21 2.4.4 Council’s carbon emissions snapshot .............................................................................................. 25
2.5 WHAT’S HAPPENING IN THE FUTURE - TRENDS COUNCIL SHOULD KNOW ABOUT .................................................... 28 2.5.1 Electricity ........................................................................................................................................ 28 2.5.2 Natural gas ..................................................................................................................................... 28 2.5.3 Transport ........................................................................................................................................ 29
2.6 BEST PRACTICE ENERGY EFFICIENCY AND RENEWABLE ENERGY OPPORTUNITIES ...................................................... 32 2.6.1 Energy efficiency opportunities ....................................................................................................... 32 2.6.2 Renewable energy opportunities .................................................................................................... 33
2.7 POTENTIAL SCENARIOS FOR ELECTRICITY CONSUMPTION TO 2030 ...................................................................... 35 2.7.1 Scenario 1: no action ....................................................................................................................... 35 2.7.2 Scenario 2: medium actions ............................................................................................................ 36 2.7.3 Scenario 3: 100% renewable electricity .......................................................................................... 37
2.8 FEEDBACK RECEIVED AT ELT AND COUNCILLOR WORKSHOPS ............................................................................. 38 2.8.1 Agenda for the workshops .............................................................................................................. 38 2.8.2 ELT workshop - attendance ............................................................................................................. 38 2.8.3 ELT workshop - key findings ............................................................................................................ 39 2.8.4 Councillor workshop – attendance.................................................................................................. 39 2.8.5 Councillor workshop - key findings ................................................................................................. 39
3 THE STRATEGY ....................................................................................................................................... 41
3.1 STRATEGIC VISION / OBJECTIVE .................................................................................................................. 41 3.2 POLICY CONTEXT ...................................................................................................................................... 41 3.3 KEY STRATEGY AREAS ............................................................................................................................... 41
3.3.1 Strategy Area One – Energy Efficiency ............................................................................................ 42 3.3.2 Strategy Area Two – Renewable Energy ......................................................................................... 43 3.3.3 Strategy Area Three – Sustainable Transport ................................................................................. 45 3.3.4 Strategy Area Four – Supporting Energy Smart Communities ........................................................ 46
4 IMPLEMENTATION PLAN ....................................................................................................................... 47
4.1 IMPLEMENTATION PLAN ............................................................................................................................ 47
5 MONITORING, REPORTING AND REVIEW .............................................................................................. 59
3
Table of figures
Figure 1- Best practice in energy management ...................................................................................... 7
Figure 2: Key aspects of the Paris Climate Agreement ........................................................................... 8
Figure 3: Special IPCC Report on Global Warming of 1.5 °C (SR15) ........................................................ 9
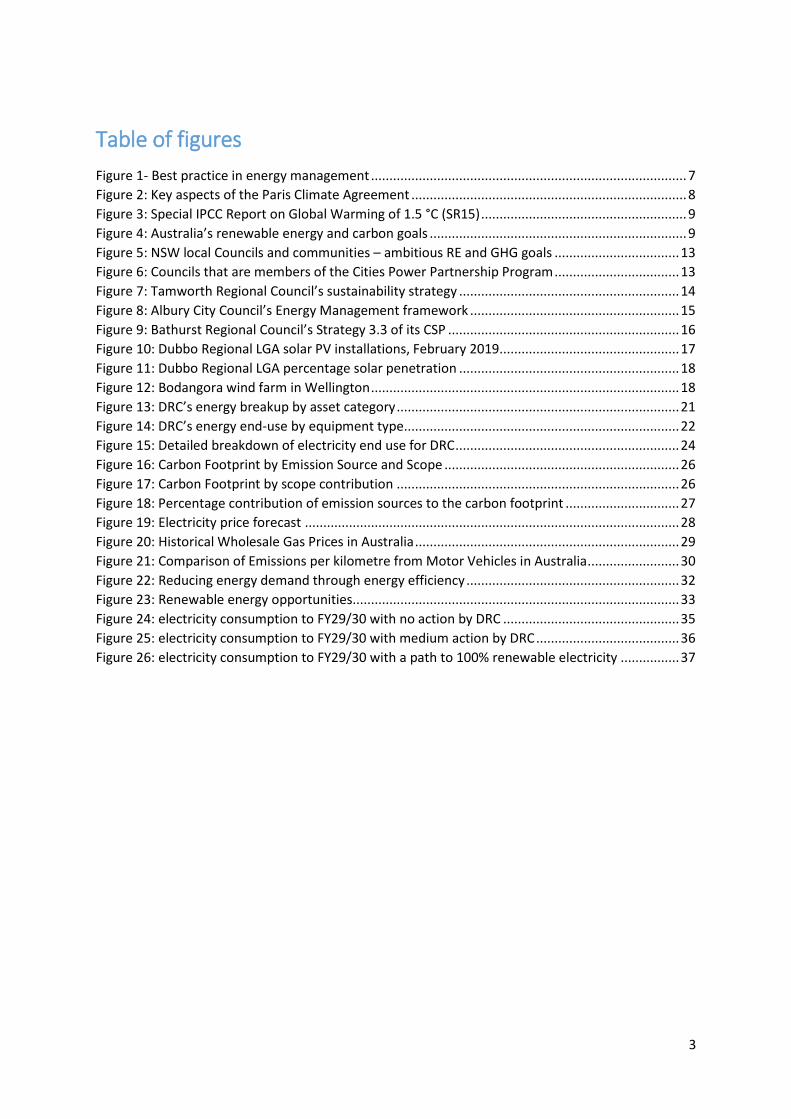
Figure 4: Australia’s renewable energy and carbon goals ...................................................................... 9
Figure 5: NSW local Councils and communities – ambitious RE and GHG goals .................................. 13
Figure 6: Councils that are members of the Cities Power Partnership Program .................................. 13
Figure 7: Tamworth Regional Council’s sustainability strategy ............................................................ 14
Figure 8: Albury City Council’s Energy Management framework ......................................................... 15
Figure 9: Bathurst Regional Council’s Strategy 3.3 of its CSP ............................................................... 16
Figure 10: Dubbo Regional LGA solar PV installations, February 2019................................................. 17
Figure 11: Dubbo Regional LGA percentage solar penetration ............................................................ 18
Figure 12: Bodangora wind farm in Wellington .................................................................................... 18
Figure 13: DRC’s energy breakup by asset category ............................................................................. 21
Figure 14: DRC’s energy end-use by equipment type ........................................................................... 22
Figure 15: Detailed breakdown of electricity end use for DRC ............................................................. 24
Figure 16: Carbon Footprint by Emission Source and Scope ................................................................ 26
Figure 17: Carbon Footprint by scope contribution ............................................................................. 26
Figure 18: Percentage contribution of emission sources to the carbon footprint ............................... 27
Figure 19: Electricity price forecast ...................................................................................................... 28
Figure 20: Historical Wholesale Gas Prices in Australia ........................................................................ 29
Figure 21: Comparison of Emissions per kilometre from Motor Vehicles in Australia ......................... 30
Figure 22: Reducing energy demand through energy efficiency .......................................................... 32
Figure 23: Renewable energy opportunities......................................................................................... 33
Figure 24: electricity consumption to FY29/30 with no action by DRC ................................................ 35
Figure 25: electricity consumption to FY29/30 with medium action by DRC ....................................... 36
Figure 26: electricity consumption to FY29/30 with a path to 100% renewable electricity ................ 37

4
Acronyms
Acronyms AEMO Australian Energy Market Operator APVI Australian Photovoltaic Institute BEEC Building Energy Efficiency Certificate BMS Building Management Systems CBD Commercial Building Disclosure CCF Climate Change Fund CO2 Carbon dioxide COAG Council of Australian Governments CPP Cities Power Partnerships DRC Dubbo Regional Council E3 Equipment Energy Efficiency ERF Emissions Reduction Fund EUA Environmental Upgrade Agreements EV Electric Vehicle GHG Green House Gas GWh Gigawatt hour HVAC Heating, ventilation and air conditioning ICE Internal Combustion Engines kWh Kilowatt hour LED Light emitting diode LGA Local Government Area LNG Liquified Natural Gas NABERS National Australian Built Environment Rating System NEG National Energy Guarantee NRMA National Roads and Motorists’ Association OEH Office Environment and Heritage PPA Power Purchase Agreement PV Photo Voltaic RET Renewable Energy Target SDGs Sustainable Development Goals SSROC Southern Sydney Regional Organisation of Councils TLA Tenancy Lighting Assessment WWTP Waste Water Treatment Plant

5
1 Introduction
The Dubbo Regional Council Energy Strategy and Implementation Plan is designed to support and guide Council in reducing energy consumption, increasing energy efficiency, increasing the use and adoption of renewable energy resources and sustainable transport while taking into account the needs and desires of a growing community. The Strategy and Implementation Plan also seeks to support the local community in becoming energy smart. Council’s requirements for the development of an Energy Strategy and Implementation Plan has arisen from the 2040 Community Strategic Plan (CSP) which states under Strategy 2.1.3.3 that an energy strategy is to be prepared for Council facilities and buildings by the Division of Planning and Environment. Additional CSP strategies supporting the development of the Strategy and Implementation Plan include: 2.1 Opportunities for use of renewable energy are increased and 5.9 Environmental sustainability is a priority. The Energy Strategy and Implementation Plan has been developed in four parts as outlined
below:
Part 1: Background Paper (Chapter 2)
This section provides the overall context for the Energy Strategy and Implementation Plan
and has been developed on behalf of Council by 100% Renewables, an expert energy
consultant engaged under the NSW Office of Environment & Heritage’s (OEH) Sustainability
Advantage Program.
Part 2: Strategy (Chapter 3)
This section builds upon information provided in Part 1 and outlines Council’s strategic
vision, strategies and outcomes for energy management within Council controlled facilities
and activities. It also seeks to outline ways in which Council will seek to support the local
community in becoming energy smart.
Part 3: Implementation Plan (Chapter 4)
This section contains specific actions to be undertaken by Dubbo Regional Council to ensure
the strategic outcomes in the Energy Strategy are addressed.
Part 4: Monitoring, Reporting and Review (Chapter 5)
This section contains specific information on how the Energy Strategy and Implementation
Plan will be monitored, reported and reviewed.

6
2 Background Paper
2.1 The importance of energy conservation and renewable energy – the basics
2.1.1 Understanding energy
Energy is a vital input into running an organisation. Examples of energy are electricity and natural
gas (stationary energy), or transport fuels like petrol, diesel, or LPG (transport energy). Energy can
come from renewable, or non-renewable sources.
2.1.1.1 Fossil-fuel based/non-renewable energy Currently, most of our energy consumption worldwide is supplied by fossil fuel energy sources,
primarily oil, gas, and coal. Once fossil fuels are consumed, they cannot be replenished.
2.1.1.2 Renewable energy Renewable energy is obtained from natural resources that can be continually replenished. The main
sources of renewable energy are the sun, wind, water, geothermal (the earth’s internal heat), and
biomass (organic matter).
2.1.2 The impact of energy consumption on costs
Energy inputs are expensive, and organisations see this reflected on their electricity, gas and
transport fuel bills. The higher the price an organisation pays for energy, the greater the value of
being more energy efficient and switching to renewables.
Energy efficiency means to either perform the same activity with less energy input or accomplish
more activity with the same amount of energy input. Either way, an organisation can achieve more
with each unit of energy consumed. Examples of energy efficiency are lighting upgrades, or eco-
driving.
Onsite renewable energy installations also have a large potential to reduce costs, but not every site
will have ideal conditions for the rollout of solar PV or other onsite renewables.
2.1.3 The impact of fossil fuels on our environment
Burning fossil fuels releases the carbon that has been locked away in the Earth’s crust for millions of
years into the atmosphere, where it traps the sun’s heat and contributes to climate change. Weather
extremes already affect millions of people.
Climate change puts food, water, and agricultural supply chains at risk, is responsible for the mass
extinction of many species, and causes many diseases to spread. It raises sea levels, potentially
displacing millions of people. It increases the occurrence of heat waves, droughts, and changes in
rainfall patterns. And with more and more fossil fuels being burnt, the threats to agriculture,
vulnerable countries, and our entire society will get even worse.
According to the World Economic Forum’s Global Risk Report 2019, extreme weather events, failure
of climate change risk and mitigation, natural disasters, water crises, biodiversity loss and ecosystem
collapse, and man-made environmental disasters like oil spills rank amongst the top worldwide risks.

7
2.2 What is considered best practice in energy management?
Council should look to reduce its energy and carbon footprint wherever feasible and cost-effective,
so that the amount of energy that has to be sourced from renewables is reduced, with associated
cost reductions. Following energy efficiency, the focus should be on the implementation of on-site
renewables (including future opportunities that involve battery energy storage).
Offsite renewable energy generation, whether sourced from a Council-owned solar farm or via
Council’s energy sourcing strategy, are the third step in best-practice energy management. Step 3 in
best-practice energy management will allow organisations to achieve ambitious targets.
The diagram below illustrates the staged approach Council can undertake.
FIGURE 1- BEST PRACTICE IN ENERGY MANAGEMENT

8
2.3 International to local responses to energy management or conservation
2.3.1 Global context
To address climate change, signatory countries adopted the Paris Agreement at the COP21 in Paris
on 12 December 2015. The Agreement entered into force less than a year later. In the agreement,
signatory countries agreed to work to limit global temperature rise to well below 2°C, and given the
grave risks, to strive for 1.5°C1.
FIGURE 2: KEY ASPECTS OF THE PARIS CLIMATE AGREEMENT2
In October 2018, governments approved the wording of a special report on limiting global warming
to 1.5°C. The report indicates that achieving this would require rapid, far-reaching and
unprecedented changes in all aspects of society. With clear benefits to people and natural
ecosystems, limiting global warming to 1.5°C compared to 2°C could go hand in hand with ensuring a
more sustainable and equitable society3.
1 Sourced from https://www.un.org/sustainabledevelopment/climatechange/ 2 Sourced from https://www.connect4climate.org/infographics/paris-agreement-turning-point-climate-solution 3 Sourced from https://www.ipcc.ch/news_and_events/pr_181008_P48_spm.shtml
9
FIGURE 3: SPECIAL IPCC REPORT ON GLOBAL WARMING OF 1.5 °C (SR15)
2.3.2 National context
At a national level, Australia’s response to the Paris Agreement has been to set a goal for GHG
emissions of 5% below 2000 levels by 2020 and GHG emissions that are 26% to 28% below 2005
levels by 2030. A major policy that currently underpins this is the Renewable Energy Target (RET)4.
This commits Australia to source 20% of its electricity (33,000 GWh p.a., estimated to equate to a
real 23% of electricity) from eligible renewable energy sources by 2020. The scheme runs to 2030.
These two key targets are illustrated below.
FIGURE 4: AUSTRALIA’S RENEWABLE ENERGY AND CARBON GOALS
An added scheme underpinning Australia’s national targets is the Emissions Reduction Fund (ERF)5.
This fund provides incentives to businesses, farmers, landfill operators, landholders and others to
reduce GHG emissions. Projects are funded on an auction basis with proponents bidding for the
lowest cost (incentives) required to abate GHG emissions. To date, six auctions have been held with
the most recent being in December 2017.
4 http://www.cleanenergyregulator.gov.au/RET 5 http://www.cleanenergyregulator.gov.au/ERF

10
A proposed new policy initiative, the National Energy Guarantee (NEG)6 was developed during 2017
and 2018, aimed at ensuring reliability of supply at affordable costs to consumers while providing a
pathway for emissions reduction to meet Australia’s electricity sector targets. Following recent
political uncertainty, this policy has been discontinued, and there are currently no significant
announced measures beyond the RET and the ERF.
2.3.2.1 Energy management As well as the RET the Commonwealth works to improve energy efficiency in collaboration with the
States and Territories via the Council of Australian Governments (COAG)7. Major initiatives that are
led by the Commonwealth and which can have impacts on energy use by DRC include:
The Equipment Energy Efficiency (E3)8 program, through which Australian jurisdictions (and
New Zealand) collaborate to deliver nationally consistent mandated energy efficiency
standards and energy labelling for equipment and appliances. Procurement policies and
practices that routinely ensure that high star-rated appliances (motors, air conditioning units,
kitchen appliances) are selected when replacing or buying new equipment will help Council’s
energy footprint decline over time.
Periodic review and update of the National Construction Code9 as it relates to efficiency
(Section J). This section is currently undergoing a review, with proposed changes likely to come
into effect in mid-2019. Both residential and commercial building changes will be targeted.
The commercial building changes are aiming to target savings in buildings of 23-53%. Among
other measures, the changes will target improvement of on-site renewable energy such as
solar PV10. Any building upgrades or new facilities may need to comply with these
requirements after mid-2019.
Support for voluntary / market-based schemes such as Green Star and NABERS, and the
implementation of the mandatory Commercial Building Disclosure11 (CBD) program. The CBD
Program is a regulatory program that requires energy efficiency information to be provided in
most cases when commercial office space of 1000 square metres or more is offered for sale
or lease. The CBD Program requires most sellers and lessors of office space of 1,000 square
metres or more to have an up-to-date Building Energy Efficiency Certificate (BEEC), which
includes a NABERS certificate and a CBD Tenancy Lighting Assessment (TLA) for the area of the
building that is being sold, leased or subleased12.
At a national level, the Commonwealth is also a periodic provider of programs, funds and incentives
aimed at helping governments, homes and businesses become more energy efficient.
6 http://coagenergycouncil.gov.au/sites/prod.energycouncil/files/publications/documents/Final%20Detailed%20Design%20-%20National%20Energy%20Guarantee.pdf 7 https://www.coag.gov.au/ 8 http://www.energyrating.gov.au/about 9 https://www.planning.nsw.gov.au/Policy-and-Legislation/Buildings/National-Construction-Code 10 http://www.abcb.gov.au/Connect/Articles/2017/03/09/Section-J-Overhaul-big-changes-are-coming-your-way 11 http://cbd.gov.au/ 12 http://cbd.gov.au/get-and-use-a-rating/what-is-a-beec

11
2.3.3 NSW State context
The NSW Climate Change Policy Framework13 outlines the State’s target of reaching net-zero
emissions by 2050. This is an aspirational objective and helps to set expectations about future GHG
emissions pathways to help others to plan and act. The current policy framework will be reviewed in
2020.
Through the Government’s Climate Change Fund (CCF) 2018-2022 Strategic Plan, a number of
initiatives will be progressed in the next four year period with a total funding allocation of $170
million. Implementation of programs is being led by the Division of Energy, Water and Portfolio
Strategy (DEWPS) within the Department of Planning and Environment. The five major initiatives to
be developed include:
1. supporting regional community energy projects and community energy hubs to give
communities more control, avoid costly infrastructure upgrades and reduce rural energy
costs.
2. supporting feasibility studies and commercialisation of emerging energy projects including
pumped hydro generation and utility scale batteries, with potential co-funding from the
Australian Renewable Energy Agency14, to bring forward private sector investment to support
the next generation of energy and storage projects in NSW.
3. providing small incentives to coordinate assets such as home and electric vehicle storage to
beat energy peaks and provide household demand response to the grid, as highlighted by
Australian Energy Market Operator (AEMO)15 and the NSW Energy Security Taskforce as a key
priority for system security.
4. supporting energy storage in state-owned sites, such as schools, to lower peak demand and
potentially attract investment in local manufacturing.
5. increasing the energy savings for eligible recipients of the Low-Income Household Rebate16 by
allowing them to opt out of the rebate and install a solar system on their roof, adding solar
capacity to the grid and more than doubling the energy savings for the households involved.
The NSW Renewable Energy Action Plan17 has helped to drive the growth of renewables in the State
through its three key goals:
Goal 1 – Attract renewable energy investment
Goal 2 – Build community support, including the establishment of the Renewable Energy
Advocate
Goal 3 – Attract and grow renewable energy expertise
2.3.3.1 Energy management The NSW Government runs a number of initiatives aimed at promoting and increasing the uptake of
energy efficiency and sustainable practices. Many of these initiatives are led by the NSW
Department of Planning and Environment, and by the Office of Environment and Heritage within this
Department. Initiatives that help local governments include:
13 http://www.environment.nsw.gov.au/topics/climate-change/policy-framework 14 https://arena.gov.au/ 15 http://www.aemo.com.au/ 16 https://www.service.nsw.gov.au/transaction/apply-low-income-household-rebate-retail-customers 17 https://energy.nsw.gov.au/renewables/renewable-energyoffers/renewable-energy-action-plan

12
Sustainability Advantage program, which helps local governments commit to, plan,
implement and be recognised for sustainability practices in their operations and supply
chains (DRC is a member of this program)
Energy Savings Scheme, providing information and resources that help organisations get
access to financial incentives by implementing verifiable energy savings initiatives, such
as building retrofits, plant upgrades and lighting upgrades to LED
In 2018 the government completed a panel of renewable energy Power Purchase
Agreement (PPA) providers, which local governments can access to implement onsite
solar PV solutions. The advantage of an onsite PPA is that the solar PV can be installed and
deliver cost savings from renewables at no upfront cost. However, paying for a solar PV
system utilising private capital will result in greater cost savings. This initiative is useful
where access to capital is not available or is limited
Community renewable energy guides and resources e.g. http://c4ce.net.au/
A wide range of tools, guides, case studies, training courses and other materials is
available to businesses through OEH, covering a wide range of sectors, technology types
and energy forms
Environmental Upgrade Agreements (EUA), which can help organisations and
participating Councils overcome some traditional barriers to implementing and
benefitting from environmental upgrades
Clean Energy for Business case studies, developed as a result of the 2017 program,
assisting businesses and local governments plan for a net-zero/100% renewable energy
future.
2.3.4 Regional trends
Regional NSW provides national leadership on renewables through local action. Notable examples
include:
Narrabri LGA has a solar PV penetration rate of 41.8% of dwellings (the NSW average is 21%)
Lismore City Council has a goal to self-generate 100% of its electricity needs from renewables
by 2023, and a plan to achieve this was adopted by Council in 2014.
Coffs Harbour City Council has a goal to source 100% of electricity from renewables by 2030,
with interim targets for 2020 and 2025, and a 50% GHG emissions reduction target by 2025.
The Renewable Energy and Emissions Reduction Plan was adopted by Council in 2015.
Byron Shire is aiming to reach a “net zero emissions” target, and Byron Bay Council is a
signatory to the Global Compact of Mayors.
Uralla is aiming to be a zero net energy town (ZNET), through the use of energy efficiency,
renewables and storage. A 7-10 year timeframe was anticipated for the ZNET target to be
achieved when the project was announced in 2014.
Tweed Shire Council has set a goal to meet 50% renewables for its operations by 2025 and
recently committed to more than 1,300 kWp of solar installations through 2019
Tyalgum is aiming to be a 100% renewable energy town and to potentially be ‘off-grid’
The City of Broken Hill has a commitment to achieve 100% renewable status by 2030.
These and other commitments are illustrated below, clearly highlighting the leadership position
occupied by local governments in NSW.

13
FIGURE 5: NSW LOCAL COUNCILS AND COMMUNITIES – AMBITIOUS RE AND GHG GOALS
Many local governments have also signed up to the Cities Power Partnership program (CPP) run by
the Climate Council. CPP is Australia’s largest local government climate network, made up over 100
councils from across the country. Local councils who join the partnership make five action pledges in
either renewable energy, efficiency, transport or working in partnership to tackle climate change.
FIGURE 6: COUNCILS THAT ARE MEMBERS OF THE CITIES POWER PARTNERSHIP PROGRAM
14
Example member councils are Parkes, Orange, Bathurst, Wagga Wagga, Muswellbrook, Upper
Hunter Shire and Broken Hill.
2.3.5 Examples of how other councils have implemented energy management
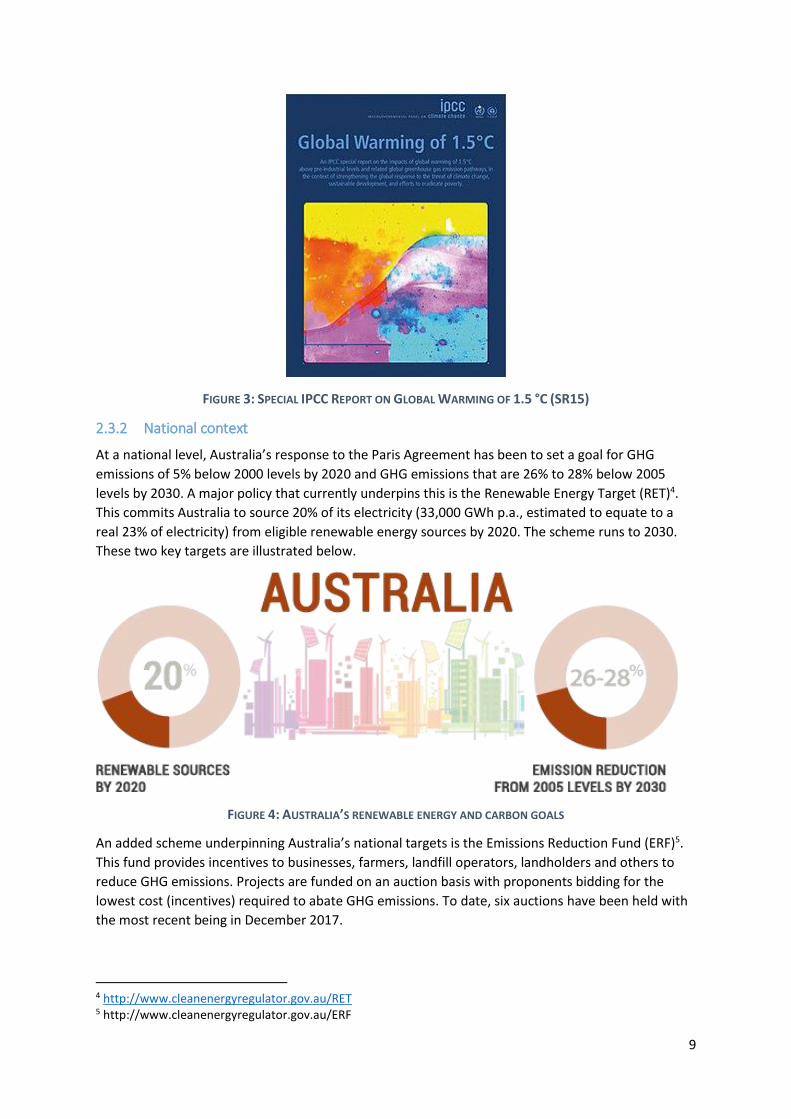
2.3.5.1 Tamworth Regional Council The council sets its energy direction within its Sustainability Strategy 2017 – 202118. The Strategy
identifies seven focus areas for energy management within Council and measures success through
the number of energy efficiency and renewable energy projects implemented, the operation of an
energy management system, and the engagement of the community in energy.
The council also refers to UN Sustainable Development Goal 7 Affordable and Clean Energy in setting
its aspirational target, as can be seen in Figure 7. They also set a direction for carbon emissions
within the strategy which includes the additional UN SD Goal of 11 Sustainable Cities and
Communities.
Dubbo Regional Council also refers to the UN Sustainable Development Goals (SDGs) within its
Community Strategic Plan and may choose to consider the inclusion of the SDGs in their
energy/carbon strategy.
FIGURE 7: TAMWORTH REGIONAL COUNCIL’S SUSTAINABILITY STRATEGY
2.3.5.2 Albury City Council Albury City Council has an Energy management framework19 including three pillars - energy
performance monitoring, energy savings measures and detailed energy assessment. Their Energy
Savings Action Plan sets out the measures council is taking to implement the framework.
The council reviews and updates the four-year plan each year, based on the results of ongoing
energy assessments and audits. Council’s Community Strategic Plan Albury 2030 provides a number
18http://www.tamworth.nsw.gov.au/Environment/Environment--Sustainability-and-Climate-Change/Sustainability-Strategy 19 https://www.alburycity.nsw.gov.au/environment-and-waste/sustainability/energy-management

15
of outcomes relating to sustainability and energy which commits the council to develop the energy
savings action plan20 (ESAP) and a carbon management strategy21 (see page 1 of ESAP).
The ESAP is ‘savings’-focused as opposed to carbon emissions-focused with a number of economic
assessments being completed to inform the plan including a review of tariffs, available solar
technology, energy audits, and others.
The council has joined the Cities Power Partnership program.
FIGURE 8: ALBURY CITY COUNCIL’S ENERGY MANAGEMENT FRAMEWORK
2.3.5.3 Bathurst Regional Council In 2012, Bathurst Regional Council developed a Distributed Energy Plan22 which looked at how the
council could reduce energy consumption and save money at the main energy consuming facilities.
Council has been working on implementing suggested actions from this Plan and has installed a 100
kW system in 2016 to provide around 5% of the energy required to run the council’s Waste Water
Treatment Plant (WWTP).
20 https://www.alburycity.nsw.gov.au/environment-and-waste/sustainability/energy-management 21 https://www.alburycity.nsw.gov.au/environment-and-waste/sustainability/climate-resilience-and-adaptation/making-albury-resilient-to-climate-change 22 https://www.bathurst.nsw.gov.au/environment/energy-sustainability/solar-power-on-council-buildings.html

16
This will reduce the council's annual emissions by around 140 tonnes of GHG emissions. The Bathurst
2040 CSP outlines in Strategy 3.3 that the council will seek to minimise the city’s environmental
footprint, live more sustainably and use resources more wisely.
There doesn’t seem to be an updated energy plan, but the council has joined the Cities Power
Partnership Agreement which is assisting councils to achieve this goal. Strategy 3.5 Increase
resilience to natural hazards and climate change lists that a Climate Change and Adaptation Plan will
be developed by the Council. The council has also joined the Cities Power Partnership program.
FIGURE 9: BATHURST REGIONAL COUNCIL’S STRATEGY 3.3 OF ITS CSP
2.3.5.4 Orange City Council Orange City Council has a Community Strategic Plan 2018-28 with strategic objectives similar to that
of Dubbo Regional Council including 7.2. Ensure best practice use of renewable energy options for
Council and community projects and 8.2. Develop and promote initiatives to reduce water, energy
and waste in consultation with the community.
In 2012, the council developed a distributed energy plan. The council currently has no specific
energy strategy but has a focus on completing energy audits and installing solar PV systems on the
council’s assets. The council has also joined the Cities Power Partnership to help investigate
opportunities within its Delivery Plan.
17
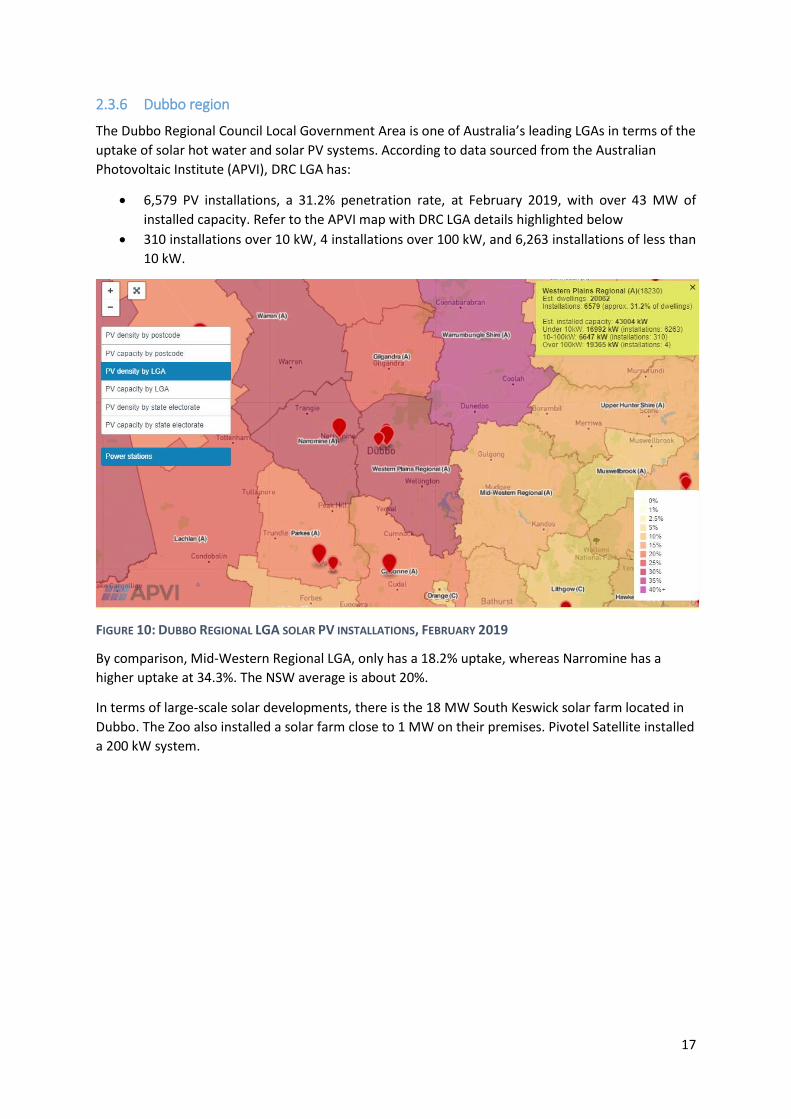
2.3.6 Dubbo region
The Dubbo Regional Council Local Government Area is one of Australia’s leading LGAs in terms of the
uptake of solar hot water and solar PV systems. According to data sourced from the Australian
Photovoltaic Institute (APVI), DRC LGA has:
6,579 PV installations, a 31.2% penetration rate, at February 2019, with over 43 MW of
installed capacity. Refer to the APVI map with DRC LGA details highlighted below
310 installations over 10 kW, 4 installations over 100 kW, and 6,263 installations of less than
10 kW.
FIGURE 10: DUBBO REGIONAL LGA SOLAR PV INSTALLATIONS, FEBRUARY 2019
By comparison, Mid-Western Regional LGA, only has a 18.2% uptake, whereas Narromine has a
higher uptake at 34.3%. The NSW average is about 20%.
In terms of large-scale solar developments, there is the 18 MW South Keswick solar farm located in
Dubbo. The Zoo also installed a solar farm close to 1 MW on their premises. Pivotel Satellite installed
a 200 kW system.

18
FIGURE 11: DUBBO REGIONAL LGA PERCENTAGE SOLAR PENETRATION
In addition to the high solar uptake, there is also the 113.2 MW Bodangora wind farm owned by
Infigen in Wellington. Infigen has committed to contributing $50,000 to the Bodangora Community
Foundation each year for the first 25 years of the operation of the wind farm.
FIGURE 12: BODANGORA WIND FARM IN WELLINGTON
19
2.4 Council’s response so far to managing energy
2.4.1 Previous studies and plans
There are a number of previous studies and plans that have been developed for DRC.
2.4.1.1 2014 Energy Strategy and Implementation Plan for Dubbo City Council The Strategy and Plan identified a Strategic Vision and three key strategic areas of energy
management for Council controlled facilities and activities. The three areas included energy
efficiency, renewable energy, and transport.
The Strategic Vision stated that “Dubbo City Council is a leader in regional New South Wales in the
reduction of energy consumption, increased energy efficiency and the continued adaptation to and
use of renewable energy”. The Strategy and Implementation Plan drew from the opportunities and
recommendations of the 2012 Distributed Energy Plan as well as objectives from the 2010 Energy
Strategy and Dubbo ALIVE 2009-2013. The strategy also supported Council in meeting its obligations
identified in Dubbo 2036 and Dubbo ALIVE.
2.4.1.2 2012 Distributed Energy Plan for Dubbo City Council This plan was developed by Arup Pty Ltd as part of a joint Bathurst Orange Dubbo Alliance grant
project. It was designed to deliver significant financial and environmental benefits through the
reduction of energy usage and substitution of coal-fired electricity with lower carbon and potentially
locally-generated alternatives.
It was designed to provide Council’s leadership with an Energy Strategy for the next ten years. The
Plan identified ten facilities operated by Dubbo City Council in which distributed energy generation,
and energy-efficiency options were applicable. The facilities included Apex Oval, Dubbo Aquatic and
Leisure Centre, Civic Administration Building, Works Depot, Dubbo Regional Airport, Dubbo City
Holiday Park, Macquarie Regional Library, Showground, Dubbo Regional Theatre and Convention
Centre and Western Plains Cultural Centre.
2.4.1.3 2012 Distributed Energy Plan for Central NSW Councils This plan was developed by Arup Pty Ltd as part of a joint Bathurst Orange Dubbo Alliance grant
project. It was designed to identify potential opportunities requiring regional collaboration. Potential
opportunities identified included the establishment of a single centralised plant processing waste
from throughout the region to energy; bulk purchasing and procurement of common technology
recommendations such as solar PV and lighting; a regional design panel of experts to assist in
reviewing facility upgrades or new building design; and creating a role to coordinate investigation
into street lighting upgrades. Since 2012 the Central NSW Joint Organisation (previously CENTROC)
has proceeded with a number of these recommendations on behalf of its member councils, including
the expert panel and street lighting investigations. Unfortunately Dubbo Regional Council, despite
being a partner in the initial grant project, has not been included in these projects post 2012 as it is
not a member council.
2.4.1.4 Dubbo ALIVE 2009-2013 Dubbo ALIVE identified two key Energy Strategy targets. The first target was to ensure that a
minimum of 2% of Council’s electricity consumption comes from renewable sources of energy by
2013; the other was that Council reduced energy consumption by 5% on 2004/2005 baseline levels.
20
Council’s energy consumption initially trended downwards from the 2004/2005 baseline towards the
2012/2013 target, but a number of issues including seasonal variation and growth in different areas
resulted in an overall increase in energy consumption.
2.4.2 Previous and current energy initiatives
2.4.2.1 Energy efficiency initiatives DRC has implemented a number of initiatives to reduce energy demand and cost, primarily focused
on energy efficiency as part of normal business operations.
In particular Council's Energy Fund, established in 2014, has assisted facility managers to implement
energy efficiency measures, save money and reduce Council’s carbon footprint. Since 2014 $100,000
has been allocated to the Fund and the eight projects implemented, mostly lighting upgrades, are
estimated to be saving Council at least $50,000 per year in electricity and maintenance costs.
Implemented projects include:
LED lighting upgrade at Dubbo Showground Expo Pavilion (2017/18)
LED lighting upgrade at Old Dubbo Gaol (2017/18)
LED lighting upgrade at Dubbo Regional Livestock Markets - saleyards (2016/17)
LED lighting upgrade at Rainbow Cottage Childcare Centre (2015/16)
Solar lighting at Dubbo Animal Shelter (2015/16)
LED lighting upgrade at Hawthorne Street Depot (2015/16)
LED lighting upgrade at Macquarie Regional Library (2014/15)
LED lighting upgrade at Dubbo Regional Airport (2014/15)
In February 2019 the Council Energy Fund was awarded to the Hawthorne Street Depot for the
installation of a 20kW solar PV system and to the Dubbo Regional Livestock Markets (saleyards) for
further LED lighting upgrades.
Other initiatives include multiple energy audits conducted across a range of council sites, from which
improvements in energy efficiency and renewable energy installations are proposed. Suggested
improvements include lighting upgrades such as those mentioned above, HVAC
upgrades/replacements and hot water upgrades/replacements. Facility managers are responsible for
the implementation of any suggested improvements unless separate funding is sourced (e.g. Council
Energy Fund).
2.4.2.2 Renewable energy initiatives
15 Solar installations across council including
o 70 kW solar installation at Western Plains Cultural Centre in 2012
o 12 kW solar installation at Barden Park
Together, these installations amount to 1% of Council’s electricity being sourced from
renewable energy.
NRMA and Tesla EV charging stations to be installed at Western Plains Cultural Centre in 2019

21
2.4.3 Council’s energy use snapshot
2.4.3.1 Council’s operating assets DRC has approximately 52 active building electricity accounts, 2 public street lighting accounts, and
107 water and sewer services accounts.
The sites owned by Council vary widely by function and energy demand.
Water treatment and pumping, sewer pumping and wastewater treatment sites, consume
70% of Council’s electricity that is not public street lighting and 58% of overall electricity.
Buildings vary from public facilities such as community centres and libraries, public amenities
and BBQs, parks and ovals, essential services such as Rural Fire Service and SES facilities, and
Council operations facilities such as depots and administration buildings. Of these the Dubbo
Regional Airport is the largest user of electricity followed by the Civic Administration Building,
both located in Dubbo.
2.4.3.2 Energy baseline IN FY17/18, DRC’s sites consumed 19,170 MWh. In addition, streetlighting energy consumption was
3,972 MWh. Council’s energy consumption is dominated by water and sewer assets (58%) followed
by Council buildings (25%). Street lighting is responsible for 17% of energy consumption.
Additionally, Council consumes 5,225 GJ of natural gas, 662.3 GJ of bottled gas, 36,808 GJ of diesel
for fleet, 2,607 GJ of petrol for fleet and 152 GJ of ethanol from E10 for fleet.
FIGURE 13: DRC’S ENERGY BREAKUP BY ASSET CATEGORY
Estimates of end use of energy at both a category and technology level as shown below.

22
FIGURE 14: DRC’S ENERGY END-USE BY EQUIPMENT TYPE
This analysis demonstrates that electric motors associated with water and wastewater pumping
equipment, and street lighting, are the major energy end uses in DRC. In buildings, there is a more
disaggregated consumption profile with lighting and air conditioning being the major energy users.
We can look at energy at a sub-category level as well within each major category, as shown below.

23
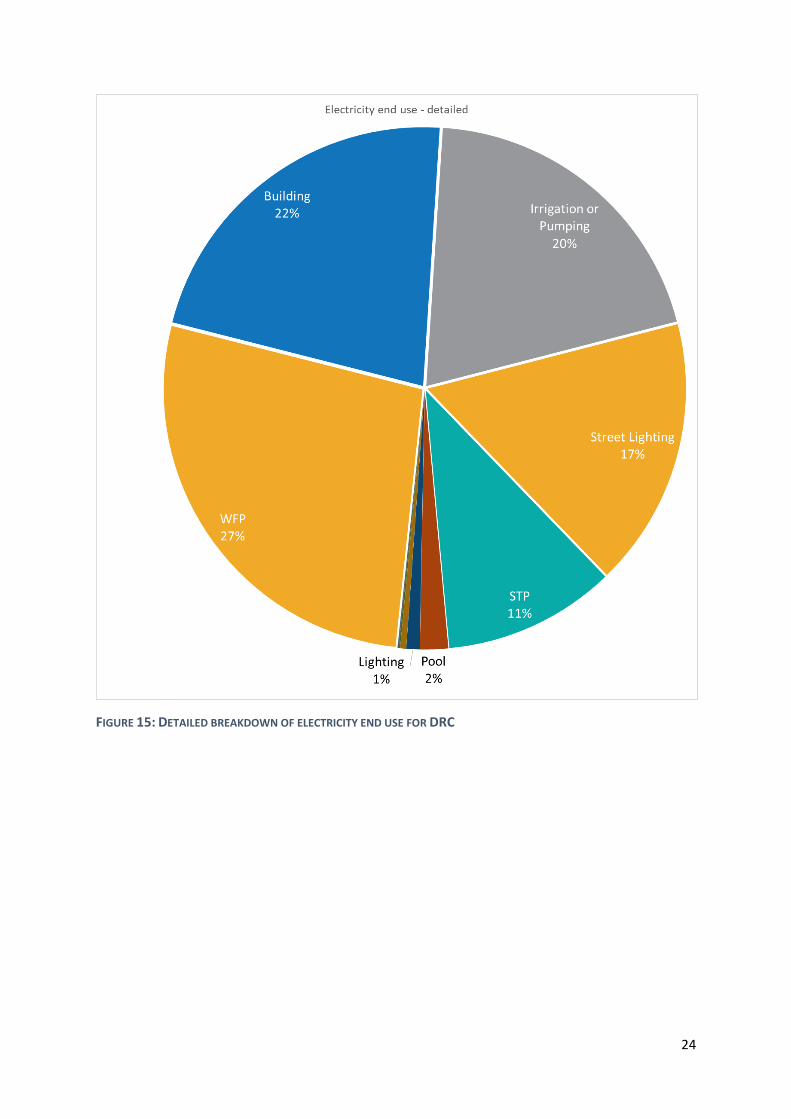
TABLE 1: ENERGY CONSUMPTION AT A SUB-CATEGORY LEVEL
Asset Categories Annual Electricity kWh Annual Usage %
Water and Sewerage 13,366,312 kWh 58.01%
Water Filtration Plant 6,288,479 kWh 27.29%
Sewerage Treatment Plant 2,479,012 kWh 10.76%
Irrigation or Pump 4,598,821 kWh 19.96%
Street Lighting 3,871,914 kWh 16.80%
Public Lighting 3,871,914 kWh 16.80%
Buildings 5,695,423 kWh 24.72%
Airport 826,671 kWh 3.59%
Civic Administration Building 577,914 kWh 2.51%
Convention Centre 498,431 kWh 2.16%
Cultural Centre 549,112 kWh 2.38%
Saleyard 402,321 kWh 1.75%
Fire Shed 14,639 kWh 0.06%
Lighting 191,318 kWh 0.83%
Pool 404,225 kWh 1.75%
Other Buildings 2,230,792 kWh 9.68%
Other 108,482 kWh 0.47%
BBQ 2,182 kWh 0.01%
CCTV 1,093 kWh 0.00%
Communications 19,191 kWh 0.08%
Radio 375 kWh 0.00%
Other Sites 85,641 kWh 0.37%
NA 3,655 kWh 0.12%
Grand Total 23,042,131 kWh 100.00%
This provides a base against which opportunities for energy efficiency and solar PV can be assessed.
Figure 15 provides a visual representation of the above table.
24
FIGURE 15: DETAILED BREAKDOWN OF ELECTRICITY END USE FOR DRC
25
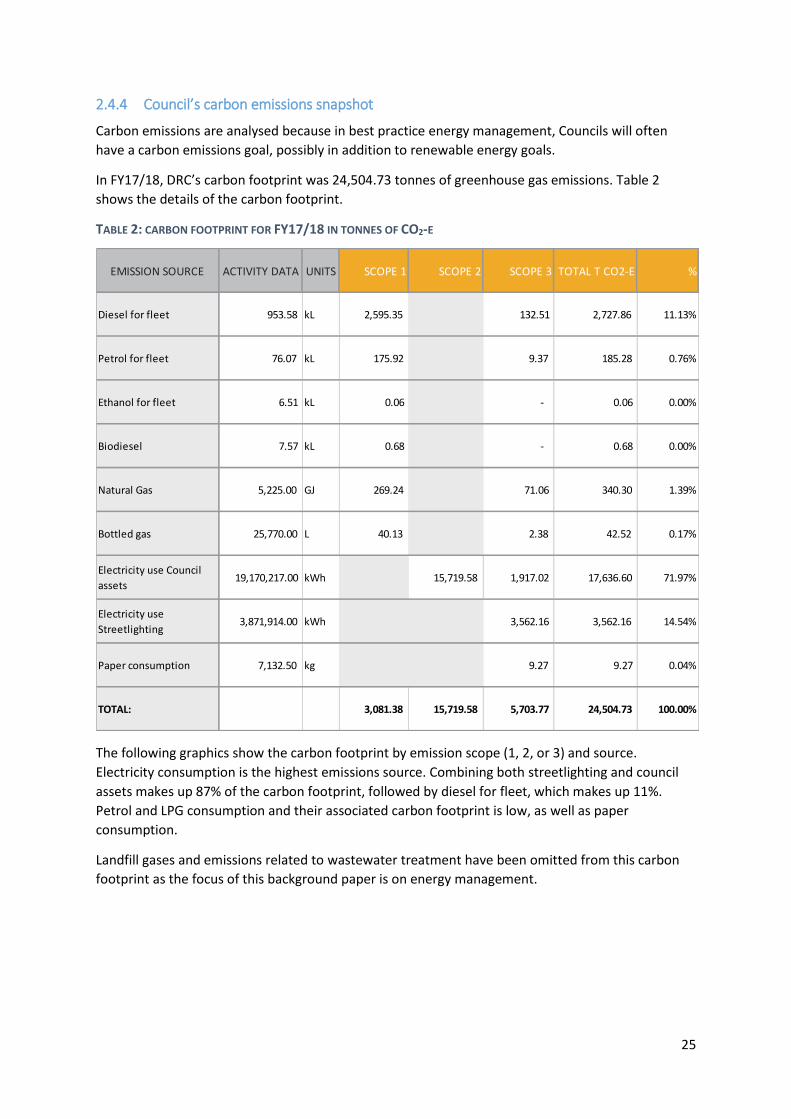
2.4.4 Council’s carbon emissions snapshot
Carbon emissions are analysed because in best practice energy management, Councils will often
have a carbon emissions goal, possibly in addition to renewable energy goals.
In FY17/18, DRC’s carbon footprint was 24,504.73 tonnes of greenhouse gas emissions. Table 2
shows the details of the carbon footprint.
TABLE 2: CARBON FOOTPRINT FOR FY17/18 IN TONNES OF CO2-E
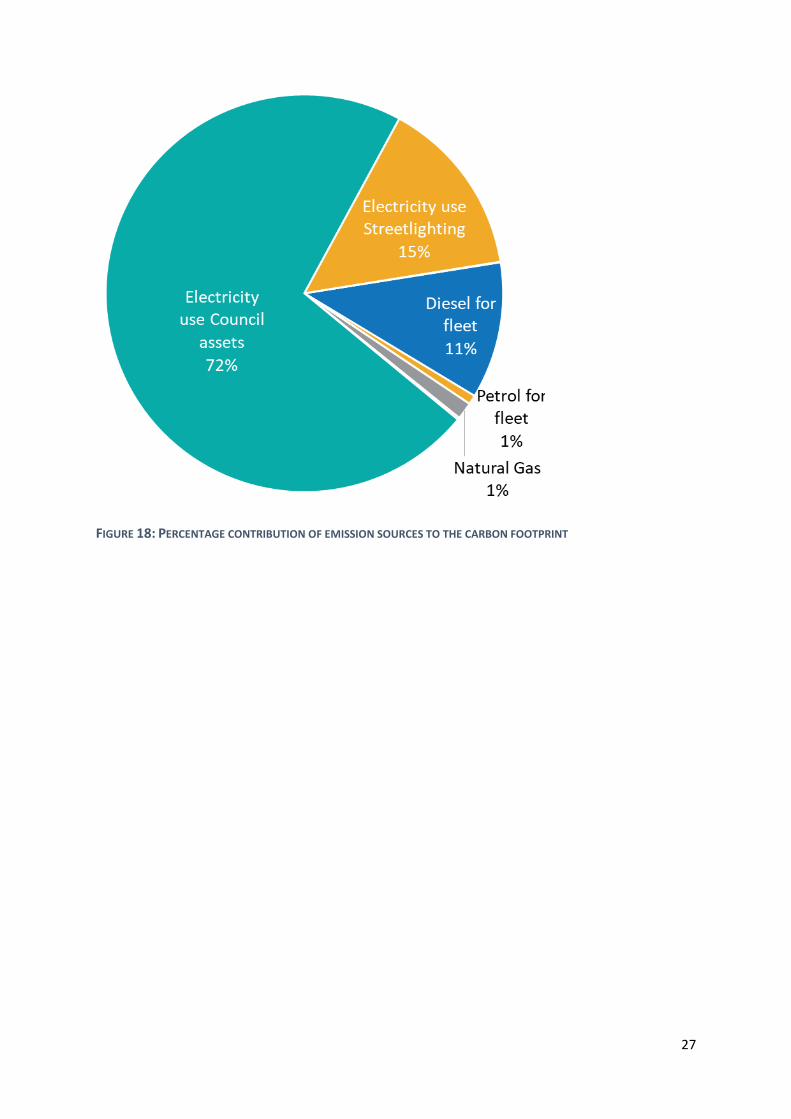
The following graphics show the carbon footprint by emission scope (1, 2, or 3) and source.
Electricity consumption is the highest emissions source. Combining both streetlighting and council
assets makes up 87% of the carbon footprint, followed by diesel for fleet, which makes up 11%.
Petrol and LPG consumption and their associated carbon footprint is low, as well as paper
consumption.
Landfill gases and emissions related to wastewater treatment have been omitted from this carbon
footprint as the focus of this background paper is on energy management.
EMISSION SOURCE ACTIVITY DATA UNITS SCOPE 1 SCOPE 2 SCOPE 3 TOTAL T CO2-E %
Diesel for fleet 953.58 kL 2,595.35 132.51 2,727.86 11.13%
Petrol for fleet 76.07 kL 175.92 9.37 185.28 0.76%
Ethanol for fleet 6.51 kL 0.06 - 0.06 0.00%
Biodiesel 7.57 kL 0.68 - 0.68 0.00%
Natural Gas 5,225.00 GJ 269.24 71.06 340.30 1.39%
Bottled gas 25,770.00 L 40.13 2.38 42.52 0.17%
Electricity use Council
assets 19,170,217.00 kWh 15,719.58 1,917.02 17,636.60 71.97%
Electricity use
Streetlighting 3,871,914.00 kWh 3,562.16 3,562.16 14.54%
Paper consumption 7,132.50 kg 9.27 9.27 0.04%
TOTAL: 3,081.38 15,719.58 5,703.77 24,504.73 100.00%

26
FIGURE 16: CARBON FOOTPRINT BY EMISSION SOURCE AND SCOPE
FIGURE 17: CARBON FOOTPRINT BY SCOPE CONTRIBUTION
-
2,000.00
4,000.00
6,000.00
8,000.00
10,000.00
12,000.00
14,000.00
16,000.00
18,000.00
20,000.00
Carbon footprint by emissions source in t CO2-e
SCOPE 1 SCOPE 2
27
FIGURE 18: PERCENTAGE CONTRIBUTION OF EMISSION SOURCES TO THE CARBON FOOTPRINT

28
2.5 What’s happening in the future - trends Council should know about
2.5.1 Electricity
Any business case for renewable energy needs to be assessed within the context of available pricing
of non-renewable or standard grid power rates. Notwithstanding the environmental and other
benefits gained, for a business case to be viable it should make financial sense for decision makers.
The electricity market in 2017 and 2018 saw significant volatility and unprecedented high pricing,
with many of the price drivers continuing to influence power costs in the coming years. Figure 19
illustrates a possible price trajectory based on ASX futures and our current forecast of the wholesale
electricity market.
FIGURE 19: ELECTRICITY PRICE FORECAST
The cost of renewable energy technology is declining and for the first time in the NSW market, there
appears to be a consistent price differential favouring renewable energy over standard grid power.
2.5.2 Natural gas
As can be seen in Figure 20, wholesale natural gas prices have increased over the last ten years. With
distribution charges and retailer margin gas prices can range from $15 to $25/GJ.
Domestic gas prices have approached parity with world prices as Australia has become a gas
exporter through its LNG projects on the East coast.

29
FIGURE 20: HISTORICAL WHOLESALE GAS PRICES IN AUSTRALIA
Rising gas price trends and potential tempering of electricity prices may make electrification one of
Council’s abatement strategies going forward. Note however the downward trend in Western
Australian (WA) gas prices, which may be the result of domestic gas reservation policies in WA.
2.5.3 Transport
2.5.3.1 Electric vehicles Electric Vehicles (EVs) generate no CO2 emissions directly from their operations, however they
cannot be considered zero emission vehicles unless their batteries are charged from renewable
energy sources. In Australia, electricity from the grid varies in emissions intensity depending upon
which state the electricity is sourced from. This is an important consideration when comparing
electric vehicles with conventional internal combustion engine vehicles.
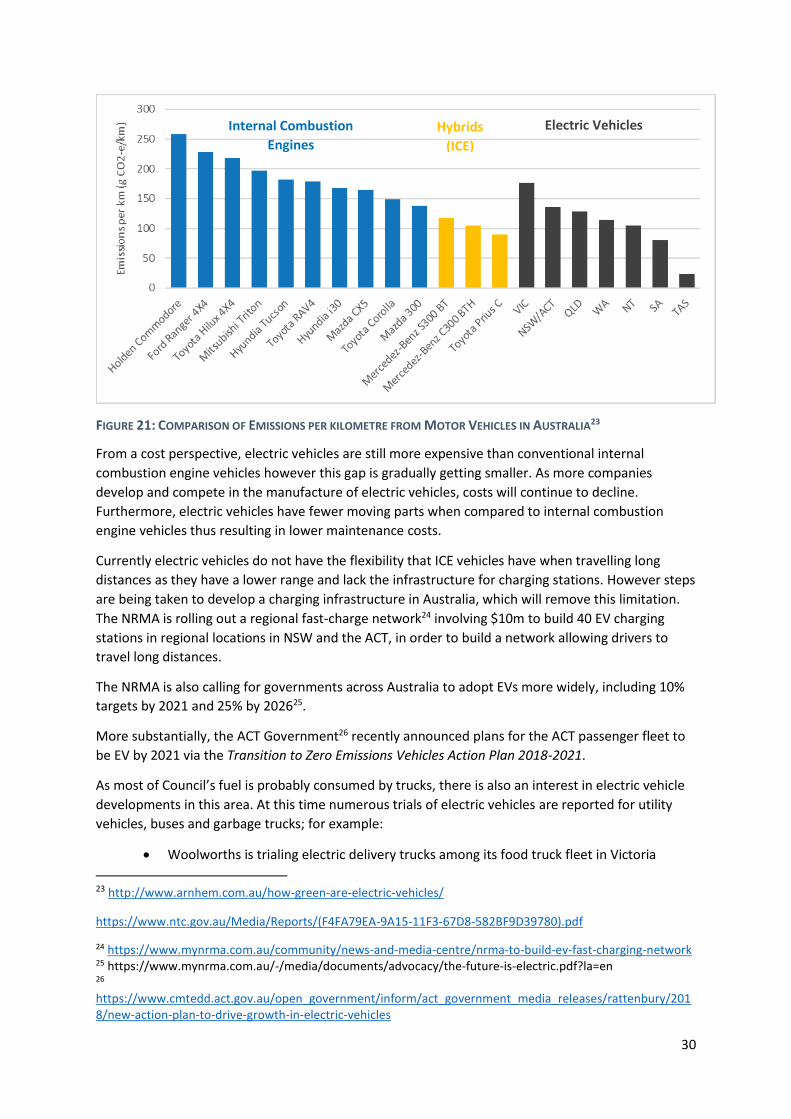
Figure 21 compares the emissions per km of the top 10 selling internal combustion engines (ICE)
vehicles, hybrids (with ICE) and electric vehicles that are charged from the grid in different States.
The figure shows that:
On average electric vehicles have lower emissions than the average or typical internal
combustion engine vehicle however not by a significant amount
States with a higher renewable energy uptake will result in lower emissions per km for electric
vehicles
If electric vehicles are charged from solar panels directly, or from the grid with all of council’s
electricity sourced from renewables, then the emissions per km will be zero.
30
FIGURE 21: COMPARISON OF EMISSIONS PER KILOMETRE FROM MOTOR VEHICLES IN AUSTRALIA23
From a cost perspective, electric vehicles are still more expensive than conventional internal
combustion engine vehicles however this gap is gradually getting smaller. As more companies
develop and compete in the manufacture of electric vehicles, costs will continue to decline.
Furthermore, electric vehicles have fewer moving parts when compared to internal combustion
engine vehicles thus resulting in lower maintenance costs.
Currently electric vehicles do not have the flexibility that ICE vehicles have when travelling long
distances as they have a lower range and lack the infrastructure for charging stations. However steps
are being taken to develop a charging infrastructure in Australia, which will remove this limitation.
The NRMA is rolling out a regional fast-charge network24 involving $10m to build 40 EV charging
stations in regional locations in NSW and the ACT, in order to build a network allowing drivers to
travel long distances.
The NRMA is also calling for governments across Australia to adopt EVs more widely, including 10%
targets by 2021 and 25% by 202625.
More substantially, the ACT Government26 recently announced plans for the ACT passenger fleet to
be EV by 2021 via the Transition to Zero Emissions Vehicles Action Plan 2018-2021.
As most of Council’s fuel is probably consumed by trucks, there is also an interest in electric vehicle
developments in this area. At this time numerous trials of electric vehicles are reported for utility
vehicles, buses and garbage trucks; for example:
Woolworths is trialing electric delivery trucks among its food truck fleet in Victoria
23 http://www.arnhem.com.au/how-green-are-electric-vehicles/
https://www.ntc.gov.au/Media/Reports/(F4FA79EA-9A15-11F3-67D8-582BF9D39780).pdf
24 https://www.mynrma.com.au/community/news-and-media-centre/nrma-to-build-ev-fast-charging-network 25 https://www.mynrma.com.au/-/media/documents/advocacy/the-future-is-electric.pdf?la=en 26 https://www.cmtedd.act.gov.au/open_government/inform/act_government_media_releases/rattenbury/2018/new-action-plan-to-drive-growth-in-electric-vehicles
Internal Combustion
Engines Hybrids
(ICE)
Electric Vehicles

31
BHP has implemented one light commercial vehicle EV in its mining fleet at Olympic Dam,
and Tesla has committed to begin production of light commercial EVs by 202027
Waste Management Ltd, a NZ company, is implementing trials of electric vehicle garbage
trucks in its fleet with a view to expanding EVs depending on the outcomes28
East waste in South Australia is planning an assessment of the case for powering electric
garbage trucks with renewables in 2018/1929
The Victorian Labour Government has announced that Latrobe Valley is set to become the
national centre for Australian electric vehicle production. This project will be done in
partnership with SEA Electric30
City of Casey has rolled out the first electric waste truck in Australia with plans for more
to be deployed across the country31.
2.5.3.2 Hydrogen vehicles Hydrogen vehicles have zero carbon emissions in the expenditure of the fuel hydrogen. In fact, the
only emissions that arise from hydrogen cars is water vapour. The process of producing hydrogen
however does emit emissions as it is very energy intensive. The ACT Government recently purchased
20 hydrogen cars as part of their Renewable Transport Fuels project, where the hydrogen will be
sourced from the electricity generated from a wind farm.32
Hydrogen cars currently have limited commercial availability and lack refuelling stations in Australia.
Currently, there is only one at Hyundai’s head office in Sydney33. Once hydrogen cars become
available in Australia, it is likely that the infrastructure will also follow.
27 https://www.news.com.au/technology/innovation/motoring/motoring-news/genius-aussie-plan-to-make-underground-mining-greener/news-story/bfc2563baa522902ad26609158cc8fe1 28 https://orders.wastemanagement.co.nz/site/sustainability 29 https://www.news.com.au/national/south-australia/east-waste-looking-at-electric-garbage-trucks-powered-by-renewable-energy-to-slash-costs-and-reduce-emissions/news-story/d2dda62d10a5b94ddb6095d73671fb46 30 https://thedriven.io/2018/10/30/transition-massive-new-ev-factory-announced-for-victorias-latrobe-valley/ 31 https://thewest.com.au/lifestyle/motoring/electric-waste-truck-is-an-aussie-first-ng-b88970174z 32https://www.news.com.au/technology/innovation/motoring/hitech/toyota-to-bring-hydrogen-fuelcell-car-to-australia/news-story/a10ead64fda1a413f4146b26b8f8e4ef 33 https://www.news.com.au/technology/innovation/motoring/hitech/toyota-to-bring-hydrogen-fuelcell-car-to-australia/news-story/a10ead64fda1a413f4146b26b8f8e4ef

32
2.6 Best practice energy efficiency and renewable energy opportunities
2.6.1 Energy efficiency opportunities
The most cost-effective renewable energy is the energy that is not used. Businesses have made
enormous strides to use energy more efficiently in recent years, helped by better information,
financial incentives and the rapid development of technologies such as LED lighting.
Energy demand reduction can be planned for in terms of three distinct opportunities: energy
efficiency, technology upgrades and sustainable growth plans.
By identifying efficiency opportunities in these three ways, Council can project what future energy
consumption may be. Having more clarity on future energy use means that Council is well informed
about the likely amount of renewable energy it will need to develop and invest in to meet a
renewable energy or carbon reduction goal. If Council can maintain a focus on optimising its energy
demand, it will lessen the cost of renewables in the long term.
FIGURE 22: REDUCING ENERGY DEMAND THROUGH ENERGY EFFICIENCY
Energy efficiency/productivity plans will typically be short-term focused and will look at energy
waste, behavioural improvements, end-of-life technology upgrades and cost-effective retrofits such
as LED lighting and Building Management System (BMS) optimisation.
Technology upgrades look at capital-intensive equipment that will be replaced over the medium and
long-term. This way, end-of-life opportunities to implement best practice technologies can be
planned and budgeted.
Sustainable growth or expansion strategies provide opportunities for organisations to ensure the
lowest lifetime cost for energy is locked in from the outset rather than as an after-thought, which
can be more expensive in the long run. Strategies to achieve this include efficient design, technology
selection and control plans.
Figure 22 highlights that working across a number of opportunities strategically will result in more
efficient outcomes, including streetlighting, LED lighting upgrades, air conditioning and Building
Management System upgrades, building power and motor systems.

33
2.6.2 Renewable energy opportunities
Installing renewable energy such as solar PV, solar hot water or heat pumps behind the meter
ensures that Council can maximise the financial benefits, as energy distribution costs are avoided as
well as retail energy charges.
Just a few years ago it was uneconomic to export excess renewable energy into the grid. Nowadays,
with lower solar PV prices, feed-in-tariffs and declining costs of battery energy storage systems, it
can make sense to oversize PV systems if Council has roof or land space available.
Battery energy storage systems and complementary technologies are also constantly improving, and
their costs are reducing over time. This will help Council to maximise the value of its renewable
energy systems in future and will help reduce grid costs. Solar hot water is also an excellent
opportunity to switch to a renewable energy source for heating water.
FIGURE 23: RENEWABLE ENERGY OPPORTUNITIES
Many councils have property roof space, infrastructure or land, that is ideally suited to the
development of mid-scale solar farms in front of the meter, or “grid-side”. If not, buying or leasing
land for this purpose may be feasible.
The generated energy from such a solar farm can be used to make Council’s electricity supply
renewable. The major aspects that an assessment will evaluate includes the unsubsidised cost of
energy generation, treatment of renewable energy certificates consistent with Council’s goals, and
retailer engagement and negotiation to facilitate this additional supply source.
Sites that other councils have assessed for solar farms, and in some cases developed, include
wastewater treatment land, landfill sites, airports and dams.
When the cost-effective capacity of energy demand reduction and renewable energy production has
been exhausted, the purchase of renewable energy may be the best way to achieve ambitious
carbon reduction or renewable energy targets.
The traditional way for energy users to source renewable energy has been through the purchase of
accredited GreenPower® or other green energy from energy retailers or providers. Usually, this

34
attracts a premium to grid energy supply. Similarly, energy users can purchase Renewable Energy
Certificates (RECs) to ‘green’ their energy supply, at the prevailing market rate.
The main way in which renewable energy at scale has been sourced in recent years is via corporate
power purchase agreements (PPAs), where renewable energy developers and retailers have
engaged with end users to develop and/or sell all or a percentage of an organisation’s electricity
requirements from renewable energy.
The vast majority of corporate PPAs have been based on utility-scale solar and wind energy. In
future we will see solar, wind, pumped hydro and battery storage be able to offer energy
agreements based on renewables that are sculpted to an end user’s energy demand profile, with low
exposure to wholesale markets.
Increasingly customer-focused models may enable energy users such as Dubbo Regional Council to
receive renewable energy supply offers that are comparable to ‘regular’ retailer offers that are
sourced from the mix of energy sources supplying the grid.
An example of where NSW councils have gone to market for a corporate PPA can be seen below.
2.6.2.1 SSROC34 - renewable energy procurement Southern Sydney Regional Organisation of Councils Inc (SSROC) has signed a landmark agreement on
behalf of 18 councils that will result in up to 35% of their retail electricity being supplied by a
renewable energy generator from 1 July 2019. This innovative approach, achieved through a
renewable energy Power Purchase Agreement (PPA), allows councils to purchase renewable
electricity without exposure to the volatility of the National Electricity Market (NEM). The renewable
energy PPA will provide councils with significant cost savings compared to the current market while
also reducing their carbon emissions.
The ground-breaking contract will provide councils with renewable energy from the Moree Solar
Farm project until the end of 2030, with the balance of their retail electricity needs being supplied as
regular grid electricity by Origin Energy for at least the next three years.
One benefit highlighted in the SSROC approach was the value of aggregating the demand of multiple
end users to achieve a better price for renewable energy supply.
34 All text sourced from http://ssroc.nsw.gov.au/18-nsw-councils-sign-39gwh-per-year-landmark-renewable-energy-agreement-to-cut-emissions-and-costs/

35
2.7 Potential scenarios for electricity consumption to 2030
2.7.1 Scenario 1: no action
The first scenario accounts for DRC’s electricity consumption from Council assets (shown in dark
grey) and streetlighting (shown in light grey), starting from the FY17/18 baseline, being 23,000
MWh. The baseline consumption is projected to 2030, by assuming a 1% population growth rate per
annum (from Profile ID) and no major changes to Council assets.
FIGURE 24: ELECTRICITY CONSUMPTION TO FY29/30 WITH NO ACTION BY DRC
If Council undertakes no energy efficiency or renewable energy measures, its electricity
consumption could be close to 26,000 MWh in 2030.
36
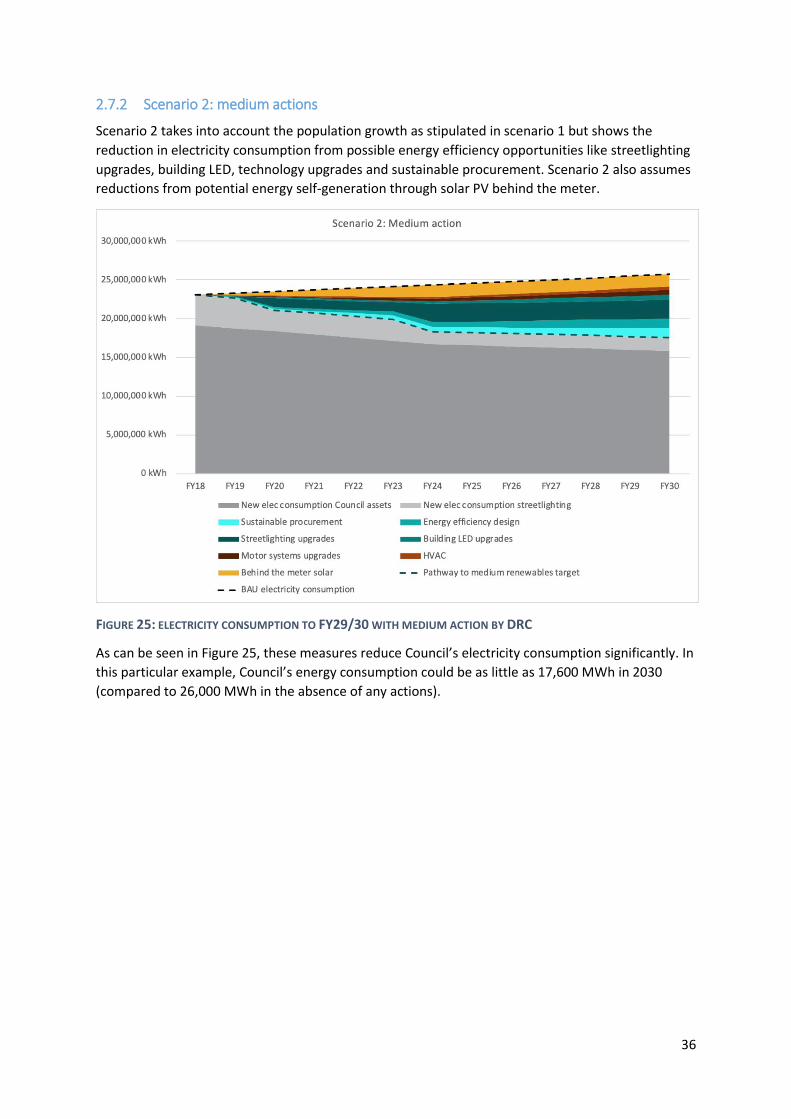
2.7.2 Scenario 2: medium actions
Scenario 2 takes into account the population growth as stipulated in scenario 1 but shows the
reduction in electricity consumption from possible energy efficiency opportunities like streetlighting
upgrades, building LED, technology upgrades and sustainable procurement. Scenario 2 also assumes
reductions from potential energy self-generation through solar PV behind the meter.
FIGURE 25: ELECTRICITY CONSUMPTION TO FY29/30 WITH MEDIUM ACTION BY DRC
As can be seen in Figure 25, these measures reduce Council’s electricity consumption significantly. In
this particular example, Council’s energy consumption could be as little as 17,600 MWh in 2030
(compared to 26,000 MWh in the absence of any actions).

37
2.7.3 Scenario 3: 100% renewable electricity
Based on previous experience, it is possible to achieve a maximum of 40% carbon reduction through
onsite measures such as energy efficiency or renewable energy. The remainder can only be met
through ambitious actions like building a mid-scale solar farm or through sourcing renewable energy.
Scenario 3 accounts for all actions from scenario 2, but additionally shows the impact of power
purchase agreements (PPAs) to reach 100% renewable energy in 2030. In this particular example,
DRC would increase the percentage of renewable energy purchases every three years, starting with
20% renewables initially.
FIGURE 26: ELECTRICITY CONSUMPTION TO FY29/30 WITH A PATH TO 100% RENEWABLE ELECTRICITY

38
2.8 Feedback received at ELT and councillor workshops
Two workshops were run on 13 March, the first with DRC’s Executive Leadership Team (ELT), the
second with DRC’s councillors.
2.8.1 Agenda for the workshops
The workshops started with a presentation from 100% Renewables on the international and local
context for energy management. Previous and current initiatives by DRC were discussed, as well as
the three scenarios presented in the previous section. This was followed by a set of activities.
The questions the activities sought to answer were as follows:
What is Council’s vision for its energy strategy?
What are the types of technology and/or key projects Council would like to be investigated
further to help achieve the vision?
2.8.2 ELT workshop - attendance
The following is a list of attendees of the ELT workshop.
Attendees
1. Ian McAlister – Manager Recreation and Open Space 2. John Watts – Director Community and Recreation 3. Maria Crisante – Executive Manager People, Culture and Safety 4. Steven Jennings – Director Planning and Environment (Acting) 5. Linda Christof – Manager Dubbo Regional Theatre and Convention Centre 6. Mark Giebel – Manager Solid Waste 7. Elizabeth Bell – Corporate Procurement Specialist 8. Natasha Comber – Director Economic Development and Business 9. Debbie Archer – Manager Environmental Control 10. Steven Colliver – Manager Fleet Services 11. Simon Tratt – Manager Property Assets 12. Craig Giffen – Director Corporate Services 13. Michael McMahon – CEO 14. Stephen Carter – Manager Water Supply and Sewerage 15. Chris Devitt – Director Infrastructure and Operations 16. Stephen Howlett – Manager Infrastructure Strategy 17. Catriona Jennings – Sustainability and Education Officer
Apologies:
Jacki Parish – Manager Airport Operations
Andrew Glassop – Manager Cultural Services
Michael Ferguson – Executive Manager Governance and Internal Control
Ross McCarthy – Manager Saleyards and Showground
Jane Bassingthwaigthe – Chief Financial Officer
Stephen Wallace – Director Planning and Environment

39
2.8.3 ELT workshop - key findings
The following shows the key findings of the ELT workshop.
The strategy should encompass other areas like water, waste and the natural environment as
well
The strategy should include actions for Council operations as well as for the community
Special innovation fund for renewables and fund energy efficiency from budget
Council needs to undertake a solar feasibility study to investigate the roll-out of small and
larger scale solar installations for its assets
2.8.4 Councillor workshop – attendance
The following is a list of attendees of the councillor workshop.
Attendees
1. Councillor Jane Diffey 2. Councillor Kevin Parker 3. Councillor Vicki Etheridge 4. Deputy Mayor Anne Marie Jones 5. Mayor Ben Shields 6. Councillor John Ryan 7. Councillor David Grant 8. Michael McMahon - CEO 9. Chris Devitt – Director Infrastructure and Operations 10. Natasha Comber – Director Economic Development and Business 11. Craig Giffen – Director Corporate Services 12. Steven Jennings - Director Planning and Environment (Acting) 13. Debbie Archer - Manager Environmental Control 14. Catriona Jennings - Sustainability and Education Officer
Apologies:
Councillor Stephen Lawrence
Councillor Greg Mohr
Councillor Dayne Gumley
Director Community and Recreation – John Watts
2.8.5 Councillor workshop - key findings
The following shows the key findings of the councillor workshop.
Council to lobby the State Government to provide financial support for the rollout of LED
streetlighting in the short term.
Council to undertake a feasibility study into the bulk upgrade of street lighting across the LGA,
including collating all relevant information and financial options to undertake the project in
the short term.
Dependent on the business case for a bulk upgrade of LED streetlighting, undertake the
project in the short to medium term.
40
Council to undertake a feasibility study to identify all suitable Council-owned sites or facilities
for solar PV installations, financing options and a program for the staged roll-out of
installations in the short term.
Council to undertake a staged roll-out of solar PV installations across all suitable council-
owned sites or facilities in the short and medium term.
The energy strategy should cover both council operations and the community
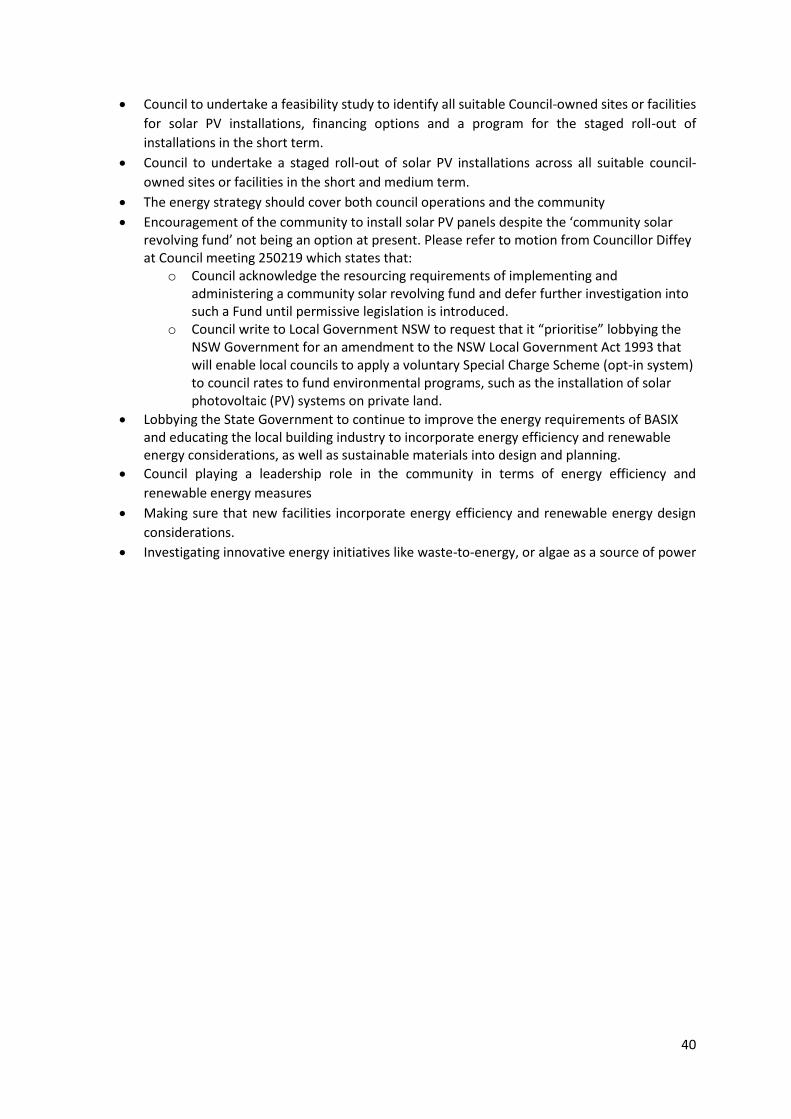
Encouragement of the community to install solar PV panels despite the ‘community solar revolving fund’ not being an option at present. Please refer to motion from Councillor Diffey at Council meeting 250219 which states that:
o Council acknowledge the resourcing requirements of implementing and administering a community solar revolving fund and defer further investigation into such a Fund until permissive legislation is introduced.
o Council write to Local Government NSW to request that it “prioritise” lobbying the NSW Government for an amendment to the NSW Local Government Act 1993 that will enable local councils to apply a voluntary Special Charge Scheme (opt-in system) to council rates to fund environmental programs, such as the installation of solar photovoltaic (PV) systems on private land.
Lobbying the State Government to continue to improve the energy requirements of BASIX and educating the local building industry to incorporate energy efficiency and renewable energy considerations, as well as sustainable materials into design and planning.
Council playing a leadership role in the community in terms of energy efficiency and
renewable energy measures
Making sure that new facilities incorporate energy efficiency and renewable energy design
considerations.
Investigating innovative energy initiatives like waste-to-energy, or algae as a source of power

41
3 The Strategy
3.1 Strategic Vision / Objective
Dubbo Regional Council is a leader in regional New South Wales in the reduction of energy
consumption, increased energy efficiency and the continued adaptation to and use of renewable
energy.
3.2 Policy Context
The Dubbo Regional Council Energy Strategy and Implementation Plan is designed to support and
guide Council in reducing energy consumption, increasing energy efficiency, increasing the use and
adoption of renewable energy resources and sustainable transport while taking into account the
needs and desires of a growing community. The Strategy and Implementation Plan also seeks to
support the local community in becoming energy smart.
Council’s requirements for the development of an Energy Strategy and Implementation Plan has
arisen from the 2040 Community Strategic Plan (CSP) which states under Strategy 2.1.3.3 that an
energy strategy is to be prepared for Council facilities and buildings by the Division of Planning and
Environment. Additional CSP strategies supporting the development of the Strategy and
Implementation Plan include: 2.1 Opportunities for use of renewable energy are increased and 5.9
Environmental sustainability is a priority.
While the Strategy supports the direction and outcomes Council would like to achieve, the
implementation plan will provide the actions and tasks for achieving the key strategic objectives
under the key strategy areas.
The Strategy and Implementation Plan sits below the 2040 CSP and informs Council’s four year
Delivery and one year Operational Plans. During the revision of these Plans Council Directors will be
required to consider the inclusion of the relevant strategies and actions.
3.3 Key Strategy Areas
The Energy Strategy has been divided into four key strategy areas. The individual strategies include:
1. Energy Efficiency – products, procedures that increase the efficient use of energy in
Council’s activities and operations
2. Renewable Energy – electricity derived from sustainable sources such as the sun
3. Sustainable Transport – use of, and operation of vehicles in councils operations
4. Supporting Energy Smart Communities – actions to support the community in becoming
energy smart

42
3.3.1 Strategy Area One – Energy Efficiency
Goal:
Council implements energy efficiency practices and improvements across its activities and operations.
Rationale:
Energy inputs are expensive, and organisations see this reflected on their electricity, gas and
transport fuel bills. The higher the price an organisation pays for energy, the greater the value of
being more energy efficient and switching to renewables.
Energy efficiency means to either perform the same activity with less energy input or accomplish
more activity with the same amount of energy input. Either way, Council can achieve more with each
unit of energy consumed and realise the cost savings.
Key Strategic Outcomes:
1.1 Council staff are aware of and supported to implement energy-efficiency measures.
1.2 Council’s procurement policies and plans set minimum energy efficiency benchmarks
1.3 Council major capital works and/or building projects set minimum energy efficiency
benchmarks in their design and construction
1.4 Council adopts best practice energy efficiency measures across all buildings and facilities, with a
priority on upgrading very high to high energy using sites.
1.5 Council rolls out energy efficient street lighting across the local government area
1.6 Technological advances in energy-efficient products are investigated to assess the feasibility of
implementation
1.7 Council’s energy consumption is monitored and energy savings are assessed

43
3.3.2 Strategy Area Two – Renewable Energy
Goal:
Council obtains 50% of its predicted electricity consumption* by 2025 from renewables, directly or by
purchasing renewable energy.
Rationale:
Electricity use for street lighting and council assets currently results in 87% of Council’s greenhouse
gas emissions from energy consumption (electricity, gas, fuel). Council can therefore reduce
emissions associated with energy consumption through focusing on increasing the amount of
electricity sourced from renewable energy. In addition, investing in renewable energy opportunities
such as behind the meter solar PV systems on Council assets can provide financial savings to Council
when grid electricity charges are offset.
Adopting and pursuing a 50% target for renewables by 2025 would position Council among a
number of leading NSW Councils who have adopted ambitious renewable energy and carbon goals
in recent years. A common theme amongst local councils is ‘100% renewables by 2030’ and the
proposed 50% target sets Council on the same trajectory. The Strategy timeframe only extends to
2025 because it is believed that the renewable energy industry will change so rapidly within the next
5 years that a revision of Council’s Strategy & Implementation Plan will be required.
100% Renewables (expert energy consultant) provided further information as to what actions
Council should prioritise to meet the above proposed target with the following advice provided in
their report dated 25 November 2019 (TRIM Ref. ED19/187509):
1. Focus on behind the meter solar PV at all sites where this is feasible, aiming to meet onsite
demand with some export where this is permitted by Essential Energy.
2. Commence investigation into a renewable energy power purchase agreement (PPA), to be
included in either the next electricity supply agreement for Council’s large sites or the
following tender (e.g. in 2 to 3 years’ time).
3. For a solar farm on Council-owned land, limit current investigations to preliminary enquiries
with Essential Energy about the likely potential to connect 5 MW up to say 15 MW into their
grid from sites owned by Council that could be used for this purpose. Maintain a watch on
price / EPC trends for mid-scale solar projects as well as trends in battery storage for grid-
scale projects. Sizeable falls in technology and EPC costs may trigger a feasibility assessment
of suitable sites in a few years’ time.
4. Battery storage, solar hot water and opportunities such as virtual net metering / local
generation credits, micro grids and the like should continue to be pursued as part of an
overall renewable energy / carbon abatement strategy. However in the context of large
goals such as 50% renewables, the first two priorities here should be the major focus.

44
Key Strategic Outcomes:
2.1 Council staff are aware of and supported to implement renewable energy measures.
2.2 Council major capital works and/or building projects set minimum renewable energy
benchmarks in their design and construction
2.3 Council develops and implements a behind-the-meter solar PV program to meet up to 25% of
its predicted electricity consumption* from renewables by 2025.
2.4 Council develops and implements a Power Purchasing Agreement (PPA) to meet up to 25% of
its predicted electricity consumption* from renewables by 2025
2.5 Council implements landfill gas methane flaring and investigates methane capture for
electricity generation.
2.6 Council is aware of and investigates alternative renewable energy opportunities
2.7 Council maintains a revolving energy fund to finance renewable energy projects
2.8 Solar PV systems on Council buildings and facilities are managed, monitored and maintained
*Council’s predicted electricity consumption by 2025 is estimated to be 24,500 MWH should no
action be taken to reduce energy use across Council operations. It is therefore expected that a
maximum of 12,250 MWH of electricity would need to be sourced from renewable energy sources by
2025.
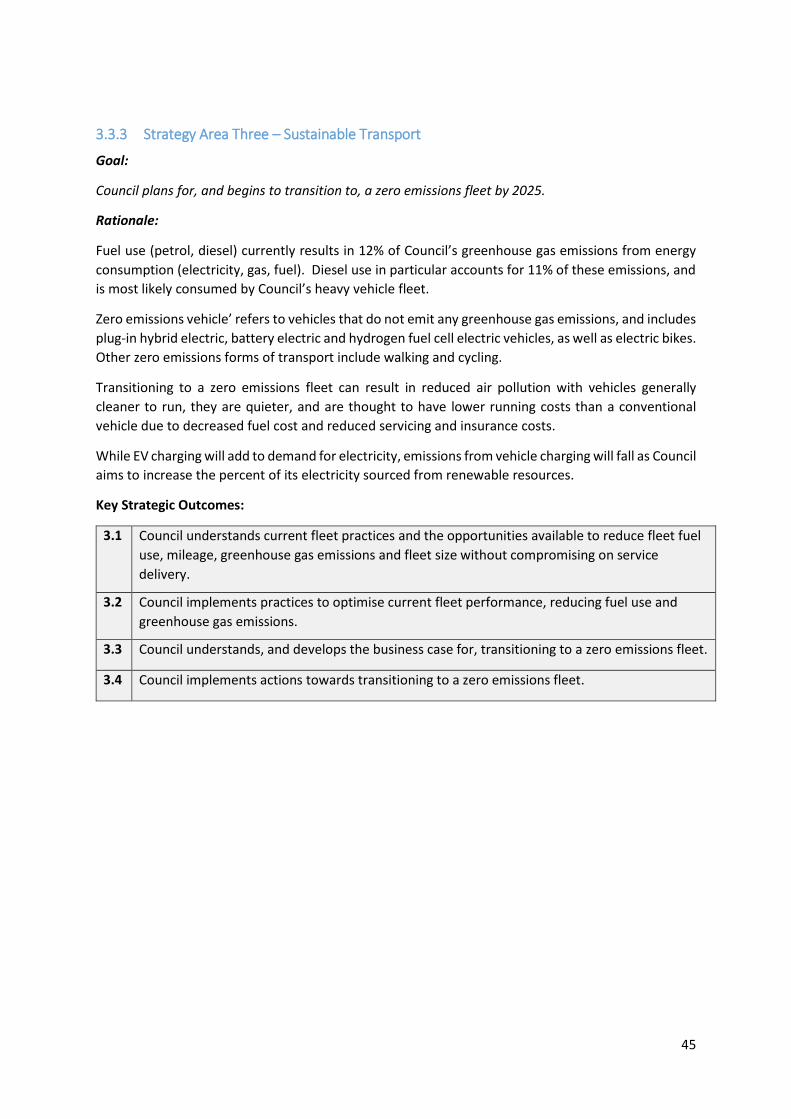
45
3.3.3 Strategy Area Three – Sustainable Transport
Goal:
Council plans for, and begins to transition to, a zero emissions fleet by 2025.
Rationale:
Fuel use (petrol, diesel) currently results in 12% of Council’s greenhouse gas emissions from energy
consumption (electricity, gas, fuel). Diesel use in particular accounts for 11% of these emissions, and
is most likely consumed by Council’s heavy vehicle fleet.
Zero emissions vehicle’ refers to vehicles that do not emit any greenhouse gas emissions, and includes
plug-in hybrid electric, battery electric and hydrogen fuel cell electric vehicles, as well as electric bikes.
Other zero emissions forms of transport include walking and cycling.
Transitioning to a zero emissions fleet can result in reduced air pollution with vehicles generally
cleaner to run, they are quieter, and are thought to have lower running costs than a conventional
vehicle due to decreased fuel cost and reduced servicing and insurance costs.
While EV charging will add to demand for electricity, emissions from vehicle charging will fall as Council
aims to increase the percent of its electricity sourced from renewable resources.
Key Strategic Outcomes:
3.1 Council understands current fleet practices and the opportunities available to reduce fleet fuel
use, mileage, greenhouse gas emissions and fleet size without compromising on service
delivery.
3.2 Council implements practices to optimise current fleet performance, reducing fuel use and
greenhouse gas emissions.
3.3 Council understands, and develops the business case for, transitioning to a zero emissions fleet.
3.4 Council implements actions towards transitioning to a zero emissions fleet.

46
3.3.4 Strategy Area Four – Supporting Energy Smart Communities
Goal:
The community is supported in becoming energy smart and ultimately adopts energy efficient,
renewable energy and sustainable transport practices.
Rationale:
Increasing concerns over climate change, managing energy supply to meet growing demand levels,
and reducing the environmental impacts associated with energy use are some of the most significant
challenges for government, business and the community.
Recent electricity price increases and proposed further increases are driving electricity customers to
take steps to reduce consumption and install renewable energy. Government at all levels is taking
action to reduce energy consumption and to cut greenhouse gas emissions associated with the use of
non- renewable energy sources. This action includes supporting communities in becoming ‘energy
smart’.
Key Strategic Outcomes:
4.1 Council strategic and statutory planning processes support and promote energy efficiency,
renewable energy and sustainable transport.
4.2 Council lobbies state and federal government to address barriers to the take up of renewable
energy, energy efficiency and/or sustainable transport, and to support increased ambition in
these areas.
4.3 Council promotes and supports programs to increase community knowledge, skills and capacity
to shift to renewable energy, energy efficiency and sustainable transport options.
4.4 Council investigates, and if feasible, provides incentives to the community to increase the
uptake of energy efficiency, renewable energy and sustainable transport options
4.5 Council supports the establishment of a community energy group to drive community energy
initiatives across the local government area. Initially this may mean providing grant writing
support to apply for relevant funds to begin this process.

47
4 Implementation Plan
4.1 Implementation Plan
This section contains specific actions to be undertaken by Dubbo Regional Council to ensure the key
strategic outcomes in the Energy Strategy are addressed.
A copy of the Implementation Plan is below.
The delivery timeframe for the Plan will be from when the Energy Strategy and Implementation Plan
is adopted by the Executive Leadership Team and/or Council until June 2025.
The delivery timeframe is split into three categories and assigned against each specific action.
• Short Term – completion within 1-2 years
• Medium Term – completion within 3-5 years
• Ongoing – a recurring event to be completed on a continuing basis

48
Strategy Area
Key Strategic Outcomes Actions Delivery Funding Responsibility
Energy Efficiency
1.1 Council staff are aware of and supported to implement energy-efficiency measures.
1.1.1 A staff induction video is developed for and shown at all staff inductions to raise awareness and knowledge of Council’s sustainability principles and practices.
Short Term Development & Environment
People and Culture Team
1.1.2 An annual staff training session in asset energy management is conducted to drive improvements in facility and asset energy management.
Ongoing Organisational Performance
Manager Property Assets
Energy Efficiency
1.2 Council’s procurement policies and plans set minimum energy efficiency benchmarks.
1.2.1 The Council Procurement Policy is amended and sets a number of minimum energy efficiency benchmarks. Example provisions could include for the purchase of lighting, appliances and/or hot water systems the following: - Where a light is end of life, replacement
must be with a Light Emitting Diodes (LEDs), subject to site conditions and funding. Consideration should also be given to adding sensor controllers (motion & light).
- For all product categories covered under the Australian Government’s Equipment Energy Efficiency rating scheme only products within two stars of the best available rating are to be considered (includes televisions, refrigerators, dishwashers, computers, monitors, air conditioners, washers, dryers).
Refer: www.energyrating.gov.au
Short Term Organisational Performance
Corporate Procurement Specialist / Organisational Sustainability Coordinator

49
Strategy Area
Key Strategic Outcomes Actions Delivery Funding Responsibility
- Where a gas appliance or system is end of
life consider electrification and/or renewable energy options (e.g. solar panel or heat pump hot water systems).
Energy Efficiency
1.3 Council major capital works and/or building projects set minimum energy efficiency benchmarks in their design and construction.
1.3.1 Council develops and adopts a Sustainable Buildings Policy which sets minimum energy efficiency benchmarks in the design and construction of major capital works and/or buildings projects. During Policy development consider the inclusion of the Green Building Council of Australia’s Green Star Rating Program, or similar program, to define energy efficiency benchmarks.
Short Term Development & Environment
Organisational Sustainability Coordinator
1.3.2 Council implements a Sustainable Buildings Policy which sets minimum energy efficiency benchmarks in the design and construction of major capital works and/or buildings projects.
Short Term All Council Divisions
Relevant Asset Managers
Energy Efficiency
1.4 Council adopts best practice energy efficiency measures across all buildings and facilities, with a priority on upgrading very high to high energy using sites.
1.4.1 Develop and implement an energy efficiency project to prioritise the upgrade of very high to high energy using sites across Council (E.g. sites using >100,000 kwh per year and or > $20,000 in energy bills per year). Consider upgrading end of life motor systems, lighting, HVAC and electrication of gas appliances, space and water heating systems.
Short Term Relevant Divisions
Manager Property Assets

50
Strategy Area
Key Strategic Outcomes Actions Delivery Funding Responsibility
This project would include seeking quotations from expert consultants to undertake energy audits, recommend improvements, and implement end of life upgrades where appropriate and cost effective.
Energy Efficiency
1.5 Council rolls out energy efficient street lighting and smart controls program across the local government area
1.5.1 Work in collaboration with Essential Energy to undertake a LED street light replacement program across the LGA
Short Term Infrastructure Organisational Sustainability Coordinator
1.5.2 Work in collaboration with Essential Energy to investigate the business case for, and if feasible install, smart controls for LED street lights across the LGA. Smart controllers can enable light dimming further enhancing energy savings.
Short Term Infrastructure Organisational Sustainability Coordinator
1.5.3 Work in collaboration with Essential Energy to investigate the business case for, and if feasible install integrated smart pole technology within the CBD areas of Dubbo (Macquarie St, Talbragar St) and Wellington (Swift St).
Medium Term
Infrastructure Manager Infrastructure Strategy & Design
1.5.4 Undertake a LED light replacement program across all Council parks, reserves and open space, with a priority focus on Victoria and Cameron Parks.
Short Term Liveability Manager Recreation & Open Space
1.5.5 Develop and implement appropriate policy to ensure all new developments and future street lighting upgrades adopt LED technology
Short Term Infrastructure Manager Infrastructure Strategy & Design

51
Strategy Area
Key Strategic Outcomes Actions Delivery Funding Responsibility
Energy Efficiency
1.6 Technological advances in energy-efficient products are investigated to assess the feasibility of implementation
1.6.1 New technologies are identified and capital costs are monitored to assess feasibility for implementation across key Council buildings
Ongoing Organisational Performance
Manager Property Assets
1.6.2 Pilot, and build the business case for, installing intelligent building management systems across key Council buildings
Medium Term
Organisational Performance
Manager Property Assets
Energy Efficiency
1.7 Council’s energy consumption is monitored and energy savings are assessed
1.7.1 Energy management tools, such as e21, are utilised to monitor Council’s energy consumption.
Ongoing Organisational Performance
Corporate Procurement Specialist
1.7.2 Energy performance of buildings and facilities, where monitored via Council’s energy management tool, is regularly reported.
Ongoing (quarterly)
Development & Environment
Organisational Sustainability Coordinator
1.7.3 Smart Metering and internal monitoring software is installed at very high to high energy consuming Council facilities and/or buildings.
Short Term Organisational Performance
Manager Property Assets
Renewable Energy
2.1 Council staff are aware of and supported to implement renewable energy measures.
2.1.1 Council continues to be a member of the NSW Department of Planning, Industry and Environment’s (DPIE) Sustainability Advantage Program, or a similar program, of whom builds the capacity of council staff to understand and implement renewable energy measures.
Ongoing Development & Environment
Organisational Sustainability Coordinator

52
Strategy Area
Key Strategic Outcomes Actions Delivery Funding Responsibility
Renewable Energy
2.2 Council major capital works and/or building projects set minimum renewable energy benchmarks in their design and construction
2.2.1 Council develops and adopts a Sustainable Buildings Policy which sets minimum renewable energy benchmarks in the design and construction of major capital works and/or buildings projects. During Policy development consider the inclusion of the Green Building Council of Australia’s Green Star Rating Program, or similar program, to define renewable energy benchmarks. For example a 5 or 6 Green Star Rating is generally associated with a 100% renewable energy requirement and related to high cost projects (>$5 million).
Short Term Development & Environment
Organisational Sustainability Coordinator
2.2.2 Council implements a Sustainable Buildings Policy which sets minimum renewable energy benchmarks in the design and construction of major capital works and/or buildings projects.
Short Term All Council Divisions
Relevant Asset Managers
Renewable Energy
2.3 Council develops and implements a behind-the-meter solar PV program to meet up to 25% of its predicted electricity consumption* from renewables by 2025.
2.3.1 Council develops a behind-the-meter solar PV program to meet up to 25% of its predicted electricity consumption* from renewables by 2025.
Short Term Development & Environment
Organisational Sustainability Coordinator
2.3.2 Council implements a behind-the-meter solar PV program to meet up to 25% of its predicted electricity consumption* from renewables by 2025.
Short Term Development & Environment (Revolving Energy Fund refer 2.7.1)
Manager BILT

53
Strategy Area
Key Strategic Outcomes Actions Delivery Funding Responsibility
Renewable Energy
2.4 Council develops and implements a Power Purchasing Agreement (PPA) to meet up to 25% of its predicted electricity consumption* from renewables by 2025
2.4.1 Council develops a Power Purchasing Agreement (PPA) program to meet up to 25% of its predicted electricity consumption* from renewables by 2025.
Short Term Development & Environment
Organisational Sustainability Coordinator
2.4.2 Council implements a Power Purchasing Agreement (PPA) to meet up to 25% of its predicted electricity consumption* from renewables by 2025.
Medium Term
Organisational Performance
Corporate Procurement Specialist
Renewable Energy
2.5 Council implements landfill gas methane flaring and investigates methane capture for electricity generation.
2.5.1 Council continues to implement landfill gas methane flaring at its primary landfill facility.
Short Term Development & Environment
Manager Resource Recovery & Efficiency
2.5.2 Council commissions a detailed feasibility study of methane capture for electricity generation.
Medium Term
Development & Environment
Organisational Sustainability Coordinator
Renewable Energy
2.6 Council is aware of and investigates alternative renewable energy opportunities
2.6.1 New technologies are identified and capital costs are monitored to assess feasibility for implementation.
Ongoing Development & Environment
Organisational Sustainability Coordinator
2.6.2 Council investigates Virtual Net Metering or Virtual Power Plant (VPP) energy models to aggregate Council’s solar capacity and offset energy use across all Council sites.
Medium Term
Development & Environment
Organisational Sustainability Coordinator

54
Strategy Area
Key Strategic Outcomes Actions Delivery Funding Responsibility
2.6.3 Council expands solar battery storage capacity and create scalable storage networks across Council assets.
Medium Term
Development & Environment
Organisational Sustainability Coordinator
Renewable Energy
2.7 Council maintains a revolving energy fund to finance renewable energy projects
2.7.1 Council maintains a revolving energy fund to finance renewable energy projects inline with Council’s Energy Strategy And Implementation Plan.
Short Term Development & Environment
Organisational Sustainability Coordinator
Renewable Energy
2.8 Solar PV systems on Council buildings and facilities are managed, monitored and maintained
2.8.1 Council develops a policy for the installation, management, maintenance, and monitoring of solar PV systems on all Council buildings and facilities.
Short Term Development & Environment
Organisational Sustainability Coordinator
2.8.2 Council implements the policy for the installation of solar PV systems on all Council buildings and facilities.
Short Term All Council Divisions
Relevant Asset Managers/ Manager BILT
2.8.3 Council implements a policy for the management, maintenance and monitoring of solar PV systems on all Council buildings and facilities.
Short Term Organisational Performance
Manager Property Assets
Sustainable Transport
3.1 Council understands current fleet practices and the opportunities available to reduce fleet fuel use, mileage, greenhouse gas emissions and fleet size without compromising on service delivery.
3.1.1 Undertake a Fleet Utilisation Study to examine current practices and to better understand the opportunities available to reduce fleet fuel use, mileage, greenhouse gas emissions and fleet size without compromising on service delivery.
Short Term Infrastructure Manager Fleet & Depot Services

55
Strategy Area
Key Strategic Outcomes Actions Delivery Funding Responsibility
Sustainable Transport
3.2 Council implements practices to optimise current fleet performance, reducing fuel use and greenhouse gas emissions.
3.2.1 Procedures and/or programs to reduce fuel usage are developed. This may include minimum efficiency standards for council vehicles, or driver training and education.
Short Term Infrastructure Manager Fleet & Depot Services
3.2.3 Council increases vehicle resource sharing where appropriate (fleet size optimisation).
Short Term Infrastructure Manager Fleet & Depot Services
3.2.3 Council’s maintenance and replacement program is implemented
Ongoing Infrastructure Manager Fleet & Depot Services
3.2.4 Council promotes and supports ride or walk to work days, staff car pooling, and other less carbon intensive transport options throughout the year.
Ongoing Executive Services
Executive Manager People, Culture and Safety
3.2.5 Council investigates, and if feasible installs, improved bike storage and staff change facilities at key Council buildings.
Short Term Organisational Performance
Manager Property Assets
3.2.6 Council’s vehicle emissions offset program, Neutral Drive, is retained and continued in the short term
Short Term Infrastructure Manager Fleet & Depot Services
3.2.7 Biodiesel use by Council is retained and continued in the short term
Short Term Infrastructure Manager Fleet & Depot Services

56
Strategy Area
Key Strategic Outcomes Actions Delivery Funding Responsibility
Sustainable Transport
3.3 Council understands, and develops the business case for, transitioning to a low or zero emissions fleet
3.3.1 Council develops a Transition to EV Roadmap in order to understand how to, and build the business case for, transitioning to a low or zero emissions fleet.
Short Term Infrastructure Organisational Sustainability Coordinator / Manager Fleet & Depot Services
Sustainable Transport
3.4 Council implements actions towards transitioning to a low to zero emissions fleet
3.4.1 Council implements initiatives towards transitioning to a zero emissions fleet. For example: - Trial of electic vehicles and charging stations; - Setting minimum environmental
performance criteria in Council Fleet Procurement Policy;
- Inclusion of incentives to adopt zero emissions vehicles in Council’s vehicle leaseback policies;
- Inclusion of requirements to plan for zero emissions fleet within new council buildings and facilities;
- Installing fast charging infrastructure across Council facilities as appropriate;
- Continuing to monitor new zero emission fleet technology.
Medium Term
Infrastructure Manager Fleet & Depot Services

57
Strategy Area
Key Strategic Outcomes Actions Delivery Funding Responsibility
Supporting Energy Smart Communities
4.1 Council strategic and statutory planning processes support and promote energy efficiency, renewable energy and sustainable transport.
4.1.1 Energy efficiency, renewable energy and sustainable transport provisions included within Council strategic and statutory plans, including the Local Strategic Planning Statement, Community Strategic Plan, Local Environmental Plan, and Development Control Plan.
Short Term Development & Environment
Manager Growth Planning
Supporting Energy Smart Communities
4.2 Council lobbies state and federal government to address barriers to the take up of renewable energy, energy efficiency and/or sustainable transport, and to support increased ambition in these areas.
4.2.1 Council to lobby state and federal government when and where appropriate
Ongoing Development & Environment
Director Development & Environment
Supporting Energy Smart Communities
4.3 Council promotes and supports programs to increase community knowledge, skills and capacity to shift to renewable energy, energy efficiency and sustainable transport options.
4.3.1 Council promotes, and supports where resourcing is available, state or federal government programs for the deployment of renewable energy, energy efficiency and sustainable transport.
Short Term Development & Environment
Organisational Sustainability Coordinator
4.3.2 Council organises and hosts the annual Dubbo Sustainable City Expo and Science Festival or similar to showcase ways in which the Dubbo Region can live and work more sustainably and become energy smart.
Ongoing (Annually)
Development & Environment
Organisational Sustainability Coordinator
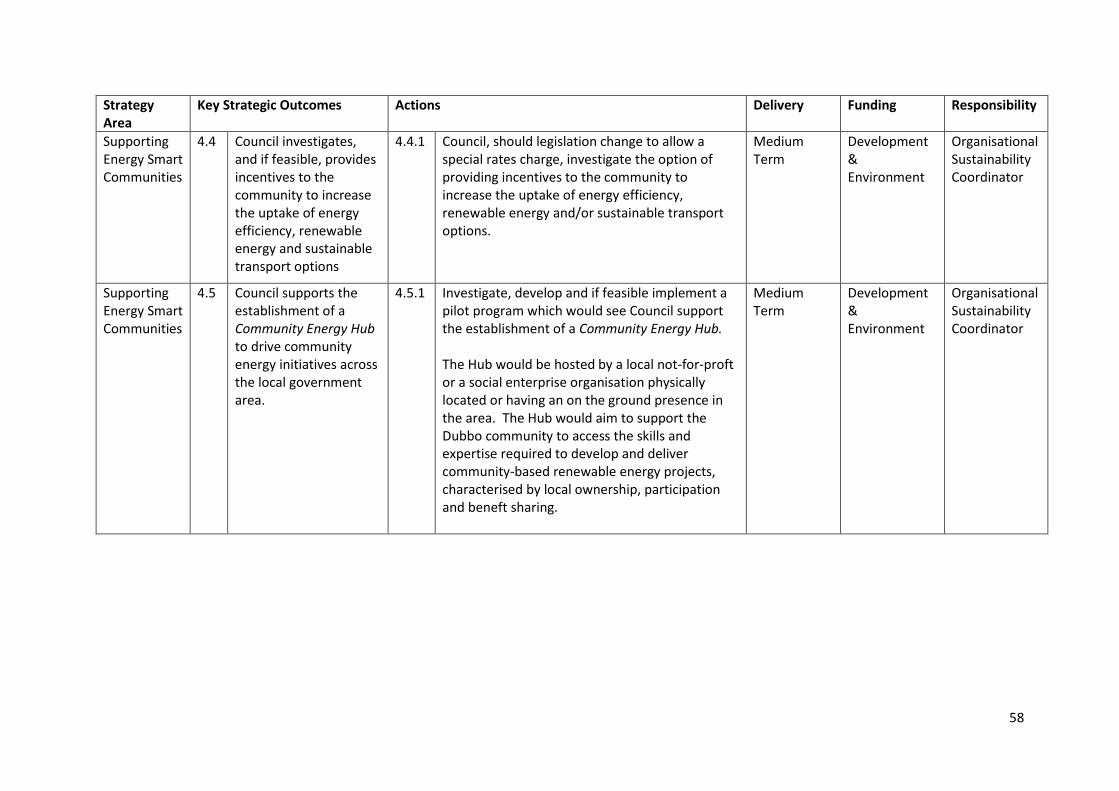
58
Strategy Area
Key Strategic Outcomes Actions Delivery Funding Responsibility
Supporting Energy Smart Communities
4.4 Council investigates, and if feasible, provides incentives to the community to increase the uptake of energy efficiency, renewable energy and sustainable transport options
4.4.1 Council, should legislation change to allow a special rates charge, investigate the option of providing incentives to the community to increase the uptake of energy efficiency, renewable energy and/or sustainable transport options.
Medium Term
Development & Environment
Organisational Sustainability Coordinator
Supporting Energy Smart Communities
4.5 Council supports the establishment of a Community Energy Hub to drive community energy initiatives across the local government area.
4.5.1 Investigate, develop and if feasible implement a pilot program which would see Council support the establishment of a Community Energy Hub. The Hub would be hosted by a local not-for-proft or a social enterprise organisation physically located or having an on the ground presence in the area. The Hub would aim to support the Dubbo community to access the skills and expertise required to develop and deliver community-based renewable energy projects, characterised by local ownership, participation and beneft sharing.
Medium Term
Development & Environment
Organisational Sustainability Coordinator

59
5 Monitoring, Reporting and Review
The effect of energy efficiency and renewable energy measures undertaken as a result of the
Strategy and Implementation Plan will be monitored though Council’s energy monitoring service –
e21.
Key strategic goals, outcomes and actions from the Strategy and Implementation Plan must be
incorporated by relevant Directors and Managers into Council’s four year Delivery and one year
Operational Plans.
In this light any progress achieved against the Strategy and Implementation Plan will be reported on
by the Responsible Council Officer through the standard Council Integrated Planning and Reporting
process:
Progress Reports - Every Six Months
Annual Report - Annually (November)
There will be an operational review of the Strategy and Implementation Plan by December 2021 to
ensure the key strategic goals, outcomes and actions are consistent with Council’s revised
Community Strategic Plan.
A detailed strategic review of the Strategy and Implementation Plan will then be completed by
December 2024.