energy storage: yes, a game changer · energy storage: yes, a game changer jason burwen ... •...
TRANSCRIPT

Energy Storage:Yes, A Game Changer
Jason Burwen
NCSL Capitol ForumDecember 6, 2016

Energy storage is the technology of the future
Currently deployed and providing services

Storage is in all parts of the grid
And in microgrids

Projects operating across the U.S.
Several MW-scale projects have 8+ years of operations
Source: DOE Database
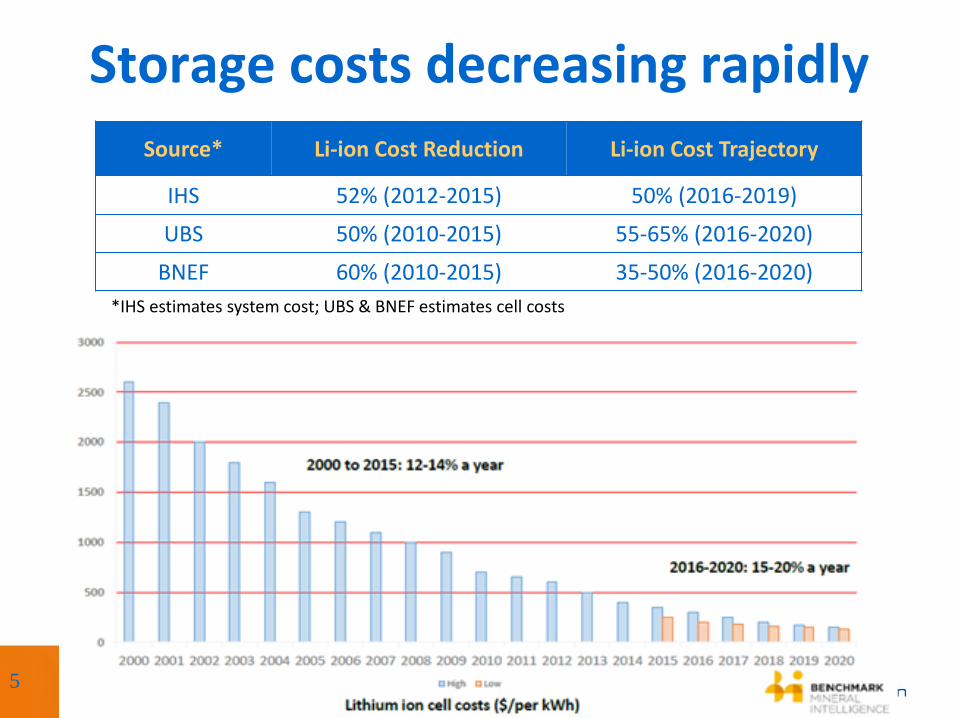
Storage costs decreasing rapidly
5
Source* Li-ion Cost Reduction Li-ion Cost Trajectory
IHS 52% (2012-2015) 50% (2016-2019)
UBS 50% (2010-2015) 55-65% (2016-2020)
BNEF 60% (2010-2015) 35-50% (2016-2020)
*IHS estimates system cost; UBS & BNEF estimates cell costs

Installed Cost of Capacity100 MW / 4-hour Lithium-Ion Battery Storage
Sources: ESA Calculation from IHS, GTM, BNEF, Navigant
$-
$200
$400
$600
$800
$1,000
$1,200
$1,400
$1,600
$1,800
$2,000
2016 2017 2018 2019 2020
Inst
alle
d C
ost
($
/kW
)
Lower estimate from EPRI 2016Energy Storage Cost Summary for Utility Planning: Executive Summary. EPRI, Palo Alto, CA: 2016. 3002008877.
Typical Gas CT
“Post-2020, there may never be another peaker built in the United States -- very likely you'll be just building energy storage instead.” -- Jim Robo, CEO, NextEra

…and distributed storage is expected to rise from 15% to over 50% of annual installations by 2021.
Energy storage: not if, but whenIN THE U.S. annual installation in 2021 expected to be over 2,100 MW--
9x installation in 2015….
Source: ESA/GTM

Source: ESA/GTM

Compressed Air
Molten Salt
Customer Thermal
Main types of energy storage
1 kW 10 kW 100 kW 1 MW 10 MW 100 MW 1 GW
1 S
ec1
Min
1 H
r4
Hrs
12
+ H
rs
Power
Du
rati
on
Batteries(Li+, Pb, NaS, Ni)
Grid Stabilization
Network Capacity
Bulk Supply
Flow Batteries(V, Zn, Na+)
Flywheels
Pumped Hydro

Storage offers many applications
Source: EPRI/Sandia National Laboratory
Bulk Services
• Bulk Energy Services
• Electric Time Shift
• Electric Supply Capacity
• Curtailment avoidance
• Ancillary Services
• Frequency Response
• Ramping / Load Following
• Regulation
• Operating Reserves
• Voltage Support
• Black Start
Network Services
• Transmission Services
• Upgrade Deferral
• Congestion Relief
• Distribution Services
• Upgrade Deferral
• Voltage Support
End User Services
• Energy Management Services
• Power Quality
• Power Reliability / Outage Mitigation
• Retail Energy Time Shift
• Demand Charge Management
…and can provide these services interchangeably over time, depending on location

Why is storage important?
• Saves households & businesses money – reduce spending on excess capacity to meet peak system & local demands, optimize use of grid assets lower rates
• Makes the grid more reliable & resilient – balancing supply & demand fluctuations; mitigating supply disruptions and outages; managing planning uncertainty
• Integrates more clean & distributed energy –compensating natural variability of renewables and making them “dispatchable;” increasing DER hosting capacity
• Creates businesses & jobs – new, growing industry offer investment and employment opportunities across the map
Storage optimizes use of the grid & enables system transformation

Peak capacity is expensive
SOURCE: MA DOER State of Charge
Top 1% of MA hours = 8% of MA cost ($680MM/yr)Top 10% of MA hours = 40% of cost ($3B/yr)

Peak capacity is expensive
SOURCE: MA DOER State of Charge
Top 1% of MA hours = 8% of MA cost ($680MM/yr)Top 10% of MA hours = 40% of cost ($3B/yr)

Taming peaks is keyFrom Massachusetts 2016 State of Charge
study on benefits of 1,700 MW of storage
Reduced peak capacity
T&D deferral DER integration
Energy price reduction
Ancillary service cost reduction
Generator cost reduction
$- $500 $1,000 $1,500 $2,000
50% of benefit is reducing system peak25% of benefit is reducing local peak (T&D deferral + DER integration)
SOURCE: MA DOER State of Charge

Example: peak capacity replacement
Peaking Generation
Load Following Generation
Baseload
0% 100%
Syst
em
Lo
ad
Percent of Annual Hours
Avg ~4% utilization (Source: GE)

Example: peak capacity replacement
Storage Charge
Storage Discharge
Load-Following Generation
Baseload
1 2 3 4 5 6 7 8 9 10 11 12 13 14 15 16 17 18 19 20 21 22 23 24
Syst
em
Lo
ad
Hour

Example: peak capacity replacement
Storage Charge
Storage Discharge
Load-Following Generation
Baseload
1 2 3 4 5 6 7 8 9 10 11 12 13 14 15 16 17 18 19 20 21 22 23 24
Syst
em
Lo
ad
Hour

Storage as system capacity
• SCE (California): 250 MW storage economically selected for local capacity requirements following unit retirement
• Preceded CA target
• APS (Arizona): 10% of peak capacity additions to come from storage through 2022
• KIUC (Hawaii): 13 MW / 4-hour storage for delivering solar on peak
19

Example: Distribution upgrade deferral
Energy storage enables deferring or avoiding substation and circuit upgrades by reducing local peak demands & increasing power quality/reliability
SubstationStorage
Behind-the-meter
Storage
AND/OR
Load
Hour

Storage as network capacity
• AEP (Texas): 1.5 MW / 2-hour storage is 15-25% cost of circuit upgrade for reliability enhancement
• RMP (Utah): 5 MWh storage is 33-66% cost of circuit upgrade for voltage support
• Boothbay (Maine): 3 MWh storage is 33% cost of transmission line
• HECO (Hawaii): 1 MW aggregated storage to avoid distribution system upgrades from high PV
• ConEd BQDM (New York): storage as part f DER procurement for peak load reduction at 50% of substation upgrade
21

Example: Multiple use storage
SOURCE: RMI
Flexibility to provide multiple services makes projects more economic

Multiple use storage
• Primary service: frequency regulation
• Secondary service: avoided circuit upgrades
• Tertiary service: peak load charge avoidance
• Integrated with municipal solar
23
“On a budget of $7 million per year, we are saving about $1 million per month, which allows us to avoid raising rates on our customers, who are also the citizens of our village.”
--Donald Harrod, Minster OH Administrator

Example: Infrastructure resilience
• Rapid energy storage deployment underway to mitigate Aliso Canyon gas shortage
• 65 MW to be built and placed in service <6 months from contract approval
• Projects will be able to offer other grid services into future

Key Findings from State of Charge (1)
“The biggest challenge to achieving more storage deployment in Massachusetts is the lack of clear market mechanisms to transfer some portion of the system benefits (e.g. cost savings to ratepayers) to the storage project developer.”
25

State Policy on Storage
26
Shared conversations

Policy has not caught up with tech
• Grid was not designed with storage as option
• Lack of market structure to value and compensate storage for its performance
• Hard to monetize benefits (T&D deferral)
• Unmonetized system benefits (fleet efficiency)
• Limits to multiple values (wholesale & retail/end-user, transmission & generation)
• Structural disincentives
• Utilities know how to build power plants and wires, why fix what ain’t broke?
• Regulators have not yet given clarity and certainty to utilities that cost-effective storage will be approved
27

4 Pillars for State Storage Policy
28
System Benefits of Storage

Recent State Regulatory & Legislative Energy Storage Activities(As of Q3 2016)
Regulatory Activity Legislative Activity Leg + Reg Activity
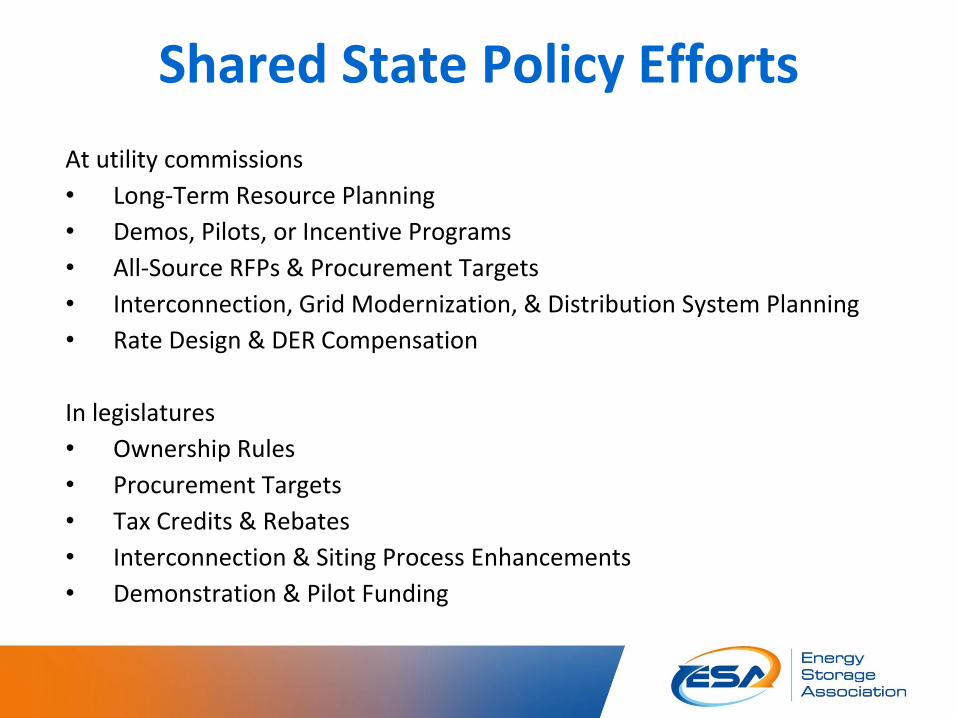
Shared State Policy Efforts
At utility commissions
• Long-Term Resource Planning
• Demos, Pilots, or Incentive Programs
• All-Source RFPs & Procurement Targets
• Interconnection, Grid Modernization, & Distribution System Planning
• Rate Design & DER Compensation
In legislatures
• Ownership Rules
• Procurement Targets
• Tax Credits & Rebates
• Interconnection & Siting Process Enhancements
• Demonstration & Pilot Funding

Procurement Bills Examples• MA H. 4568 (passed)
• Directed Dept of Energy Resources to determine if a procurement target is appropriate, and if so, set one for 2020
• Redefined storage to allow distribution utility procurement
• Recommended examining use of efficiency funds
• MD H.B. 787• Directed PSC to determine if a
procurement target is appropriate, and if so, set one for 2020 & 2025
• CA A.B. 2514 (passed)• Directed PUC to establish
procurement target for 2020
• Qualifies storage for resource
adequacy
• OR H.B. 2913 (passed)• Established procurement target of
minimum 5 MWh and max 1% peak capacity by 2020 for each utility
• Directed PUC to establish a valuation method for storage
• Directed utilities to propose procurement plans by 2018
• CT S.B. 1078 (passed)• Authorized energy storage as asset
class eligible for clean energy resource procurement
31
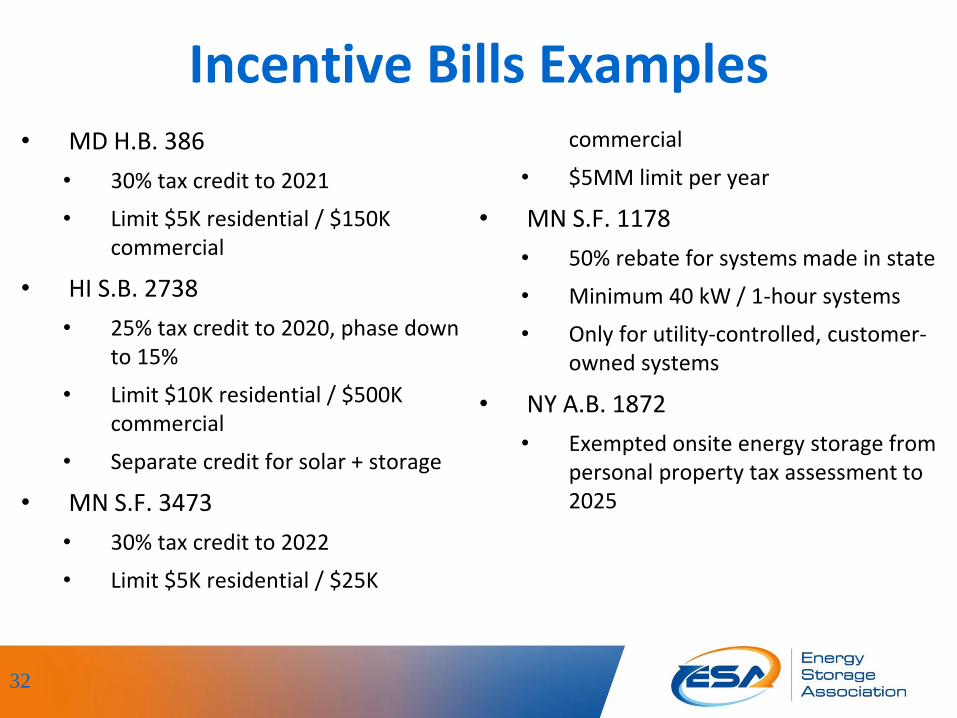
Incentive Bills Examples• MD H.B. 386
• 30% tax credit to 2021
• Limit $5K residential / $150K commercial
• HI S.B. 2738
• 25% tax credit to 2020, phase down to 15%
• Limit $10K residential / $500K commercial
• Separate credit for solar + storage
• MN S.F. 3473
• 30% tax credit to 2022
• Limit $5K residential / $25K
commercial
• $5MM limit per year
• MN S.F. 1178
• 50% rebate for systems made in state
• Minimum 40 kW / 1-hour systems
• Only for utility-controlled, customer-owned systems
• NY A.B. 1872
• Exempted onsite energy storage from personal property tax assessment to 2025
32

Other Bills Examples• CA A.B. 2868 (passed)
• Directs CA utilities to investigate up to 500 MW of additional distributed storage, focused on low-income residential and C&I customers
• Authorizes utilities to own behind-the-meter storage, not impede competitive provision
• CA A.B. 33 (passed)• Removed minimum size limits for
pumped hydro eligibility for storage target
• Ordered a study of bulk storage
• CA A.B. 2861 (passed)• Established a PUC technical panel
to arbitrate interconnection disputes
• CT S.B. 1502 (passed)• Directs distribution utilities to
propose storage demonstration projects, subject to approval
• CT S.B. 272 (passed)• Makes storage eligible asset for
microgrid grants & loans for resiliency
• WA H.B. 1115 (passed)• Authorized $13MM for
demonstration projects including storage
33

Other Bill Concept Examples
• Signals of Value• Establishment of time-
varying rates
• Clean Peak Standard
• All-source procurement• Pilot all-source RFPs for
distribution capacity/peak load reduction
• Include in all planning• Direct utilities to
include in resource planning
• Enable grid access• Facilitate
interconnection
• Clarify ownership ability
34


Parking Lot

EPRI: Installed Costs 2017
Energy Storage Cost Summary for Utility Planning: Executive Summary. EPRI, Palo Alto, CA: 2016. 3002008877.
37

Energy storage: not if, but when (2)
Source: McKinsey
• 58% of profitable buildings provide 71% of demand
• Average optimal battery size of 31 MWh per profitable building
Profitability for non-residential customers in cities already
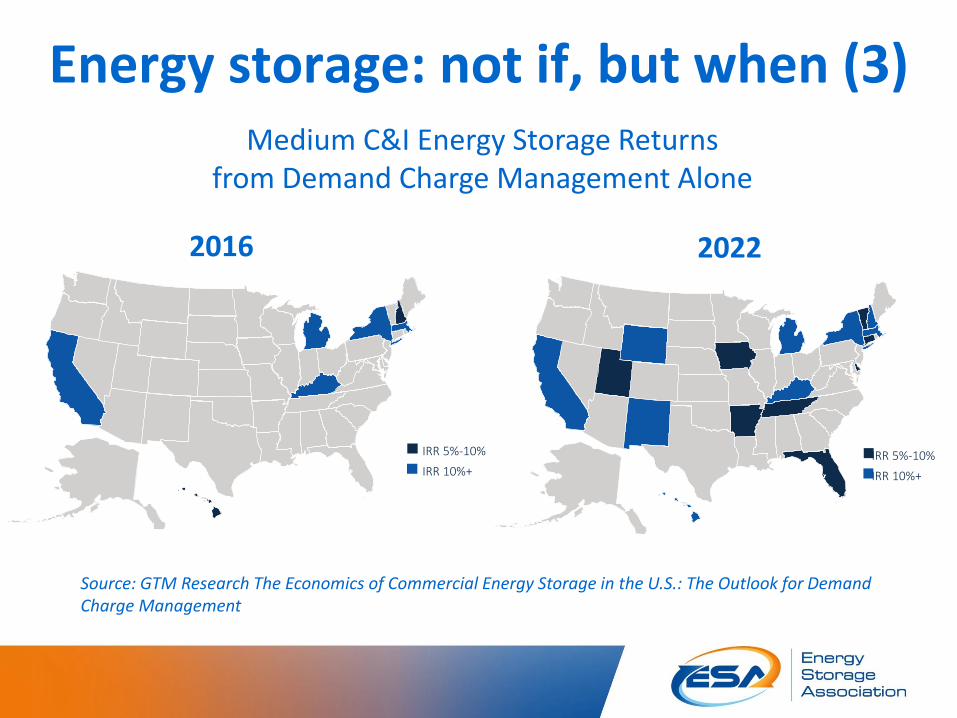
Energy storage: not if, but when (3)
IRR 5%-10%
IRR 10%+IRR 5%-10%
IRR 10%+
Medium C&I Energy Storage Returnsfrom Demand Charge Management Alone
Source: GTM Research The Economics of Commercial Energy Storage in the U.S.: The Outlook for Demand Charge Management
2016 2022
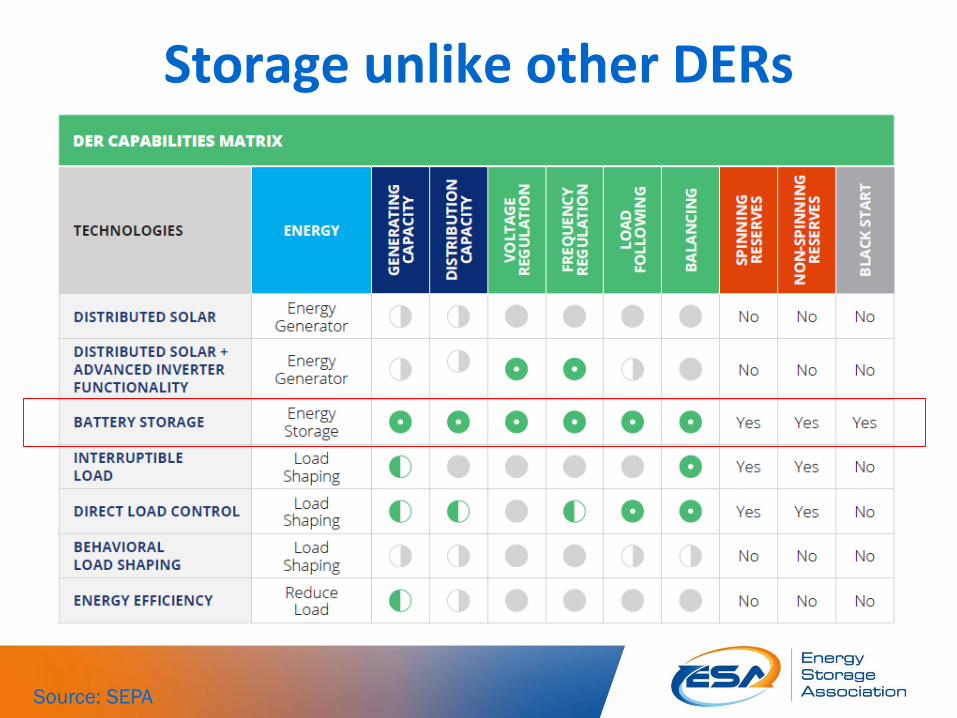
Storage unlike other DERs
Source: SEPA

Key is unlocking value
SOURCE: RMI
BTM storage capable of multiple services with value exceeding today’s unit costs

Storage opens path to more DERs
• Increases DER hosting capacity
• And increases value of paired DR, DG
• More efficient grid utilization
• Defer substation and feeder upgrades
• Increase circuit reliability & power quality
• Meet system capacity needs
42

Highlights of Recent State Activities• CA
• Re-orientation of Self-Generation Incentive Program (SGIP) to storage
• Bills: doubling SGIP funds; expanding utility procurement; streamlining interconnection
• Aliso Canyon procurements on 6 month timeline
• NY:• BQDM procurements of storage for
peak load reduction
• First municipal storage target: NYC 100 MWh by 2020
• AZ• First utility storage procurements
• Opened docket discussing storage role in RPS
• MA: Bill authorizing energy storage procurement target
• WA: Opened docket on storage in IRPs
• OR: Draft guidelines for storage procurement proposals
• CT: Utility planning standards for storage in distribution grid
• TX: First storage application for cost recovery as distribution
• HI: Pilot residential TOU with $0.10-$0.36 midday to on-peak spread
• MD: Distribution transformation proceeding, with valuation of storage
• NY/MA/HI: Solar + storage compensation
43

Wholesale Markets
• PJM leading market (270 MW)• Innovative market for
fast-responding Frequency Regulation
• CAISO, NYISO, & ISO-NE developing markets with some storage
• ERCOT, MISO, & SPP all considering new rules to enable storage

Relevant FERC Orders to Date• Order 890 – participation of non-generator resources in energy &
ancillary services markets
• Order 719 – comparable treatment of demand response in all market products
• Order 745 – compensation of demand response in wholesale markets
• Order 755 – pay for performance (speed, precision) in frequency regulation
• Order 784 – allows 3rd party provision of ancillary services
• Order 819 – frequency response bilateral markets
• Order 825 – 5 minute settlements & shortage pricing
• Underway now:• AD16-20 on market participation of storage
• RM16-12 on storage interconnection
• RM16-6 on compensating primary frequency response
• AD16-25 on multiple-use storage

PJM Regulation Performance
• Two control signals: RegA and RegD

PJM Regulation Performance
• RegD performance allows 30% lower regulating reserve requirement for same grid stability
• RegD is thus paid more for speed/precision (“pay-for-performance”)
• RegA asset clears market
• RegD resources paid as multiplier of RegA assets, using a ratio based on effective MW value (as much as 2.9x RegA)

PJM

ERCOT Fast Frequency Response

CAISO Avoided Starts
From NREL (2015) Operational Benefits of Meeting California’s Energy Storage Targets

ISO-NE Capacity
In 2015, more than 50% of peaker starts were for 3 hours or less, relative to nameplate
Analysis of Velocity Suite/EPA Carbon Emissions Monitoring System data on all coal- and gas-fired generation units in ISO-NE with annual net capacity factor less than or equal to 10% over the period January 1, 2015 – December 31, 2015.

ISO-NE Capacity (2)

Different asset capabilities• Presumptions of conventional assets
• Slow ramp rates long intervals & no market for fast service
• Start-up/shut-down costs uplift payments
• Fuel costs marginal unit cost dispatch
• Inertia governor control
• Single function modeled only as supply or load & only generation or transmission service
• Battery storage has different capabilities• Fast/instantaneous ramp shorter market intervals & markets for fast
services
• No start/stop cost prices for flexibility
• No fuel costs system value dispatch
• Inverter-based no governor requirement
• Interchangeably supply or demand model as “negative generation,” not load & interchangeable generation and transmission service

Keys for storage market design (1)• Participation – clarifying tariffs & qualification so
storage can engage in Energy, Ancillary Services, and Capacity
• Pay-for-performance – compensating the speed and precision of storage to allow more efficient grid operations
• Capacity – enabling energy-limited assets to effectively provide capacity value
• Price formation – create products to value and compensate unpriced grid services• Ramping, frequency response, avoided start/stop,
“positive” DR, VLR, etc
• Wholesale treatment – ensuring wholesale rates for wholesale services

Keys for storage market design (2)
• Multiple use – enabling storage to provide both transmission/reliability service and generator services
• Distributed resources – enabling behind-the-meter storage to participate in wholesale markets
• Interconnection – study of storage as highly controllable resource unlike generation/load
• Transmission planning – storage considered as part of infrastructure options