energy savings for cellular network with evaluation of impact on
TRANSCRIPT

1
Energy Savings for Cellular Network withEvaluation of Impact on Data Traffic Performance
Katerina Dufkova∗, Milan Bjelica‡, Byongkwon Moon†, Lukas Kencl∗, Jean-Yves Le Boudec†∗ R&D Centre for Mobile Applications (RDC), Czech Technical University in Prague
Technicka 2, 166 27 Prague 6, Czech Republic† Ecole Polytechnique Federale de Lausanne
EPFL, CH-1015 Lausanne, Switzerland‡ Faculty of Electrical Engineering (ETF), University of Belgrade
Bulevar kralja Aleksandra 73, 11120 Belgrade, Serbia
Abstract—We present a concrete methodology for saving en-ergy in future and contemporary cellular networks. It is based onre-arranging the user-cell association so as to allow shutting downunder-utilized parts of the network. We consider a hypotheticalstatic case where we have complete knowledge of stationaryuser locations and thus the results represent an upper bound ofpotential energy savings. We formulate the problem as a binaryinteger programming problem, thus it is NP-hard, and we presenta heuristic approximation method. We simulate the methodologyon an example real cellular network topology with traffic-and user distribution generated according to recently measuredpatterns. Further, we evaluate the energy savings, using realisticenergy profiles, and the impact on the user-perceived networkperformance, represented by delay and throughput, at varioustimes of day. The general findings conclude that up to 50%energy may be saved in less busy periods, while the performanceeffects remain limited. We conclude that practical, real-time user-cell re-allocation methodology, taking into account user mobilitypredictions, may thus be feasible and bring significant energysavings at acceptable performance impact.
Index Terms—energy efficiency, cellular network, optimization
I. INTRODUCTION
The energy consumption of telecommunication networksis not negligible, and the mobile communication networksalone contribute to a large fraction of it. Recent studies revealthat information and communication technology (ICT) systemscause 2% of global CO2 emissions, which is equivalent tothe emissions produced by international air traffic [1]. ICT isresponsible for up to 10% of the world energy consumption[2], with telecommunication networks being one of the mainconsumers. The mobile communication networks alone con-sume approximately 60 billion kWh per year [3].
In the perspective of energy sober economy, it is desirablethat the mobile communication sector reduces its energy con-sumption. Indeed, the fixed infrastructure of mobile telecom-munication networks was not designed with the primary goalof saving its energy cost; there are many indications thatsignificant gains are possible by optimizing network design,operation and traffic management.
Both the network operators and the users should be inter-ested in increasing their energy efficiency. Besides their corpo-rate responsibility regarding the environmental protection, theoperators are also strongly motivated to lower their operational
expenses. It is claimed that mobile network operators inGermany alone spend more than 200 million EUR per yearfor their electricity bills [3]; at the same time, the electricityprices in EU continue to rise [4]. Further investigations showthat the radio network alone causes approximately 80% of totalcost, making it an outstanding candidate for savings.
In [5] we showed, based on tracked user data, that itwas essentially feasible to predict user to cell association incontemporary and future cellular communication networks. Inthis paper, we investigate how much energy can be savedif such a prediction is available, how to achieve such gains,and what may the impact be on data traffic performance. Tothis end, we first propose a method for adapting user to cellassociations to the actual traffic as closely as possible, thusmaking possible to shut down some transceivers. We formulatethe problem as a binary integer programming problem andpropose a heuristic, the greedy algorithm, to solve it. We testour proposal on a real network topology and show that savingsfrom 25% to up 50% can be achieved, depending on the timeof the day. Then we evaluate the impact on quality of serviceperceived by data traffic users. The reasons for dealing withthe data traffic only are: first, out of the SMS, voice anddata traffic, the data traffic can be seen as the worst casebecause it generates the highest amount of bits that need tobe transmitted and with more irregular patterns; second webelieve that the growth potential of data traffic is much higherthan the potential of the other types of traffic, and thus datatraffic will prevail in future networks. We leave for furtherstudy the impact on quality of service for traditional voicetraffic. Our results show that it is possible to formulate ouroptimization problem such that the impact on quality of servicefor data traffic is very small.
The goal of this paper is to get a first evaluation of howmuch can be saved with such a method, and whether qualityof service degradation is involved. Our results are based onoffline optimization, so they constitute an upper bound to whatcan be achieved in operational conditions.
The rest of the paper is organized as follows. In Section IIwe give the overview of the related work. Section III describesour network model and traffic assumptions. Section IV de-scribes our proposal in detail. Section V describes simulationresults and Section VI concludes the paper.
II. RELATED WORK
Energy optimization in wireless networks draws much ofthe research attention in the recent period. However, most ofthese researches heavily depend on the particular technologythat is being concerned. They typically exploit some protocolproperties and modify the timings or retransmissions, or forcethe terminal to go to the sleep/standby mode. Good examplescould be found in [6] for WiFi and in [7] for multi-hop adhoc networks. The proposed solutions are designed for non-real time and best effort applications, so it remains unclear ifthey could guarantee certain level of quality of service (QoS).
From the users’ viewpoint, the most important factor isprobably the limited battery life of their mobile terminals.It does not surprise that many authors therefore proposemethods for energy savings which are aimed at reducing theconsumption of the terminal. Once again, these force thestandby state, like in [8], combine the exploiting of someweb traffic statistical properties with switching the wirelessinterface off [9], or use a secondary air interface with lowerenergy consumption as signaling channel [10]. Our research,in the other hand, tends to be technologically independent andinfrastructure oriented in terms that we are concerned aboutthe savings in the BTS subsystem of a cellular network.
Restrepo et al. introduce the notion of energy profile, asthe dependence of the energy consumption in function ofthe traffic load (or traffic throughput) of a particular networkcomponent [11]. They propose several profiles which could de-scribe the behavior of both the existing and future devices. Weadopt the idea of “on-off” and linear profiles, while modifyingthe latter one to account for offset (i. e. traffic-independent)consumption. We find the justification to this approach in areport by Corliano and Hufschmid [12], who monitored theconsumption of some typical BTS configurations.
Louhi notices that the energy consumption of a cellularnetwork could be reduced not only by decreasing the energyconsumption of BTS sites, but by minimizing the number ofBTS sites as well [13]. Marsan et al. further elaborate thisidea in [14]. They investigate the possibility of reducing theenergy consumption of the access part of a cellular networkby switching some cells off during the periods in which theyare under-utilized because the traffic is low. They observesome idealized cell configurations, like hexagonal, crossroador Manhattan and use both trapezoidal traffic pattern andreal world traces, collected in wired network. Under theseassumptions, energy savings of 25–30% were possible toachieve. Chiaraviglio et al. apply the similar approach to wirednetworks in [15]. They propose a method to switch the networknodes and links off while still guaranteeing full connectivityand maximum link utilization. What is particularly interestingto us, they provide an Integer Linear Programming (ILP)formulation of the problem and show it to be NP-hard. Theythen propose several heuristics to solve this problem. In theiranother paper [16], the authors use the approximation ofsinusoidal traffic pattern.
Unlike these, we consider an existing network, with topol-ogy being far more complex than the simple hexagonal grid.Also, we do not use any of the approximations for the traffic
load, but apply the SURGE tool [17] to generate the web-liketraffic traces.
Fehske et al. investigate the possibility of lowering theenergy consumption of cellular networks by deployment ofsmall, low power base stations, alongside the conventionalsites [18]. Once again, they assume regular hexagonal grid ofmacro sites and assume that their power consumption virtuallydoes not depend on traffic load. While this approach mightbe regarded as a large-scale network optimization (i. e. withrespect to the deployment), we are more interested in run-timeor short-scale optimization.
III. NETWORK MODEL
To assess the energy-savings potential of the contemporarywireless networks and the trade-offs between energy efficiency,quality of service and other network parameters, a suitablenetwork model is crucial. In this section we describe a realisticnetwork model based on real network topology and userdistribution approximating live network traces. We introduce agraph-based approach to describe relations between users andnetwork topology. Finally, we model traffic generated by theusers using the SURGE tool [17].
A. Network topology
We perform experiments on a model of real world cellularnetwork topology, which is part of a live GSM network. Wechose a rectangular district of approximate size 2 100 km2,and selected all the base transceiver stations (BTS) and cellsin the district to be part of the experiments. Let L ⊂ R2
denote a set of sites (BTS locations1) inside the chosen district,and let C ⊂ N be a set of identifiers of all cells hosted bythose sites. For given cell c ∈ C we call cell area sc ⊂ R2
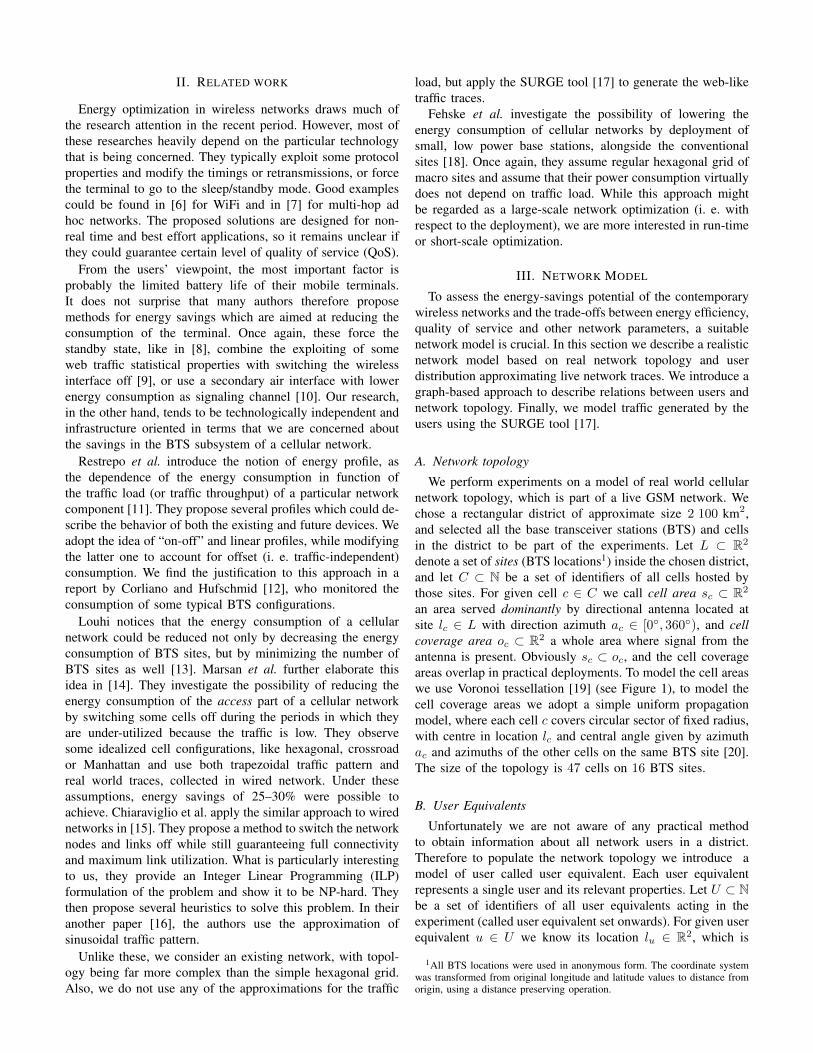
an area served dominantly by directional antenna located atsite lc ∈ L with direction azimuth ac ∈ [0◦, 360◦), and cellcoverage area oc ⊂ R2 a whole area where signal from theantenna is present. Obviously sc ⊂ oc, and the cell coverageareas overlap in practical deployments. To model the cell areaswe use Voronoi tessellation [19] (see Figure 1), to model thecell coverage areas we adopt a simple uniform propagationmodel, where each cell c covers circular sector of fixed radius,with centre in location lc and central angle given by azimuthac and azimuths of the other cells on the same BTS site [20].The size of the topology is 47 cells on 16 BTS sites.
B. User Equivalents
Unfortunately we are not aware of any practical methodto obtain information about all network users in a district.Therefore to populate the network topology we introduce amodel of user called user equivalent. Each user equivalentrepresents a single user and its relevant properties. Let U ⊂ Nbe a set of identifiers of all user equivalents acting in theexperiment (called user equivalent set onwards). For given userequivalent u ∈ U we know its location lu ∈ R2, which is
1All BTS locations were used in anonymous form. The coordinate systemwas transformed from original longitude and latitude values to distance fromorigin, using a distance preserving operation.

Fig. 1. Visualization of the network topology used in the experiments.
Fig. 2. Visualization of user equivalent sets used in the experiments.
invariant during the experiment as we decided to deal withthe stationary case first.
To approximate the real distribution of users in the network,we base the distribution of user equivalents to cells on tracesobtained by active tracking of selected users’ cell associations,using the platform from [21]. The platform allows to period-ically poll and store cell association of a set of users in areal-time manner and without user cooperation. The problemwith the traces is that they can never contain data about allusers subscribed to the network. We address this by usingthe absolute amount of users in the cells as an approximationof spatial multinomial probability distribution from which wedraw a sample of desired size. Inside each cell area, theuser equivalents are placed randomly. Statistics of used userequivalent sets are summarized in Table I, some of the setsare visualized in Figure 2.
C. User-Cell Affinity Graph
We model the affinity between user equivalents and cellsby means of bipartite graphs. Let G(U,C) be the bipartite,
TABLE IUSER EQUIVALENT SETS STATISTICS, FOR DIFFERENT TIMES AND SIZES.
THE NAMING CONVENTION IS UTYPETIME (SIZE).
Time Real Approximation of real distribution
6:00–8:00 UR6 (128) UA
6 (470) UA6 (9400)
13:00–15:00 UR13(122) UA
13(470) UA13(9400)
21:00–23:00 UR21(119) UA
21(470) UA21(9400)
Fig. 3. Example of an affinity graph. User equivalents are in the upper partof the graph, cells in the bottom part. Edges connect user equivalents and cellsthat see each other. Physical location of vertices is ignored for simplicity.
undirected graph with vertex set V = {C ∪ U} and such thatthere is an edge between u ∈ U and c ∈ C if and only if userequivalents u sees the signal from cell c (i.e. lu ∈ oc).
We call this type of graph the affinity graph because itdescribes affinity (and thus possible associations) between userequivalents and cells. Figure 3 gives an example of smallsize, Figure 4 visualizes the affinity graph for one of the userequivalent sets used in experiments.
The same type of graph can be used to model the associ-ation of user equivalent to one of the cells it sees. We callassociation graph a subgraph of the affinity graph such thateach vertex u ∈ U has degree exactly one. This correspondsto the constraint that one user equivalent is always associatedto exactly one cell.
D. Traffic
As discussed in the introduction, we deal here with datatraffic only. To obtain a realistic data traffic for each of the user
Fig. 4. Visualization of affinity graph G(UA6 (470), C). The graph shows all
possible association of 470 user equivalents to 47 cells, given the assumptionthat all cell radii are 8 km.

equivalents we use the SURGE tool [17] capable of generatingrepresentative Web workloads. We leave for further studies amore complex traffic generation taking into account both dataand voice traffic, and the fact that data traffic generated bymobile phone users differs from that generated by computerusers (and SURGE), e.g. by the mean size of downloaded files.
Generated user requests are fed to an uplink queue withservice rate RUP = 2 Mbps, experience the emulated net-work delay, and requested data are delivered to user equiva-lents through downlink queue with service rate RDOWN =14.4 Mbps (service rates based on the HSDPA technology).All user equivalents in one cell share a single uplink anddownlink processor sharing queue. Network delay is modeledas a fixed one of 100 ms, and we measure the overall delaybetween the uplink and downlink processes, which is the delayusers perceive. With these values, the load offered by a singleuser equivalent is order of 1% of the uplink. The values weuse are based on today’s technology, and make a consistentset. However, our method is independent of these values; inthe future we expect that uplink and downlink bit rates willincrease dramatically, as will probably the traffic per user.
Not all user equivalents present in the network are going tobe active, reflecting the fraction of mobile operator customerswho do not produce any traffic. In our model, we introducethe network activity level AN to denote the fraction of theremaining potentially active user equivalents.
To account for the fact that the traffic load varies heavilyduring the day, we then introduce the Time-of-Day (ToD)activity level, AToD = P (potentially active user is activewithin the time interval ToD). AToD thus changes over theday to reflect daily network traffic patterns. Such daily activitylevels can be derived from aggregate network measurements(see Table II).
Next, we introduce parameter K dependent on the trafficactivity levels, which denotes the maximum number of userequivalents allowed to associate to a single cell. To derive thevalue of K, we establish a threshold Kactive, the maximumnumber of simultaneously active user equivalents that canbe associated to a single cell. Kactive is limited by the celltraffic capacity, dependent on network technology used. Then,K must satisfy, for a particular Time-of-Day interval, theequation K · AToD · AN = Kactive, to respect the cell trafficcapacity limit.
E. Energy Profiles
By the term energy profile we consider the dependency oftotal power P (in watts) consumed by switched on BTS, onits current traffic load A (in erlangs),
P = f(A). (1)
A switched off BTS is considered to consume 0 watts.One might argue that it is more correct to consider the
consumed energy (in watthours) instead of power, but sincewe are concerned with optimum saving strategy, this will notinfluence our findings.
Let us note that the term total power includes not only theradiated power, but also the power consumed for the proper
operation of all other devices and equipment usually storedat the BTS site, e. g. power supply, signal processing, linetransmitting, remote monitoring and cooling equipment.
For our research we use two energy profiles, constant andlinear. Constant profile assumes that the power consumptionof BTS is virtually independent on its traffic load, i. e.
P (A) = P0c = const. (2)
Based on the typical parameters for the existing three-sectorsBTS sites, we adopt the value P0c = 800 W. The constantmodel may apply well to the existing technology, with trans-mitting equipment using class A power amplifiers.
Linear profile assumes that the consumed power increaseslinearly with the traffic load,
P (A) = aA+ P0. (3)
From the measurement results reported by Corliano and Huf-schmid in [12] we adopt the following parameter values:a = 3.5 W/E, P0 = 750 W. We expect the linear model tobe suitable for the future technologies, with dominant datatraffic and exploiting digital power amplifiers. As for thevarying distance of the mobile unit from the BTS, in thiswork we choose not to consider it as influencing the powerconsumption, based on the low traffic influence on the totalBTS power budget in general.
IV. OPTIMIZATION OF USER ASSOCIATIONS
We define the problem of optimal association of userequivalents to cells as follows. Let GA(U,C) be the affinitygraph as defined above. Let K be the maximum number ofuser equivalents allowed to associate to a single cell. The valueof K depends on the technology and on the traffic generatedby users (see Section III-D).
We seek to find a subgraph X of GA(U,C) which satisfiesthe following constraints:• ∀u ∈ U : degree(u) = 1• ∀c ∈ C : degree(c) 6 K
The first item expresses that X is a valid association graph(one user is associated to exactly one cell), while the seconditem is a constraint that we introduce.
Among those graphs, we seek to find a solution graph Xthat maximizes the number of empty cells that can be switchedoff, i.e. we want to maximize f(X) with
f(X) = |{c cell of X|degree(c) = 0}|. (4)
A. Formulation as Integer Linear Program
We solve this problem by transforming it into an instance ofbinary integer programming. The main difficulty here is withthe objective function, as the above problem formulation leadsto maximization of the incommodious function f(X).
To be able to use a more convenient objective function, wefirst turn the original graph GA(U,C) into a weighted graphG′(U,C) by assigning weight 1 to all edges in GA(U,C). Sec-ond, we add a “special user equivalent” us, that is connectedto each cell c ∈ C with an edge of weight K (see Figure 5).

Fig. 5. Example of an affinity graph extended with the “special userequivalent” us.
Our problem now becomes to find a subgraph X ofG′(U, V ) which satisfies the constraints(a) ∀u ∈ U : degree(u) = 1
This remains unchanged, with the exception that the userequivalent us is allowed to associate to any number ofcells at the same time.
(b) ∀c ∈ C :∑
e weight(e) 6 KThis means that on any cell can be associated either theuser equivalent us, or up to K regular user equivalents.
and which maximizes
g(X) =∑e
weight(e). (5)
We claim that this is equivalent to our original problem.Indeed, for any subgraph X of G′(U,C):
g(X) =∑
e=(u,c), u∈U
weight(e) +∑
e=(us,c)
weight(e) =
=∑
e=(u,c), u∈U
1 +∑
e=(us,c)
K. (6)
Should X satisfy the condition (a), then∑
e=(u,c), u∈U 1 =|U | and thus the problem boils down to maximization of∑
e=(us,c)K which corresponds to the number of cells associ-ated to the user equivalent us. Obviously, the cells associatedto the user equivalent us in graph G′(U,C) are exactly theempty cells in the graph GA(U,C).
Finally, the formulation of binary integer programmingproblem is as follows. Let E be the set of edges of themodified affinity graph G′(U,C). Let x = [xe] ∈ {0, 1}be a yet unknown vector of length |E|, with xe = 1 ifand only if the edge e is present in the solution graph X .Let w = [we] ∈ {1,K} be the vector of length |E| withwe = weight(e).
The problem can be defined as:
maxwT · x, constraint to
{A · x 6 b
A′ · x = b′,
where A [resp. A′] is a |C|×|E| matrix [resp. |U |×|E|] with
Ac,e =
{we, if e = (u, c) for some u ∈ U0, otherwise
,
A′u,e =
{1, if e = (u, c) for some c ∈ C0, otherwise
,
b = [K, . . . ,K]T, b′ = [1, . . . , 1]
T.
The constraint A·x 6 b enforces condition (b), while A′·x = b′
enforces condition (a).
Binary integer programming is NP-hard (its decision versionwas one of Karp’s 21 NP-complete problems [22]). Formedium size user sets we use lpsolve [23], a state of the artC-software for solving integer linear programming problems.For problems of large size (several thousands of users) thecomputing time of lpsolve is prohibitive. This is why wepropose a heuristic, the greedy algorithm, as explained next.
B. The Greedy Algorithm
Let a : U → C be a function that for each user equivalentu ∈ U returns the cell where the user equivalent is associatedat the moment. Let S : C → P (U) be a function that for eachcell c ∈ C returns the set of user equivalents associated to thecell c. The algorithm can be described as follows:
1) Start with the original association graph.2) While the value of objective function (as defined above)
improves, repeat:a) Randomly choose a user um ∈ U . The probability
of choosing each user u is inversely proportional tothe total number of user equivalents, that are in thesame cell as the user u. Thus
P (u) =1
|S(a(u))|. (7)
b) Change the association of the user um to someother cell c that will have at least the same orhigher number of users associated after the change.This condition ensures that the objective functionvalue over time is a non-decreasing function. Wechoose the new association of the user randomly withuniform distribution from the set
I = {c|E(um, c) = 1 ∧ |S(c)| > S(a(um))− 1}. (8)
3) Output the final graph and the value of objective function.The complexity of the greedy algorithm is polynomial in
|U | and |C|, times the complexity of functions a and S.
V. EXPERIMENTAL RESULTS
A. Simulation Setup
In this section we present results of the user allocation op-timization using the greedy algorithm, and provide discussionof the impact of the optimization on energy consumption andnetwork performance. The cell radii used are an estimate ofreal cell sizes, appropriate for the technology of the networkwhose topology we work with — GSM 900 MHz2. For othertechnologies, e.g. UMTS, cell sizes differ.
We show results for three user equivalent sets (UA6 , UA
13,UA21), each set contains 9400 user equivalents and represents
different time of the day (morning 6:00–8:00, afternoon 13:00–15:00, evening 21:00–23:00) with different traffic intensity.For each of the user equivalent sets, we generate traffic usingthe procedure described in section III-D, using activity levelsfor the appropriate time of day.
2 For GSM, maximum cell radius is 35 km. Typical cell radius can beobtained e.g. using Okumura-Hata path loss model, with typical parametersbeing BTS radiated power ∈ {10, 20, 40, 80} watts, received signal levelthreshold −100 dBm, antenna height 20 m, antenna gain 10 dB for BTS,resp. 3 dB for mobile unit, suburban environment.

TABLE IITIME-OF DAY ACTIVITY LEVELS, VODAFONE UK.
Time AToD (%)6:00–8:00 25
13:00–15:00 6021:00–23:00 100
In the absence of reliable operator data, we have exper-imented in our simulations with network activity level AN
set to the values ranging from 50% across 25% and 10% to2%. For the results presented in this section, AN = 0.50 isconsidered, to represent the least favorable alternative, i.e. thelargest fraction of users being active, allowing for the lowestamount of re-allocations.
The ToD activity levels (AToD) used in the simulationsare derived from measurements of 3G smartphone usage per-formed recently in London [24], see Table II, and they reflectthe different relative levels of smartphone traffic as measuredin the network during selected time intervals (morning 6:00–8:00, afternoon 13:00–15:00, evening 21:00–23:00).
We alternate Kactive, the maximum number of simultane-ously active user equivalents that can be associated to asingle cell, among values typical for GPRS technology i.e.Kactive ∈ {60, 120, 180, 240}, with 240 being the default value.
Before generating the traces using the traffic generator, wefirst decide about each user equivalent if it is active or not,and then generate traces just for the active ones.
To compare the optimization results we use following mea-sures: number of empty cells, power consumption (in watts),delay (in milliseconds), throughput (in bits per second) andutilization (in percents).
B. Traffic Generator
In this subsection, we give the details of the traffic generatorused in our simulation. We generate the user traffic usingthe SURGE tool where each user is modeled as an ON-OFFsource. ON time is defined as the time interval from when auser initiates a request for a Web object to when she finishes toreceive this object from a Web server. This is then followedby OFF time. A Web object consists of N files, where Nfollows Pareto distribution with κ = 2 and α = 1.245. Thefile size S follows a mixture of lognormal distribution withµ = 7.63 (log of bytes) and σ = 1.001 and Pareto distributionwith κ = 10000 (bytes) and α = 1.2.
We wish to compute the offered load generated by singleuser if she were alone in a cell. This is a figure of meritto calibrate the optimization parameter K. We calculate theutilization ratio3 when there is only a single user in the cell.
For simplicity, we assume N and S are mutually indepen-dent, and there is only one user in the cell. Then, the averageduration of ON time, i.e., E[ON ] can be calculated as follows:
E[ON ] =E[N ]B
CUL+D +
E[N ]E[S]
CDL
3The utilization ratio is given by the ratio of the offered load to link capacity.Offered load is defined as the number of bytes per time unit generated by oneuser on the uplink (downlink, respectively), if the user were alone in the cell.
Fig. 7. Optimization results obtained using greedy algorithm approximation.User equivalent set UA
21 with 9400 users, Time-of-Day activity level AToD =100%, different network activity levels. On each graph, the x–axis is themaximum number of active users allowed to associate to a single cell, they–axis is the number of empty cells out of 47 total number of cells.
where B is request packet size in bytes, D is fixed networkdelay in seconds, and CUP and CDL uplink/downlink ca-pacity respectively in bytes per seconds. As expected, theseare nothing but uplink queuing delay, network delay, anddownlink queuing delay. The OFF intervals follow Paretodistribution with κ = 1 (seconds) and α = 1.4. Then, theoffered load is easily calculated by LoadUL = E[N ]B
E[ON ]+E[OFF ]
and LoadDL = E[N ]E[S]E[ON ]+E[OFF ] in the uplink and downlink
respectively. Finally, we can get the utilization ratio of theuplink (UUL) and downlink (UDL) as follows:
UUL =LoadUL
CUL, UDL =
LoadDL
CDL.
In our simulation setting, UUL = 0.0054 and UDL = 0.0092.But note that the SURGE model is a closed loop model, i.e.when a user undergoes a delay, her offered load decreases.
C. Optimized User AllocationFigure 6 visualizes on a graph the change in user allocation
before and after the optimization. Figure 7 summarizes theinfluence of the parameter values on the results. The resultsindicate that the method is able to find an association graphGO(U,C) with significantly higher number of empty cellsover the original association graph GA(U,C). Better resultscan be achieved for higher cell radii R and higher maximumnumber of active users allowed to associate to a singlecell Kactive. This is an expected outcome, as growing bothparameters gives the algorithm more freedom to choose finalassociation of the users. From now on, we use the parametercombination cell radius R = 10 km, maximum number ofactive users allowed to associate to a single cell Kactive = 240and network activity level AN = 50%.
D. Energy SavingsWe apply the energy profiles described in subsection III-E to
evaluate the energy savings achievable by user allocation opti-

Fig. 6. Visualization of optimization results on the user equivalent set UR6 (9400). Cell radius R = 10 km, maximum number of active users allowed to
associate to a single cell Kactive = 240. As can be seen, the number of empty cells rises from 0 to 24, as a consequence of the fact that some of the formerlyunder-utilized cells started to serve user equivalents from neighbouring cells. Left: Original user-cell association. Right: Optimized user-cell association.
Fig. 8. Energy savings summary — the impact of user allocation optimizationand cell switch-off on power consumption. On the x–axis is the time of day,for each time there are results for constant and linear energy profile, both forthe situations before and after the user allocation optimization. On the y–axisis the total network power consumption in watts.
mization and cell switch-off. Figure 8 summarizes the networkpower consumption both before and after the optimization.In all cases, BTS sectors corresponding to empty cells areconsidered switched off. As can be seen, for both constantand linear energy profile the potential energy savings are upto 50% for low traffic conditions (6:00–8:00), up to 40% formoderate traffic conditions (13:00–15:00) and up to 25% forpeak traffic conditions (21:00–23:00). Savings are caused bythe increased number of empty cells after the optimization.
E. Network Performance
Obviously, when some of the cells are switched off, themean number of user equivalents per cell increases whichcan negatively impact the quality of service. We assess thisimpact by measuring the delay and throughput perceivedby the user equivalents before and after the user allocationoptimization. The Figure 9 shows the measured delay, bothfor median and 95% quantile case. The graph shows that thedifference in median delay is insignificant for all cases, afterthe optimization the results are about 1 millisecond worse. The95% quantile of delay differs more, but still in an acceptableextent of roughly 20 milliseconds. In Figure 10 we show thedependence of the number of active users in a cell on the
Fig. 9. User perceived delay — the impact of user allocation optimization.On the x–axis is the time of the day, for each time there are two boxplots, theone on the left for the situation before user allocation optimization and the oneon the right for the situation after. On the y–axis is the delay in milliseconds.On a boxplot, the central thick line is the median, the box edges are the 25thand 75th percentiles, the whiskers mark data points not considered outliers,outliers plotted as dots. Left: Median delay of all requests of a user equivalent.Right: 95% quantile delay of all requests of a user equivalent.
delay users perceive, which justifies the usage of the numberof users in a cell as an optimization constraint.
Figure 11 shows the measured throughput, both for medianand 5% quantile case. The graph shows that the difference inmedian throughput before and after user allocation optimiza-tion is negligible. For the 5% quantile of throughput we see aslight degradation in order of hundreds of bits per second.
Fig. 10. User perceived delay (95% quantile) and its correlation with thenumber of active users in a cell.

Fig. 11. User perceived per object throughput — the impact of user allocationoptimization. On the x–axis is the time of the day, for each time there aretwo boxplots, the one on the left for the situation before user allocationoptimization and the one on the right for the situation after user allocationoptimization. On the y–axis is the throughput in bits per second. Left: Medianthroughput of all requests of a user equivalent. Right: 5% quantile throughputof all requests of a user equivalent.
TABLE IIIIMPACT OF USER ALLOCATION OPTIMIZATION ON FAIRNESS
Jain’s index (%)6:00–8:00 13:00–15:00 21:00–23:00
Before After Before After Before After
Delaymedian 99.99 99.96 99.97 99.97 99.97 99.9695% q. 99.31 97.59 98.11 97.88 97.98 97.82
Throughputmedian 92.29 92.39 92.59 92.62 92.20 92.28
5% q. 100.00 99.97 99.98 99.97 99.98 99.97
Finally, Table III summarizes the impact of user allocationoptimization on fairness (measured using the Jain’s fairnessindexes [25]) of delay and throughput distribution amongall user equivalents. It can be seen that the user associationoptimization influence on the fairness is negligible.
VI. CONCLUSION
We have presented an optimization method, which can beused to save energy in cellular networks. In this work we havetaken the network-centric view, aiming especially to reduce theenergy consumption of the operator.
We focused on data traffic, as we expect it to become thelion’s share in the future. We gave a concrete algorithm toperform user to cell association. In conjunction with priorfindings on the predictability of user location, it shows thefeasibility of our method, and also shows that the savingspotential are far from negligible, even at the busy hour.Furthermore, it shows that the elasticity of data traffic issuch that the impact on quality of service of packing moreusers into cells is very small over a large range of users percell; this could be interpreted as a further incentive to useour optimization method. The exact impact of the cell re-association on the user power budget remains to be evaluated.
Future research should focus on transforming these the-oretical findings into practical ones, by utilizing immediateuser-location and mobility patterns and developing real-timedistributed algorithms for solving the optimization problem.
REFERENCES
[1] BusinessGreen Blog. http://blog.businessgreen.com.[2] Global Action Plan. http://www.globalactionplan.org.uk.
[3] G. Fettweis and E. Zimmermann. ICT Energy consumption – Trends andchallenges. In The 11th International Symposium on Wireless PersonalMultimedia Communications (WPMC 2008), 2008.
[4] Eurostat web page. http://epp.eurostat.ec.europa.eu.[5] Katerina Dufkova, Jean-Yves Le Boudec, Lukas Kencl, and Milan
Bjelica. Predicting user-cell association in cellular networks fromtracked data. In MELT ’09: Mobile entity localization and tracking inGPS-less environments, pages 19–33, Berlin, Germany, 2009. Springer.
[6] G. Anastasi, M. Conti, E. Gregori, and A. Passarella. A performancestudy of power-saving polices for Wi-Fi hotspots. Computer Networks,45(3):295 – 318, 2004.
[7] G. Anastasi, M. Conti, and A. Passarella. Power management in mobileand pervasive computing systems. In A. Boukerche, editor, Algorithmsfor Wireless and Mobile Networks, chapter 24, pages 535–576. CRC-Hall Publisher, 2005.
[8] Eugene Shih, Paramvir Bahl, and Michael J. Sinclair. Wake on wireless:An event driven energy saving strategy for battery operated devices. InMobiCom ’02: Proceedings of the 8th annual international conferenceon Mobile computing and networking, pages 160–171, New York, NY,USA, 2002. ACM.
[9] G. Anastasi, M. Conti, E. Gregori, and A. Passarella. Performance com-parison of power saving strategies for mobile web access. PerformanceEvaluation, 53:273–294, 2003.
[10] G.P. Perrucci, F.H.P Fitzek, G. Sasso, and M. Katz. Energy savingstrategies for mobile devices using wake-up signals. In 4th InternationalMobile Multimedia Communications Conference (MobiMedia 2008),Oulu, Finland, July 2008. ICTS/ACM.
[11] J.C.C. Restrepo, C.G. Gruber, and C.M. Machuca. Energy profileaware routing. In IEEE International Conference on CommunicationsWorkshops (ICC Workshops 2009), pages 1–5, June 2009.
[12] A. Corliano and M. Hufschmid. Energieverbrauch der mobilen Kommu-nikation — Schlussbericht. Technical Report 280030, EidgenossischesDepartement fur Umwelt, Verkehr, Energie und Kommunikation, Bun-desamt fur Energie, Bern, Switzerland, 2008. In German.
[13] J.T. Louhi. Energy efficiency of modern cellular base stations. In 29thInternational Telecommunications Energy Conference INTELEC 2007,pages 475–476, 30 2007-Oct. 4 2007.
[14] M.A. Marsan, L. Chiaraviglio, D. Ciullo, and M. Meo. Optimal energysavings in cellular access networks. In IEEE International Conferenceon Communications Workshops (ICC Workshops 2009), pages 1–5, June2009.
[15] Luca Chiaraviglio, Marco Mellia, and Fabio Neri. Energy-aware net-works: Reducing power consumption by switching off network elements.In FEDERICA-Phosphorus tutorial and workshop (TNC2008), Brugges,BE, 2008.
[16] Luca Chiaraviglio, Marco Mellia, and Fabio Neri. Energy-aware UMTScore network design. In The 11th International Symposium on WirelessPersonal Multimedia Communications, Lapland, Finland, 2008.
[17] Paul Barford and Mark Crovella. Generating representative web work-loads for network and server performance evaluation. In SIGMETRICS’98/PERFORMANCE ’98: Proceedings of the 1998 ACM SIGMETRICSjoint international conference on Measurement and modeling of com-puter systems, pages 151–160, New York, NY, USA, 1998. ACM.
[18] A. J. Fehske, F. Richter, and G. Fettweis. Energy efficiency im-provements through micro sites in cellular mobile radio networks. InProceedings of the IEEE Global Communications Conference (GLOBE-COM’09), 2009.
[19] Franz Aurenhammer. Voronoi diagrams — a survey of a fundamentalgeometric data structure. ACM Comput. Surv., 23(3):345–405, 1991.
[20] Michal Ficek and Lukas Kencl. Improving roamer retention by exposingweak locations in GSM networks. In CoNEXT 2009: Proceedingsof the 5th ACM International Conference on emerging NetworkingEXperiments and Technologies, New York, NY, USA, Dec 2009. ACM.
[21] Katerina Dufkova, Michal Ficek, Lukas Kencl, Jakub Novak, Jan Kouba,Ivan Gregor, and Jirı Danihelka. Active GSM cell-id tracking: ”Wheredid you disappear?”. In MELT 2008: Proceedings of the first ACMinternational workshop on mobile entity localization and tracking inGPS-less environments, pages 7–12, New York, NY, USA, 2008. ACM.
[22] Richard M. Karp. Reducibility among combinatorial problems. R. E.Miller and J. W. Thatcher (editors), Complexity of Computer Computa-tions, New York: Plenum, pages 85–103, 1972.
[23] LPSOLVE project. http://lpsolve.sourceforge.net/.[24] Vodafone UK London Smartphone Traffic Measurements 2009. Private
communication.[25] Rajendra K. Jain, Dah-Ming W. Chiu, and William R. Hawe. A
quantitative measure of fairness and discrimination for resource allo-

cation in shared computer systems. Technical report, Digital EquipmentCorporation, September 1984.