energy price indices and discount factors for life-cycle
TRANSCRIPT
NISTIR 85-3273-17(Rev. 4/02)
Energy Price Indices and Discount Factorsfor Life-Cycle Cost Analysis - April 2002
Sieglinde K. FullerAnnual Supplement to Amy S. RushingNIST Handbook 135 andNBS Special Publication 709

NISTIR 85-3273-17
ENERGY PRICE INDICES AND DISCOUNT FACTORSFOR LIFE-CYCLE COST ANALYSISAnnual Supplement to NIST Handbook 135 and NBS Special Publication 709
April 1, 2002 to March 31, 2003
Data for the Federal Methodology for Life-Cycle Cost Analysis, Title 10, CFR, Part 436, Subpart A;and for the Energy Conservation Mandatory Performance Standards for NewFederal Residential Buildings, Title 10, CFR, Part 435
Sieglinde K. FullerAmy S. RushingOffice of Applied Economics
April 2002 Sponsored by:Building and Fire Research Laboratory The Federal Energy Management ProgramNational Institute of Standards and Technology U.S. Department of EnergyGaithersburg, Maryland 20899 Washington, DC 20585
U.S. Department of Commerce Donald L. Evans, Secretary Technology AdministrationPhilip J. Bond, Under Secretary for TechnologyNational Institute of Standards and TechnologyArden L. Bement, Jr., Director

iii
ABSTRACT
This is the April 2002 edition of energy price indices and discount factors for performing life-cyclecost analyses of energy and water conservation and renewable energy projects in federal facilities.It will be effective from April 1, 2002 to March 31, 2003. This publication supports the federal life-cycle costing methodology described in 10CFR436A and Circular A-94 by updating the energy priceprojections and discount factors that are described, explained, and illustrated in NIST Handbook 135(HB 135, Life-Cycle Costing Manual for the Federal Energy Management Program.) It supportsprivate-sector life-cycle cost analysis by updating the energy price indices that are described,explained, and illustrated in NBS Special Publication 709 (SP 709).
iv
PREFACE
This is the April 2002 Annual Supplement to NIST Handbook 135, Life-Cycle Costing Manual forthe Federal Energy Management Program. The annual supplement provides energy price indicesand discount factors for use with the Federal Energy Management Program's (FEMP) procedures forlife-cycle cost analysis, as established by the U.S. Department of Energy (DOE) in Subpart A of Part436 of Title 10 of the Code of Federal Regulations (10 CFR 436A), and amplified in NISTHandbook 135. These indices and factors are provided as an aid to implementing life-cycle costevaluations of potential energy and water conservation and renewable energy investments in existingand new federally owned and leased buildings.
The update of the Annual Supplement to Handbook 135 is released on April 1 of each year. Its priceindices and discount factors are calculated with the most recent energy price projections from DOE’sEnergy Information Administration (EIA) and the most recent discount rates from FEMP and theOffice of Management and Budget (OMB) Circular A-94. This issue of the Annual Supplement isintended for use from April 1, 2002 to March 31, 2003. The updated editions of the NIST BuildingLife-Cycle Cost (BLCC) programs are released at the same time as this Annual Supplement, foruse over the same time period. The software products are discussed below.
At the request of a number of users, a text file of the EIA energy price projections underlying thisAnnual Supplement has been made available by NIST. For information on obtaining this file(ENCOST02.txt) contact the authors by e-mail at [email protected] [email protected].
The life-cycle costing methods and procedures, as set forth in 10 CFR 436A, are to be followed byall federal agencies, unless specifically exempted, for evaluating the cost effectiveness of potentialenergy and water conservation and renewable energy investments in federally owned and leasedbuildings. For most other federal LCC analyses Circular A-94 provides the relevant guidelines.
As called for by legislation (Energy Policy and Conservation Act, P.L.94-163, 1975, 92 Stat 3206,42 USC 8252 et seq), the National Institute of Standards and Technology has provided technicalassistance to the U.S. Department of Energy in the development and implementation of life-cyclecosting methods and procedures. This is the second of a three-volume set, which together providethe methods, data, and computational tools for federal life-cycle cost analysis.
Included in the three-volume set for federal life-cycle cost analysis are the following:
(1) Life-Cycle Costing Manual for the Federal Energy Management Program, National Instituteof Standards and Technology, Handbook 135 (1995).
The manual is a guide to understanding life-cycle costing and related methods of economic analysisas they are applied to federal decisions, especially those subject to 10 CFR 436A rules. It describesthe required procedures and assumptions, defines and explains how to apply and interpret economicperformance measures, gives examples of federal decision problems and their solutions, explainshow to use the energy price indices and discount factors that are updated in the Annual Supplementand in the BLCC software, and provides worksheets and other computational aids and instructions

v
for calculating the required measures. The 1995 edition of Handbook 135 is a complete revision ofthe 1987 edition, with updated information on the FEMP LCC requirements of 10 CFR 436A.
(2) Energy Price Indices and Discount Factors for Life-Cycle Cost Analysis, AnnualSupplement to NIST Handbook 135 and NBS Special Publication 709, National Institute ofStandards and Technology, NISTIR 85-3273.
This report, which is updated annually, provides the current DOE and OMB discount rates, projectedenergy price indices, and corresponding discount factors needed to estimate the present value offuture energy and non-energy project-related costs. Request the latest edition when ordering. (Thisis the report that you are holding in your hands.)
(3) NIST "Building Life-Cycle Cost" (BLCC) Computer Programs, BLCC5 and BLCC4,National Institute of Standards and Technology. These programs use as default values thesame discount factors and energy price projections that underly the discount factor tables inthe Annual Supplement. Use versions BLCC 5.1-02 and BLCC 4.9-02 for the period fromApril 1, 2002 to March 31, 2003.
The BLCC5 program is a windowed version of the DOS-based BLCC4. It is programmed in Java,making it platform-independent, and uses an xml file format. The BLCC5 User’s Guide is part ofits Help system. BLCC 5.1 has four modules, all of them consistent with the life-cycle costmethodology of 10 CFR 436A, but programmed to include default inputs and nomenclature forspecific uses:
(1) FEMP Analysis, Energy Projectfor energy and water conservation and renewable energy projects under the FEMP rules,agency-funded;
(2) Federal Analysis, Financed Projectfor federal projects financed through Energy Savings Performance Contracts (ESPC) orUtility Energy Services Contracts (UESC) as authorized by Executive Order 13123 (6/99);
(3) MILCON Analysis, Energy Projectfor energy and water conservation and renewable energy projects in military construction,agency-funded;
(4) MILCON Analysis, ECIP Projectfor energy and water conservation projects under the Energy Conservation InvestmentProgram (ECIP).
The remaining user-specific modules now in BLCC4 (i.e., for OMB and non-energy MILCONanalyses, and private-sector analyses including taxes and mortgage financing) will be transferred toBLCC5 in the future.
The BLCC4 program is designed to run on IBM PC and compatible microcomputers in a MS-DOSenvironment. The current version is BLCC 4.9-02. BLCC4-associated programs are the following:
C QuickBLCC (version 2.9-02) can be used to set up multiple project alternatives for LCCanalysis in a single input file when only a limited number of inputs are needed.
vi
C DISCOUNT (version 3.9-02) is a stand-alone program that computes present-value, future-value, and annual-value factors for any discount rate and study period, including UPV*factors needed for federal LCC analyses of energy projects.
C ERATES (version 1.11) is a stand-alone program that generates block-rate, time-of-use-rate,and demand-rate schedules for electricity prices. It computes monthly and annual electricitycosts that can be imported directly into BLCC4 and entered manually into BLCC5.
C EMISS (version 1.00) is a stand-alone program that generates files of local air-pollutionemission coefficients for use with the BLCC4 program.
The NIST BLCC programs provide comprehensive economic analysis capabilities for the evaluationof proposed capital investments that are expected to reduce the long-term operating costs ofbuildings and building systems. They compute the LCC for project alternatives, compare projectalternatives in order to determine which has the lowest LCC, perform annual cash flow analysis, andcompute net savings (NS), savings-to-investment ratio (SIR), and adjusted internal rate of return(AIRR) for project alternatives over their designated study period. The BLCC programs can be usedto perform economic analysis of capital investment projects undertaken by federal, state, and localgovernment agencies, as well as by the private sector (BLCC4). In their application to federal energyconservation and renewable energy projects, BLCC5 and BLCC4 are consistent with NISTHandbook 135, and the federal life-cycle cost methodology and procedures described in 10 CFR436A and Circular A-94. In their application to private-sector and non-federal public-sector projects,they are consistent with ASTM standards for building economics.
The U.S. Department of Energy was directed by legislation and executive order to make availableto the private sector the methods, procedures, and related aids developed for federal use. In responseto this directive, the National Institute of Standards and Technology, under sponsorship of the U.S.Department of Energy, published a life-cycle costing book for use by the private sector entitledComprehensive Guide for Least-Cost Energy Decisions, NBS SP 709 (January 1987). The privatesector guide is supported by the data provided here, as well as by the BLCC4 computer program. TheBLCC4 program supersedes the NBSLCC program that is documented in SP 709.
This Annual Supplement to Handbook 135 can be downloaded from the DOE/FEMP web site at:http://www.eren.doe.gov/femp (click on icon Technical Assistance and go to AnalyticalSoftware Tools).
Handbook 135 can be downloaded from the NIST web site at: http://www.nist.bfrl.gov/oae/publications/handbooks/135.html
The latest versions of BLCC5 and BLCC4-associated programs and user guides can be downloadedfrom the DOE/FEMP web site at:
http://www.eren.doe.gov/femp (click on icon Technical Assistance and go to AnalyticalSoftware Tools).
To request diskettes of BLCC4, a CD of BLCC5 and hard copies of the above publications, call theFEMP Help Desk:
Energy Efficiency and Renewable Energy Clearing House(800) DOE-EREC (800-363-3732)
vii
or write or fax your request to:U.S. Department of EnergyFederal Energy Management Program, EE-901000 Independence Avenue, S.W.Washington, DC 20585-0121Fax: (202) 586-3000
BLCC4 may also be purchased from the following vendors:
FlowSoft5 Oak Forest CourtSaint Charles, MO 63303-6622(636) 922-FLOW (3569)http://www.flowsoft.com
Energy Information ServicesP.O. Box 381St. Johnsbury, VT 05819-0381(802) 748-5148
NIST, under the sponsorship of DOE, conducts three workshops:
The two-day Basic LCC Workshop explains the underlying theory of present-value analysis andintegrates it with the FEMP criteria. The two-day Project-Oriented LCC Workshop builds on theBasic Workshop, focuses on the use of the BLCC computer programs and applies the LCCmethodology to more complex issues. Further information is available from the FEMP Help Deskor the DOE/FEMP web site. The third workshop is a two-hour televised course that introduces theelements of life-cycle analysis of energy and water conservation projects. For information onregistration and downlinking, contact Heather Schoonmaker, Telephone (865) 777-9869, [email protected].
FEMP-Qualified Instructors are available to conduct LCC workshops on their own account acrossthe U.S. For a list of instructors call the Office of Applied Economics, NIST BFRL, (301) 975-6134/6136 or e-mail [email protected] or [email protected].
Three video training films in a series entitled "Least-Cost Energy Decisions for Buildings" have beenprepared by NIST. These films include "Introduction to Life-Cycle Costing," "Uncertainty and Risk,"and "Choosing Economic Evaluation Methods." The video films and companion workbooks can beordered from Video Transfer, Inc., 5709-B Arundel Avenue, Rockville, MD 20852, Telephone (301)881-0270, Fax (301) 770-9131.
Further information on the Federal Energy Management Program can be obtained from the FederalEnergy Management Program Staff, Office of the Assistant Secretary for Energy Efficiency andRenewable Energy, U.S. Department of Energy. Please direct communication to: FEMP, EE 90,U.S. Department of Energy, 1000 Independence Avenue, SW, Washington, DC 20585.
viii
ACKNOWLEDGMENTS
The authors wish to thank Mr. Theodore Collins of the Federal Energy Management Program of theU.S. Department of Energy (DOE) for his continued support and direction of this work. Appreciationis extended to Susan Holte and Paul Kondis, DOE Energy Information Administration, for providingthe energy price projections upon which this report is based. Thanks are also due to StephenPetersen, who helped prepare this publication, and to J’aime Maynard for her assistance in producingthis document.
ix
CONTENTS
Page
ABSTRACT . . . . . . . . . . . . . . . . . . . . . . . . . . . . . . . . . . . . . . . . . . . . . . . . . . . . . . . . . . . . . . . . iii
PREFACE . . . . . . . . . . . . . . . . . . . . . . . . . . . . . . . . . . . . . . . . . . . . . . . . . . . . . . . . . . . . . . . . . . iv
ACKNOWLEDGMENTS . . . . . . . . . . . . . . . . . . . . . . . . . . . . . . . . . . . . . . . . . . . . . . . . . . . . . viii
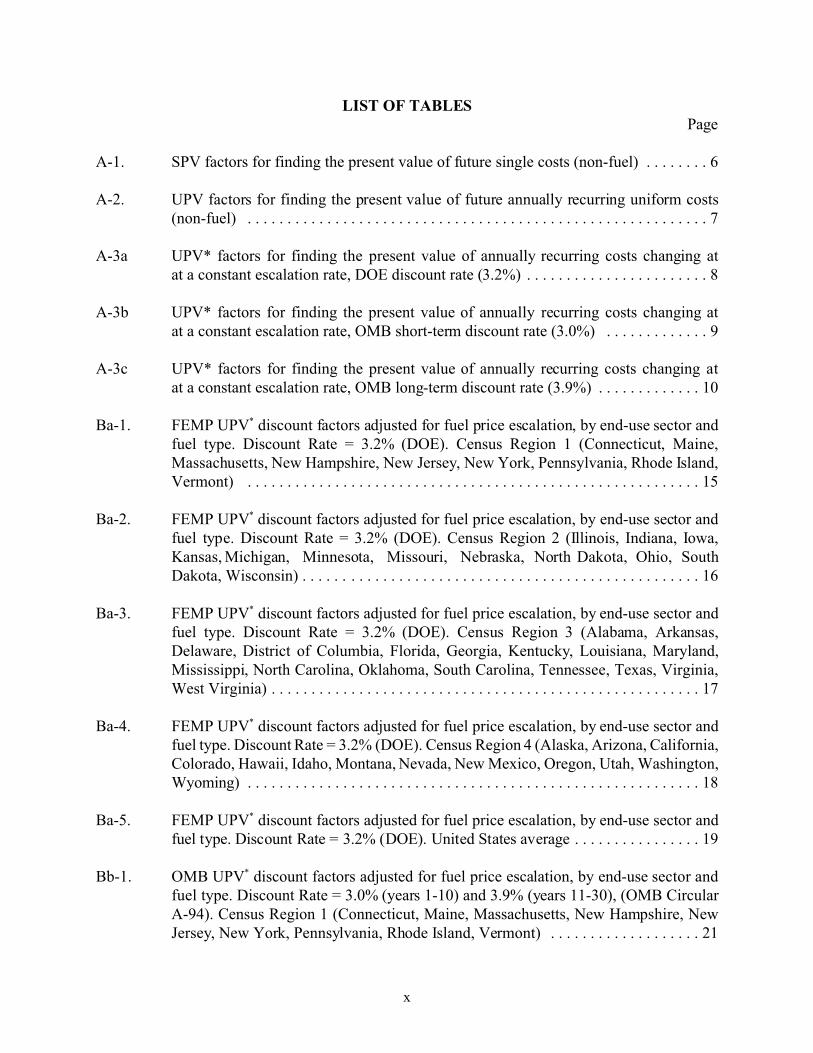
LIST OF TABLES . . . . . . . . . . . . . . . . . . . . . . . . . . . . . . . . . . . . . . . . . . . . . . . . . . . . . . . . . . . . x
ABBREVIATIONS . . . . . . . . . . . . . . . . . . . . . . . . . . . . . . . . . . . . . . . . . . . . . . . . . . . . . . . . . . xiii
INTRODUCTION . . . . . . . . . . . . . . . . . . . . . . . . . . . . . . . . . . . . . . . . . . . . . . . . . . . . . . . . . . . . . 1
PART I: TABLES FOR FEDERAL LIFE-CYCLE COST ANALYSIS . . . . . . . . . . . . . . . . . . . 3
A. Single Present Value and Uniform Present Value Factors for Non-Fuel Costs . . . . . . . . 3
B. Modified Uniform Present Value Factors for Fuel Costs . . . . . . . . . . . . . . . . . . . . . . . . 11B.1. FEMP Modified Uniform Present Value Factors . . . . . . . . . . . . . . . . . . . . . . . . . . 14B.2. OMB Modified Uniform Present Value Factors . . . . . . . . . . . . . . . . . . . . . . . . . . 20
C. Projected Average Fuel Price Indices and Escalation Rates (Real) . . . . . . . . . . . . . . . . 26
PART II: ENERGY PRICE INDICES FOR PRIVATE SECTOR LCC ANALYSIS . . . . . . . . 43
x
LIST OF TABLESPage
A-1. SPV factors for finding the present value of future single costs (non-fuel) . . . . . . . . 6
A-2. UPV factors for finding the present value of future annually recurring uniform costs(non-fuel) . . . . . . . . . . . . . . . . . . . . . . . . . . . . . . . . . . . . . . . . . . . . . . . . . . . . . . . . . . 7
A-3a UPV* factors for finding the present value of annually recurring costs changing atat a constant escalation rate, DOE discount rate (3.2%) . . . . . . . . . . . . . . . . . . . . . . . 8
A-3b UPV* factors for finding the present value of annually recurring costs changing atat a constant escalation rate, OMB short-term discount rate (3.0%) . . . . . . . . . . . . . 9
A-3c UPV* factors for finding the present value of annually recurring costs changing atat a constant escalation rate, OMB long-term discount rate (3.9%) . . . . . . . . . . . . . 10
Ba-1. FEMP UPV* discount factors adjusted for fuel price escalation, by end-use sector andfuel type. Discount Rate = 3.2% (DOE). Census Region 1 (Connecticut, Maine,Massachusetts, New Hampshire, New Jersey, New York, Pennsylvania, Rhode Island,Vermont) . . . . . . . . . . . . . . . . . . . . . . . . . . . . . . . . . . . . . . . . . . . . . . . . . . . . . . . . . 15
Ba-2. FEMP UPV* discount factors adjusted for fuel price escalation, by end-use sector andfuel type. Discount Rate = 3.2% (DOE). Census Region 2 (Illinois, Indiana, Iowa,Kansas, Michigan, Minnesota, Missouri, Nebraska, North Dakota, Ohio, SouthDakota, Wisconsin) . . . . . . . . . . . . . . . . . . . . . . . . . . . . . . . . . . . . . . . . . . . . . . . . . . 16
Ba-3. FEMP UPV* discount factors adjusted for fuel price escalation, by end-use sector andfuel type. Discount Rate = 3.2% (DOE). Census Region 3 (Alabama, Arkansas,Delaware, District of Columbia, Florida, Georgia, Kentucky, Louisiana, Maryland,Mississippi, North Carolina, Oklahoma, South Carolina, Tennessee, Texas, Virginia,West Virginia) . . . . . . . . . . . . . . . . . . . . . . . . . . . . . . . . . . . . . . . . . . . . . . . . . . . . . . 17
Ba-4. FEMP UPV* discount factors adjusted for fuel price escalation, by end-use sector andfuel type. Discount Rate = 3.2% (DOE). Census Region 4 (Alaska, Arizona, California,Colorado, Hawaii, Idaho, Montana, Nevada, New Mexico, Oregon, Utah, Washington,Wyoming) . . . . . . . . . . . . . . . . . . . . . . . . . . . . . . . . . . . . . . . . . . . . . . . . . . . . . . . . . 18
Ba-5. FEMP UPV* discount factors adjusted for fuel price escalation, by end-use sector andfuel type. Discount Rate = 3.2% (DOE). United States average . . . . . . . . . . . . . . . . 19
Bb-1. OMB UPV* discount factors adjusted for fuel price escalation, by end-use sector andfuel type. Discount Rate = 3.0% (years 1-10) and 3.9% (years 11-30), (OMB CircularA-94). Census Region 1 (Connecticut, Maine, Massachusetts, New Hampshire, NewJersey, New York, Pennsylvania, Rhode Island, Vermont) . . . . . . . . . . . . . . . . . . . 21
xi
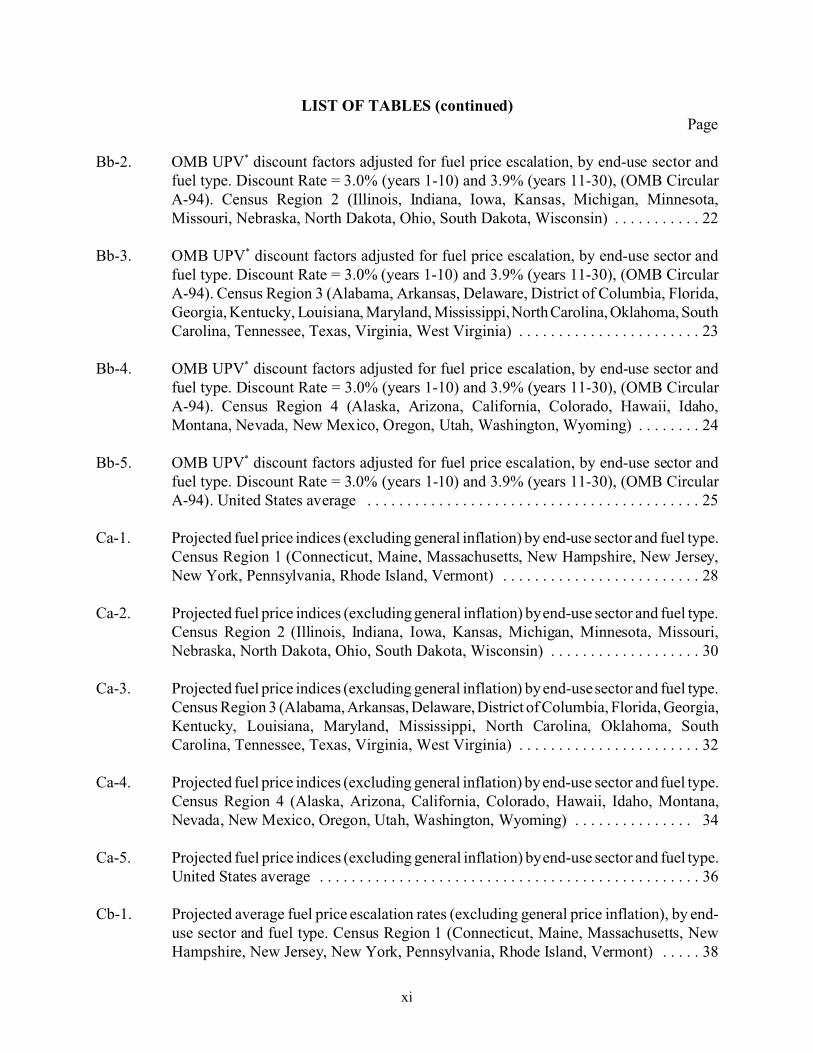
LIST OF TABLES (continued)Page
Bb-2. OMB UPV* discount factors adjusted for fuel price escalation, by end-use sector andfuel type. Discount Rate = 3.0% (years 1-10) and 3.9% (years 11-30), (OMB CircularA-94). Census Region 2 (Illinois, Indiana, Iowa, Kansas, Michigan, Minnesota,Missouri, Nebraska, North Dakota, Ohio, South Dakota, Wisconsin) . . . . . . . . . . . 22
Bb-3. OMB UPV* discount factors adjusted for fuel price escalation, by end-use sector andfuel type. Discount Rate = 3.0% (years 1-10) and 3.9% (years 11-30), (OMB CircularA-94). Census Region 3 (Alabama, Arkansas, Delaware, District of Columbia, Florida,Georgia, Kentucky, Louisiana, Maryland, Mississippi, North Carolina, Oklahoma, SouthCarolina, Tennessee, Texas, Virginia, West Virginia) . . . . . . . . . . . . . . . . . . . . . . . 23
Bb-4. OMB UPV* discount factors adjusted for fuel price escalation, by end-use sector andfuel type. Discount Rate = 3.0% (years 1-10) and 3.9% (years 11-30), (OMB CircularA-94). Census Region 4 (Alaska, Arizona, California, Colorado, Hawaii, Idaho,Montana, Nevada, New Mexico, Oregon, Utah, Washington, Wyoming) . . . . . . . . 24
Bb-5. OMB UPV* discount factors adjusted for fuel price escalation, by end-use sector andfuel type. Discount Rate = 3.0% (years 1-10) and 3.9% (years 11-30), (OMB CircularA-94). United States average . . . . . . . . . . . . . . . . . . . . . . . . . . . . . . . . . . . . . . . . . . 25
Ca-1. Projected fuel price indices (excluding general inflation) by end-use sector and fuel type.Census Region 1 (Connecticut, Maine, Massachusetts, New Hampshire, New Jersey,New York, Pennsylvania, Rhode Island, Vermont) . . . . . . . . . . . . . . . . . . . . . . . . . 28
Ca-2. Projected fuel price indices (excluding general inflation) by end-use sector and fuel type.Census Region 2 (Illinois, Indiana, Iowa, Kansas, Michigan, Minnesota, Missouri,Nebraska, North Dakota, Ohio, South Dakota, Wisconsin) . . . . . . . . . . . . . . . . . . . 30
Ca-3. Projected fuel price indices (excluding general inflation) by end-use sector and fuel type.Census Region 3 (Alabama, Arkansas, Delaware, District of Columbia, Florida, Georgia,Kentucky, Louisiana, Maryland, Mississippi, North Carolina, Oklahoma, SouthCarolina, Tennessee, Texas, Virginia, West Virginia) . . . . . . . . . . . . . . . . . . . . . . . 32
Ca-4. Projected fuel price indices (excluding general inflation) by end-use sector and fuel type.Census Region 4 (Alaska, Arizona, California, Colorado, Hawaii, Idaho, Montana,Nevada, New Mexico, Oregon, Utah, Washington, Wyoming) . . . . . . . . . . . . . . . 34
Ca-5. Projected fuel price indices (excluding general inflation) by end-use sector and fuel type.United States average . . . . . . . . . . . . . . . . . . . . . . . . . . . . . . . . . . . . . . . . . . . . . . . . 36
Cb-1. Projected average fuel price escalation rates (excluding general price inflation), by end-use sector and fuel type. Census Region 1 (Connecticut, Maine, Massachusetts, NewHampshire, New Jersey, New York, Pennsylvania, Rhode Island, Vermont) . . . . . 38
xii
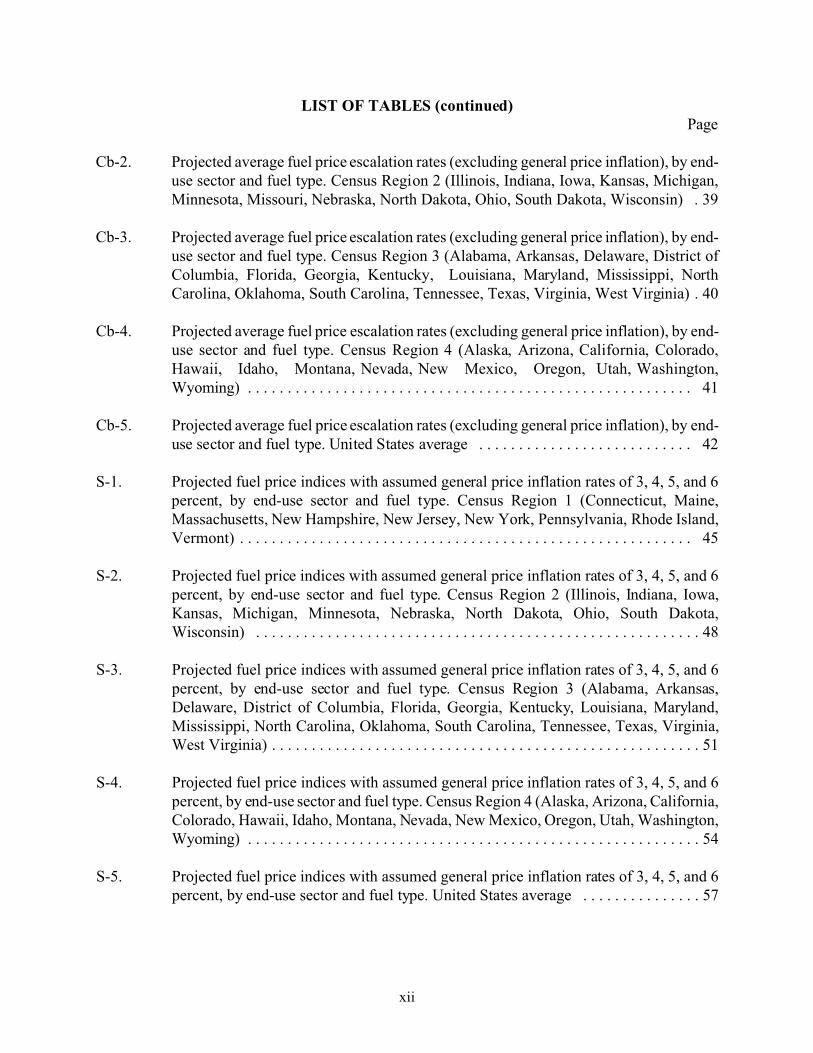
LIST OF TABLES (continued)Page
Cb-2. Projected average fuel price escalation rates (excluding general price inflation), by end-use sector and fuel type. Census Region 2 (Illinois, Indiana, Iowa, Kansas, Michigan,Minnesota, Missouri, Nebraska, North Dakota, Ohio, South Dakota, Wisconsin) . 39
Cb-3. Projected average fuel price escalation rates (excluding general price inflation), by end-use sector and fuel type. Census Region 3 (Alabama, Arkansas, Delaware, District ofColumbia, Florida, Georgia, Kentucky, Louisiana, Maryland, Mississippi, NorthCarolina, Oklahoma, South Carolina, Tennessee, Texas, Virginia, West Virginia) . 40
Cb-4. Projected average fuel price escalation rates (excluding general price inflation), by end-use sector and fuel type. Census Region 4 (Alaska, Arizona, California, Colorado,Hawaii, Idaho, Montana, Nevada, New Mexico, Oregon, Utah, Washington,Wyoming) . . . . . . . . . . . . . . . . . . . . . . . . . . . . . . . . . . . . . . . . . . . . . . . . . . . . . . . . 41
Cb-5. Projected average fuel price escalation rates (excluding general price inflation), by end-use sector and fuel type. United States average . . . . . . . . . . . . . . . . . . . . . . . . . . . 42
S-1. Projected fuel price indices with assumed general price inflation rates of 3, 4, 5, and 6percent, by end-use sector and fuel type. Census Region 1 (Connecticut, Maine,Massachusetts, New Hampshire, New Jersey, New York, Pennsylvania, Rhode Island,Vermont) . . . . . . . . . . . . . . . . . . . . . . . . . . . . . . . . . . . . . . . . . . . . . . . . . . . . . . . . . 45
S-2. Projected fuel price indices with assumed general price inflation rates of 3, 4, 5, and 6percent, by end-use sector and fuel type. Census Region 2 (Illinois, Indiana, Iowa,Kansas, Michigan, Minnesota, Nebraska, North Dakota, Ohio, South Dakota,Wisconsin) . . . . . . . . . . . . . . . . . . . . . . . . . . . . . . . . . . . . . . . . . . . . . . . . . . . . . . . . 48
S-3. Projected fuel price indices with assumed general price inflation rates of 3, 4, 5, and 6percent, by end-use sector and fuel type. Census Region 3 (Alabama, Arkansas,Delaware, District of Columbia, Florida, Georgia, Kentucky, Louisiana, Maryland,Mississippi, North Carolina, Oklahoma, South Carolina, Tennessee, Texas, Virginia,West Virginia) . . . . . . . . . . . . . . . . . . . . . . . . . . . . . . . . . . . . . . . . . . . . . . . . . . . . . . 51
S-4. Projected fuel price indices with assumed general price inflation rates of 3, 4, 5, and 6percent, by end-use sector and fuel type. Census Region 4 (Alaska, Arizona, California,Colorado, Hawaii, Idaho, Montana, Nevada, New Mexico, Oregon, Utah, Washington,Wyoming) . . . . . . . . . . . . . . . . . . . . . . . . . . . . . . . . . . . . . . . . . . . . . . . . . . . . . . . . . 54
S-5. Projected fuel price indices with assumed general price inflation rates of 3, 4, 5, and 6percent, by end-use sector and fuel type. United States average . . . . . . . . . . . . . . . 57
xiii
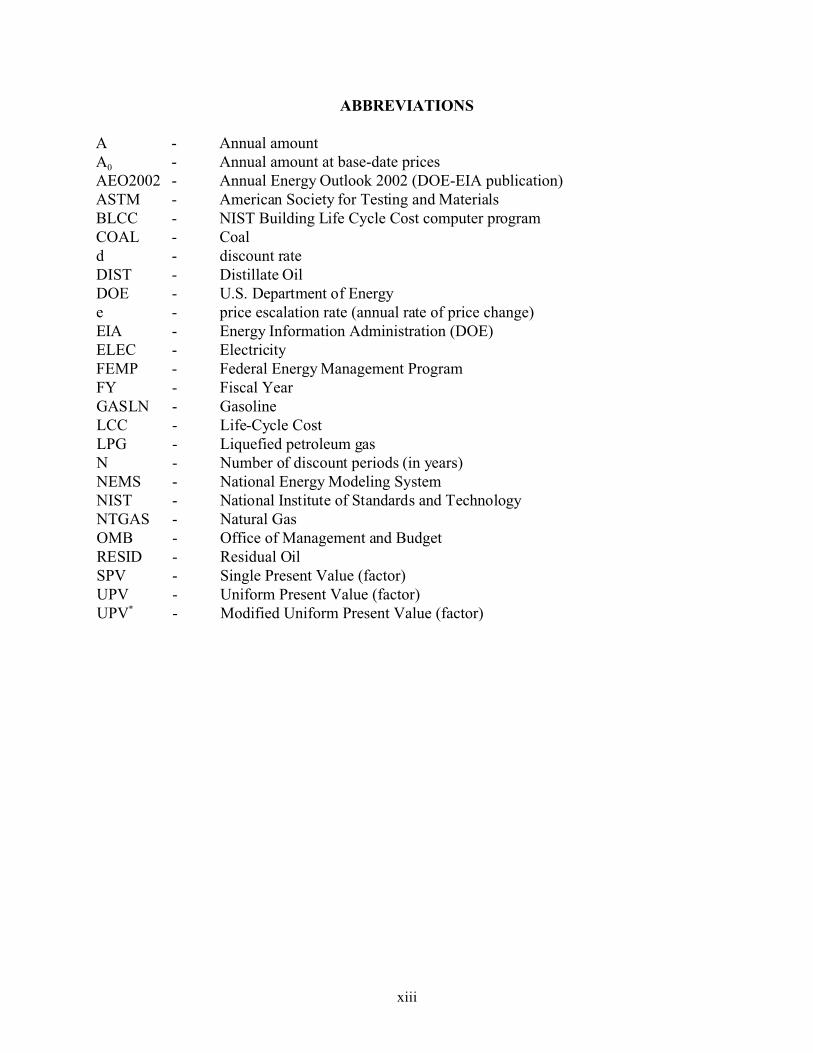
ABBREVIATIONS
A - Annual amountA0 - Annual amount at base-date pricesAEO2002 - Annual Energy Outlook 2002 (DOE-EIA publication)ASTM - American Society for Testing and MaterialsBLCC - NIST Building Life Cycle Cost computer programCOAL - Coald - discount rateDIST - Distillate OilDOE - U.S. Department of Energye - price escalation rate (annual rate of price change)EIA - Energy Information Administration (DOE)ELEC - ElectricityFEMP - Federal Energy Management ProgramFY - Fiscal YearGASLN - GasolineLCC - Life-Cycle CostLPG - Liquefied petroleum gasN - Number of discount periods (in years)NEMS - National Energy Modeling SystemNIST - National Institute of Standards and TechnologyNTGAS - Natural GasOMB - Office of Management and BudgetRESID - Residual OilSPV - Single Present Value (factor)UPV - Uniform Present Value (factor)UPV* - Modified Uniform Present Value (factor)

1
INTRODUCTION
This report provides tables of present-value factors for use in the life-cycle cost analysis of capitalinvestment projects for federal facilities. It also provides energy price indices based on Department ofEnergy (DOE) forecasts from 2002 to 2032. The factors and indices presented in this report are usefulfor determining the present value of future project-related costs, especially those related to operationalenergy costs. Discount factors included in this report are based on two different federal sources: (1) theDOE discount rate for projects related to energy conservation, renewable energy resources, and waterconservation; and (2) Office of Management and Budget (OMB) discount rates from Circular A-94 foruse with most other capital investment projects in federal facilities.
The DOE discount and inflation rates for 2002 are as follows:
Real rate (excluding general price inflation): 3.2%Nominal rate (including general price inflation): 5.6%Projected 10-year average inflation rate: 2.3%
The DOE discount rate is based on long-term Treasury bond rates averaged over the 12 months prior tothe preparation of this report. The nominal, or market rate, is converted to a real rate using the projectedrate of general price inflation (2.3%) from the Economic Report of the President's Council of EconomicAdvisors, to correspond with the constant-dollar analysis approach that is used in most federal life-cyclecost (LCC) analyses. Federal agencies and contractors to federal agencies are required by 10 CFR 436to use the DOE discount rate when conducting LCC analyses related to energy conservation, renewableenergy resources, and water conservation projects for federal facilities.
OMB Circular A-94 on guidelines and discount rates for benefit-cost analysis of federal programs wasextensively revised in October 1992. There is no longer a single OMB discount rate as in the past. OMBhas specified two basic types of discount rates: (1) a discount rate for cost-effectiveness, lease-purchase,and related analyses; and (2) a discount rate for public investment and regulatory analyses. Only discountrates for the first type of analyses are included in this Annual Supplement, since the primary purpose ofthis report is to support cost-effectiveness studies related to the design and operation of federal facilities.
OMB discount rates for cost-effectiveness and lease-purchase studies are based on interest rates onTreasury Notes and Bonds with maturities ranging from 3 to 30 years. Currently (as of January 2002)five maturities have been specifically identified by OMB, and are shown here with the correspondingreal interest rate to be used as the discount rate for studies subject to OMB Circular A-94:
Maturity: 3-year 5-year 7-year 10-year 30-year Rate: 2.1% 2.8% 3.0% 3.1% 3.9%
OMB suggests that the actual discount rate for an economic analysis be interpolated from thesematurities and rates, based on the study period used in the analysis. Due to limitations on the size of thisAnnual Supplement, discount factors for only two of these maturities are presented: factors for short-term analyses (up to 10 years) based on the 7-year real rate (3.0%), and factors for long-term analyses(longer than 10 years) based on the 30-year real rate (3.9%). As a result, these discount factors are forapproximation purposes only. It is suggested that the NIST Building Life Cycle Cost (BLCC) orDISCOUNT programs be used to compute the present value factors for the discount rate corresponding
2
to the length of the study period when approximate values are not satisfactory for the project analysis.(See preface for details on obtaining these programs.)
The energy price indices and corresponding present value factors published in this report are computedfrom energy price forecasts provided to NIST by the Department of Energy's Energy InformationAdministration (EIA). The EIA energy price forecast used in this report was the most recent availableat the time that this report was prepared. A description of the methodology used by EIA to project energyprices through 2032 is included in section B of this report. DOE has not projected escalation rates forwater prices to be used in the LCC analysis of water conservation projects. Water escalation rates shouldbe obtained from the local water utility when possible.
Federal agencies and contractors to federal agencies are encouraged to seek energy price projectionsfrom their local utility to use in place of the DOE/EIA regional projections, especially when evaluatingalternative fuel types. In such cases the NIST BLCC or DISCOUNT programs can be used to calculateappropriate "modified uniform present value" (UPV*) factors for use in the LCC analysis of federalenergy conservation or renewable resource projects. Otherwise, 10 CFR 436 requires the use of the DOEenergy price forecasts when conducting LCC analyses of such projects. The UPV* factors for energycosts presented in this report have been precalculated with the DOE forecast data. Thus the use of theseUPV* factors automatically ensures that the DOE forecast data have been included in the analysis.
All of the tables of discount factors contained in this report are based on real discount rates and aretherefore intended for use only with economic analyses conducted in constant dollars (in which thepurchasing power of the dollar is held constant). The energy price escalation rates and correspondingenergy price indices contained in this report are also expressed in real terms. If nominal discount ratesand current dollar costs (which both include inflation) are used in the LCC analyses of federal projects,use the BLCC computer program in the "general analysis" mode.
This report uses the term "present value" instead of "present worth" for the discount factors presented.The meaning of these two terms is considered to be identical for purposes of economic analysis. Thischange in terminology was made to be consistent with the terms used in the American Society forTesting and Materials (ASTM) compilation of standards on building economics (ASTM Standards onBuilding Economics, Third Edition, ASTM, Philadelphia, PA, 1994.)
In all of the tables, the “end-of-year” discounting convention is used, that is, all factors and indices arecomputed to adjust future dollar amounts to present value from the end of the year in which they areexpected to occur. The factors and indices in this publication, which include energy price escalation rates(e.g., UPV* factores and energy price indices), were calculated using April 1, 2002 (the date of thispublication) as their base date. However, these factors and indices can be used without adjustment forthe LCC analysis of projects with other base dates until the release of the next revision of this publication(April 2003). Adjustment of these factors and indices for differences in the month-specific base date isnot generally warranted due to uncertainties in estimating future energy prices.

3
PART I: TABLES FOR FEDERAL LIFE-CYCLE COSTANALYSIS
A. Single Present Value and Uniform Present Value Factors for Non-Fuel Costs
Table A-1 presents the single present value (SPV) factors for finding the present value of future non-fuel, non-annually recurring costs, such as repair and replacement costs and salvage values. Theformula for finding the present value (P) of a future cost occurring in year t (Ct) is the following:
where d = discount rate, and t = number of time periods (years) between the present time and the time the cost is incurred.
Table A-2 presents uniform present value (UPV) factors for finding the present value of future non-fuel costs recurring annually, such as routine maintenance costs. The formula for finding the presentvalue (P) of an annually recurring uniform cost (A) is the following:
where d = discount rate, andN = number of time periods (years) over which A recurs.
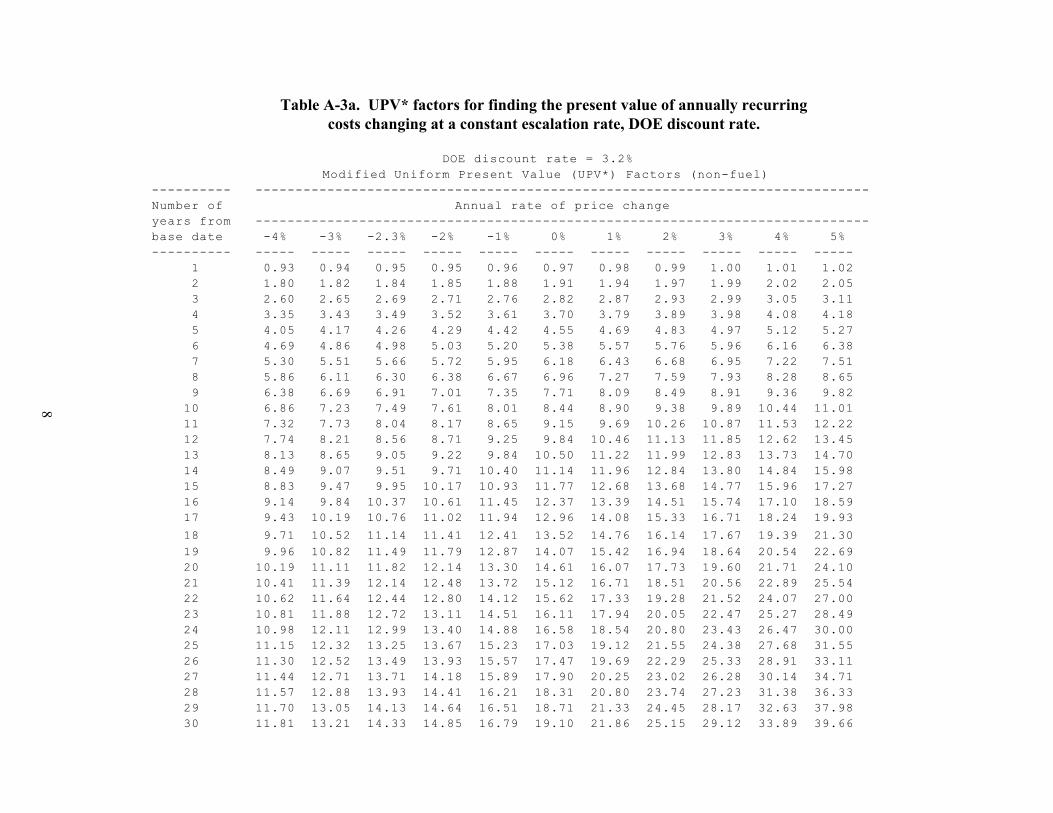
Tables A-3(a,b,c) present modified uniform present value (UPV*) factors for finding the presentvalue of annually recurring non-fuel costs, such as water costs, which are expected to change fromyear to year at a constant rate of change (or escalation rate) over the study period. The escalation ratecan be positive or negative. The formula for finding the present value (P) of an annually recurringcost at base-date prices (A0) changing at escalation rate e is the following:
or
where A0 = annually recurring cost at base-date prices,d = discount rate,e = escalation rate, andN = number of time periods (years) over which A recurs.

4
Note: if the discount rate is expressed in real terms, i.e., net of general inflation, then the escalationrate must also be expressed in real terms. If the discount rate is expressed in nominal terms, i.e.,including general inflation, then the escalation rate must also be expressed in nominal terms.
In tables A-1, A-2, and A-3(a,b,c) SPV, UPV, and UPV* factors are provided for both the DOE andthe OMB Circular A-94 real discount rates current as of the date of this publication. The FEMP SPV,UPV, and UPV* factors were computed using the DOE discount rate. The FEMP factors are forfinding the present value of future costs associated with federal energy and water conservationprojects and renewable energy projects. The OMB SPV, UPV, and UPV* factors were computedusing the OMB discount rate. The OMB factors are for finding the present value of future costsassociated with most other federal projects (except those specifically exempted from OMB CircularA-94). The DOE and OMB discount rates used in computing these tables are real rates, exclusiveof general price inflation. Thus the resulting discount factors are intended for use with future coststhat are stated in constant dollars.
NOTE: We have added to table A-3a a column of UPV* factors that incorporate an escalation rateof -2.3%, the negative of the inflation rate used to calculate the DOE nominal discount rate for 2002.The UPV* factors in this column can be used to calculate present values of fixed dollar amountswhen performing a constant-dollar analysis. An example might be a fixed contract payment in anESPC project. For these fixed amounts, the assumption that in a constant-dollar analysis all cashflows change at the rate of general inflation (so that the differential escalation rate is zero) does notapply. In real terms, fixed amounts change at a differential rate equal to the negative of the inflationrate.
Examples of How to Use the Factors:
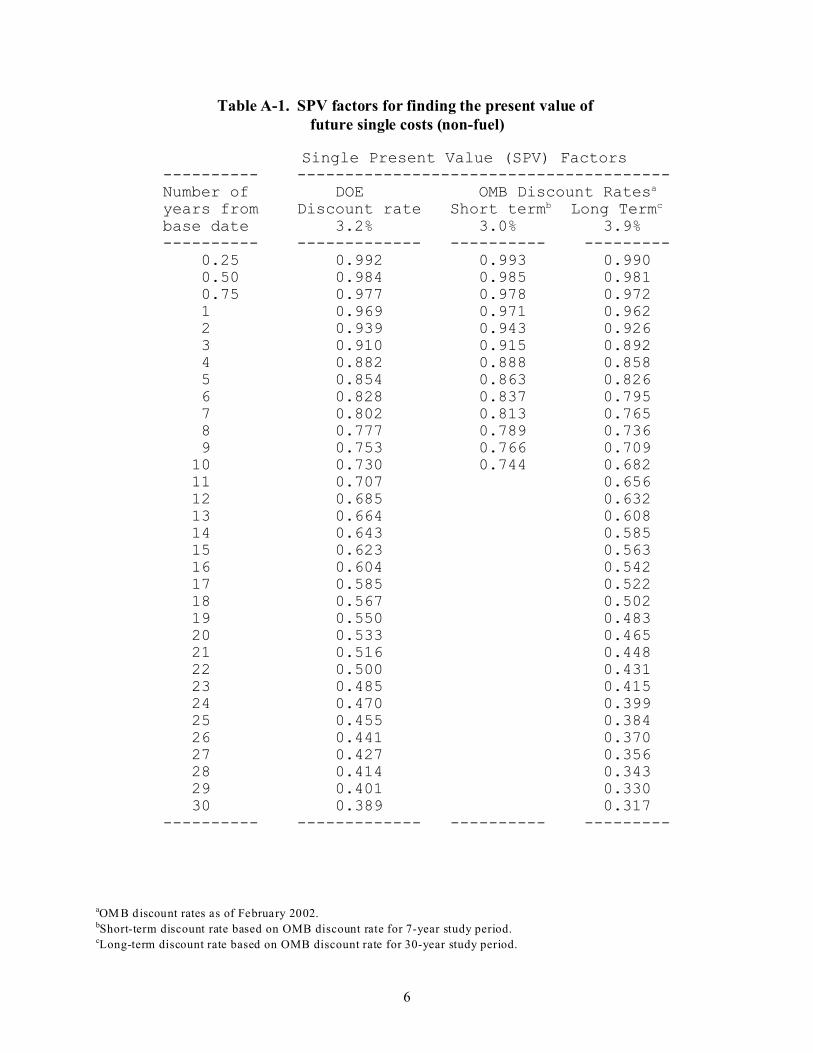
SPV (FEMP): To compute the present value of a replacement cost expected to occur in the 8th yearfor an energy efficient heating system, go to Table A-1, find the 3.2% SPV factor for year 8 (0.777),and multiply the factor by the replacement cost as of the base date.
SPV (OMB, Short-term): To compute the present value of a repair cost in the 5th year for a floorcovering (non-energy related), go to Table A-1, find the 3.0% SPV factor for year 5 (0.863), andmultiply the factor by the repair cost as of the base date.
SPV (OMB, Long-term): To compute the present value of a repair cost in the 15th year for a floorcovering (non-energy related), go to Table A-1, find the 3.9% SPV factor for year 15 (0.563), andmultiply the factor by the repair cost as of the base date.
UPV (FEMP): To compute the present value of an annually recurring maintenance cost for arenewable energy system over 20 years, go to Table A-2, find the 3.2% UPV factor for 20 years(14.61), and multiply the factor by the annual maintenance cost as of the base date.
UPV (OMB, Short-term): To compute the present value of annually recurring costs of officecleaning over 10 years (for a project not primarily related to energy conservation), go to Table A-2,
5
find the 3.0% UPV factor for 10 years (8.53), and multiply the factor by the annual cleaning cost asof the base date.
UPV (OMB, Long-term): To compute the present value of annually recurring costs of officecleaning over 25 years (for a project not primarily related to energy conservation), got to Table A-2,find the 3.9% UPV factor for 25 years (15.79), and multiply the factor by the annual cleaning costas of the base date.
UPV* (all): To compute the present value of annually recurring costs of water usage which areexpected to increase at 2% faster than the rate of general inflation over 25 years, find the UPV*factor from table A-3 (a,b, or c as appropriate) that corresponds to 2% escalation and a 25 year studyperiod. From table A-3a (3.2% DOE discount rate) the corresponding UPV* factor is 21.55. Multiplythis factor by the annual water cost as computed at base year prices to determine the present valueof these water costs over the entire 25 years.
UPV* (negative inflation rate): To compute the present value of an annually recurring contractpayment that is fixed over a contract period of 10 years, find the UPV* factor from table A-3a thatcorresponds to an escalation of -2.3% and a 10-year time period. From table A-3a (3.2% DOEdiscount rate) the corresponding UPV* factor is 7.49. Multiply this factor by the annual contractpayment as of the base year to determine the present value of these contract payments over the entire10-year period.
NOTE: UPV factors are generally applied to costs that recur annually in substantially the sameamount. Examples of such costs are routine operating and maintenance costs. UPV* factors aregenerally applied to costs that recur annually but change from year to year at a constant escalationrate. Examples of such costs are water usage costs when they increase from year to year. These costsusually occur every year over the service period of the building life. If there is aplanning/design/construction period before the service life begins, during which these annual costsare not incurred, the appropriate UPV (or UPV*) factor for the service period is the differencebetween the UPV (or UPV*) factor for the entire study period and the UPV (or UPV*) factor for theplanning/design/construction period. For example, if the planning/design/construction period is 3years and the service period is 25 years, for a total study period of 28 years, the corresponding UPVfactor (from Table A-2, DOE 3.2% discount rate) is 18.31 - 2.82 = 15.49.
For further explanation and illustration of how to use these factors, see NIST Handbook 135.
6
Table A-1. SPV factors for finding the present value of future single costs (non-fuel)
Single Present Value (SPV) Factors ---------- --------------------------------------- Number of DOE OMB Discount Ratesa
years from Discount rate Short termb Long Termc
base date 3.2% 3.0% 3.9% ---------- ------------- ---------- --------- 0.25 0.992 0.993 0.990 0.50 0.984 0.985 0.981 0.75 0.977 0.978 0.972 1 0.969 0.971 0.962 2 0.939 0.943 0.926 3 0.910 0.915 0.892 4 0.882 0.888 0.858 5 0.854 0.863 0.826 6 0.828 0.837 0.795 7 0.802 0.813 0.765 8 0.777 0.789 0.736 9 0.753 0.766 0.709 10 0.730 0.744 0.682 11 0.707 0.656 12 0.685 0.632 13 0.664 0.608 14 0.643 0.585 15 0.623 0.563 16 0.604 0.542 17 0.585 0.522 18 0.567 0.502 19 0.550 0.483 20 0.533 0.465 21 0.516 0.448 22 0.500 0.431 23 0.485 0.415 24 0.470 0.399 25 0.455 0.384 26 0.441 0.370 27 0.427 0.356 28 0.414 0.343 29 0.401 0.330 30 0.389 0.317 ---------- ------------- ---------- ---------
aOM B discount rates as of February 2002. bShort-term discount rate based on OMB discount rate for 7-year study period.cLong-term discount rate based on OMB discount rate for 30-year study period.

7
Table A-2. UPV factors for finding the present value of annually recurring uniform costs (non-fuel)
Uniform Present Value (UPV) Factors ----------- --------------------------------------- Number of DOE OMB Discount Ratesa
years from Discount rate Short termb Long Termc
base date 3.2% 3.0% 3.9% ----------- ------------- ---------- --------- 1 0.97 0.97 0.96 2 1.91 1.91 1.89 3 2.82 2.83 2.78 4 3.70 3.72 3.64 5 4.55 4.58 4.46 6 5.38 5.42 5.26 7 6.18 6.23 6.02 8 6.96 7.02 6.76 9 7.71 7.79 7.47 10 8.44 8.53 8.15 11 9.15 8.81 12 9.84 9.44 13 10.50 10.05 14 11.14 10.63 15 11.77 11.20 16 12.37 11.74 17 12.96 12.26 18 13.52 12.76 19 14.07 13.25 20 14.61 13.71 21 15.12 14.16 22 15.62 14.59 23 16.11 15.01 24 16.58 15.40 25 17.03 15.79 26 17.47 16.16 27 17.90 16.51 28 18.31 16.86 29 18.71 17.19 30 19.10 17.50 ---------- ----------- ---------- ---------
aOM B discount rates as of February 2002. bShort-term discount rate based on OMB discount rate for 7-year study period.cLong-term discount rate based on OMB discount rate for 30-year study period.
8
Table A-3a. UPV* factors for finding the present value of annually recurring costs changing at a constant escalation rate, DOE discount rate.
DOE discount rate = 3.2%
Modified Uniform Present Value (UPV*) Factors (non-fuel)
---------- -----------------------------------------------------------------------------
Number of Annual rate of price change
years from -----------------------------------------------------------------------------
base date -4% -3% -2.3% -2% -1% 0% 1% 2% 3% 4% 5%
---------- ----- ----- ----- ----- ----- ----- ----- ----- ----- ----- -----
1 0.93 0.94 0.95 0.95 0.96 0.97 0.98 0.99 1.00 1.01 1.02
2 1.80 1.82 1.84 1.85 1.88 1.91 1.94 1.97 1.99 2.02 2.05
3 2.60 2.65 2.69 2.71 2.76 2.82 2.87 2.93 2.99 3.05 3.11
4 3.35 3.43 3.49 3.52 3.61 3.70 3.79 3.89 3.98 4.08 4.18
5 4.05 4.17 4.26 4.29 4.42 4.55 4.69 4.83 4.97 5.12 5.27
6 4.69 4.86 4.98 5.03 5.20 5.38 5.57 5.76 5.96 6.16 6.38
7 5.30 5.51 5.66 5.72 5.95 6.18 6.43 6.68 6.95 7.22 7.51
8 5.86 6.11 6.30 6.38 6.67 6.96 7.27 7.59 7.93 8.28 8.65
9 6.38 6.69 6.91 7.01 7.35 7.71 8.09 8.49 8.91 9.36 9.82
10 6.86 7.23 7.49 7.61 8.01 8.44 8.90 9.38 9.89 10.44 11.01
11 7.32 7.73 8.04 8.17 8.65 9.15 9.69 10.26 10.87 11.53 12.22
12 7.74 8.21 8.56 8.71 9.25 9.84 10.46 11.13 11.85 12.62 13.45
13 8.13 8.65 9.05 9.22 9.84 10.50 11.22 11.99 12.83 13.73 14.70
14 8.49 9.07 9.51 9.71 10.40 11.14 11.96 12.84 13.80 14.84 15.98
15 8.83 9.47 9.95 10.17 10.93 11.77 12.68 13.68 14.77 15.96 17.27
16 9.14 9.84 10.37 10.61 11.45 12.37 13.39 14.51 15.74 17.10 18.59
17 9.43 10.19 10.76 11.02 11.94 12.96 14.08 15.33 16.71 18.24 19.93
18 9.71 10.52 11.14 11.41 12.41 13.52 14.76 16.14 17.67 19.39 21.30 19 9.96 10.82 11.49 11.79 12.87 14.07 15.42 16.94 18.64 20.54 22.69
20 10.19 11.11 11.82 12.14 13.30 14.61 16.07 17.73 19.60 21.71 24.10
21 10.41 11.39 12.14 12.48 13.72 15.12 16.71 18.51 20.56 22.89 25.54
22 10.62 11.64 12.44 12.80 14.12 15.62 17.33 19.28 21.52 24.07 27.00
23 10.81 11.88 12.72 13.11 14.51 16.11 17.94 20.05 22.47 25.27 28.49
24 10.98 12.11 12.99 13.40 14.88 16.58 18.54 20.80 23.43 26.47 30.00
25 11.15 12.32 13.25 13.67 15.23 17.03 19.12 21.55 24.38 27.68 31.55
26 11.30 12.52 13.49 13.93 15.57 17.47 19.69 22.29 25.33 28.91 33.11
27 11.44 12.71 13.71 14.18 15.89 17.90 20.25 23.02 26.28 30.14 34.71
28 11.57 12.88 13.93 14.41 16.21 18.31 20.80 23.74 27.23 31.38 36.33
29 11.70 13.05 14.13 14.64 16.51 18.71 21.33 24.45 28.17 32.63 37.98
30 11.81 13.21 14.33 14.85 16.79 19.10 21.86 25.15 29.12 33.89 39.66

9
Table A-3b. UPV* factors for finding the present value of annually recurring amounts changing at a constant escalation rate, OMB short-term discount rate.
OMB short-term discount rate = 3.0%a
Modified Uniform Present Value (UPV*) Factors (non-fuel)
---------- -----------------------------------------------------------------------------
Number of Annual rate of price change
years from -----------------------------------------------------------------------------
base date -5% -4% -3% -2% -1% 0% 1% 2% 3% 4% 5%
---------- ----- ----- ----- ----- ----- ----- ----- ----- ----- ----- -----
1 0.92 0.93 0.94 0.95 0.96 0.97 0.98 0.99 1.00 1.01 1.02
2 1.77 1.80 1.83 1.86 1.89 1.91 1.94 1.97 2.00 2.03 2.06
3 2.56 2.61 2.66 2.72 2.77 2.83 2.88 2.94 3.00 3.06 3.12
4 3.28 3.37 3.45 3.54 3.63 3.72 3.81 3.90 4.00 4.10 4.20
5 3.95 4.07 4.19 4.32 4.45 4.58 4.72 4.86 5.00 5.15 5.30
6 4.56 4.72 4.89 5.06 5.24 5.42 5.61 5.80 6.00 6.21 6.42
7 5.13 5.33 5.55 5.77 5.99 6.23 6.48 6.73 7.00 7.28 7.57
8 5.66 5.90 6.16 6.44 6.72 7.02 7.33 7.66 8.00 8.36 8.73
9 6.14 6.44 6.75 7.08 7.42 7.79 8.17 8.57 9.00 9.45 9.92
10 6.58 6.93 7.30 7.68 8.09 8.53 8.99 9.48 10.00 10.55 11.13
aOM B discount rate as of February 2002 .
Short-term discount rate based on OMB discount rate for 7-year study period.
10
Table A-3c. UPV* factors for finding the present value of annually recurring amounts changing at a constant escalation rate, OMB long-term discount rate.
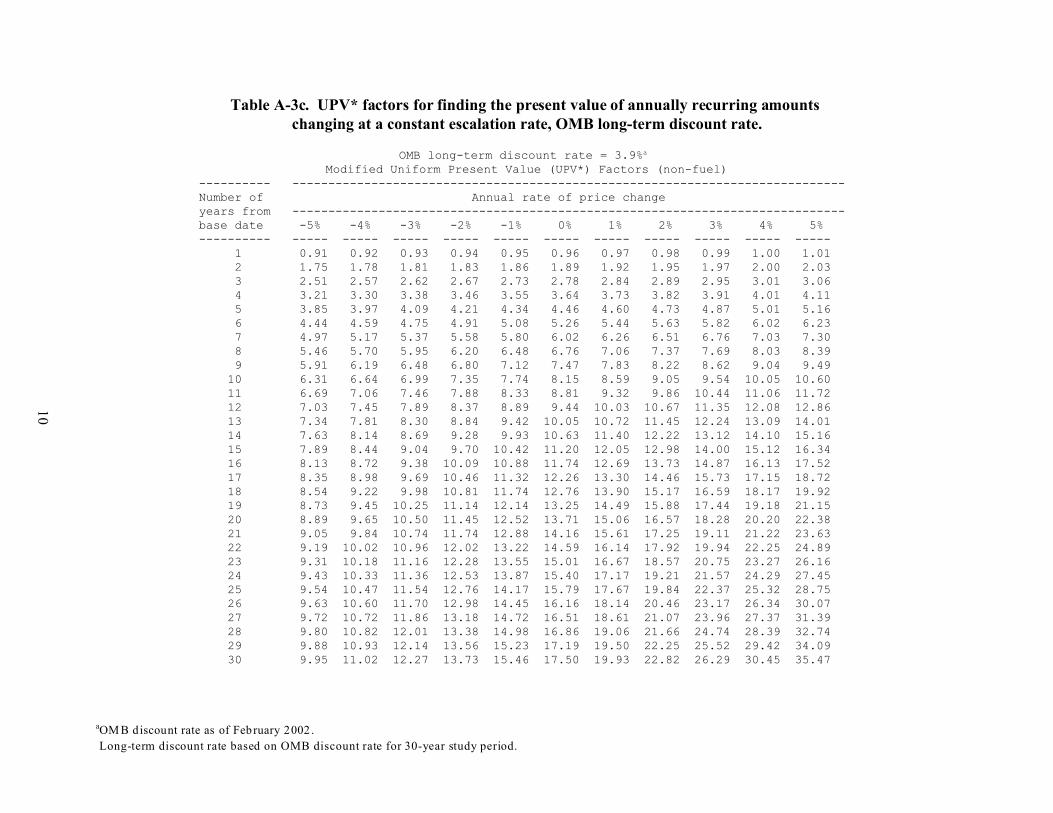
OMB long-term discount rate = 3.9%a Modified Uniform Present Value (UPV*) Factors (non-fuel)
---------- ----------------------------------------------------------------------------- Number of Annual rate of price change years from ----------------------------------------------------------------------------- base date -5% -4% -3% -2% -1% 0% 1% 2% 3% 4% 5% ---------- ----- ----- ----- ----- ----- ----- ----- ----- ----- ----- ----- 1 0.91 0.92 0.93 0.94 0.95 0.96 0.97 0.98 0.99 1.00 1.01 2 1.75 1.78 1.81 1.83 1.86 1.89 1.92 1.95 1.97 2.00 2.03 3 2.51 2.57 2.62 2.67 2.73 2.78 2.84 2.89 2.95 3.01 3.06 4 3.21 3.30 3.38 3.46 3.55 3.64 3.73 3.82 3.91 4.01 4.11 5 3.85 3.97 4.09 4.21 4.34 4.46 4.60 4.73 4.87 5.01 5.16 6 4.44 4.59 4.75 4.91 5.08 5.26 5.44 5.63 5.82 6.02 6.23 7 4.97 5.17 5.37 5.58 5.80 6.02 6.26 6.51 6.76 7.03 7.30 8 5.46 5.70 5.95 6.20 6.48 6.76 7.06 7.37 7.69 8.03 8.39 9 5.91 6.19 6.48 6.80 7.12 7.47 7.83 8.22 8.62 9.04 9.49 10 6.31 6.64 6.99 7.35 7.74 8.15 8.59 9.05 9.54 10.05 10.60 11 6.69 7.06 7.46 7.88 8.33 8.81 9.32 9.86 10.44 11.06 11.72 12 7.03 7.45 7.89 8.37 8.89 9.44 10.03 10.67 11.35 12.08 12.86 13 7.34 7.81 8.30 8.84 9.42 10.05 10.72 11.45 12.24 13.09 14.01 14 7.63 8.14 8.69 9.28 9.93 10.63 11.40 12.22 13.12 14.10 15.16 15 7.89 8.44 9.04 9.70 10.42 11.20 12.05 12.98 14.00 15.12 16.34 16 8.13 8.72 9.38 10.09 10.88 11.74 12.69 13.73 14.87 16.13 17.52 17 8.35 8.98 9.69 10.46 11.32 12.26 13.30 14.46 15.73 17.15 18.72 18 8.54 9.22 9.98 10.81 11.74 12.76 13.90 15.17 16.59 18.17 19.92 19 8.73 9.45 10.25 11.14 12.14 13.25 14.49 15.88 17.44 19.18 21.15 20 8.89 9.65 10.50 11.45 12.52 13.71 15.06 16.57 18.28 20.20 22.38 21 9.05 9.84 10.74 11.74 12.88 14.16 15.61 17.25 19.11 21.22 23.63 22 9.19 10.02 10.96 12.02 13.22 14.59 16.14 17.92 19.94 22.25 24.89 23 9.31 10.18 11.16 12.28 13.55 15.01 16.67 18.57 20.75 23.27 26.16 24 9.43 10.33 11.36 12.53 13.87 15.40 17.17 19.21 21.57 24.29 27.45 25 9.54 10.47 11.54 12.76 14.17 15.79 17.67 19.84 22.37 25.32 28.75 26 9.63 10.60 11.70 12.98 14.45 16.16 18.14 20.46 23.17 26.34 30.07 27 9.72 10.72 11.86 13.18 14.72 16.51 18.61 21.07 23.96 27.37 31.39 28 9.80 10.82 12.01 13.38 14.98 16.86 19.06 21.66 24.74 28.39 32.74 29 9.88 10.93 12.14 13.56 15.23 17.19 19.50 22.25 25.52 29.42 34.09 30 9.95 11.02 12.27 13.73 15.46 17.50 19.93 22.82 26.29 30.45 35.47
aOM B discount rate as of February 2002 .
Long-term discount rate based on OMB discount rate for 30-year study period.

1 Energy Information Administration, Annual Energy Outlook 2002, DOE/EIA-0383(2002), December 2001.
11
B. Modified Uniform Present Value Factors for Fuel Costs
This section presents FEMP and OMB modified uniform present value (UPV*) discount factors forcalculating the present value of energy usage for federal projects. Factors are provided for the fourmajor Census regions and for the overall United States. The factors are modified in the sense thatthey incorporate energy price escalation rates based on future energy prices projected by DOE forthe years 2002-2032. There are two sets of UPV* tables: the "Ba" tables present FEMP UPV* factorsbased on the DOE discount rate (3.2% real), and the "Bb" tables present OMB UPV* factors basedon two OMB discount rates (3.0% real for short-term study periods of 1 to 10 years, 3.9% real forlong-term study periods of 11 to 30 years). The underlying energy price indices for the years 2002to 2032 on which these UPV* calculations are based are shown in tables Ca-1 through Ca-5. Thecorresponding average energy price escalation rates for selected time intervals between 2002 and2032 are shown in tables Cb-1 through Cb-5.
Energy Price Projections
The FEMP and OMB UPV* factors incorporate energy price escalation rates computed from futureenergy prices projected by the Energy Information Administration (EIA) of the U.S. Department ofEnergy. Energy prices through 2020 were generated by EIA using the National Energy ModelingSystem (NEMS) and published in the Annual Energy Outlook 20021 (AEO2002). At the request ofFEMP, EIA extrapolated energy prices after the year 2020 from the AEO2002 data.
NEMS is an energy market model designed to project the impacts of alternative energy policies orassumptions on U.S. energy markets. NEMS produces projections of the U.S. energy future, givencurrent laws and policies and other key assumptions, including macroeconomic indicators from DataResources, Inc., the production policy of the Organization of Petroleum Exporting Countries, the sizeof the economically recoverable resource base for fossil fuels, and the rate of development andpenetration of new technologies. NEMS balances energy supply and demands with modulesrepresenting primary fuel supply, end-use demand for four sectors, and conversion of energy byrefineries and electricity generators. Macroeconomic and international oil modules reflect theimpacts of energy prices, production, and consumption on world oil markets and the economy.
In order to produce price projections to 2032, EIA extrapolated the prices from the AEO2002 withspecific assumptions about long-term trends. To provide long-term price expectations to the post-2020 projections, world oil price expectations through 2050 were calculated using assumptions ofworld oil supply and demand. These expectations were used as the basis for the 2032 projections ofpetroleum product prices, using the implied 2020 refinery markups to calculate the regional end-useprices.
The EIA energy price projections presented in this report, like those of other forecasters, aredependent on the data, methodologies, and specific assumptions used in their development. Many

2 For greater precision, the UPV* factors reported in the Ba and Bb tables were computed using the unrounded form
of the indices given in Tables Ca-1 through Ca-5.
3While the UPV* factors provided in this publication were computed using energy price indices that correspond to
energy prices as of April 1 in the current and future years, the analyst is encouraged to use for determining A0 the energy
prices prevailing as of the base date of the LCC analysis for the project evaluated.
12
of the assumptions concerning the future cannot be known with any degree of certainty. Thus, theprojections are not statements of what will happen, but what might happen given the particularassumptions and methodologies used. Although EIA has endeavored to make these forecasts asobjective, reliable, and useful as possible, these projections should serve as an adjunct to, not asubstitute for, the analytical process. The AEO2002 was prepared by EIA as required under statuteby federal legislation. The price projections to 2032 were prepared in accordance with a ServiceRequest from the Federal Energy Management Program.
UPV* Calculation Method The formula for finding the present value (P) of future energy costs or savings is the following:
where Ao = annual cost of energy as of the base date (April 1, 2002); t = index used to designate the year of energy usage;
N = number of periods, e.g., years, over which energy costs or savings accrue;I(2002+t) = projected average fuel price index2 given in Tables Ca-1 through Ca-5
for the year 2002+t (where I2002 = 1.00); and d = the real discount rate.
This formula is based on end-of-year energy prices and end-of-year discounting. Note that annualenergy costs as of the base date of the LCC analysis (A0, to be supplied by the analyst) should reflectthe current energy price schedule as of that date, which may not be the same as the energy price itselfon that date.3 That is, the annual energy cost should reflect summer-winter rate differences, time-of-use rates, block rates considerations, and demand charges (as appropriate) anticipated to be in effectthat year. If energy and demand costs are calculated separately (as is sometimes done for electricity),the UPV* factor should be applied to both costs.
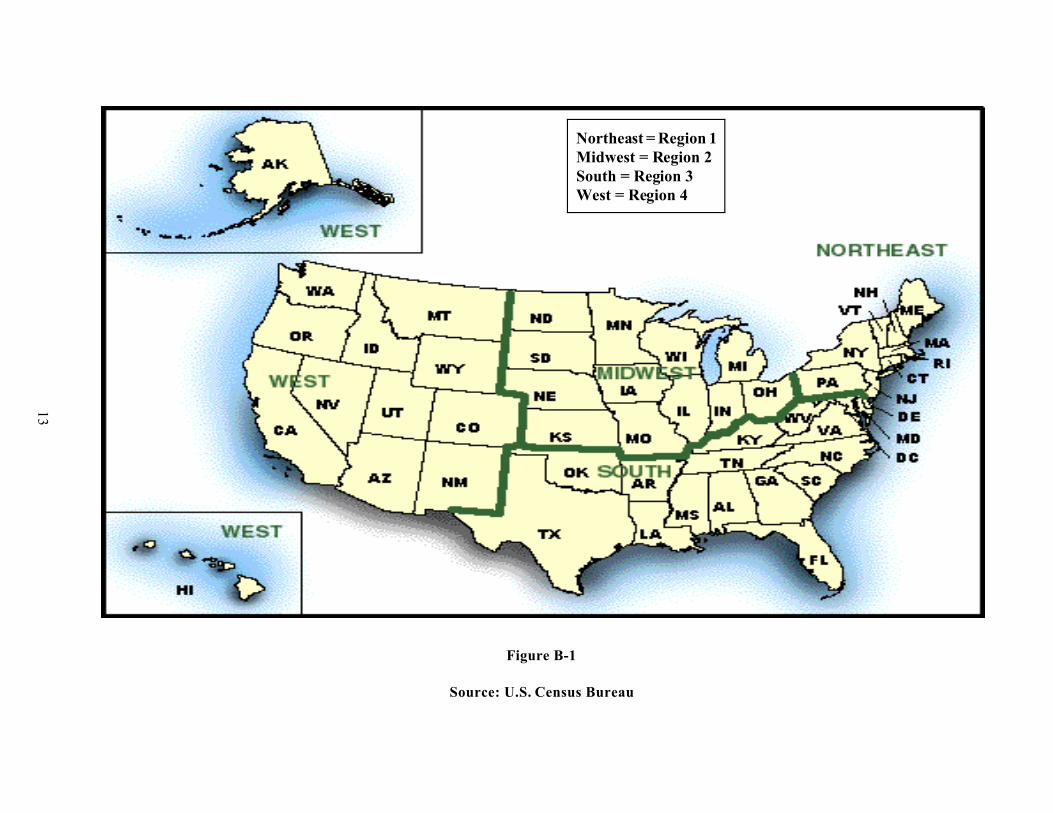
The data in the tables that follow are reported for the four Census regions and the U.S. average.Figure B-1 presents a map showing the states corresponding to the four Census regions. The Censusregions do not include American Samoa, Canal Zone, Guam, Puerto Rico, Trust Territory of thePacific Islands, or the Virgin Islands. Analysts of federal projects in these areas should use data thatare "reasonable under the circumstances," and may refer to the tables with U.S. average data forguidance.
13
Northeast = Region 1Midwest = Region 2South = Region 3West = Region 4
Figure B-1
Source: U.S. Census Bureau

14
B.1.FEMP Modified Uniform Present Value Factors
The FEMP Modified Uniform Present Value (FEMP UPV*) factors presented in the "Ba" tables, basedon the current DOE discount rate (3.2%), are for calculating the present value of energy costs or savingsaccruing over 1 to 25 years and are to be used in life-cycle cost analyses of federal energy conservationand renewable energy projects. Factors are reported in the "Ba" tables for 30 years to accommodate aplanning/design/construction period of up to 5 years. (See "Examples of How to Use FEMP UPV*
Factors" below for instructions on use with planning/design/construction periods.)
These factors apply only to annual energy usage or energy savings that are assumed to be the same eachyear over the service period. The NIST BLCC computer program can compute the present value of energyusage and savings which are not the same in each year.
Examples of How to Use the FEMP UPV* Factors:
FEMP UPV*, no planning/design/construction period: To compute the present value of heating withnatural gas over 25 years in a federal office building in New Mexico, go to Table Ba-4, find the FEMPUPV* factor for commercial natural gas for 25 years (16.98), and multiply this factor by the annualheating cost at base-date natural gas prices.
FEMP UPV*, with planning/design/construction period: To compute a present value factor for a serviceperiod following a planning/design/construction period (1) find the FEMP UPV* factor for the combinedlength of the planning/design/construction period and the service period (not to exceed 30 years), and (2)subtract from (1) the FEMP UPV* factor for the planning/design/ construction period alone. Thedifference is the FEMP UPV* factor for the years over which energy costs or savings actually accrue. Forexample, suppose a new federal office building in New York is being evaluated with several energyconserving design options. It is expected to have a planning/design/construction period of 5 years, afterwhich it will be occupied for at least 25 years. To compute the present value of natural gas costs over 25years of occupancy, go to Table Ba-1 and find the FEMP UPV* factors for commercial natural gas for5 years (4.42) and for 30 years (19.57). The difference (15.15) is the FEMP UPV* factor for natural gascosts over 25 years, beginning 5 years after the base date. Multiply 15.15 by the annual natural gas costat base-date prices (not occupancy-date prices) to calculate the present value of natural gas costs over theentire 25-year occupancy period.
15
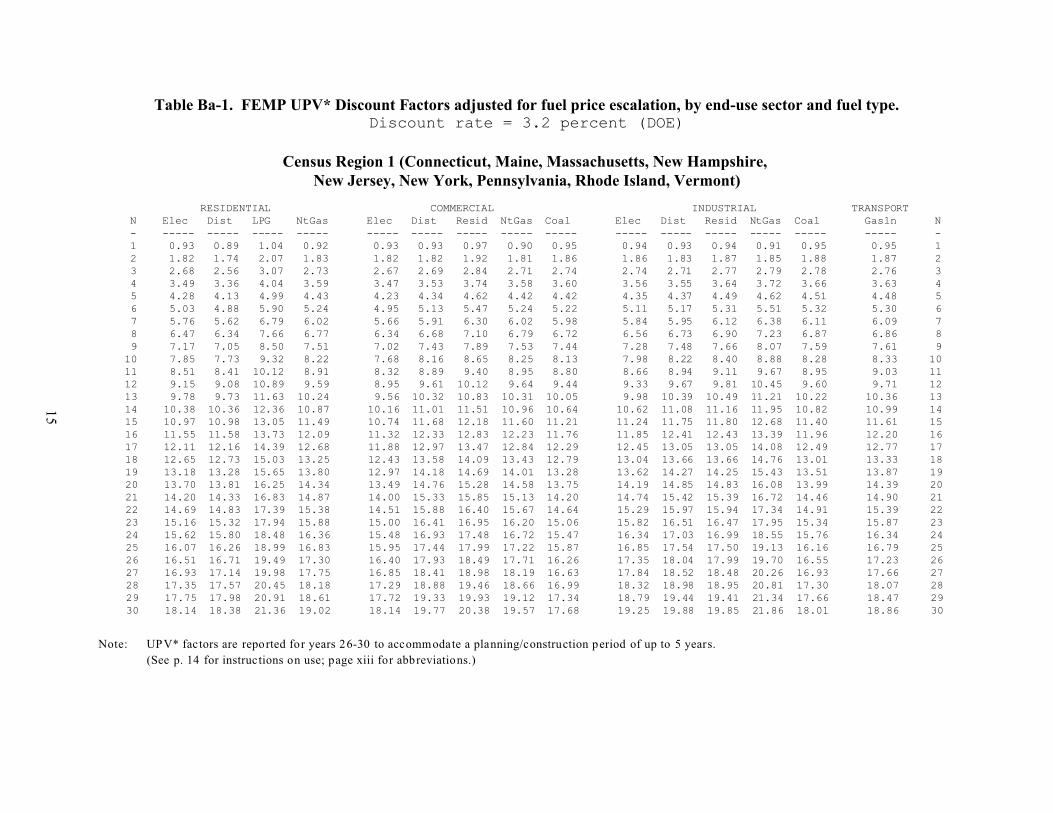
Table Ba-1. FEMP UPV* Discount Factors adjusted for fuel price escalation, by end-use sector and fuel type.Discount rate = 3.2 percent (DOE)
Census Region 1 (Connecticut, Maine, Massachusetts, New Hampshire, New Jersey, New York, Pennsylvania, Rhode Island, Vermont)
RESIDENTIAL COMMERCIAL INDUSTRIAL TRANSPORT N Elec Dist LPG NtGas Elec Dist Resid NtGas Coal Elec Dist Resid NtGas Coal Gasln N - ----- ----- ----- ----- ----- ----- ----- ----- ----- ----- ----- ----- ----- ----- ----- - 1 0.93 0.89 1.04 0.92 0.93 0.93 0.97 0.90 0.95 0.94 0.93 0.94 0.91 0.95 0.95 1 2 1.82 1.74 2.07 1.83 1.82 1.82 1.92 1.81 1.86 1.86 1.83 1.87 1.85 1.88 1.87 2 3 2.68 2.56 3.07 2.73 2.67 2.69 2.84 2.71 2.74 2.74 2.71 2.77 2.79 2.78 2.76 3 4 3.49 3.36 4.04 3.59 3.47 3.53 3.74 3.58 3.60 3.56 3.55 3.64 3.72 3.66 3.63 4 5 4.28 4.13 4.99 4.43 4.23 4.34 4.62 4.42 4.42 4.35 4.37 4.49 4.62 4.51 4.48 5 6 5.03 4.88 5.90 5.24 4.95 5.13 5.47 5.24 5.22 5.11 5.17 5.31 5.51 5.32 5.30 6 7 5.76 5.62 6.79 6.02 5.66 5.91 6.30 6.02 5.98 5.84 5.95 6.12 6.38 6.11 6.09 7 8 6.47 6.34 7.66 6.77 6.34 6.68 7.10 6.79 6.72 6.56 6.73 6.90 7.23 6.87 6.86 8 9 7.17 7.05 8.50 7.51 7.02 7.43 7.89 7.53 7.44 7.28 7.48 7.66 8.07 7.59 7.61 910 7.85 7.73 9.32 8.22 7.68 8.16 8.65 8.25 8.13 7.98 8.22 8.40 8.88 8.28 8.33 1011 8.51 8.41 10.12 8.91 8.32 8.89 9.40 8.95 8.80 8.66 8.94 9.11 9.67 8.95 9.03 1112 9.15 9.08 10.89 9.59 8.95 9.61 10.12 9.64 9.44 9.33 9.67 9.81 10.45 9.60 9.71 1213 9.78 9.73 11.63 10.24 9.56 10.32 10.83 10.31 10.05 9.98 10.39 10.49 11.21 10.22 10.36 1314 10.38 10.36 12.36 10.87 10.16 11.01 11.51 10.96 10.64 10.62 11.08 11.16 11.95 10.82 10.99 1415 10.97 10.98 13.05 11.49 10.74 11.68 12.18 11.60 11.21 11.24 11.75 11.80 12.68 11.40 11.61 1516 11.55 11.58 13.73 12.09 11.32 12.33 12.83 12.23 11.76 11.85 12.41 12.43 13.39 11.96 12.20 1617 12.11 12.16 14.39 12.68 11.88 12.97 13.47 12.84 12.29 12.45 13.05 13.05 14.08 12.49 12.77 1718 12.65 12.73 15.03 13.25 12.43 13.58 14.09 13.43 12.79 13.04 13.66 13.66 14.76 13.01 13.33 1819 13.18 13.28 15.65 13.80 12.97 14.18 14.69 14.01 13.28 13.62 14.27 14.25 15.43 13.51 13.87 1920 13.70 13.81 16.25 14.34 13.49 14.76 15.28 14.58 13.75 14.19 14.85 14.83 16.08 13.99 14.39 2021 14.20 14.33 16.83 14.87 14.00 15.33 15.85 15.13 14.20 14.74 15.42 15.39 16.72 14.46 14.90 2122 14.69 14.83 17.39 15.38 14.51 15.88 16.40 15.67 14.64 15.29 15.97 15.94 17.34 14.91 15.39 2223 15.16 15.32 17.94 15.88 15.00 16.41 16.95 16.20 15.06 15.82 16.51 16.47 17.95 15.34 15.87 2324 15.62 15.80 18.48 16.36 15.48 16.93 17.48 16.72 15.47 16.34 17.03 16.99 18.55 15.76 16.34 2425 16.07 16.26 18.99 16.83 15.95 17.44 17.99 17.22 15.87 16.85 17.54 17.50 19.13 16.16 16.79 2526 16.51 16.71 19.49 17.30 16.40 17.93 18.49 17.71 16.26 17.35 18.04 17.99 19.70 16.55 17.23 2627 16.93 17.14 19.98 17.75 16.85 18.41 18.98 18.19 16.63 17.84 18.52 18.48 20.26 16.93 17.66 2728 17.35 17.57 20.45 18.18 17.29 18.88 19.46 18.66 16.99 18.32 18.98 18.95 20.81 17.30 18.07 2829 17.75 17.98 20.91 18.61 17.72 19.33 19.93 19.12 17.34 18.79 19.44 19.41 21.34 17.66 18.47 2930 18.14 18.38 21.36 19.02 18.14 19.77 20.38 19.57 17.68 19.25 19.88 19.85 21.86 18.01 18.86 30
Note: UPV* factors are reported for years 26-30 to accommodate a planning/construction period of up to 5 years.
(See p. 14 for instructions on use; page xiii for abbreviations.)

16
Table Ba-2. FEMP UPV* Discount Factors adjusted for fuel price escalation, by end-use sector and fuel type.Discount Rate = 3.2 percent (DOE)
Census Region 2 (Illinois, Indiana, Iowa, Kansas, Michigan, Minnesota, Missouri, Nebraska, North Dakota, Ohio, South Dakota, Wisconsin)
RESIDENTIAL COMMERCIAL INDUSTRIAL TRANSPORT N Elec Dist LPG NtGas Elec Dist Resid NtGas Coal Elec Dist Resid NtGas Coal Gasln N - ----- ----- ----- ----- ----- ----- ----- ----- ----- ----- ----- ----- ----- ----- ----- - 1 0.94 0.88 0.97 0.92 0.97 0.92 0.94 0.92 0.96 0.97 0.93 0.94 0.92 0.95 0.93 1 2 1.84 1.72 1.92 1.85 1.90 1.80 1.86 1.84 1.88 1.92 1.82 1.86 1.89 1.85 1.83 2 3 2.71 2.53 2.85 2.75 2.81 2.66 2.76 2.74 2.76 2.84 2.69 2.75 2.85 2.74 2.71 3 4 3.55 3.31 3.74 3.62 3.67 3.49 3.63 3.62 3.60 3.72 3.53 3.62 3.79 3.58 3.58 4 5 4.38 4.08 4.61 4.46 4.50 4.30 4.48 4.46 4.42 4.56 4.35 4.47 4.70 4.39 4.42 5 6 5.17 4.83 5.46 5.28 5.29 5.10 5.31 5.27 5.19 5.39 5.16 5.30 5.60 5.18 5.24 6 7 5.94 5.56 6.28 6.07 6.07 5.88 6.12 6.06 5.94 6.18 5.95 6.11 6.48 5.93 6.03 7 8 6.69 6.29 7.09 6.83 6.82 6.67 6.91 6.82 6.66 6.96 6.74 6.89 7.34 6.65 6.80 8 9 7.42 7.01 7.87 7.57 7.55 7.44 7.68 7.57 7.36 7.72 7.51 7.66 8.18 7.35 7.55 910 8.12 7.70 8.65 8.30 8.26 8.19 8.43 8.29 8.04 8.47 8.27 8.41 9.01 8.03 8.27 1011 8.81 8.39 9.40 9.00 8.96 8.95 9.16 9.00 8.68 9.19 9.02 9.13 9.82 8.68 8.97 1112 9.47 9.08 10.13 9.69 9.64 9.70 9.87 9.69 9.31 9.90 9.78 9.84 10.62 9.30 9.65 1213 10.10 9.76 10.84 10.35 10.29 10.46 10.57 10.36 9.90 10.58 10.53 10.54 11.39 9.90 10.31 1314 10.72 10.43 11.53 11.00 10.92 11.20 11.24 11.01 10.48 11.25 11.27 11.21 12.15 10.48 10.94 1415 11.32 11.08 12.21 11.63 11.53 11.93 11.90 11.64 11.03 11.90 12.00 11.87 12.90 11.04 11.56 1516 11.90 11.72 12.86 12.25 12.14 12.63 12.55 12.26 11.56 12.54 12.70 12.51 13.62 11.58 12.16 1617 12.47 12.33 13.50 12.84 12.72 13.32 13.17 12.87 12.07 13.16 13.38 13.13 14.33 12.09 12.74 1718 13.02 12.93 14.12 13.43 13.29 13.99 13.79 13.45 12.56 13.76 14.05 13.74 15.02 12.59 13.30 1819 13.56 13.52 14.72 13.99 13.84 14.65 14.38 14.03 13.04 14.36 14.70 14.33 15.71 13.07 13.85 1920 14.08 14.09 15.31 14.55 14.37 15.29 14.96 14.59 13.50 14.93 15.33 14.91 16.37 13.53 14.38 2021 14.58 14.64 15.88 15.09 14.90 15.91 15.53 15.14 13.94 15.49 15.94 15.47 17.03 13.97 14.89 2122 15.07 15.18 16.43 15.61 15.40 16.51 16.08 15.67 14.36 16.04 16.54 16.02 17.67 14.40 15.39 2223 15.54 15.70 16.96 16.13 15.89 17.10 16.62 16.20 14.77 16.58 17.12 16.56 18.29 14.82 15.88 2324 16.00 16.20 17.48 16.63 16.37 17.67 17.15 16.71 15.17 17.10 17.69 17.08 18.91 15.22 16.35 2425 16.45 16.70 17.99 17.12 16.84 18.22 17.66 17.21 15.56 17.61 18.24 17.59 19.51 15.61 16.81 2526 16.88 17.18 18.48 17.60 17.29 18.76 18.16 17.69 15.93 18.10 18.77 18.09 20.10 15.98 17.25 2627 17.30 17.64 18.95 18.07 17.73 19.28 18.65 18.17 16.29 18.59 19.29 18.58 20.67 16.35 17.68 2728 17.71 18.09 19.42 18.52 18.16 19.80 19.13 18.63 16.64 19.06 19.79 19.05 21.24 16.70 18.10 2829 18.10 18.53 19.86 18.97 18.58 20.29 19.59 19.09 16.98 19.52 20.29 19.51 21.79 17.05 18.51 2930 18.48 18.96 20.30 19.40 18.99 20.77 20.05 19.53 17.31 19.97 20.76 19.96 22.33 17.38 18.90 30
Note: UPV* factors are reported for years 26-30 to accommodate a planning/construction period of up to 5 years.
(See p. 14 for instructions on use; page xiii for abbreviations.)

17
Table Ba-3. FEMP UPV* Discount Factors adjusted for fuel price escalation, by end-use sector and fuel type.Discount Rate = 3.2 percent (DOE)
Census Region 3 (Alabama, Arkansas, Delaware, District of Columbia, Florida, Georgia, Kentucky, Louisiana, Maryland, Mississippi, North Carolina, Oklahoma, South Carolina,
Tennessee, Texas, Virginia, West Virginia)
RESIDENTIAL COMMERCIAL INDUSTRIAL TRANSPORT N Elec Dist LPG NtGas Elec Dist Resid NtGas Coal Elec Dist Resid NtGas Coal Gasln N - ----- ----- ----- ----- ----- ----- ----- ----- ----- ----- ----- ----- ----- ----- ----- - 1 0.94 0.88 1.02 0.93 0.95 0.91 0.97 0.92 0.96 0.95 0.92 0.98 0.93 0.96 0.93 1 2 1.85 1.72 2.03 1.86 1.87 1.79 1.93 1.85 1.87 1.89 1.80 1.95 1.92 1.88 1.83 2 3 2.74 2.54 3.00 2.76 2.77 2.64 2.86 2.76 2.73 2.80 2.66 2.89 2.92 2.76 2.70 3 4 3.59 3.33 3.95 3.63 3.63 3.46 3.77 3.64 3.56 3.68 3.49 3.81 3.90 3.60 3.56 4 5 4.42 4.10 4.87 4.48 4.46 4.27 4.65 4.49 4.36 4.52 4.31 4.71 4.85 4.42 4.40 5 6 5.23 4.85 5.76 5.29 5.25 5.06 5.51 5.31 5.13 5.33 5.10 5.58 5.79 5.20 5.22 6 7 6.01 5.59 6.63 6.08 6.03 5.84 6.35 6.10 5.86 6.12 5.89 6.42 6.72 5.96 6.01 7 8 6.76 6.32 7.47 6.84 6.77 6.62 7.16 6.87 6.57 6.89 6.68 7.25 7.63 6.68 6.77 8 9 7.49 7.03 8.30 7.58 7.50 7.39 7.96 7.62 7.26 7.63 7.44 8.05 8.53 7.39 7.51 910 8.20 7.73 9.10 8.30 8.20 8.14 8.73 8.36 7.92 8.35 8.20 8.83 9.42 8.06 8.23 1011 8.88 8.42 9.89 9.00 8.88 8.88 9.49 9.07 8.56 9.06 8.95 9.59 10.30 8.72 8.93 1112 9.54 9.10 10.64 9.68 9.54 9.63 10.22 9.76 9.17 9.73 9.70 10.33 11.15 9.34 9.60 1213 10.18 9.77 11.38 10.34 10.18 10.38 10.94 10.44 9.76 10.39 10.45 11.06 11.98 9.94 10.26 1314 10.80 10.43 12.10 10.98 10.80 11.11 11.64 11.09 10.33 11.03 11.18 11.76 12.79 10.52 10.89 1415 11.41 11.07 12.80 11.60 11.41 11.82 12.32 11.73 10.87 11.66 11.90 12.44 13.59 11.08 11.50 1516 11.99 11.70 13.48 12.20 12.00 12.52 12.98 12.36 11.40 12.27 12.60 13.11 14.38 11.62 12.10 1617 12.57 12.30 14.14 12.79 12.58 13.20 13.63 12.97 11.90 12.87 13.28 13.76 15.15 12.14 12.68 1718 13.12 12.89 14.78 13.36 13.14 13.86 14.26 13.56 12.38 13.45 13.95 14.39 15.91 12.63 13.24 1819 13.66 13.46 15.40 13.92 13.68 14.50 14.88 14.14 12.85 14.01 14.60 15.01 16.66 13.11 13.78 1920 14.19 14.02 16.00 14.46 14.22 15.13 15.48 14.71 13.30 14.56 15.23 15.61 17.39 13.57 14.31 2021 14.69 14.56 16.58 14.99 14.73 15.73 16.06 15.27 13.73 15.10 15.84 16.20 18.11 14.02 14.82 2122 15.19 15.08 17.15 15.51 15.24 16.32 16.63 15.81 14.15 15.62 16.43 16.77 18.81 14.45 15.31 2223 15.67 15.59 17.70 16.01 15.72 16.90 17.19 16.33 14.55 16.13 17.01 17.32 19.51 14.86 15.80 2324 16.13 16.09 18.24 16.50 16.20 17.46 17.73 16.85 14.94 16.62 17.58 17.87 20.18 15.26 16.27 2425 16.58 16.57 18.76 16.98 16.66 18.00 18.26 17.35 15.32 17.10 18.12 18.40 20.85 15.65 16.72 2526 17.02 17.04 19.26 17.44 17.11 18.53 18.77 17.84 15.69 17.56 18.66 18.91 21.50 16.03 17.16 2627 17.44 17.49 19.75 17.90 17.54 19.04 19.28 18.32 16.04 18.02 19.17 19.42 22.14 16.39 17.59 2728 17.85 17.93 20.22 18.34 17.97 19.54 19.77 18.79 16.39 18.46 19.68 19.91 22.76 16.75 18.01 2829 18.25 18.36 20.68 18.77 18.38 20.03 20.24 19.24 16.72 18.89 20.17 20.39 23.37 17.09 18.41 2930 18.64 18.78 21.13 19.19 18.78 20.50 20.71 19.69 17.05 19.31 20.64 20.85 23.97 17.42 18.81 30
Note: UPV* factors are reported for years 26-30 to accommodate a planning/construction period of up to 5 years.
(See p. 14 for instructions on use; page xiii for abbreviations.)
18
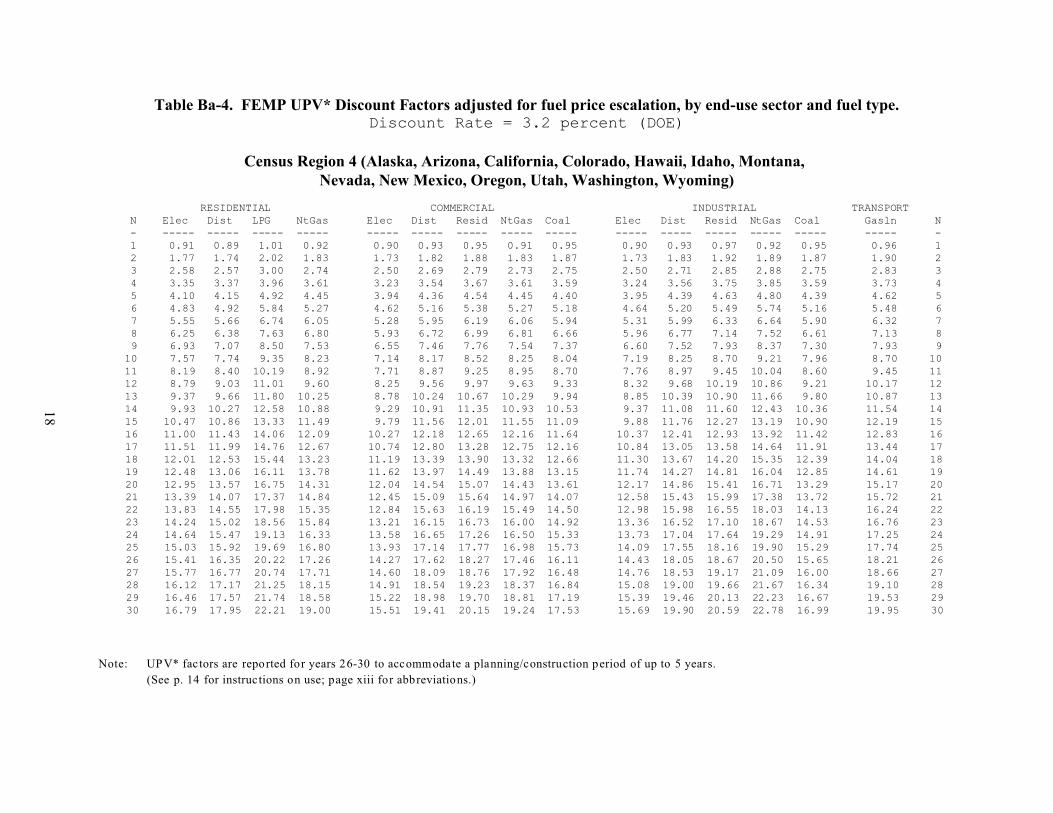
Table Ba-4. FEMP UPV* Discount Factors adjusted for fuel price escalation, by end-use sector and fuel type.Discount Rate = 3.2 percent (DOE)
Census Region 4 (Alaska, Arizona, California, Colorado, Hawaii, Idaho, Montana, Nevada, New Mexico, Oregon, Utah, Washington, Wyoming)
RESIDENTIAL COMMERCIAL INDUSTRIAL TRANSPORT N Elec Dist LPG NtGas Elec Dist Resid NtGas Coal Elec Dist Resid NtGas Coal Gasln N - ----- ----- ----- ----- ----- ----- ----- ----- ----- ----- ----- ----- ----- ----- ----- - 1 0.91 0.89 1.01 0.92 0.90 0.93 0.95 0.91 0.95 0.90 0.93 0.97 0.92 0.95 0.96 1 2 1.77 1.74 2.02 1.83 1.73 1.82 1.88 1.83 1.87 1.73 1.83 1.92 1.89 1.87 1.90 2 3 2.58 2.57 3.00 2.74 2.50 2.69 2.79 2.73 2.75 2.50 2.71 2.85 2.88 2.75 2.83 3 4 3.35 3.37 3.96 3.61 3.23 3.54 3.67 3.61 3.59 3.24 3.56 3.75 3.85 3.59 3.73 4 5 4.10 4.15 4.92 4.45 3.94 4.36 4.54 4.45 4.40 3.95 4.39 4.63 4.80 4.39 4.62 5 6 4.83 4.92 5.84 5.27 4.62 5.16 5.38 5.27 5.18 4.64 5.20 5.49 5.74 5.16 5.48 6 7 5.55 5.66 6.74 6.05 5.28 5.95 6.19 6.06 5.94 5.31 5.99 6.33 6.64 5.90 6.32 7 8 6.25 6.38 7.63 6.80 5.93 6.72 6.99 6.81 6.66 5.96 6.77 7.14 7.52 6.61 7.13 8 9 6.93 7.07 8.50 7.53 6.55 7.46 7.76 7.54 7.37 6.60 7.52 7.93 8.37 7.30 7.93 910 7.57 7.74 9.35 8.23 7.14 8.17 8.52 8.25 8.04 7.19 8.25 8.70 9.21 7.96 8.70 1011 8.19 8.40 10.19 8.92 7.71 8.87 9.25 8.95 8.70 7.76 8.97 9.45 10.04 8.60 9.45 1112 8.79 9.03 11.01 9.60 8.25 9.56 9.97 9.63 9.33 8.32 9.68 10.19 10.86 9.21 10.17 1213 9.37 9.66 11.80 10.25 8.78 10.24 10.67 10.29 9.94 8.85 10.39 10.90 11.66 9.80 10.87 1314 9.93 10.27 12.58 10.88 9.29 10.91 11.35 10.93 10.53 9.37 11.08 11.60 12.43 10.36 11.54 1415 10.47 10.86 13.33 11.49 9.79 11.56 12.01 11.55 11.09 9.88 11.76 12.27 13.19 10.90 12.19 1516 11.00 11.43 14.06 12.09 10.27 12.18 12.65 12.16 11.64 10.37 12.41 12.93 13.92 11.42 12.83 1617 11.51 11.99 14.76 12.67 10.74 12.80 13.28 12.75 12.16 10.84 13.05 13.58 14.64 11.91 13.44 1718 12.01 12.53 15.44 13.23 11.19 13.39 13.90 13.32 12.66 11.30 13.67 14.20 15.35 12.39 14.04 1819 12.48 13.06 16.11 13.78 11.62 13.97 14.49 13.88 13.15 11.74 14.27 14.81 16.04 12.85 14.61 1920 12.95 13.57 16.75 14.31 12.04 14.54 15.07 14.43 13.61 12.17 14.86 15.41 16.71 13.29 15.17 2021 13.39 14.07 17.37 14.84 12.45 15.09 15.64 14.97 14.07 12.58 15.43 15.99 17.38 13.72 15.72 2122 13.83 14.55 17.98 15.35 12.84 15.63 16.19 15.49 14.50 12.98 15.98 16.55 18.03 14.13 16.24 2223 14.24 15.02 18.56 15.84 13.21 16.15 16.73 16.00 14.92 13.36 16.52 17.10 18.67 14.53 16.76 2324 14.64 15.47 19.13 16.33 13.58 16.65 17.26 16.50 15.33 13.73 17.04 17.64 19.29 14.91 17.25 2425 15.03 15.92 19.69 16.80 13.93 17.14 17.77 16.98 15.73 14.09 17.55 18.16 19.90 15.29 17.74 2526 15.41 16.35 20.22 17.26 14.27 17.62 18.27 17.46 16.11 14.43 18.05 18.67 20.50 15.65 18.21 2627 15.77 16.77 20.74 17.71 14.60 18.09 18.76 17.92 16.48 14.76 18.53 19.17 21.09 16.00 18.66 2728 16.12 17.17 21.25 18.15 14.91 18.54 19.23 18.37 16.84 15.08 19.00 19.66 21.67 16.34 19.10 2829 16.46 17.57 21.74 18.58 15.22 18.98 19.70 18.81 17.19 15.39 19.46 20.13 22.23 16.67 19.53 2930 16.79 17.95 22.21 19.00 15.51 19.41 20.15 19.24 17.53 15.69 19.90 20.59 22.78 16.99 19.95 30
Note: UPV* factors are reported for years 26-30 to accommodate a planning/construction period of up to 5 years.
(See p. 14 for instructions on use; page xiii for abbreviations.)

19
Table Ba-5. FEMP UPV* Discount Factors adjusted for fuel price escalation, by end-use sector and fuel type.Discount Rate = 3.2 percent (DOE)
United States Average
RESIDENTIAL COMMERCIAL INDUSTRIAL TRANSPORT N Elec Dist LPG NtGas Elec Dist Resid NtGas Coal Elec Dist Resid NtGas Coal Gasln N - ----- ----- ----- ----- ----- ----- ----- ----- ----- ----- ----- ----- ----- ----- ----- - 1 0.93 0.89 1.00 0.92 0.93 0.92 0.96 0.92 0.95 0.94 0.92 0.97 0.93 0.96 0.94 1 2 1.83 1.74 1.99 1.84 1.83 1.81 1.91 1.84 1.87 1.86 1.81 1.92 1.90 1.87 1.85 2 3 2.69 2.56 2.95 2.74 2.69 2.67 2.83 2.74 2.74 2.74 2.68 2.84 2.89 2.76 2.74 3 4 3.52 3.35 3.88 3.61 3.50 3.51 3.72 3.61 3.58 3.58 3.52 3.74 3.85 3.61 3.62 4 5 4.32 4.13 4.79 4.45 4.28 4.32 4.59 4.46 4.39 4.39 4.34 4.62 4.78 4.42 4.47 5 6 5.10 4.88 5.67 5.27 5.04 5.10 5.44 5.28 5.16 5.17 5.14 5.47 5.71 5.21 5.29 6 7 5.86 5.61 6.53 6.05 5.77 5.89 6.27 6.07 5.91 5.93 5.92 6.30 6.61 5.97 6.10 7 8 6.59 6.34 7.36 6.81 6.48 6.66 7.07 6.83 6.63 6.66 6.71 7.11 7.49 6.69 6.87 8 9 7.31 7.04 8.18 7.54 7.17 7.41 7.85 7.57 7.33 7.38 7.47 7.89 8.36 7.40 7.63 910 7.99 7.73 8.98 8.26 7.84 8.15 8.61 8.30 8.00 8.08 8.22 8.65 9.22 8.08 8.36 1011 8.66 8.41 9.76 8.95 8.48 8.88 9.35 9.01 8.65 8.76 8.96 9.40 10.06 8.73 9.07 1112 9.30 9.08 10.52 9.63 9.11 9.60 10.07 9.70 9.27 9.42 9.70 10.13 10.88 9.35 9.76 1213 9.92 9.74 11.26 10.29 9.71 10.33 10.78 10.37 9.87 10.05 10.44 10.83 11.68 9.95 10.42 1314 10.53 10.38 11.97 10.92 10.30 11.03 11.46 11.02 10.44 10.67 11.16 11.52 12.47 10.54 11.07 1415 11.12 11.00 12.67 11.54 10.88 11.71 12.13 11.66 11.00 11.28 11.87 12.19 13.24 11.10 11.69 1516 11.69 11.60 13.35 12.15 11.44 12.38 12.78 12.28 11.53 11.87 12.55 12.85 13.99 11.63 12.30 1617 12.24 12.19 14.00 12.73 11.98 13.03 13.41 12.88 12.04 12.44 13.22 13.49 14.73 12.15 12.88 1718 12.78 12.76 14.64 13.31 12.51 13.66 14.02 13.47 12.54 13.00 13.87 14.11 15.46 12.64 13.45 1819 13.30 13.31 15.26 13.86 13.03 14.27 14.62 14.05 13.01 13.55 14.51 14.72 16.17 13.12 14.00 1920 13.81 13.85 15.86 14.41 13.53 14.86 15.21 14.61 13.47 14.08 15.12 15.31 16.87 13.58 14.54 2021 14.30 14.37 16.45 14.93 14.01 15.44 15.78 15.16 13.92 14.60 15.72 15.89 17.55 14.02 15.06 2122 14.78 14.88 17.01 15.45 14.49 16.01 16.33 15.70 14.34 15.10 16.31 16.45 18.22 14.45 15.56 2223 15.24 15.37 17.56 15.95 14.94 16.56 16.87 16.22 14.75 15.59 16.87 17.00 18.87 14.87 16.05 2324 15.69 15.85 18.10 16.44 15.39 17.09 17.40 16.73 15.15 16.07 17.43 17.53 19.52 15.27 16.53 2425 16.13 16.32 18.62 16.92 15.82 17.61 17.91 17.23 15.54 16.53 17.96 18.05 20.15 15.66 16.99 2526 16.55 16.77 19.12 17.39 16.24 18.11 18.41 17.72 15.92 16.98 18.48 18.56 20.76 16.04 17.44 2627 16.96 17.21 19.61 17.85 16.65 18.61 18.90 18.20 16.28 17.42 18.99 19.06 21.37 16.40 17.87 2728 17.35 17.64 20.08 18.29 17.05 19.08 19.38 18.66 16.63 17.85 19.48 19.54 21.96 16.76 18.30 2829 17.74 18.06 20.54 18.72 17.43 19.55 19.84 19.12 16.98 18.26 19.96 20.01 22.54 17.10 18.71 2930 18.11 18.46 20.99 19.14 17.80 20.00 20.29 19.56 17.31 18.67 20.43 20.47 23.11 17.43 19.11 30
Note: UPV* factors are reported for years 26-30 to accommodate a planning/construction period of up to 5 years.
(See p. 14 for instructions on use; page xiii for abbreviations.)
20
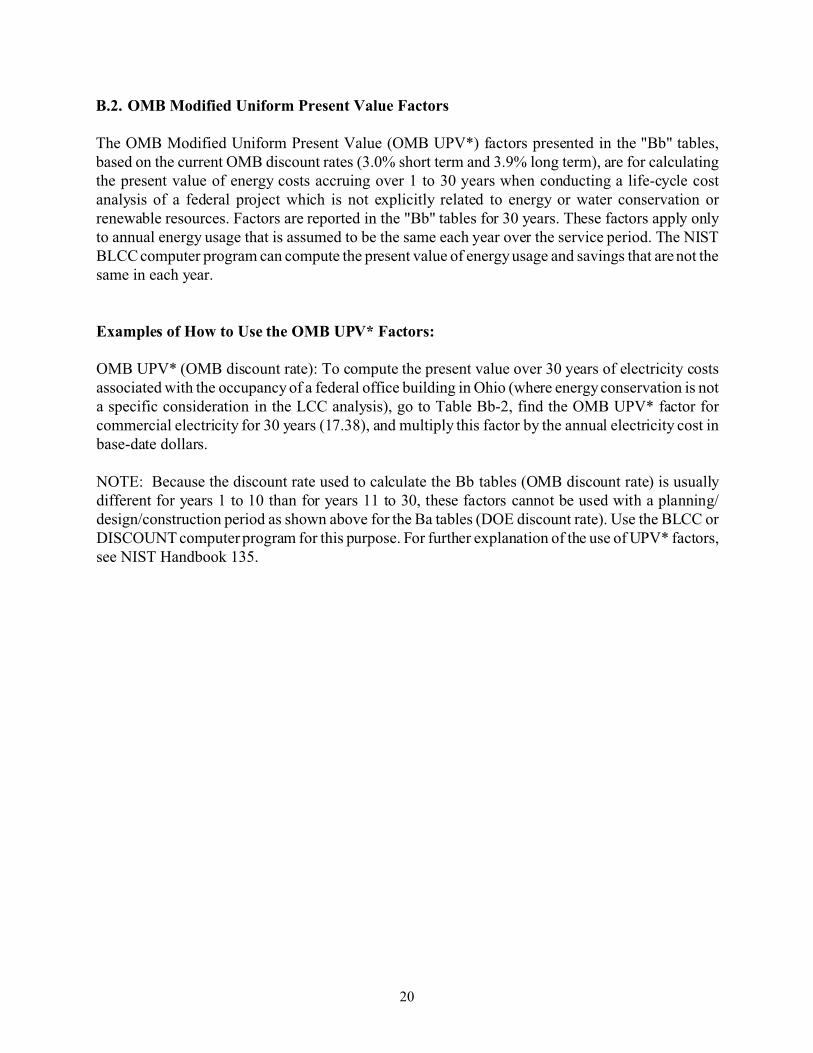
B.2. OMB Modified Uniform Present Value Factors
The OMB Modified Uniform Present Value (OMB UPV*) factors presented in the "Bb" tables,based on the current OMB discount rates (3.0% short term and 3.9% long term), are for calculatingthe present value of energy costs accruing over 1 to 30 years when conducting a life-cycle costanalysis of a federal project which is not explicitly related to energy or water conservation orrenewable resources. Factors are reported in the "Bb" tables for 30 years. These factors apply onlyto annual energy usage that is assumed to be the same each year over the service period. The NISTBLCC computer program can compute the present value of energy usage and savings that are not thesame in each year.
Examples of How to Use the OMB UPV* Factors:
OMB UPV* (OMB discount rate): To compute the present value over 30 years of electricity costsassociated with the occupancy of a federal office building in Ohio (where energy conservation is nota specific consideration in the LCC analysis), go to Table Bb-2, find the OMB UPV* factor forcommercial electricity for 30 years (17.38), and multiply this factor by the annual electricity cost inbase-date dollars.
NOTE: Because the discount rate used to calculate the Bb tables (OMB discount rate) is usuallydifferent for years 1 to 10 than for years 11 to 30, these factors cannot be used with a planning/design/construction period as shown above for the Ba tables (DOE discount rate). Use the BLCC orDISCOUNT computer program for this purpose. For further explanation of the use of UPV* factors,see NIST Handbook 135.
21
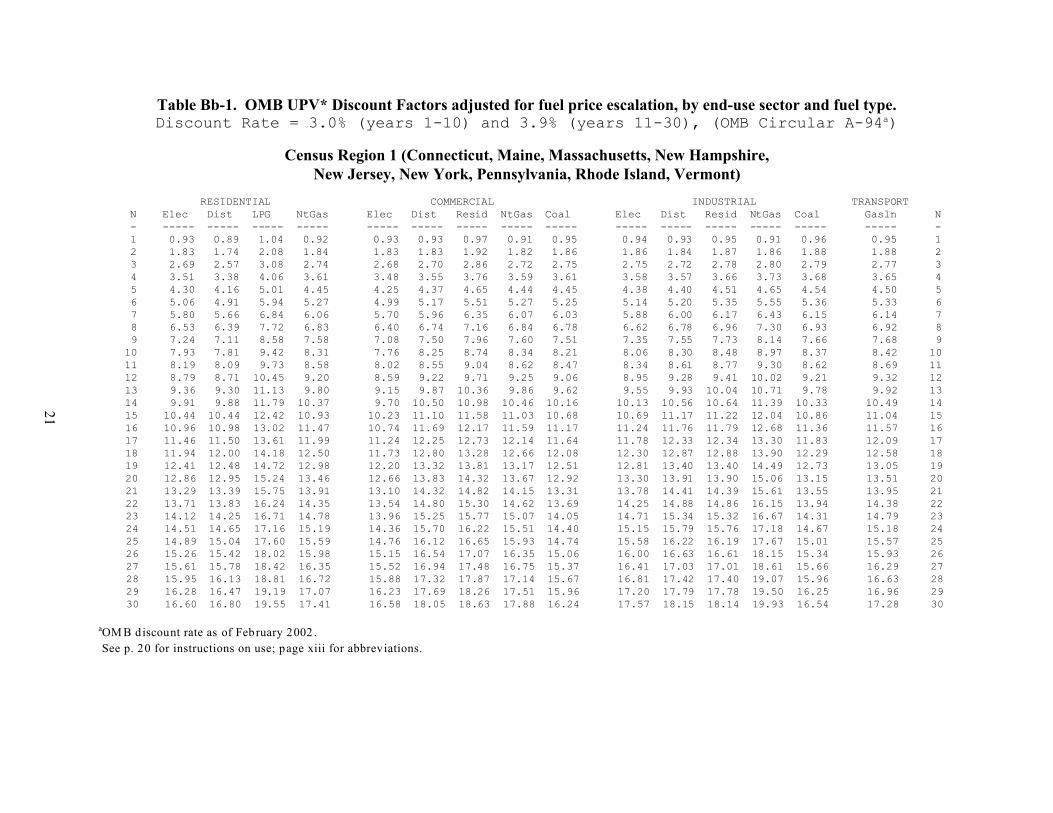
Table Bb-1. OMB UPV* Discount Factors adjusted for fuel price escalation, by end-use sector and fuel type.Discount Rate = 3.0% (years 1-10) and 3.9% (years 11-30), (OMB Circular A-94a)
Census Region 1 (Connecticut, Maine, Massachusetts, New Hampshire,New Jersey, New York, Pennsylvania, Rhode Island, Vermont)
RESIDENTIAL COMMERCIAL INDUSTRIAL TRANSPORT N Elec Dist LPG NtGas Elec Dist Resid NtGas Coal Elec Dist Resid NtGas Coal Gasln N - ----- ----- ----- ----- ----- ----- ----- ----- ----- ----- ----- ----- ----- ----- ----- - 1 0.93 0.89 1.04 0.92 0.93 0.93 0.97 0.91 0.95 0.94 0.93 0.95 0.91 0.96 0.95 1 2 1.83 1.74 2.08 1.84 1.83 1.83 1.92 1.82 1.86 1.86 1.84 1.87 1.86 1.88 1.88 2 3 2.69 2.57 3.08 2.74 2.68 2.70 2.86 2.72 2.75 2.75 2.72 2.78 2.80 2.79 2.77 3 4 3.51 3.38 4.06 3.61 3.48 3.55 3.76 3.59 3.61 3.58 3.57 3.66 3.73 3.68 3.65 4 5 4.30 4.16 5.01 4.45 4.25 4.37 4.65 4.44 4.45 4.38 4.40 4.51 4.65 4.54 4.50 5 6 5.06 4.91 5.94 5.27 4.99 5.17 5.51 5.27 5.25 5.14 5.20 5.35 5.55 5.36 5.33 6 7 5.80 5.66 6.84 6.06 5.70 5.96 6.35 6.07 6.03 5.88 6.00 6.17 6.43 6.15 6.14 7 8 6.53 6.39 7.72 6.83 6.40 6.74 7.16 6.84 6.78 6.62 6.78 6.96 7.30 6.93 6.92 8 9 7.24 7.11 8.58 7.58 7.08 7.50 7.96 7.60 7.51 7.35 7.55 7.73 8.14 7.66 7.68 910 7.93 7.81 9.42 8.31 7.76 8.25 8.74 8.34 8.21 8.06 8.30 8.48 8.97 8.37 8.42 1011 8.19 8.09 9.73 8.58 8.02 8.55 9.04 8.62 8.47 8.34 8.61 8.77 9.30 8.62 8.69 1112 8.79 8.71 10.45 9.20 8.59 9.22 9.71 9.25 9.06 8.95 9.28 9.41 10.02 9.21 9.32 1213 9.36 9.30 11.13 9.80 9.15 9.87 10.36 9.86 9.62 9.55 9.93 10.04 10.71 9.78 9.92 1314 9.91 9.88 11.79 10.37 9.70 10.50 10.98 10.46 10.16 10.13 10.56 10.64 11.39 10.33 10.49 1415 10.44 10.44 12.42 10.93 10.23 11.10 11.58 11.03 10.68 10.69 11.17 11.22 12.04 10.86 11.04 1516 10.96 10.98 13.02 11.47 10.74 11.69 12.17 11.59 11.17 11.24 11.76 11.79 12.68 11.36 11.57 1617 11.46 11.50 13.61 11.99 11.24 12.25 12.73 12.14 11.64 11.78 12.33 12.34 13.30 11.83 12.09 1718 11.94 12.00 14.18 12.50 11.73 12.80 13.28 12.66 12.08 12.30 12.87 12.88 13.90 12.29 12.58 1819 12.41 12.48 14.72 12.98 12.20 13.32 13.81 13.17 12.51 12.81 13.40 13.40 14.49 12.73 13.05 1920 12.86 12.95 15.24 13.46 12.66 13.83 14.32 13.67 12.92 13.30 13.91 13.90 15.06 13.15 13.51 2021 13.29 13.39 15.75 13.91 13.10 14.32 14.82 14.15 13.31 13.78 14.41 14.39 15.61 13.55 13.95 2122 13.71 13.83 16.24 14.35 13.54 14.80 15.30 14.62 13.69 14.25 14.88 14.86 16.15 13.94 14.38 2223 14.12 14.25 16.71 14.78 13.96 15.25 15.77 15.07 14.05 14.71 15.34 15.32 16.67 14.31 14.79 2324 14.51 14.65 17.16 15.19 14.36 15.70 16.22 15.51 14.40 15.15 15.79 15.76 17.18 14.67 15.18 2425 14.89 15.04 17.60 15.59 14.76 16.12 16.65 15.93 14.74 15.58 16.22 16.19 17.67 15.01 15.57 2526 15.26 15.42 18.02 15.98 15.15 16.54 17.07 16.35 15.06 16.00 16.63 16.61 18.15 15.34 15.93 2627 15.61 15.78 18.42 16.35 15.52 16.94 17.48 16.75 15.37 16.41 17.03 17.01 18.61 15.66 16.29 2728 15.95 16.13 18.81 16.72 15.88 17.32 17.87 17.14 15.67 16.81 17.42 17.40 19.07 15.96 16.63 2829 16.28 16.47 19.19 17.07 16.23 17.69 18.26 17.51 15.96 17.20 17.79 17.78 19.50 16.25 16.96 2930 16.60 16.80 19.55 17.41 16.58 18.05 18.63 17.88 16.24 17.57 18.15 18.14 19.93 16.54 17.28 30
aOM B discount rate as of February 2002 .
See p. 20 for instructions on use; page xiii for abbreviations.

22
Table Bb-2. OMB UPV* Discount Factors adjusted for fuel price escalation, by end-use sector and fuel type.Discount Rate = 3.0% (years 1-10) and 3.9% (years 11-30), (OMB Circular A-94a)
Census Region 2 (Illinois, Indiana, Iowa, Kansas, Michigan, Minnesota, Missouri, Nebraska, North Dakota, Ohio, South Dakota, Wisconsin)
RESIDENTIAL COMMERCIAL INDUSTRIAL TRANSPORT N Elec Dist LPG NtGas Elec Dist Resid NtGas Coal Elec Dist Resid NtGas Coal Gasln N - ----- ----- ----- ----- ----- ----- ----- ----- ----- ----- ----- ----- ----- ----- ----- - 1 0.94 0.88 0.97 0.92 0.97 0.92 0.94 0.92 0.96 0.97 0.93 0.94 0.93 0.95 0.94 1 2 1.85 1.72 1.93 1.85 1.91 1.80 1.87 1.85 1.88 1.93 1.82 1.86 1.89 1.86 1.84 2 3 2.72 2.54 2.86 2.76 2.82 2.67 2.77 2.75 2.77 2.85 2.70 2.76 2.86 2.75 2.72 3 4 3.57 3.33 3.76 3.64 3.69 3.50 3.65 3.63 3.62 3.74 3.55 3.64 3.81 3.60 3.60 4 5 4.40 4.10 4.64 4.49 4.52 4.33 4.51 4.48 4.44 4.59 4.38 4.50 4.73 4.42 4.45 5 6 5.21 4.86 5.49 5.31 5.33 5.13 5.35 5.31 5.23 5.42 5.19 5.33 5.64 5.21 5.27 6 7 5.99 5.61 6.33 6.11 6.11 5.93 6.17 6.11 5.98 6.23 6.00 6.15 6.53 5.97 6.08 7 8 6.75 6.35 7.15 6.89 6.87 6.73 6.97 6.88 6.72 7.02 6.80 6.95 7.40 6.71 6.86 8 9 7.49 7.07 7.95 7.64 7.62 7.51 7.75 7.64 7.43 7.79 7.58 7.73 8.26 7.42 7.62 910 8.21 7.78 8.73 8.38 8.35 8.28 8.52 8.38 8.12 8.55 8.36 8.49 9.11 8.11 8.36 1011 8.48 8.07 9.04 8.66 8.63 8.60 8.81 8.66 8.36 8.85 8.68 8.79 9.45 8.35 8.63 1112 9.08 8.71 9.71 9.29 9.25 9.30 9.47 9.30 8.94 9.50 9.37 9.44 10.18 8.93 9.26 1213 9.67 9.33 10.37 9.91 9.84 9.99 10.11 9.91 9.48 10.12 10.07 10.08 10.89 9.48 9.86 1314 10.23 9.94 11.00 10.49 10.42 10.67 10.72 10.50 10.01 10.73 10.74 10.69 11.58 10.01 10.44 1415 10.77 10.53 11.61 11.06 10.98 11.33 11.32 11.08 10.51 11.32 11.39 11.28 12.25 10.51 11.00 1516 11.30 11.10 12.20 11.62 11.52 11.96 11.90 11.63 10.98 11.89 12.02 11.86 12.90 11.00 11.54 1617 11.80 11.65 12.76 12.15 12.04 12.57 12.45 12.17 11.44 12.44 12.63 12.41 13.53 11.45 12.05 1718 12.29 12.18 13.31 12.66 12.54 13.17 13.00 12.69 11.87 12.98 13.22 12.95 14.15 11.89 12.55 1819 12.76 12.69 13.84 13.16 13.02 13.74 13.52 13.20 12.29 13.50 13.79 13.47 14.75 12.31 13.03 1920 13.21 13.19 14.35 13.65 13.49 14.30 14.03 13.69 12.69 14.00 14.34 13.98 15.33 12.72 13.49 2021 13.65 13.67 14.85 14.12 13.94 14.84 14.52 14.16 13.07 14.49 14.88 14.47 15.90 13.10 13.94 2122 14.07 14.13 15.32 14.57 14.38 15.36 15.00 14.62 13.44 14.96 15.39 14.94 16.45 13.47 14.37 2223 14.48 14.58 15.78 15.01 14.80 15.86 15.46 15.07 13.79 15.42 15.89 15.40 16.98 13.83 14.79 2324 14.87 15.01 16.22 15.44 15.21 16.35 15.91 15.50 14.13 15.87 16.37 15.84 17.51 14.17 15.19 2425 15.24 15.43 16.65 15.85 15.60 16.81 16.34 15.92 14.45 16.30 16.83 16.28 18.01 14.50 15.57 2526 15.61 15.83 17.06 16.25 15.98 17.27 16.76 16.33 14.77 16.71 17.28 16.69 18.51 14.81 15.94 2627 15.95 16.22 17.46 16.64 16.35 17.70 17.17 16.73 15.07 17.11 17.72 17.10 18.99 15.12 16.30 2728 16.29 16.59 17.84 17.02 16.71 18.13 17.56 17.11 15.36 17.51 18.13 17.49 19.46 15.41 16.65 2829 16.62 16.95 18.21 17.39 17.05 18.53 17.94 17.49 15.64 17.88 18.54 17.87 19.91 15.69 16.98 2930 16.93 17.30 18.56 17.74 17.38 18.93 18.31 17.85 15.90 18.25 18.93 18.24 20.35 15.97 17.31 30
aOM B discount rate as of February 2002 .
See p. 20 for instructions on use; page xiii for abbreviations.
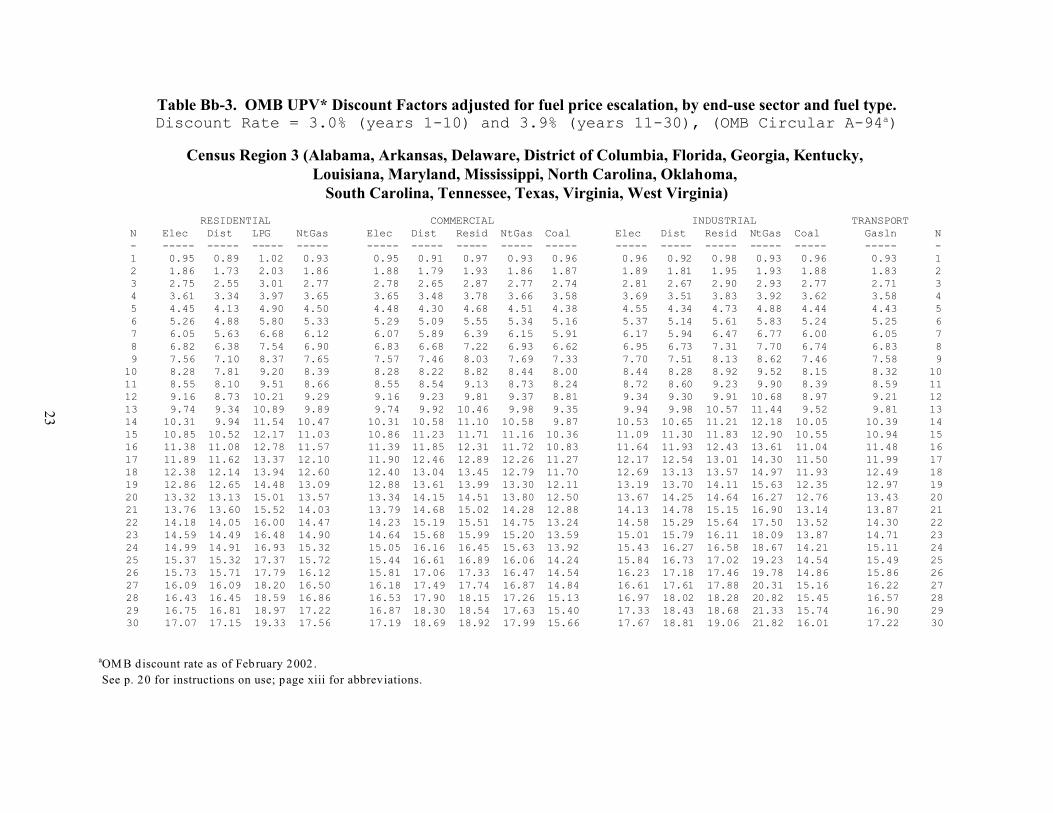
23
Table Bb-3. OMB UPV* Discount Factors adjusted for fuel price escalation, by end-use sector and fuel type.Discount Rate = 3.0% (years 1-10) and 3.9% (years 11-30), (OMB Circular A-94a)
Census Region 3 (Alabama, Arkansas, Delaware, District of Columbia, Florida, Georgia, Kentucky, Louisiana, Maryland, Mississippi, North Carolina, Oklahoma,
South Carolina, Tennessee, Texas, Virginia, West Virginia)
RESIDENTIAL COMMERCIAL INDUSTRIAL TRANSPORT N Elec Dist LPG NtGas Elec Dist Resid NtGas Coal Elec Dist Resid NtGas Coal Gasln N - ----- ----- ----- ----- ----- ----- ----- ----- ----- ----- ----- ----- ----- ----- ----- - 1 0.95 0.89 1.02 0.93 0.95 0.91 0.97 0.93 0.96 0.96 0.92 0.98 0.93 0.96 0.93 1 2 1.86 1.73 2.03 1.86 1.88 1.79 1.93 1.86 1.87 1.89 1.81 1.95 1.93 1.88 1.83 2 3 2.75 2.55 3.01 2.77 2.78 2.65 2.87 2.77 2.74 2.81 2.67 2.90 2.93 2.77 2.71 3 4 3.61 3.34 3.97 3.65 3.65 3.48 3.78 3.66 3.58 3.69 3.51 3.83 3.92 3.62 3.58 4 5 4.45 4.13 4.90 4.50 4.48 4.30 4.68 4.51 4.38 4.55 4.34 4.73 4.88 4.44 4.43 5 6 5.26 4.88 5.80 5.33 5.29 5.09 5.55 5.34 5.16 5.37 5.14 5.61 5.83 5.24 5.25 6 7 6.05 5.63 6.68 6.12 6.07 5.89 6.39 6.15 5.91 6.17 5.94 6.47 6.77 6.00 6.05 7 8 6.82 6.38 7.54 6.90 6.83 6.68 7.22 6.93 6.62 6.95 6.73 7.31 7.70 6.74 6.83 8 9 7.56 7.10 8.37 7.65 7.57 7.46 8.03 7.69 7.33 7.70 7.51 8.13 8.62 7.46 7.58 910 8.28 7.81 9.20 8.39 8.28 8.22 8.82 8.44 8.00 8.44 8.28 8.92 9.52 8.15 8.32 1011 8.55 8.10 9.51 8.66 8.55 8.54 9.13 8.73 8.24 8.72 8.60 9.23 9.90 8.39 8.59 1112 9.16 8.73 10.21 9.29 9.16 9.23 9.81 9.37 8.81 9.34 9.30 9.91 10.68 8.97 9.21 1213 9.74 9.34 10.89 9.89 9.74 9.92 10.46 9.98 9.35 9.94 9.98 10.57 11.44 9.52 9.81 1314 10.31 9.94 11.54 10.47 10.31 10.58 11.10 10.58 9.87 10.53 10.65 11.21 12.18 10.05 10.39 1415 10.85 10.52 12.17 11.03 10.86 11.23 11.71 11.16 10.36 11.09 11.30 11.83 12.90 10.55 10.94 1516 11.38 11.08 12.78 11.57 11.39 11.85 12.31 11.72 10.83 11.64 11.93 12.43 13.61 11.04 11.48 1617 11.89 11.62 13.37 12.10 11.90 12.46 12.89 12.26 11.27 12.17 12.54 13.01 14.30 11.50 11.99 1718 12.38 12.14 13.94 12.60 12.40 13.04 13.45 12.79 11.70 12.69 13.13 13.57 14.97 11.93 12.49 1819 12.86 12.65 14.48 13.09 12.88 13.61 13.99 13.30 12.11 13.19 13.70 14.11 15.63 12.35 12.97 1920 13.32 13.13 15.01 13.57 13.34 14.15 14.51 13.80 12.50 13.67 14.25 14.64 16.27 12.76 13.43 2021 13.76 13.60 15.52 14.03 13.79 14.68 15.02 14.28 12.88 14.13 14.78 15.15 16.90 13.14 13.87 2122 14.18 14.05 16.00 14.47 14.23 15.19 15.51 14.75 13.24 14.58 15.29 15.64 17.50 13.52 14.30 2223 14.59 14.49 16.48 14.90 14.64 15.68 15.99 15.20 13.59 15.01 15.79 16.11 18.09 13.87 14.71 2324 14.99 14.91 16.93 15.32 15.05 16.16 16.45 15.63 13.92 15.43 16.27 16.58 18.67 14.21 15.11 2425 15.37 15.32 17.37 15.72 15.44 16.61 16.89 16.06 14.24 15.84 16.73 17.02 19.23 14.54 15.49 2526 15.73 15.71 17.79 16.12 15.81 17.06 17.33 16.47 14.54 16.23 17.18 17.46 19.78 14.86 15.86 2627 16.09 16.09 18.20 16.50 16.18 17.49 17.74 16.87 14.84 16.61 17.61 17.88 20.31 15.16 16.22 2728 16.43 16.45 18.59 16.86 16.53 17.90 18.15 17.26 15.13 16.97 18.02 18.28 20.82 15.45 16.57 2829 16.75 16.81 18.97 17.22 16.87 18.30 18.54 17.63 15.40 17.33 18.43 18.68 21.33 15.74 16.90 2930 17.07 17.15 19.33 17.56 17.19 18.69 18.92 17.99 15.66 17.67 18.81 19.06 21.82 16.01 17.22 30
aOM B discount rate as of February 2002 .
See p. 20 for instructions on use; page xiii for abbreviations.
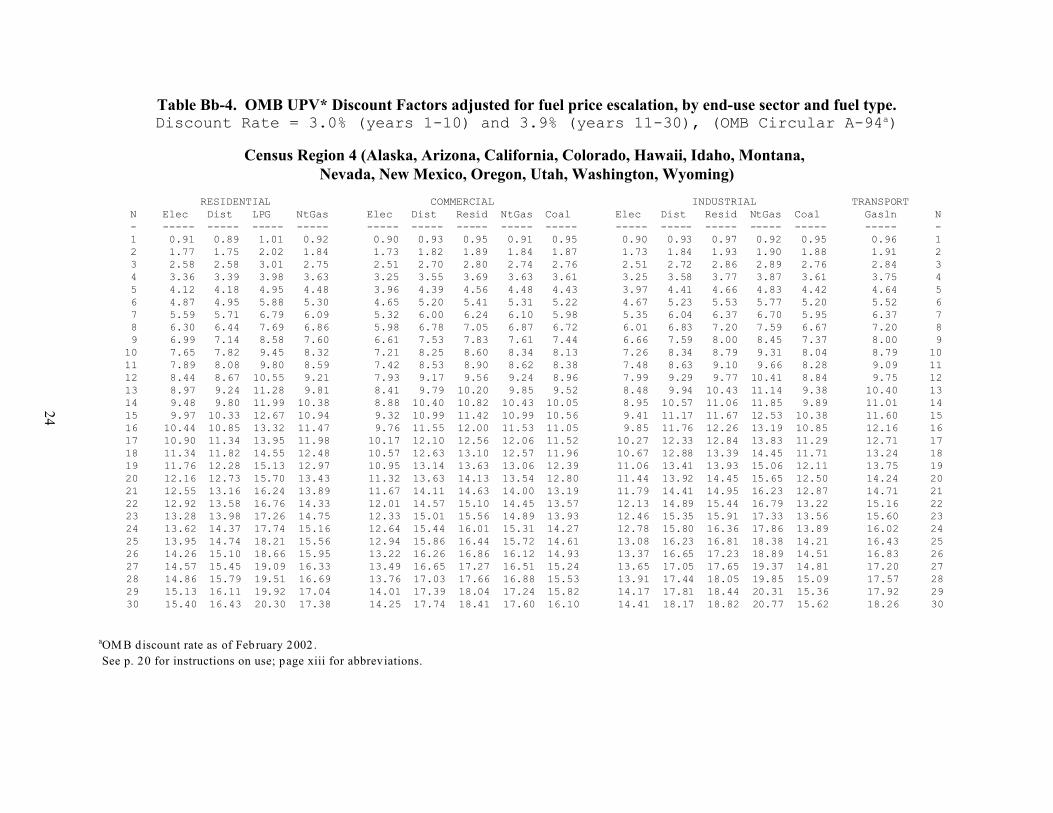
24
Table Bb-4. OMB UPV* Discount Factors adjusted for fuel price escalation, by end-use sector and fuel type.Discount Rate = 3.0% (years 1-10) and 3.9% (years 11-30), (OMB Circular A-94a)
Census Region 4 (Alaska, Arizona, California, Colorado, Hawaii, Idaho, Montana, Nevada, New Mexico, Oregon, Utah, Washington, Wyoming)
RESIDENTIAL COMMERCIAL INDUSTRIAL TRANSPORT N Elec Dist LPG NtGas Elec Dist Resid NtGas Coal Elec Dist Resid NtGas Coal Gasln N - ----- ----- ----- ----- ----- ----- ----- ----- ----- ----- ----- ----- ----- ----- ----- - 1 0.91 0.89 1.01 0.92 0.90 0.93 0.95 0.91 0.95 0.90 0.93 0.97 0.92 0.95 0.96 1 2 1.77 1.75 2.02 1.84 1.73 1.82 1.89 1.84 1.87 1.73 1.84 1.93 1.90 1.88 1.91 2 3 2.58 2.58 3.01 2.75 2.51 2.70 2.80 2.74 2.76 2.51 2.72 2.86 2.89 2.76 2.84 3 4 3.36 3.39 3.98 3.63 3.25 3.55 3.69 3.63 3.61 3.25 3.58 3.77 3.87 3.61 3.75 4 5 4.12 4.18 4.95 4.48 3.96 4.39 4.56 4.48 4.43 3.97 4.41 4.66 4.83 4.42 4.64 5 6 4.87 4.95 5.88 5.30 4.65 5.20 5.41 5.31 5.22 4.67 5.23 5.53 5.77 5.20 5.52 6 7 5.59 5.71 6.79 6.09 5.32 6.00 6.24 6.10 5.98 5.35 6.04 6.37 6.70 5.95 6.37 7 8 6.30 6.44 7.69 6.86 5.98 6.78 7.05 6.87 6.72 6.01 6.83 7.20 7.59 6.67 7.20 8 9 6.99 7.14 8.58 7.60 6.61 7.53 7.83 7.61 7.44 6.66 7.59 8.00 8.45 7.37 8.00 910 7.65 7.82 9.45 8.32 7.21 8.25 8.60 8.34 8.13 7.26 8.34 8.79 9.31 8.04 8.79 1011 7.89 8.08 9.80 8.59 7.42 8.53 8.90 8.62 8.38 7.48 8.63 9.10 9.66 8.28 9.09 1112 8.44 8.67 10.55 9.21 7.93 9.17 9.56 9.24 8.96 7.99 9.29 9.77 10.41 8.84 9.75 1213 8.97 9.24 11.28 9.81 8.41 9.79 10.20 9.85 9.52 8.48 9.94 10.43 11.14 9.38 10.40 1314 9.48 9.80 11.99 10.38 8.88 10.40 10.82 10.43 10.05 8.95 10.57 11.06 11.85 9.89 11.01 1415 9.97 10.33 12.67 10.94 9.32 10.99 11.42 10.99 10.56 9.41 11.17 11.67 12.53 10.38 11.60 1516 10.44 10.85 13.32 11.47 9.76 11.55 12.00 11.53 11.05 9.85 11.76 12.26 13.19 10.85 12.16 1617 10.90 11.34 13.95 11.98 10.17 12.10 12.56 12.06 11.52 10.27 12.33 12.84 13.83 11.29 12.71 1718 11.34 11.82 14.55 12.48 10.57 12.63 13.10 12.57 11.96 10.67 12.88 13.39 14.45 11.71 13.24 1819 11.76 12.28 15.13 12.97 10.95 13.14 13.63 13.06 12.39 11.06 13.41 13.93 15.06 12.11 13.75 1920 12.16 12.73 15.70 13.43 11.32 13.63 14.13 13.54 12.80 11.44 13.92 14.45 15.65 12.50 14.24 2021 12.55 13.16 16.24 13.89 11.67 14.11 14.63 14.00 13.19 11.79 14.41 14.95 16.23 12.87 14.71 2122 12.92 13.58 16.76 14.33 12.01 14.57 15.10 14.45 13.57 12.13 14.89 15.44 16.79 13.22 15.16 2223 13.28 13.98 17.26 14.75 12.33 15.01 15.56 14.89 13.93 12.46 15.35 15.91 17.33 13.56 15.60 2324 13.62 14.37 17.74 15.16 12.64 15.44 16.01 15.31 14.27 12.78 15.80 16.36 17.86 13.89 16.02 2425 13.95 14.74 18.21 15.56 12.94 15.86 16.44 15.72 14.61 13.08 16.23 16.81 18.38 14.21 16.43 2526 14.26 15.10 18.66 15.95 13.22 16.26 16.86 16.12 14.93 13.37 16.65 17.23 18.89 14.51 16.83 2627 14.57 15.45 19.09 16.33 13.49 16.65 17.27 16.51 15.24 13.65 17.05 17.65 19.37 14.81 17.20 2728 14.86 15.79 19.51 16.69 13.76 17.03 17.66 16.88 15.53 13.91 17.44 18.05 19.85 15.09 17.57 2829 15.13 16.11 19.92 17.04 14.01 17.39 18.04 17.24 15.82 14.17 17.81 18.44 20.31 15.36 17.92 2930 15.40 16.43 20.30 17.38 14.25 17.74 18.41 17.60 16.10 14.41 18.17 18.82 20.77 15.62 18.26 30
aOM B discount rate as of February 2002 .
See p. 20 for instructions on use; page xiii for abbreviations.
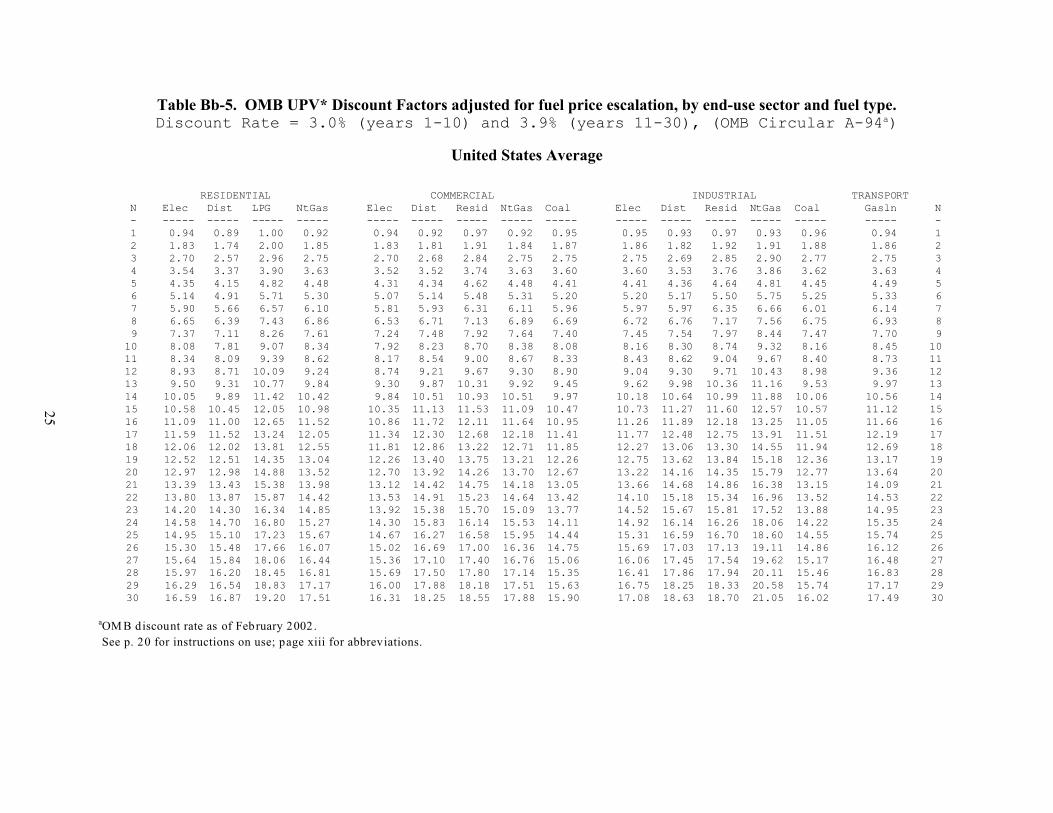
25
Table Bb-5. OMB UPV* Discount Factors adjusted for fuel price escalation, by end-use sector and fuel type.Discount Rate = 3.0% (years 1-10) and 3.9% (years 11-30), (OMB Circular A-94a)
United States Average
RESIDENTIAL COMMERCIAL INDUSTRIAL TRANSPORT N Elec Dist LPG NtGas Elec Dist Resid NtGas Coal Elec Dist Resid NtGas Coal Gasln N - ----- ----- ----- ----- ----- ----- ----- ----- ----- ----- ----- ----- ----- ----- ----- - 1 0.94 0.89 1.00 0.92 0.94 0.92 0.97 0.92 0.95 0.95 0.93 0.97 0.93 0.96 0.94 1 2 1.83 1.74 2.00 1.85 1.83 1.81 1.91 1.84 1.87 1.86 1.82 1.92 1.91 1.88 1.86 2 3 2.70 2.57 2.96 2.75 2.70 2.68 2.84 2.75 2.75 2.75 2.69 2.85 2.90 2.77 2.75 3 4 3.54 3.37 3.90 3.63 3.52 3.52 3.74 3.63 3.60 3.60 3.53 3.76 3.86 3.62 3.63 4 5 4.35 4.15 4.82 4.48 4.31 4.34 4.62 4.48 4.41 4.41 4.36 4.64 4.81 4.45 4.49 5 6 5.14 4.91 5.71 5.30 5.07 5.14 5.48 5.31 5.20 5.20 5.17 5.50 5.75 5.25 5.33 6 7 5.90 5.66 6.57 6.10 5.81 5.93 6.31 6.11 5.96 5.97 5.97 6.35 6.66 6.01 6.14 7 8 6.65 6.39 7.43 6.86 6.53 6.71 7.13 6.89 6.69 6.72 6.76 7.17 7.56 6.75 6.93 8 9 7.37 7.11 8.26 7.61 7.24 7.48 7.92 7.64 7.40 7.45 7.54 7.97 8.44 7.47 7.70 910 8.08 7.81 9.07 8.34 7.92 8.23 8.70 8.38 8.08 8.16 8.30 8.74 9.32 8.16 8.45 1011 8.34 8.09 9.39 8.62 8.17 8.54 9.00 8.67 8.33 8.43 8.62 9.04 9.67 8.40 8.73 1112 8.93 8.71 10.09 9.24 8.74 9.21 9.67 9.30 8.90 9.04 9.30 9.71 10.43 8.98 9.36 1213 9.50 9.31 10.77 9.84 9.30 9.87 10.31 9.92 9.45 9.62 9.98 10.36 11.16 9.53 9.97 1314 10.05 9.89 11.42 10.42 9.84 10.51 10.93 10.51 9.97 10.18 10.64 10.99 11.88 10.06 10.56 1415 10.58 10.45 12.05 10.98 10.35 11.13 11.53 11.09 10.47 10.73 11.27 11.60 12.57 10.57 11.12 1516 11.09 11.00 12.65 11.52 10.86 11.72 12.11 11.64 10.95 11.26 11.89 12.18 13.25 11.05 11.66 1617 11.59 11.52 13.24 12.05 11.34 12.30 12.68 12.18 11.41 11.77 12.48 12.75 13.91 11.51 12.19 1718 12.06 12.02 13.81 12.55 11.81 12.86 13.22 12.71 11.85 12.27 13.06 13.30 14.55 11.94 12.69 1819 12.52 12.51 14.35 13.04 12.26 13.40 13.75 13.21 12.26 12.75 13.62 13.84 15.18 12.36 13.17 1920 12.97 12.98 14.88 13.52 12.70 13.92 14.26 13.70 12.67 13.22 14.16 14.35 15.79 12.77 13.64 2021 13.39 13.43 15.38 13.98 13.12 14.42 14.75 14.18 13.05 13.66 14.68 14.86 16.38 13.15 14.09 2122 13.80 13.87 15.87 14.42 13.53 14.91 15.23 14.64 13.42 14.10 15.18 15.34 16.96 13.52 14.53 2223 14.20 14.30 16.34 14.85 13.92 15.38 15.70 15.09 13.77 14.52 15.67 15.81 17.52 13.88 14.95 2324 14.58 14.70 16.80 15.27 14.30 15.83 16.14 15.53 14.11 14.92 16.14 16.26 18.06 14.22 15.35 2425 14.95 15.10 17.23 15.67 14.67 16.27 16.58 15.95 14.44 15.31 16.59 16.70 18.60 14.55 15.74 2526 15.30 15.48 17.66 16.07 15.02 16.69 17.00 16.36 14.75 15.69 17.03 17.13 19.11 14.86 16.12 2627 15.64 15.84 18.06 16.44 15.36 17.10 17.40 16.76 15.06 16.06 17.45 17.54 19.62 15.17 16.48 2728 15.97 16.20 18.45 16.81 15.69 17.50 17.80 17.14 15.35 16.41 17.86 17.94 20.11 15.46 16.83 2829 16.29 16.54 18.83 17.17 16.00 17.88 18.18 17.51 15.63 16.75 18.25 18.33 20.58 15.74 17.17 2930 16.59 16.87 19.20 17.51 16.31 18.25 18.55 17.88 15.90 17.08 18.63 18.70 21.05 16.02 17.49 30
aOM B discount rate as of February 2002 .
See p. 20 for instructions on use; page xiii for abbreviations.

26
C. Projected Average Fuel Price Indices and Escalation Rates (Real)
Tables Ca-1 through Ca-5 present projected fuel price indices for the four Census regions and forthe United States. These indices, when multiplied by annual energy costs computed at base-dateprices (i.e., as of April 1, 2002), provide estimates of future-year costs (also as of April 1) in constantbase-date dollars. Constant-dollar cost estimates are needed when discounting is performed with areal discount rate (i.e., a rate that does not include general price inflation).
These indices were used in the calculation of the UPV* factors for energy prices in the Ba and Bbtables in this publication. While they are based on April 1 energy prices to maintain consistency inthe computation of these UPV* factors, the level of precision implied here is not required for mostLCC analyses. That is, the analyst need not calibrate base-year energy prices precisely to April 1,2002 levels to use these indices (or the corresponding UPV* factors); instead, the analyst should usecurrent price levels as of the base-date of the LCC analysis, regardless of the time of the year thatthe study is undertaken.
Example of How to Use the Indices:
To estimate the price of industrial coal in 2007 in Connecticut (in constant 2002 dollars), go to TableCa-1, find the year 2007 index for industrial coal (0.99), and multiply by the price for industrial coalin Connecticut in 2002.
For further explanation of how to use these tables, see NIST Handbook 135.
Tables Cb-1 through Cb-5 present the projected average fuel price escalation rates (percentagechange compounded annually) for selected periods from 2002 to 2032 for the four Census regionsand for the overall United States. Note that these are real rates exclusive of general price inflation.Their use results in prices expressed in constant dollars.
The average fuel escalation rates consolidate the information provided by the indices in the Ca tablesso that trends in projected price changes can be seen at a glance. They are provided primarily toaccommodate computer programs (such as BLCC) which require price escalation rates as inputs.
Unless there is a compelling reason to use escalation rates, it is recommended that you use theindices in the Ca tables when you need estimates of future-year energy prices, since the indicesinclude year-to-year information rather than averages over a number of years.
Example of How to Use the Escalation Rates:
To estimate the unit price of residential natural gas at the end of 2012 (p12) in Wyoming using theDOE energy price escalation rates, go to Table Cb-4 and find the 2002-2007 and the 2007-2012escalation rates for residential natural gas (-0.3% for 5 years and -0.3% for 5 years, respectively).Enter these values and the unit price of residential natural gas in Wyoming in 2002 (p02) into thefollowing formula. Then solve for the 2012 energy price (stated in 2002 dollars):

27
where py = Price at end of year y;ei = Annual compound escalation rate for period i from the Cb tables (in decimal
form); andki = Number of years over which escalation rate ei occurs.
Note that the compounded escalation rate factor (0.9704) corresponds to the fuel price index inregion 4, residential natural gas, for the year 2012 in table Ca-4 (0.97).
The data in the tables that follow are reported for the four Census regions and the U.S. average.Figure B-1 on page 13 presents a map showing the states corresponding to the four Census regions.The Census regions do not include American Samoa, Canal Zone, Guam, Puerto Rico, TrustTerritory of the Pacific Islands, or the Virgin Islands. Analysts of federal projects in these areasshould use data which are "reasonable under the circumstances," and may refer to the tables withU.S. average data for guidance.
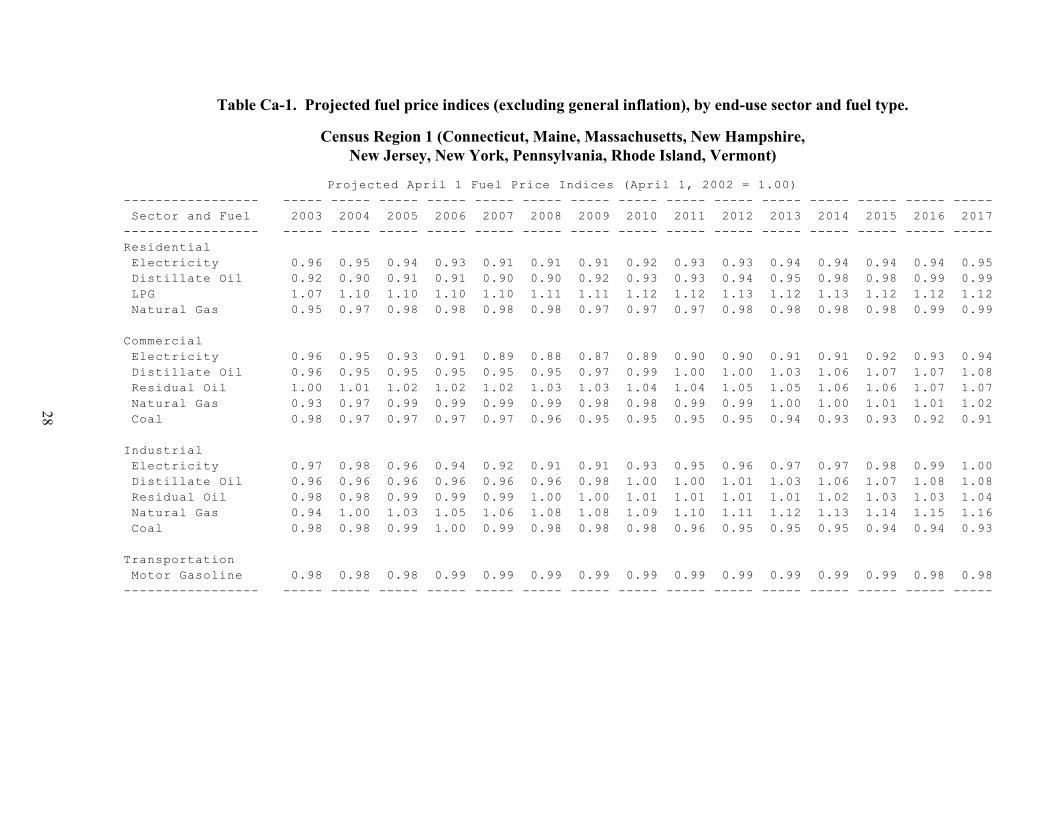
28
Table Ca-1. Projected fuel price indices (excluding general inflation), by end-use sector and fuel type.
Census Region 1 (Connecticut, Maine, Massachusetts, New Hampshire,New Jersey, New York, Pennsylvania, Rhode Island, Vermont)
Projected April 1 Fuel Price Indices (April 1, 2002 = 1.00)
----------------- ----- ----- ----- ----- ----- ----- ----- ----- ----- ----- ----- ----- ----- ----- -----
Sector and Fuel 2003 2004 2005 2006 2007 2008 2009 2010 2011 2012 2013 2014 2015 2016 2017
----------------- ----- ----- ----- ----- ----- ----- ----- ----- ----- ----- ----- ----- ----- ----- -----
Residential
Electricity 0.96 0.95 0.94 0.93 0.91 0.91 0.91 0.92 0.93 0.93 0.94 0.94 0.94 0.94 0.95
Distillate Oil 0.92 0.90 0.91 0.91 0.90 0.90 0.92 0.93 0.93 0.94 0.95 0.98 0.98 0.99 0.99
LPG 1.07 1.10 1.10 1.10 1.10 1.11 1.11 1.12 1.12 1.13 1.12 1.13 1.12 1.12 1.12
Natural Gas 0.95 0.97 0.98 0.98 0.98 0.98 0.97 0.97 0.97 0.98 0.98 0.98 0.98 0.99 0.99
Commercial
Electricity 0.96 0.95 0.93 0.91 0.89 0.88 0.87 0.89 0.90 0.90 0.91 0.91 0.92 0.93 0.94
Distillate Oil 0.96 0.95 0.95 0.95 0.95 0.95 0.97 0.99 1.00 1.00 1.03 1.06 1.07 1.07 1.08
Residual Oil 1.00 1.01 1.02 1.02 1.02 1.03 1.03 1.04 1.04 1.05 1.05 1.06 1.06 1.07 1.07
Natural Gas 0.93 0.97 0.99 0.99 0.99 0.99 0.98 0.98 0.99 0.99 1.00 1.00 1.01 1.01 1.02
Coal 0.98 0.97 0.97 0.97 0.97 0.96 0.95 0.95 0.95 0.95 0.94 0.93 0.93 0.92 0.91
Industrial
Electricity 0.97 0.98 0.96 0.94 0.92 0.91 0.91 0.93 0.95 0.96 0.97 0.97 0.98 0.99 1.00
Distillate Oil 0.96 0.96 0.96 0.96 0.96 0.96 0.98 1.00 1.00 1.01 1.03 1.06 1.07 1.08 1.08
Residual Oil 0.98 0.98 0.99 0.99 0.99 1.00 1.00 1.01 1.01 1.01 1.01 1.02 1.03 1.03 1.04
Natural Gas 0.94 1.00 1.03 1.05 1.06 1.08 1.08 1.09 1.10 1.11 1.12 1.13 1.14 1.15 1.16
Coal 0.98 0.98 0.99 1.00 0.99 0.98 0.98 0.98 0.96 0.95 0.95 0.95 0.94 0.94 0.93
Transportation
Motor Gasoline 0.98 0.98 0.98 0.99 0.99 0.99 0.99 0.99 0.99 0.99 0.99 0.99 0.99 0.98 0.98
----------------- ----- ----- ----- ----- ----- ----- ----- ----- ----- ----- ----- ----- ----- ----- -----

29
Table Ca-1, continued. Projected fuel price indices (excluding general inflation), by end-use sector and fuel type.
Census Region 1 (Connecticut, Maine, Massachusetts, New Hampshire,New Jersey, New York, Pennsylvania, Rhode Island, Vermont)
Projected April 1 Fuel Price Indices (April 1, 2002 = 1.00)
----------------- ----- ----- ----- ----- ----- ----- ----- ----- ----- ----- ----- ----- ----- ----- -----
Sector and Fuel 2018 2019 2020 2021 2022 2023 2024 2025 2026 2027 2028 2029 2030 2031 2032
----------------- ----- ----- ----- ----- ----- ----- ----- ----- ----- ----- ----- ----- ----- ----- -----
Residential
Electricity 0.95 0.96 0.96 0.96 0.97 0.97 0.97 0.98 0.98 0.99 0.99 1.00 1.00 1.00 1.01
Distillate Oil 0.99 0.99 1.00 1.00 1.00 1.00 1.01 1.01 1.01 1.02 1.02 1.02 1.02 1.03 1.03
LPG 1.12 1.12 1.13 1.13 1.13 1.13 1.13 1.13 1.13 1.14 1.14 1.14 1.14 1.14 1.14
Natural Gas 1.00 1.00 1.00 1.01 1.01 1.02 1.02 1.03 1.03 1.04 1.05 1.05 1.06 1.06 1.07
Commercial
Electricity 0.95 0.96 0.97 0.98 0.99 0.99 1.00 1.01 1.02 1.03 1.04 1.05 1.06 1.07 1.08
Distillate Oil 1.08 1.08 1.09 1.09 1.09 1.10 1.10 1.10 1.11 1.11 1.12 1.12 1.12 1.13 1.13
Residual Oil 1.08 1.08 1.09 1.10 1.10 1.11 1.11 1.12 1.13 1.13 1.14 1.15 1.15 1.16 1.16
Natural Gas 1.03 1.04 1.05 1.06 1.07 1.07 1.08 1.09 1.10 1.11 1.12 1.13 1.13 1.14 1.15
Coal 0.91 0.89 0.89 0.89 0.88 0.88 0.87 0.87 0.87 0.87 0.87 0.87 0.87 0.87 0.87
Industrial
Electricity 1.01 1.03 1.04 1.05 1.06 1.08 1.09 1.10 1.11 1.12 1.14 1.15 1.16 1.17 1.19
Distillate Oil 1.08 1.09 1.09 1.09 1.10 1.10 1.11 1.11 1.11 1.12 1.12 1.13 1.13 1.13 1.14
Residual Oil 1.04 1.06 1.07 1.08 1.08 1.09 1.10 1.10 1.11 1.12 1.12 1.13 1.14 1.14 1.15
Natural Gas 1.17 1.19 1.20 1.21 1.22 1.23 1.25 1.26 1.27 1.28 1.30 1.31 1.32 1.33 1.34
Coal 0.92 0.91 0.91 0.91 0.91 0.90 0.90 0.89 0.89 0.89 0.89 0.89 0.89 0.89 0.89
Transportation
Motor Gasoline 0.98 0.98 0.98 0.98 0.98 0.99 0.99 0.99 0.99 0.99 1.00 1.00 1.00 1.00 1.00
----------------- ----- ----- ----- ----- ----- ----- ----- ----- ----- ----- ----- ----- ----- ----- -----
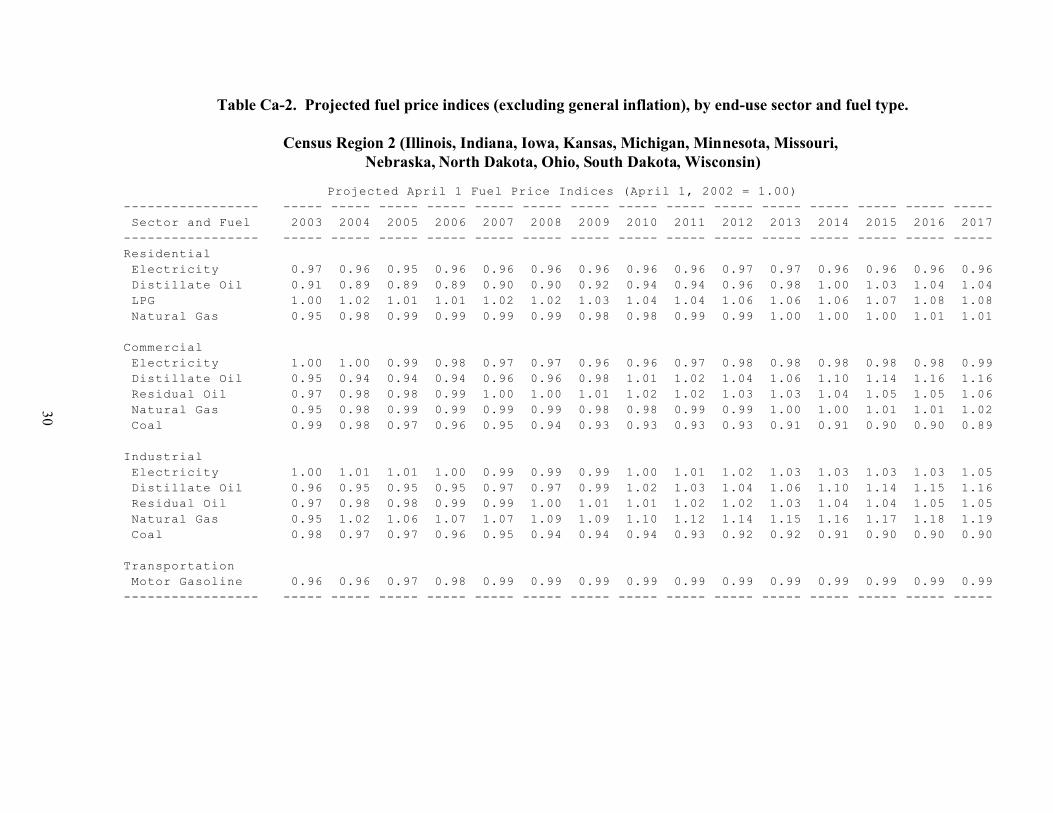
30
Table Ca-2. Projected fuel price indices (excluding general inflation), by end-use sector and fuel type.
Census Region 2 (Illinois, Indiana, Iowa, Kansas, Michigan, Minnesota, Missouri, Nebraska, North Dakota, Ohio, South Dakota, Wisconsin)
Projected April 1 Fuel Price Indices (April 1, 2002 = 1.00)
----------------- ----- ----- ----- ----- ----- ----- ----- ----- ----- ----- ----- ----- ----- ----- -----
Sector and Fuel 2003 2004 2005 2006 2007 2008 2009 2010 2011 2012 2013 2014 2015 2016 2017
----------------- ----- ----- ----- ----- ----- ----- ----- ----- ----- ----- ----- ----- ----- ----- -----
Residential
Electricity 0.97 0.96 0.95 0.96 0.96 0.96 0.96 0.96 0.96 0.97 0.97 0.96 0.96 0.96 0.96
Distillate Oil 0.91 0.89 0.89 0.89 0.90 0.90 0.92 0.94 0.94 0.96 0.98 1.00 1.03 1.04 1.04
LPG 1.00 1.02 1.01 1.01 1.02 1.02 1.03 1.04 1.04 1.06 1.06 1.06 1.07 1.08 1.08
Natural Gas 0.95 0.98 0.99 0.99 0.99 0.99 0.98 0.98 0.99 0.99 1.00 1.00 1.00 1.01 1.01
Commercial
Electricity 1.00 1.00 0.99 0.98 0.97 0.97 0.96 0.96 0.97 0.98 0.98 0.98 0.98 0.98 0.99
Distillate Oil 0.95 0.94 0.94 0.94 0.96 0.96 0.98 1.01 1.02 1.04 1.06 1.10 1.14 1.16 1.16
Residual Oil 0.97 0.98 0.98 0.99 1.00 1.00 1.01 1.02 1.02 1.03 1.03 1.04 1.05 1.05 1.06
Natural Gas 0.95 0.98 0.99 0.99 0.99 0.99 0.98 0.98 0.99 0.99 1.00 1.00 1.01 1.01 1.02
Coal 0.99 0.98 0.97 0.96 0.95 0.94 0.93 0.93 0.93 0.93 0.91 0.91 0.90 0.90 0.89
Industrial
Electricity 1.00 1.01 1.01 1.00 0.99 0.99 0.99 1.00 1.01 1.02 1.03 1.03 1.03 1.03 1.05
Distillate Oil 0.96 0.95 0.95 0.95 0.97 0.97 0.99 1.02 1.03 1.04 1.06 1.10 1.14 1.15 1.16
Residual Oil 0.97 0.98 0.98 0.99 0.99 1.00 1.01 1.01 1.02 1.02 1.03 1.04 1.04 1.05 1.05
Natural Gas 0.95 1.02 1.06 1.07 1.07 1.09 1.09 1.10 1.12 1.14 1.15 1.16 1.17 1.18 1.19
Coal 0.98 0.97 0.97 0.96 0.95 0.94 0.94 0.94 0.93 0.92 0.92 0.91 0.90 0.90 0.90
Transportation
Motor Gasoline 0.96 0.96 0.97 0.98 0.99 0.99 0.99 0.99 0.99 0.99 0.99 0.99 0.99 0.99 0.99
----------------- ----- ----- ----- ----- ----- ----- ----- ----- ----- ----- ----- ----- ----- ----- -----

31
Table Ca-2, continued. Projected fuel price indices (excluding general inflation), by end-use sector and fuel type.
Census Region 2 (Illinois, Indiana, Iowa, Kansas, Michigan, Minnesota, Missouri,Nebraska, North Dakota, Ohio, South Dakota, Wisconsin)
Projected April 1 Fuel Price Indices (April 1, 2002 = 1.00)
----------------- ----- ----- ----- ----- ----- ----- ----- ----- ----- ----- ----- ----- ----- ----- -----
Sector and Fuel 2018 2019 2020 2021 2022 2023 2024 2025 2026 2027 2028 2029 2030 2031 2032
----------------- ----- ----- ----- ----- ----- ----- ----- ----- ----- ----- ----- ----- ----- ----- -----
Residential
Electricity 0.97 0.97 0.97 0.97 0.97 0.98 0.98 0.98 0.98 0.98 0.98 0.98 0.98 0.98 0.98
Distillate Oil 1.05 1.05 1.06 1.06 1.07 1.07 1.07 1.08 1.08 1.08 1.09 1.09 1.09 1.09 1.10
LPG 1.09 1.09 1.09 1.10 1.10 1.10 1.10 1.10 1.11 1.11 1.11 1.11 1.12 1.12 1.12
Natural Gas 1.02 1.02 1.03 1.03 1.04 1.05 1.05 1.06 1.07 1.08 1.09 1.09 1.10 1.11 1.12
Commercial
Electricity 1.00 1.00 1.00 1.00 1.01 1.01 1.01 1.02 1.02 1.02 1.03 1.03 1.04 1.04 1.04
Distillate Oil 1.16 1.17 1.19 1.19 1.20 1.20 1.21 1.21 1.21 1.22 1.22 1.23 1.23 1.24 1.24
Residual Oil 1.06 1.07 1.08 1.09 1.09 1.10 1.11 1.11 1.12 1.13 1.14 1.14 1.15 1.16 1.16
Natural Gas 1.02 1.03 1.04 1.05 1.05 1.06 1.07 1.08 1.09 1.10 1.10 1.11 1.12 1.13 1.14
Coal 0.88 0.87 0.86 0.86 0.86 0.86 0.85 0.85 0.85 0.85 0.85 0.85 0.85 0.85 0.85
Industrial
Electricity 1.06 1.06 1.07 1.08 1.08 1.09 1.10 1.10 1.11 1.12 1.13 1.13 1.14 1.15 1.15
Distillate Oil 1.16 1.17 1.18 1.18 1.19 1.19 1.20 1.20 1.20 1.21 1.21 1.22 1.22 1.22 1.23
Residual Oil 1.06 1.07 1.07 1.08 1.09 1.09 1.10 1.11 1.11 1.12 1.13 1.14 1.14 1.15 1.16
Natural Gas 1.20 1.21 1.23 1.24 1.25 1.27 1.28 1.29 1.31 1.32 1.34 1.35 1.37 1.38 1.39
Coal 0.89 0.88 0.87 0.87 0.86 0.86 0.86 0.86 0.86 0.86 0.86 0.86 0.86 0.86 0.86
Transportation
Motor Gasoline 0.99 0.99 0.99 0.99 0.99 1.00 1.00 1.00 1.00 1.01 1.01 1.01 1.01 1.01 1.02
----------------- ----- ----- ----- ----- ----- ----- ----- ----- ----- ----- ----- ----- ----- ----- -----

32
Table Ca-3. Projected fuel price indices (excluding general inflation), by end-use sector and fuel type.
Census Region 3 (Alabama, Arkansas, Delaware, District of Columbia, Florida, Georgia, Kentucky, Louisiana, Maryland, Mississippi, North Carolina, Oklahoma, South Carolina,
Tennessee, Texas, Virginia, West Virginia)
Projected April 1 Fuel Price Indices (April 1, 2002 = 1.00)
----------------- ----- ----- ----- ----- ----- ----- ----- ----- ----- ----- ----- ----- ----- ----- -----
Sector and Fuel 2003 2004 2005 2006 2007 2008 2009 2010 2011 2012 2013 2014 2015 2016 2017
----------------- ----- ----- ----- ----- ----- ----- ----- ----- ----- ----- ----- ----- ----- ----- -----
Residential
Electricity 0.97 0.97 0.97 0.97 0.97 0.97 0.97 0.97 0.97 0.97 0.97 0.96 0.96 0.97 0.97
Distillate Oil 0.91 0.89 0.90 0.90 0.90 0.91 0.92 0.94 0.94 0.95 0.97 1.00 1.01 1.02 1.03
LPG 1.05 1.08 1.07 1.07 1.08 1.08 1.08 1.09 1.09 1.11 1.11 1.11 1.11 1.12 1.12
Natural Gas 0.96 0.99 0.99 0.99 0.98 0.98 0.98 0.98 0.98 0.99 0.99 0.99 0.99 0.99 1.00
Commercial
Electricity 0.98 0.98 0.99 0.98 0.97 0.96 0.96 0.96 0.96 0.96 0.96 0.96 0.96 0.97 0.97
Distillate Oil 0.94 0.93 0.93 0.94 0.95 0.95 0.98 1.00 1.01 1.03 1.06 1.09 1.12 1.14 1.15
Residual Oil 1.00 1.02 1.02 1.03 1.03 1.04 1.04 1.05 1.06 1.06 1.07 1.07 1.08 1.09 1.09
Natural Gas 0.95 0.99 1.00 1.00 0.99 0.99 0.99 0.99 1.00 1.01 1.01 1.01 1.02 1.02 1.03
Coal 0.99 0.97 0.95 0.94 0.94 0.93 0.92 0.91 0.92 0.91 0.90 0.90 0.89 0.88 0.87
Industrial
Electricity 0.98 0.99 1.00 1.00 0.99 0.98 0.98 0.99 0.99 0.99 0.99 0.99 0.99 1.00 1.00
Distillate Oil 0.95 0.94 0.94 0.94 0.96 0.96 0.98 1.01 1.02 1.03 1.06 1.10 1.13 1.15 1.15
Residual Oil 1.01 1.03 1.04 1.04 1.05 1.05 1.05 1.06 1.07 1.07 1.08 1.08 1.09 1.09 1.10
Natural Gas 0.96 1.05 1.10 1.11 1.12 1.14 1.16 1.17 1.20 1.22 1.23 1.24 1.25 1.26 1.28
Coal 0.99 0.98 0.97 0.96 0.95 0.95 0.94 0.93 0.93 0.93 0.92 0.91 0.91 0.90 0.89
Transportation
Motor Gasoline 0.96 0.95 0.96 0.98 0.98 0.98 0.98 0.99 0.98 0.98 0.98 0.98 0.98 0.99 0.99
----------------- ----- ----- ----- ----- ----- ----- ----- ----- ----- ----- ----- ----- ----- ----- -----

33
Table Ca-3, continued. Projected fuel price indices (excluding general inflation), by end-use sector and fuel type.
Census Region 3 (Alabama, Arkansas, Delaware, District of Columbia, Florida, Georgia, Kentucky, Louisiana, Maryland, Mississippi, North Carolina, Oklahoma, South Carolina,
Tennessee, Texas, Virginia, West Virginia)
Projected April 1 Fuel Price Indices (April 1, 2002 = 1.00)
----------------- ----- ----- ----- ----- ----- ----- ----- ----- ----- ----- ----- ----- ----- ----- -----
Sector and Fuel 2018 2019 2020 2021 2022 2023 2024 2025 2026 2027 2028 2029 2030 2031 2032
----------------- ----- ----- ----- ----- ----- ----- ----- ----- ----- ----- ----- ----- ----- ----- -----
Residential
Electricity 0.97 0.98 0.98 0.98 0.98 0.98 0.99 0.99 0.99 0.99 0.99 0.99 0.99 0.99 1.00
Distillate Oil 1.03 1.04 1.04 1.04 1.04 1.05 1.05 1.05 1.06 1.06 1.06 1.06 1.07 1.07 1.07
LPG 1.12 1.12 1.13 1.13 1.13 1.13 1.13 1.14 1.14 1.14 1.14 1.14 1.15 1.15 1.15
Natural Gas 1.00 1.00 1.01 1.01 1.02 1.03 1.03 1.04 1.04 1.05 1.06 1.06 1.07 1.08 1.08
Commercial
Electricity 0.98 0.99 0.99 0.99 1.00 1.00 1.00 1.01 1.01 1.01 1.02 1.02 1.02 1.03 1.03
Distillate Oil 1.15 1.16 1.16 1.17 1.17 1.18 1.18 1.19 1.19 1.20 1.20 1.20 1.21 1.21 1.22
Residual Oil 1.10 1.11 1.11 1.12 1.13 1.13 1.14 1.15 1.15 1.16 1.17 1.17 1.18 1.19 1.20
Natural Gas 1.04 1.04 1.05 1.06 1.07 1.07 1.08 1.09 1.10 1.10 1.11 1.12 1.13 1.14 1.15
Coal 0.86 0.86 0.85 0.85 0.85 0.84 0.84 0.83 0.83 0.83 0.83 0.83 0.83 0.83 0.83
Industrial
Electricity 1.01 1.02 1.02 1.03 1.03 1.04 1.04 1.05 1.05 1.05 1.06 1.06 1.07 1.07 1.08
Distillate Oil 1.16 1.16 1.17 1.18 1.18 1.19 1.19 1.19 1.20 1.20 1.21 1.21 1.22 1.22 1.22
Residual Oil 1.10 1.11 1.11 1.12 1.13 1.14 1.14 1.15 1.16 1.16 1.17 1.18 1.18 1.19 1.20
Natural Gas 1.30 1.32 1.34 1.36 1.38 1.39 1.41 1.43 1.44 1.46 1.48 1.49 1.51 1.53 1.55
Coal 0.89 0.88 0.88 0.87 0.87 0.86 0.86 0.86 0.86 0.86 0.86 0.86 0.86 0.86 0.86
Transportation
Motor Gasoline 0.99 0.99 0.99 0.99 0.99 0.99 0.99 1.00 1.00 1.00 1.00 1.00 1.01 1.01 1.01
----------------- ----- ----- ----- ----- ----- ----- ----- ----- ----- ----- ----- ----- ----- ----- -----
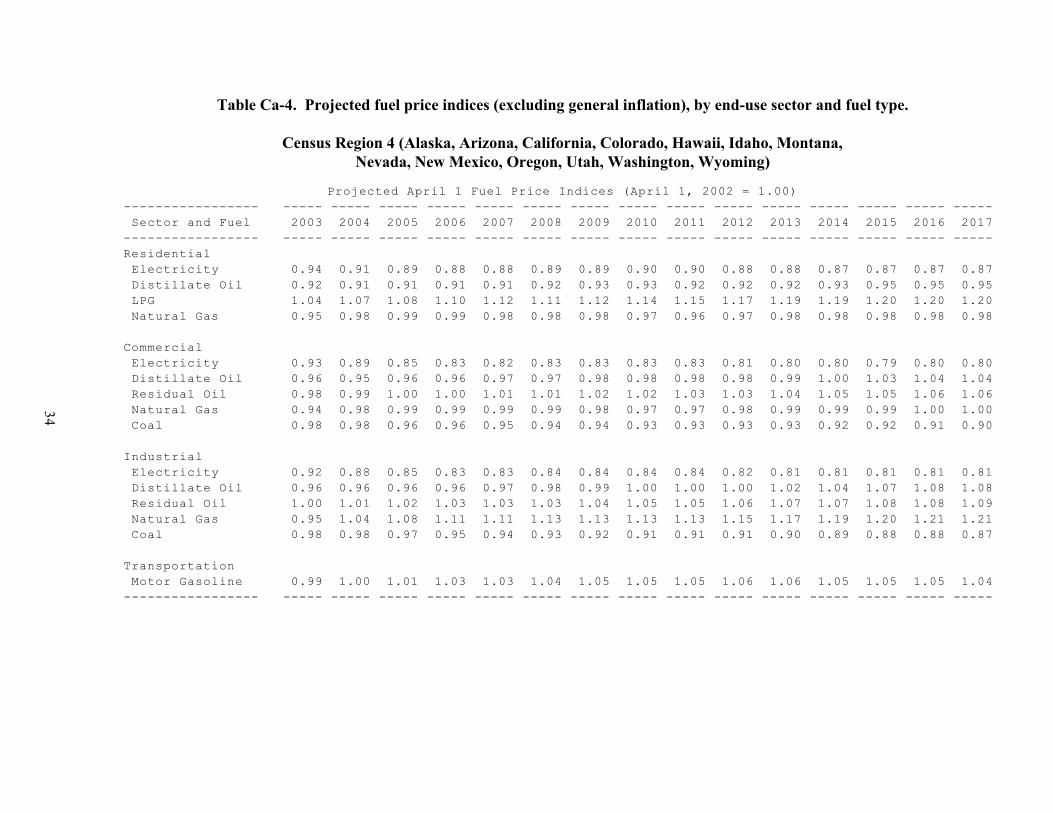
34
Table Ca-4. Projected fuel price indices (excluding general inflation), by end-use sector and fuel type.
Census Region 4 (Alaska, Arizona, California, Colorado, Hawaii, Idaho, Montana,Nevada, New Mexico, Oregon, Utah, Washington, Wyoming)
Projected April 1 Fuel Price Indices (April 1, 2002 = 1.00)
----------------- ----- ----- ----- ----- ----- ----- ----- ----- ----- ----- ----- ----- ----- ----- -----
Sector and Fuel 2003 2004 2005 2006 2007 2008 2009 2010 2011 2012 2013 2014 2015 2016 2017
----------------- ----- ----- ----- ----- ----- ----- ----- ----- ----- ----- ----- ----- ----- ----- -----
Residential
Electricity 0.94 0.91 0.89 0.88 0.88 0.89 0.89 0.90 0.90 0.88 0.88 0.87 0.87 0.87 0.87
Distillate Oil 0.92 0.91 0.91 0.91 0.91 0.92 0.93 0.93 0.92 0.92 0.92 0.93 0.95 0.95 0.95
LPG 1.04 1.07 1.08 1.10 1.12 1.11 1.12 1.14 1.15 1.17 1.19 1.19 1.20 1.20 1.20
Natural Gas 0.95 0.98 0.99 0.99 0.98 0.98 0.98 0.97 0.96 0.97 0.98 0.98 0.98 0.98 0.98
Commercial
Electricity 0.93 0.89 0.85 0.83 0.82 0.83 0.83 0.83 0.83 0.81 0.80 0.80 0.79 0.80 0.80
Distillate Oil 0.96 0.95 0.96 0.96 0.97 0.97 0.98 0.98 0.98 0.98 0.99 1.00 1.03 1.04 1.04
Residual Oil 0.98 0.99 1.00 1.00 1.01 1.01 1.02 1.02 1.03 1.03 1.04 1.05 1.05 1.06 1.06
Natural Gas 0.94 0.98 0.99 0.99 0.99 0.99 0.98 0.97 0.97 0.98 0.99 0.99 0.99 1.00 1.00
Coal 0.98 0.98 0.96 0.96 0.95 0.94 0.94 0.93 0.93 0.93 0.93 0.92 0.92 0.91 0.90
Industrial
Electricity 0.92 0.88 0.85 0.83 0.83 0.84 0.84 0.84 0.84 0.82 0.81 0.81 0.81 0.81 0.81
Distillate Oil 0.96 0.96 0.96 0.96 0.97 0.98 0.99 1.00 1.00 1.00 1.02 1.04 1.07 1.08 1.08
Residual Oil 1.00 1.01 1.02 1.03 1.03 1.03 1.04 1.05 1.05 1.06 1.07 1.07 1.08 1.08 1.09
Natural Gas 0.95 1.04 1.08 1.11 1.11 1.13 1.13 1.13 1.13 1.15 1.17 1.19 1.20 1.21 1.21
Coal 0.98 0.98 0.97 0.95 0.94 0.93 0.92 0.91 0.91 0.91 0.90 0.89 0.88 0.88 0.87
Transportation
Motor Gasoline 0.99 1.00 1.01 1.03 1.03 1.04 1.05 1.05 1.05 1.06 1.06 1.05 1.05 1.05 1.04
----------------- ----- ----- ----- ----- ----- ----- ----- ----- ----- ----- ----- ----- ----- ----- -----
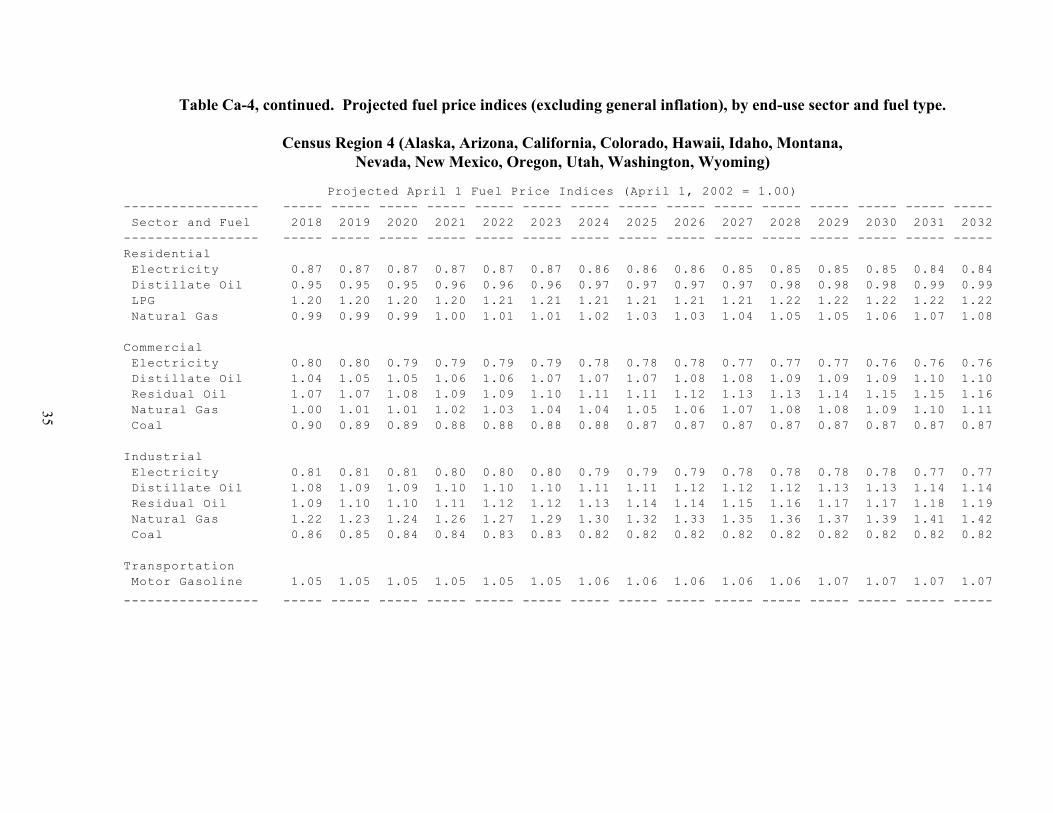
35
Table Ca-4, continued. Projected fuel price indices (excluding general inflation), by end-use sector and fuel type.
Census Region 4 (Alaska, Arizona, California, Colorado, Hawaii, Idaho, Montana,Nevada, New Mexico, Oregon, Utah, Washington, Wyoming)
Projected April 1 Fuel Price Indices (April 1, 2002 = 1.00)
----------------- ----- ----- ----- ----- ----- ----- ----- ----- ----- ----- ----- ----- ----- ----- -----
Sector and Fuel 2018 2019 2020 2021 2022 2023 2024 2025 2026 2027 2028 2029 2030 2031 2032
----------------- ----- ----- ----- ----- ----- ----- ----- ----- ----- ----- ----- ----- ----- ----- -----
Residential
Electricity 0.87 0.87 0.87 0.87 0.87 0.87 0.86 0.86 0.86 0.85 0.85 0.85 0.85 0.84 0.84
Distillate Oil 0.95 0.95 0.95 0.96 0.96 0.96 0.97 0.97 0.97 0.97 0.98 0.98 0.98 0.99 0.99
LPG 1.20 1.20 1.20 1.20 1.21 1.21 1.21 1.21 1.21 1.21 1.22 1.22 1.22 1.22 1.22
Natural Gas 0.99 0.99 0.99 1.00 1.01 1.01 1.02 1.03 1.03 1.04 1.05 1.05 1.06 1.07 1.08
Commercial
Electricity 0.80 0.80 0.79 0.79 0.79 0.79 0.78 0.78 0.78 0.77 0.77 0.77 0.76 0.76 0.76
Distillate Oil 1.04 1.05 1.05 1.06 1.06 1.07 1.07 1.07 1.08 1.08 1.09 1.09 1.09 1.10 1.10
Residual Oil 1.07 1.07 1.08 1.09 1.09 1.10 1.11 1.11 1.12 1.13 1.13 1.14 1.15 1.15 1.16
Natural Gas 1.00 1.01 1.01 1.02 1.03 1.04 1.04 1.05 1.06 1.07 1.08 1.08 1.09 1.10 1.11
Coal 0.90 0.89 0.89 0.88 0.88 0.88 0.88 0.87 0.87 0.87 0.87 0.87 0.87 0.87 0.87
Industrial
Electricity 0.81 0.81 0.81 0.80 0.80 0.80 0.79 0.79 0.79 0.78 0.78 0.78 0.78 0.77 0.77
Distillate Oil 1.08 1.09 1.09 1.10 1.10 1.10 1.11 1.11 1.12 1.12 1.12 1.13 1.13 1.14 1.14
Residual Oil 1.09 1.10 1.10 1.11 1.12 1.12 1.13 1.14 1.14 1.15 1.16 1.17 1.17 1.18 1.19
Natural Gas 1.22 1.23 1.24 1.26 1.27 1.29 1.30 1.32 1.33 1.35 1.36 1.37 1.39 1.41 1.42
Coal 0.86 0.85 0.84 0.84 0.83 0.83 0.82 0.82 0.82 0.82 0.82 0.82 0.82 0.82 0.82
Transportation
Motor Gasoline 1.05 1.05 1.05 1.05 1.05 1.05 1.06 1.06 1.06 1.06 1.06 1.07 1.07 1.07 1.07
----------------- ----- ----- ----- ----- ----- ----- ----- ----- ----- ----- ----- ----- ----- ----- -----
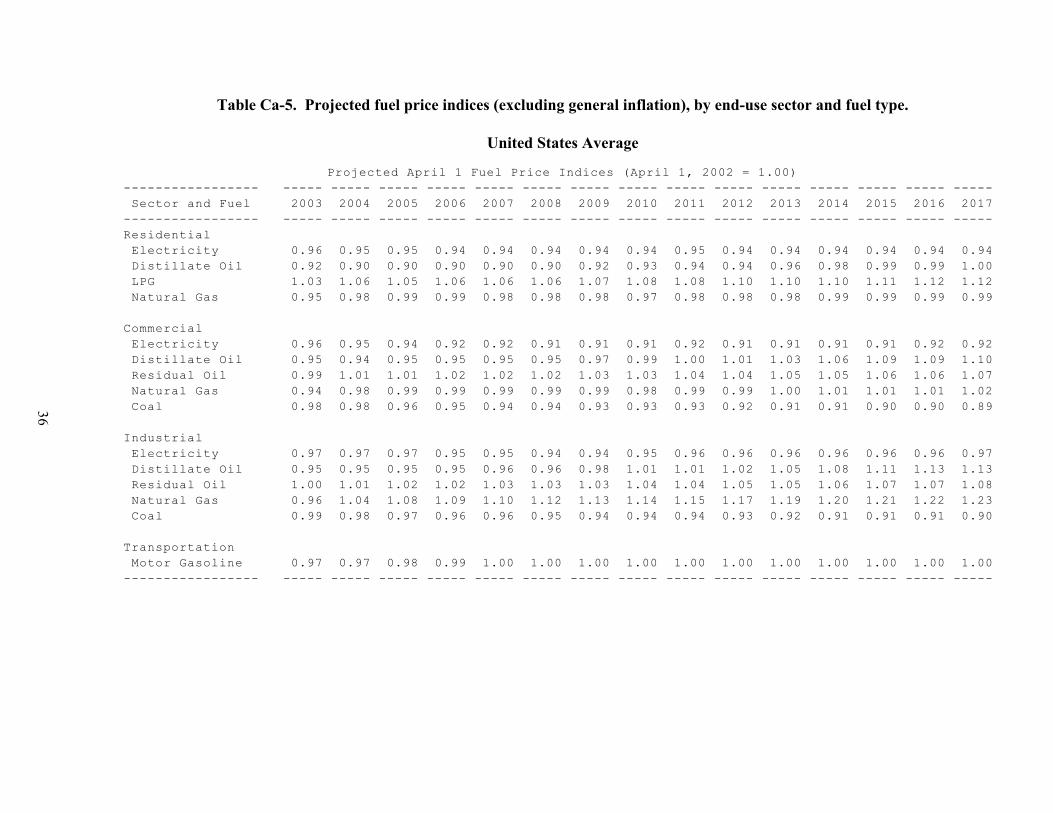
36
Table Ca-5. Projected fuel price indices (excluding general inflation), by end-use sector and fuel type.
United States Average
Projected April 1 Fuel Price Indices (April 1, 2002 = 1.00)
----------------- ----- ----- ----- ----- ----- ----- ----- ----- ----- ----- ----- ----- ----- ----- -----
Sector and Fuel 2003 2004 2005 2006 2007 2008 2009 2010 2011 2012 2013 2014 2015 2016 2017
----------------- ----- ----- ----- ----- ----- ----- ----- ----- ----- ----- ----- ----- ----- ----- -----
Residential
Electricity 0.96 0.95 0.95 0.94 0.94 0.94 0.94 0.94 0.95 0.94 0.94 0.94 0.94 0.94 0.94
Distillate Oil 0.92 0.90 0.90 0.90 0.90 0.90 0.92 0.93 0.94 0.94 0.96 0.98 0.99 0.99 1.00
LPG 1.03 1.06 1.05 1.06 1.06 1.06 1.07 1.08 1.08 1.10 1.10 1.10 1.11 1.12 1.12
Natural Gas 0.95 0.98 0.99 0.99 0.98 0.98 0.98 0.97 0.98 0.98 0.98 0.99 0.99 0.99 0.99
Commercial
Electricity 0.96 0.95 0.94 0.92 0.92 0.91 0.91 0.91 0.92 0.91 0.91 0.91 0.91 0.92 0.92
Distillate Oil 0.95 0.94 0.95 0.95 0.95 0.95 0.97 0.99 1.00 1.01 1.03 1.06 1.09 1.09 1.10
Residual Oil 0.99 1.01 1.01 1.02 1.02 1.02 1.03 1.03 1.04 1.04 1.05 1.05 1.06 1.06 1.07
Natural Gas 0.94 0.98 0.99 0.99 0.99 0.99 0.99 0.98 0.99 0.99 1.00 1.01 1.01 1.01 1.02
Coal 0.98 0.98 0.96 0.95 0.94 0.94 0.93 0.93 0.93 0.92 0.91 0.91 0.90 0.90 0.89
Industrial
Electricity 0.97 0.97 0.97 0.95 0.95 0.94 0.94 0.95 0.96 0.96 0.96 0.96 0.96 0.96 0.97
Distillate Oil 0.95 0.95 0.95 0.95 0.96 0.96 0.98 1.01 1.01 1.02 1.05 1.08 1.11 1.13 1.13
Residual Oil 1.00 1.01 1.02 1.02 1.03 1.03 1.03 1.04 1.04 1.05 1.05 1.06 1.07 1.07 1.08
Natural Gas 0.96 1.04 1.08 1.09 1.10 1.12 1.13 1.14 1.15 1.17 1.19 1.20 1.21 1.22 1.23
Coal 0.99 0.98 0.97 0.96 0.96 0.95 0.94 0.94 0.94 0.93 0.92 0.91 0.91 0.91 0.90
Transportation
Motor Gasoline 0.97 0.97 0.98 0.99 1.00 1.00 1.00 1.00 1.00 1.00 1.00 1.00 1.00 1.00 1.00
----------------- ----- ----- ----- ----- ----- ----- ----- ----- ----- ----- ----- ----- ----- ----- -----

37
Table Ca-5, continued. Projected fuel price indices (excluding general inflation), by end-use sector and fuel type.
United States Average
Projected April 1 Fuel Price Indices (April 1, 2002 = 1.00)
----------------- ----- ----- ----- ----- ----- ----- ----- ----- ----- ----- ----- ----- ----- ----- -----
Sector and Fuel 2018 2019 2020 2021 2022 2023 2024 2025 2026 2027 2028 2029 2030 2031 2032
----------------- ----- ----- ----- ----- ----- ----- ----- ----- ----- ----- ----- ----- ----- ----- -----
Residential
Electricity 0.95 0.95 0.95 0.95 0.95 0.95 0.95 0.95 0.96 0.96 0.96 0.96 0.96 0.96 0.96
Distillate Oil 1.00 1.00 1.00 1.01 1.01 1.01 1.02 1.02 1.02 1.02 1.03 1.03 1.03 1.04 1.04
LPG 1.12 1.12 1.13 1.13 1.13 1.13 1.13 1.14 1.14 1.14 1.14 1.14 1.15 1.15 1.15
Natural Gas 1.00 1.00 1.01 1.01 1.02 1.03 1.03 1.04 1.04 1.05 1.06 1.07 1.07 1.08 1.09
Commercial
Electricity 0.93 0.93 0.93 0.94 0.94 0.94 0.94 0.95 0.95 0.95 0.95 0.95 0.96 0.96 0.96
Distillate Oil 1.10 1.11 1.11 1.11 1.12 1.12 1.13 1.13 1.14 1.14 1.14 1.15 1.15 1.16 1.16
Residual Oil 1.07 1.08 1.08 1.09 1.10 1.10 1.11 1.12 1.12 1.13 1.14 1.14 1.15 1.16 1.16
Natural Gas 1.03 1.03 1.04 1.05 1.06 1.07 1.07 1.08 1.09 1.10 1.11 1.11 1.12 1.13 1.14
Coal 0.88 0.88 0.87 0.86 0.86 0.86 0.85 0.85 0.85 0.85 0.85 0.85 0.85 0.85 0.85
Industrial
Electricity 0.98 0.98 0.99 0.99 1.00 1.00 1.01 1.01 1.01 1.02 1.02 1.03 1.03 1.04 1.04
Distillate Oil 1.13 1.14 1.15 1.15 1.16 1.16 1.17 1.17 1.18 1.18 1.18 1.19 1.19 1.20 1.20
Residual Oil 1.08 1.09 1.10 1.11 1.11 1.12 1.13 1.13 1.14 1.15 1.15 1.16 1.17 1.17 1.18
Natural Gas 1.25 1.26 1.28 1.30 1.31 1.32 1.34 1.35 1.37 1.38 1.40 1.41 1.43 1.45 1.46
Coal 0.88 0.88 0.87 0.87 0.86 0.86 0.86 0.86 0.86 0.86 0.86 0.86 0.86 0.86 0.86
Transportation
Motor Gasoline 1.00 1.00 1.00 1.00 1.00 1.01 1.01 1.01 1.01 1.02 1.02 1.02 1.02 1.02 1.03
----------------- ----- ----- ----- ----- ----- ----- ----- ----- ----- ----- ----- ----- ----- ----- -----
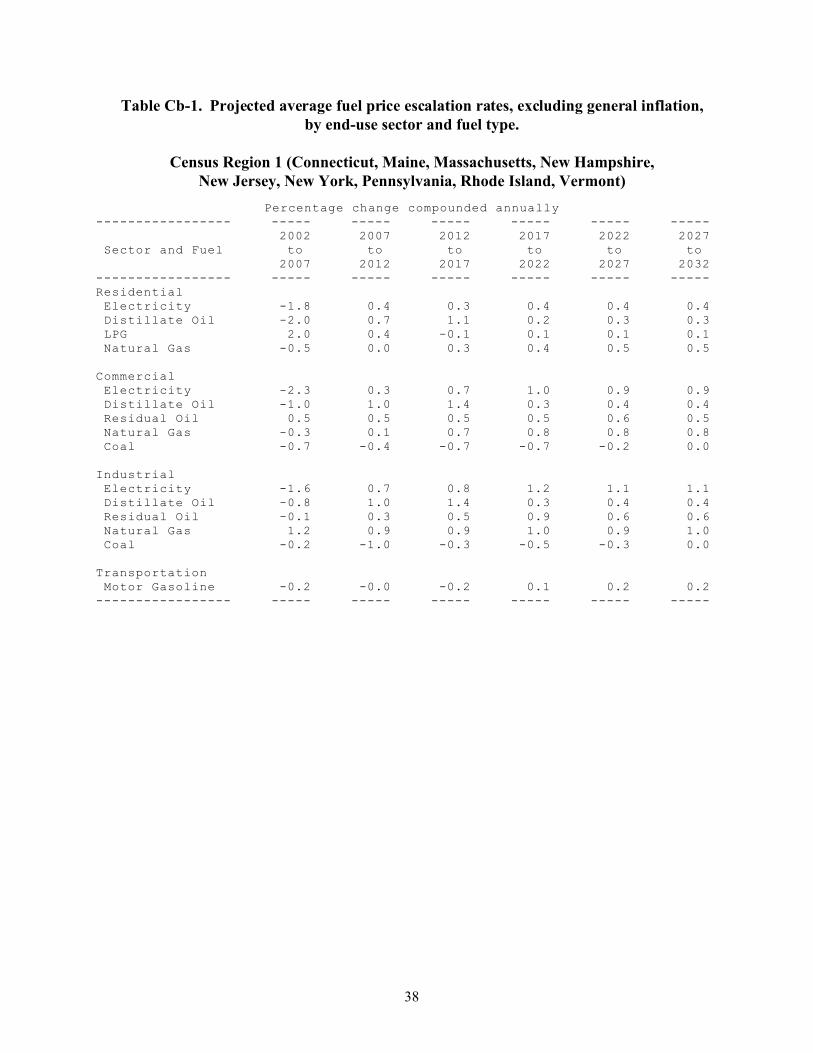
38
Table Cb-1. Projected average fuel price escalation rates, excluding general inflation,by end-use sector and fuel type.
Census Region 1 (Connecticut, Maine, Massachusetts, New Hampshire,New Jersey, New York, Pennsylvania, Rhode Island, Vermont)
Percentage change compounded annually----------------- ----- ----- ----- ----- ----- ----- 2002 2007 2012 2017 2022 2027 Sector and Fuel to to to to to to 2007 2012 2017 2022 2027 2032 ----------------- ----- ----- ----- ----- ----- ----- Residential Electricity -1.8 0.4 0.3 0.4 0.4 0.4 Distillate Oil -2.0 0.7 1.1 0.2 0.3 0.3 LPG 2.0 0.4 -0.1 0.1 0.1 0.1 Natural Gas -0.5 0.0 0.3 0.4 0.5 0.5
Commercial Electricity -2.3 0.3 0.7 1.0 0.9 0.9 Distillate Oil -1.0 1.0 1.4 0.3 0.4 0.4 Residual Oil 0.5 0.5 0.5 0.5 0.6 0.5 Natural Gas -0.3 0.1 0.7 0.8 0.8 0.8 Coal -0.7 -0.4 -0.7 -0.7 -0.2 0.0
Industrial Electricity -1.6 0.7 0.8 1.2 1.1 1.1 Distillate Oil -0.8 1.0 1.4 0.3 0.4 0.4 Residual Oil -0.1 0.3 0.5 0.9 0.6 0.6 Natural Gas 1.2 0.9 0.9 1.0 0.9 1.0 Coal -0.2 -1.0 -0.3 -0.5 -0.3 0.0
Transportation Motor Gasoline -0.2 -0.0 -0.2 0.1 0.2 0.2 ----------------- ----- ----- ----- ----- ----- -----

39
Table Cb-2. Projected average fuel price escalation rates, excluding general inflation,by end-use sector and fuel type.
Census Region 2 (Illinois, Indiana, Iowa, Kansas, Michigan, Minnesota, Missouri, Nebraska, North Dakota, Ohio, South Dakota, Wisconsin)
Percentage change compounded annually----------------- ----- ----- ----- ----- ----- ----- 2002 2007 2012 2017 2022 2027 Sector and Fuel to to to to to to 2007 2012 2017 2022 2027 2032 ----------------- ----- ----- ----- ----- ----- ----- Residential Electricity -0.8 0.1 -0.0 0.2 0.1 0.1 Distillate Oil -2.1 1.2 1.8 0.4 0.3 0.3 LPG 0.4 0.8 0.4 0.3 0.2 0.2 Natural Gas -0.3 0.2 0.4 0.6 0.7 0.7
Commercial Electricity -0.7 0.3 0.2 0.4 0.4 0.4 Distillate Oil -0.9 1.6 2.4 0.6 0.4 0.4 Residual Oil -0.1 0.6 0.6 0.6 0.7 0.6 Natural Gas -0.3 0.2 0.5 0.7 0.8 0.8 Coal -1.0 -0.5 -0.8 -0.7 -0.3 0.0
Industrial Electricity -0.3 0.6 0.5 0.7 0.7 0.6 Distillate Oil -0.7 1.5 2.2 0.5 0.3 0.3 Residual Oil -0.1 0.6 0.6 0.6 0.6 0.6 Natural Gas 1.4 1.2 0.9 1.1 1.0 1.1 Coal -1.0 -0.7 -0.5 -0.7 -0.2 0.0
Transportation Motor Gasoline -0.3 0.1 0.0 0.1 0.2 0.2----------------- ----- ----- ----- ----- ----- -----
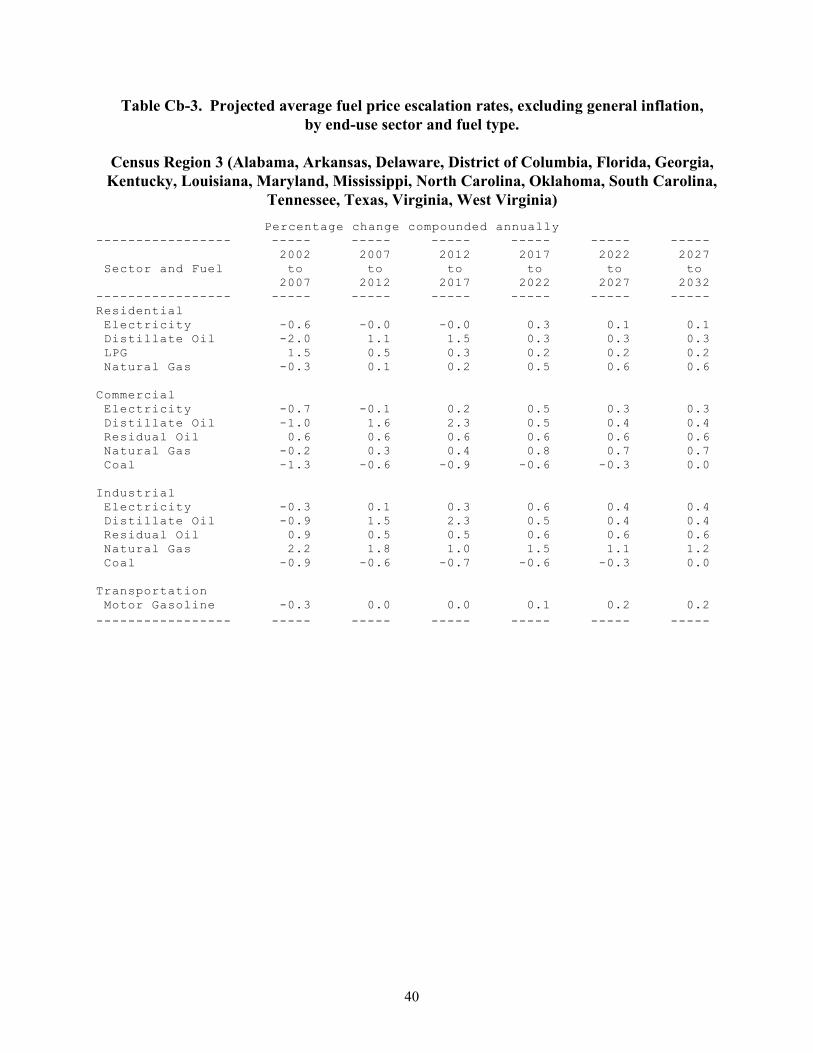
40
Table Cb-3. Projected average fuel price escalation rates, excluding general inflation,by end-use sector and fuel type.
Census Region 3 (Alabama, Arkansas, Delaware, District of Columbia, Florida, Georgia,Kentucky, Louisiana, Maryland, Mississippi, North Carolina, Oklahoma, South Carolina,
Tennessee, Texas, Virginia, West Virginia)
Percentage change compounded annually----------------- ----- ----- ----- ----- ----- ----- 2002 2007 2012 2017 2022 2027 Sector and Fuel to to to to to to 2007 2012 2017 2022 2027 2032 ----------------- ----- ----- ----- ----- ----- ----- Residential Electricity -0.6 -0.0 -0.0 0.3 0.1 0.1 Distillate Oil -2.0 1.1 1.5 0.3 0.3 0.3 LPG 1.5 0.5 0.3 0.2 0.2 0.2 Natural Gas -0.3 0.1 0.2 0.5 0.6 0.6
Commercial Electricity -0.7 -0.1 0.2 0.5 0.3 0.3 Distillate Oil -1.0 1.6 2.3 0.5 0.4 0.4 Residual Oil 0.6 0.6 0.6 0.6 0.6 0.6 Natural Gas -0.2 0.3 0.4 0.8 0.7 0.7 Coal -1.3 -0.6 -0.9 -0.6 -0.3 0.0
Industrial Electricity -0.3 0.1 0.3 0.6 0.4 0.4 Distillate Oil -0.9 1.5 2.3 0.5 0.4 0.4 Residual Oil 0.9 0.5 0.5 0.6 0.6 0.6 Natural Gas 2.2 1.8 1.0 1.5 1.1 1.2 Coal -0.9 -0.6 -0.7 -0.6 -0.3 0.0
Transportation Motor Gasoline -0.3 0.0 0.0 0.1 0.2 0.2
----------------- ----- ----- ----- ----- ----- -----

41
Table Cb-4. Projected average fuel price escalation rates, excluding general inflation,by end-use sector and fuel type.
Census Region 4 (Alaska, Arizona, California, Colorado, Hawaii, Idaho, Montana, Nevada, New Mexico, Oregon, Utah, Washington, Wyoming)
Percentage change compounded annually----------------- ----- ----- ----- ----- ----- ----- 2002 2007 2012 2017 2022 2027 Sector and Fuel to to to to to to 2007 2012 2017 2022 2027 2032 ----------------- ----- ----- ----- ----- ----- ----- Residential Electricity -2.6 0.1 -0.2 -0.1 -0.3 -0.3 Distillate Oil -1.8 0.0 0.7 0.3 0.3 0.3 LPG 2.2 1.0 0.5 0.0 0.1 0.1 Natural Gas -0.3 -0.3 0.3 0.5 0.6 0.7
Commercial Electricity -3.8 -0.4 -0.2 -0.2 -0.4 -0.4 Distillate Oil -0.7 0.2 1.2 0.5 0.4 0.4 Residual Oil 0.2 0.5 0.5 0.5 0.6 0.6 Natural Gas -0.2 -0.2 0.5 0.6 0.7 0.8 Coal -1.0 -0.5 -0.5 -0.5 -0.3 0.0
Industrial Electricity -3.6 -0.4 -0.2 -0.2 -0.4 -0.4 Distillate Oil -0.6 0.6 1.5 0.4 0.4 0.3 Residual Oil 0.6 0.5 0.5 0.6 0.6 0.6 Natural Gas 2.2 0.6 1.1 0.9 1.1 1.1 Coal -1.2 -0.7 -0.9 -0.9 -0.2 0.0
Transportation Motor Gasoline 0.6 0.5 -0.3 0.1 0.2 0.2----------------- ----- ----- ----- ----- ----- -----

42
Table Cb-5. Projected average fuel price escalation rates, excluding general inflation,by end-use sector and fuel type.
United States Average
Percentage change compounded annually----------------- ----- ----- ----- ----- ----- ----- 2002 2007 2012 2017 2022 2027 Sector and Fuel to to to to to to 2007 2012 2017 2022 2027 2032 ----------------- ----- ----- ----- ----- ----- ----- Residential Electricity -1.2 0.0 -0.0 0.2 0.1 0.1 Distillate Oil -2.0 0.8 1.2 0.3 0.3 0.3 LPG 1.2 0.7 0.3 0.2 0.2 0.2 Natural Gas -0.4 0.0 0.3 0.5 0.6 0.7
Commercial Electricity -1.8 -0.0 0.2 0.4 0.2 0.2 Distillate Oil -1.0 1.2 1.7 0.4 0.4 0.4 Residual Oil 0.4 0.5 0.5 0.6 0.6 0.6 Natural Gas -0.3 0.1 0.5 0.7 0.8 0.8 Coal -1.1 -0.5 -0.7 -0.6 -0.3 0.0
Industrial Electricity -1.1 0.2 0.3 0.6 0.4 0.4 Distillate Oil -0.8 1.3 2.0 0.5 0.4 0.3 Residual Oil 0.5 0.4 0.6 0.6 0.6 0.6 Natural Gas 1.9 1.3 1.0 1.2 1.1 1.1 Coal -0.9 -0.6 -0.6 -0.8 -0.2 0.0
Transportation Motor Gasoline -0.1 0.2 -0.1 0.1 0.2 0.2 ----------------- ----- ----- ----- ----- ----- -----
43
PART II: ENERGY PRICE INDICES FOR PRIVATESECTOR LCC ANALYSIS
This section presents tables of projected nominal (i.e., including inflation) fuel price indices for fourfuels in the residential sector and five fuels in the commercial sector for each of the years from 2002through 2032. These price indices are based on the DOE energy price projections, reported in partI-B of this document, used to calculate the FEMP and OMB UPV* factors for energy costs. Thetables are provided as an update to similar tables originally published in Comprehensive Guide forLeast-Cost Energy Decisions (NBS SP 709).
As a convenience for the user, the indices include the effect of four alternative, hypothetical ratesof general price inflation: 2, 3, 4, and 5%. Selection of these rates is in no way intended to suggestwhat actual rates might be. Use of the indices produce price estimates which are in current dollars,inclusive of general price inflation. Current dollar prices are needed when discounting is performedwith discount rates that include general price inflation (i.e., nominal or market discount rates).
The indices based on inflation rates of 2, 3, 4, and 5% allow the analyst to perform evaluations basedon the assumption of a positive rate of general price inflation that changes the purchasing power ofthe dollar. Performing evaluations in current dollars is sometimes preferred for private investmentdecisions, primarily because it facilitates the treatment of taxes.
The indices in Tables S-1 through S-5 are derived from the indices reported in Tables Ca-1 throughCa-5 by means of the following equation:
where IS =index found in Tables S-1 through S-5;IC =index found in Tables Ca-1 through Ca-5;g =annual rate of general price inflation in decimal form; andN =number of years, in this case equal to the year of the index minus 2002.
Example of How to Use the Indices:
Suppose you wish to estimate the annual cost of natural gas for a house in Maryland in year 2005,given the annual cost in 2002 (April 1) prices, and you expect an annual inflation rate of 3% per year.From table S-3, find the column with residential natural gas indices at an inflation rate of 3%; thenlocate the index for the year 2005. This index is 1.09. Multiply the annual cost in 2002 prices to findthe estimated annual cost in year-2005 prices.
If this annual cost in year-2005 prices is to be discounted to present value, you must use a nominaldiscount rate that includes the same assumption with regard to general price inflation (3% in thisexample). To obtain a present-value cost over the entire study period, the present-value calculationmust be repeated for each year that there are natural gas costs, and the results summed. (UPV*

44
factors are not given for private sector use because of the large number of tables required to coverpotential discount rates that might be used by the analyst.) The BLCC computer program canperform LCC analyses using any inflation rate and discount rate, in constant or in current (market)dollars. The DISCOUNT program, included with BLCC, can compute UPV* factors based on DOEenergy price escalation rates using any inflation rate and discount rate. (See page iv for moreinformation on these programs.) Of course, the private sector analyst may use the UPV* factorsreported in Part I, provided the analysis is performed in constant dollars and the desired discount ratecorresponds to the DOE or OMB discount rates used in Part I.
For further explanation of the use of these indices, see NBS Special Publication 709, appendix B,Part I.
The data in the tables that follow are reported for the four Census regions and the U.S. average.Figure B-1 on page 13 presents a map showing the states corresponding to the four Census regions.The Census regions do not include American Samoa, Canal Zone, Guam, Puerto Rico, TrustTerritory of the Pacific Islands, or the Virgin Islands. Analysts of federal projects in these areasshould use data which are "reasonable under the circumstances," and may refer to the tables withU.S. average data for guidance.

45
Table S-1. Projected fuel price indices with assumed general price inflation ratesof 2, 3, 4, and 5 percent, by end-use sector and fuel type.
Census Region 1 (Connecticut, Maine, Massachusetts, New Hampshire,New Jersey, New York, Pennsylvania, Rhode Island, Vermont)
Projected April 1 Fuel Price Indices (April 1, 2002 = 1.00) ------------------------------------------------RESIDENTIAL---------------------------------------------- Electricity Distillate Oil LPG Natural Gas ------------------------ ------------------------ ------------------------ ------------------------
Inflation Rate Inflation Rate Inflation Rate Inflation Rate Year 2% 3% 4% 5% 2% 3% 4% 5% 2% 3% 4% 5% 2% 3% 4% 5% 2003 0.98 0.99 1.00 1.01 0.94 0.95 0.96 0.96 1.09 1.10 1.11 1.12 0.97 0.98 0.99 1.00 2004 0.99 1.01 1.03 1.05 0.94 0.96 0.98 1.00 1.15 1.17 1.19 1.22 1.01 1.03 1.05 1.07 2005 1.00 1.03 1.06 1.09 0.96 0.99 1.02 1.05 1.17 1.20 1.24 1.27 1.04 1.07 1.10 1.14 2006 1.00 1.04 1.08 1.12 0.98 1.02 1.06 1.10 1.19 1.24 1.29 1.34 1.06 1.10 1.15 1.19 2007 1.01 1.06 1.11 1.17 1.00 1.05 1.10 1.15 1.22 1.28 1.34 1.41 1.08 1.13 1.19 1.25 2008 1.02 1.08 1.15 1.22 1.02 1.08 1.14 1.21 1.24 1.32 1.40 1.48 1.10 1.17 1.24 1.31 2009 1.05 1.12 1.20 1.28 1.05 1.13 1.21 1.29 1.27 1.36 1.46 1.56 1.12 1.20 1.28 1.37 2010 1.08 1.16 1.26 1.36 1.09 1.18 1.27 1.37 1.31 1.41 1.53 1.65 1.14 1.23 1.33 1.44 2011 1.11 1.21 1.32 1.44 1.12 1.22 1.33 1.45 1.34 1.46 1.59 1.74 1.17 1.27 1.39 1.51 2012 1.14 1.25 1.38 1.52 1.14 1.26 1.39 1.53 1.37 1.51 1.67 1.83 1.19 1.31 1.45 1.59 2013 1.16 1.29 1.44 1.60 1.19 1.32 1.47 1.63 1.40 1.56 1.73 1.92 1.22 1.35 1.51 1.67 2014 1.19 1.33 1.50 1.68 1.24 1.39 1.57 1.76 1.43 1.60 1.80 2.02 1.24 1.40 1.57 1.76 2015 1.21 1.38 1.56 1.77 1.27 1.45 1.64 1.86 1.45 1.65 1.87 2.12 1.27 1.45 1.64 1.86 2016 1.25 1.43 1.63 1.87 1.30 1.49 1.71 1.95 1.48 1.70 1.94 2.22 1.30 1.49 1.71 1.95 2017 1.28 1.48 1.71 1.97 1.33 1.54 1.78 2.06 1.51 1.74 2.02 2.33 1.33 1.54 1.79 2.06 2018 1.31 1.53 1.78 2.08 1.36 1.59 1.86 2.17 1.54 1.80 2.10 2.45 1.37 1.60 1.86 2.17 2019 1.34 1.58 1.86 2.19 1.39 1.64 1.94 2.28 1.57 1.86 2.19 2.57 1.40 1.65 1.94 2.29 2020 1.37 1.63 1.94 2.31 1.42 1.70 2.02 2.40 1.61 1.92 2.28 2.71 1.43 1.71 2.03 2.41 2021 1.40 1.69 2.03 2.43 1.46 1.75 2.10 2.52 1.64 1.98 2.37 2.85 1.47 1.77 2.12 2.55 2022 1.44 1.75 2.12 2.57 1.49 1.81 2.19 2.66 1.68 2.04 2.47 2.99 1.51 1.83 2.22 2.69 2023 1.47 1.81 2.21 2.71 1.52 1.87 2.29 2.80 1.71 2.10 2.57 3.15 1.54 1.89 2.32 2.84 2024 1.51 1.87 2.31 2.85 1.56 1.93 2.39 2.95 1.75 2.17 2.68 3.31 1.58 1.96 2.43 3.00 2025 1.54 1.93 2.41 3.01 1.59 1.99 2.49 3.10 1.79 2.24 2.79 3.48 1.62 2.03 2.54 3.16 2026 1.58 2.00 2.52 3.17 1.63 2.06 2.60 3.27 1.82 2.31 2.91 3.66 1.66 2.10 2.65 3.34 2027 1.62 2.07 2.63 3.34 1.67 2.13 2.71 3.44 1.86 2.38 3.03 3.85 1.71 2.18 2.77 3.52 2028 1.66 2.14 2.75 3.52 1.70 2.19 2.82 3.62 1.90 2.45 3.15 4.04 1.75 2.25 2.90 3.72 2029 1.70 2.21 2.87 3.72 1.74 2.27 2.94 3.81 1.94 2.53 3.28 4.25 1.79 2.34 3.03 3.93 2030 1.74 2.29 3.00 3.92 1.78 2.34 3.07 4.01 1.99 2.61 3.42 4.47 1.84 2.42 3.17 4.14 2031 1.78 2.36 3.13 4.13 1.82 2.42 3.20 4.23 2.03 2.69 3.56 4.70 1.89 2.51 3.32 4.38 2032 1.83 2.45 3.27 4.36 1.86 2.50 3.34 4.45 2.07 2.78 3.71 4.95 1.94 2.60 3.47 4.62
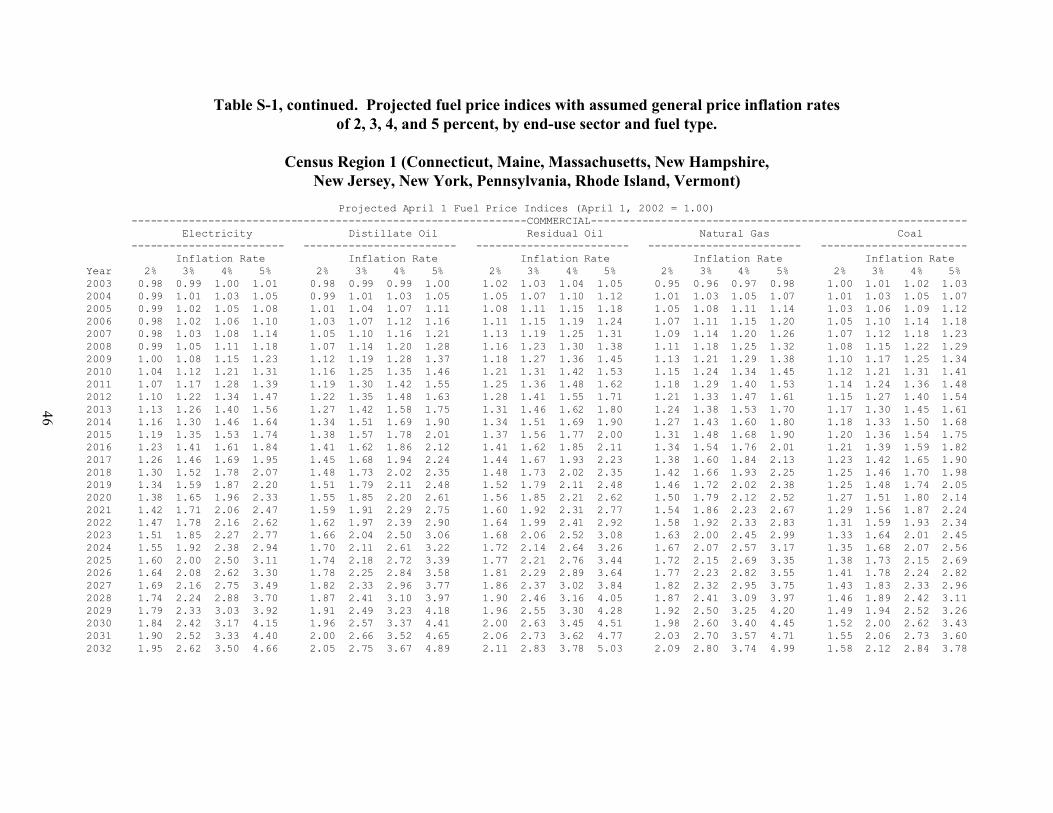
46
Table S-1, continued. Projected fuel price indices with assumed general price inflation ratesof 2, 3, 4, and 5 percent, by end-use sector and fuel type.
Census Region 1 (Connecticut, Maine, Massachusetts, New Hampshire,New Jersey, New York, Pennsylvania, Rhode Island, Vermont)
Projected April 1 Fuel Price Indices (April 1, 2002 = 1.00) --------------------------------------------------------------COMMERCIAL----------------------------------------------------------- Electricity Distillate Oil Residual Oil Natural Gas Coal ------------------------ ------------------------ ------------------------ ------------------------ ----------------------- Inflation Rate Inflation Rate Inflation Rate Inflation Rate Inflation Rate Year 2% 3% 4% 5% 2% 3% 4% 5% 2% 3% 4% 5% 2% 3% 4% 5% 2% 3% 4% 5%2003 0.98 0.99 1.00 1.01 0.98 0.99 0.99 1.00 1.02 1.03 1.04 1.05 0.95 0.96 0.97 0.98 1.00 1.01 1.02 1.03 2004 0.99 1.01 1.03 1.05 0.99 1.01 1.03 1.05 1.05 1.07 1.10 1.12 1.01 1.03 1.05 1.07 1.01 1.03 1.05 1.07 2005 0.99 1.02 1.05 1.08 1.01 1.04 1.07 1.11 1.08 1.11 1.15 1.18 1.05 1.08 1.11 1.14 1.03 1.06 1.09 1.12 2006 0.98 1.02 1.06 1.10 1.03 1.07 1.12 1.16 1.11 1.15 1.19 1.24 1.07 1.11 1.15 1.20 1.05 1.10 1.14 1.18 2007 0.98 1.03 1.08 1.14 1.05 1.10 1.16 1.21 1.13 1.19 1.25 1.31 1.09 1.14 1.20 1.26 1.07 1.12 1.18 1.23 2008 0.99 1.05 1.11 1.18 1.07 1.14 1.20 1.28 1.16 1.23 1.30 1.38 1.11 1.18 1.25 1.32 1.08 1.15 1.22 1.29 2009 1.00 1.08 1.15 1.23 1.12 1.19 1.28 1.37 1.18 1.27 1.36 1.45 1.13 1.21 1.29 1.38 1.10 1.17 1.25 1.34 2010 1.04 1.12 1.21 1.31 1.16 1.25 1.35 1.46 1.21 1.31 1.42 1.53 1.15 1.24 1.34 1.45 1.12 1.21 1.31 1.41 2011 1.07 1.17 1.28 1.39 1.19 1.30 1.42 1.55 1.25 1.36 1.48 1.62 1.18 1.29 1.40 1.53 1.14 1.24 1.36 1.48 2012 1.10 1.22 1.34 1.47 1.22 1.35 1.48 1.63 1.28 1.41 1.55 1.71 1.21 1.33 1.47 1.61 1.15 1.27 1.40 1.54 2013 1.13 1.26 1.40 1.56 1.27 1.42 1.58 1.75 1.31 1.46 1.62 1.80 1.24 1.38 1.53 1.70 1.17 1.30 1.45 1.61 2014 1.16 1.30 1.46 1.64 1.34 1.51 1.69 1.90 1.34 1.51 1.69 1.90 1.27 1.43 1.60 1.80 1.18 1.33 1.50 1.68 2015 1.19 1.35 1.53 1.74 1.38 1.57 1.78 2.01 1.37 1.56 1.77 2.00 1.31 1.48 1.68 1.90 1.20 1.36 1.54 1.75 2016 1.23 1.41 1.61 1.84 1.41 1.62 1.86 2.12 1.41 1.62 1.85 2.11 1.34 1.54 1.76 2.01 1.21 1.39 1.59 1.82 2017 1.26 1.46 1.69 1.95 1.45 1.68 1.94 2.24 1.44 1.67 1.93 2.23 1.38 1.60 1.84 2.13 1.23 1.42 1.65 1.90 2018 1.30 1.52 1.78 2.07 1.48 1.73 2.02 2.35 1.48 1.73 2.02 2.35 1.42 1.66 1.93 2.25 1.25 1.46 1.70 1.98 2019 1.34 1.59 1.87 2.20 1.51 1.79 2.11 2.48 1.52 1.79 2.11 2.48 1.46 1.72 2.02 2.38 1.25 1.48 1.74 2.05 2020 1.38 1.65 1.96 2.33 1.55 1.85 2.20 2.61 1.56 1.85 2.21 2.62 1.50 1.79 2.12 2.52 1.27 1.51 1.80 2.14 2021 1.42 1.71 2.06 2.47 1.59 1.91 2.29 2.75 1.60 1.92 2.31 2.77 1.54 1.86 2.23 2.67 1.29 1.56 1.87 2.24 2022 1.47 1.78 2.16 2.62 1.62 1.97 2.39 2.90 1.64 1.99 2.41 2.92 1.58 1.92 2.33 2.83 1.31 1.59 1.93 2.34 2023 1.51 1.85 2.27 2.77 1.66 2.04 2.50 3.06 1.68 2.06 2.52 3.08 1.63 2.00 2.45 2.99 1.33 1.64 2.01 2.45 2024 1.55 1.92 2.38 2.94 1.70 2.11 2.61 3.22 1.72 2.14 2.64 3.26 1.67 2.07 2.57 3.17 1.35 1.68 2.07 2.56 2025 1.60 2.00 2.50 3.11 1.74 2.18 2.72 3.39 1.77 2.21 2.76 3.44 1.72 2.15 2.69 3.35 1.38 1.73 2.15 2.69 2026 1.64 2.08 2.62 3.30 1.78 2.25 2.84 3.58 1.81 2.29 2.89 3.64 1.77 2.23 2.82 3.55 1.41 1.78 2.24 2.82 2027 1.69 2.16 2.75 3.49 1.82 2.33 2.96 3.77 1.86 2.37 3.02 3.84 1.82 2.32 2.95 3.75 1.43 1.83 2.33 2.96 2028 1.74 2.24 2.88 3.70 1.87 2.41 3.10 3.97 1.90 2.46 3.16 4.05 1.87 2.41 3.09 3.97 1.46 1.89 2.42 3.11 2029 1.79 2.33 3.03 3.92 1.91 2.49 3.23 4.18 1.96 2.55 3.30 4.28 1.92 2.50 3.25 4.20 1.49 1.94 2.52 3.26 2030 1.84 2.42 3.17 4.15 1.96 2.57 3.37 4.41 2.00 2.63 3.45 4.51 1.98 2.60 3.40 4.45 1.52 2.00 2.62 3.43 2031 1.90 2.52 3.33 4.40 2.00 2.66 3.52 4.65 2.06 2.73 3.62 4.77 2.03 2.70 3.57 4.71 1.55 2.06 2.73 3.60 2032 1.95 2.62 3.50 4.66 2.05 2.75 3.67 4.89 2.11 2.83 3.78 5.03 2.09 2.80 3.74 4.99 1.58 2.12 2.84 3.78

47
Table S-1, continued. Projected fuel price indices with assumed general price inflation rates of 2, 3, 4, and 5 percent, by end-use sector and fuel type.
Census Region 1 (Connecticut, Maine, Massachusetts, New Hampshire, New Jersey, New York, Pennsylvania, Rhode Island, Vermont)
Projected April 1 Fuel Price Indices (April 1, 2002 = 1.00) ---------------------------------------------------------------INDUSTRIAL---------------------------------------------------------- Electricity Distillate Oil Residual Oil Natural Gas Coal ------------------------ ------------------------ ------------------------ ------------------------ ------------------------ Inflation Rate Inflation Rate Inflation Rate Inflation Rate Inflation Rate Year 2% 3% 4% 5% 2% 3% 4% 5% 2% 3% 4% 5% 2% 3% 4% 5% 2% 3% 4% 5%2003 0.99 1.00 1.01 1.02 0.98 0.99 1.00 1.01 0.99 1.00 1.01 1.02 0.96 0.97 0.98 0.99 1.00 1.01 1.02 1.03 2004 1.02 1.04 1.06 1.08 1.00 1.02 1.04 1.06 1.02 1.04 1.06 1.08 1.04 1.06 1.08 1.10 1.02 1.04 1.06 1.09 2005 1.02 1.05 1.08 1.12 1.02 1.05 1.08 1.11 1.05 1.08 1.11 1.14 1.10 1.13 1.16 1.20 1.05 1.08 1.12 1.15 2006 1.02 1.06 1.10 1.14 1.04 1.08 1.13 1.17 1.07 1.12 1.16 1.21 1.14 1.18 1.23 1.28 1.08 1.13 1.17 1.22 2007 1.02 1.07 1.12 1.18 1.06 1.11 1.17 1.22 1.10 1.15 1.21 1.27 1.17 1.23 1.29 1.36 1.10 1.15 1.21 1.27 2008 1.03 1.09 1.16 1.22 1.08 1.14 1.21 1.28 1.12 1.19 1.26 1.34 1.21 1.28 1.36 1.44 1.11 1.18 1.25 1.32 2009 1.05 1.12 1.20 1.29 1.12 1.20 1.29 1.38 1.15 1.23 1.32 1.41 1.24 1.33 1.43 1.52 1.12 1.20 1.29 1.37 2010 1.09 1.18 1.27 1.37 1.17 1.26 1.36 1.47 1.18 1.28 1.38 1.49 1.28 1.39 1.50 1.62 1.14 1.24 1.34 1.44 2011 1.13 1.24 1.35 1.47 1.20 1.31 1.43 1.56 1.20 1.31 1.43 1.56 1.32 1.44 1.57 1.71 1.15 1.25 1.37 1.49 2012 1.17 1.29 1.42 1.56 1.23 1.35 1.49 1.64 1.23 1.36 1.49 1.64 1.36 1.49 1.65 1.81 1.15 1.27 1.40 1.54 2013 1.20 1.34 1.49 1.66 1.28 1.43 1.59 1.76 1.26 1.40 1.56 1.73 1.40 1.55 1.73 1.92 1.18 1.31 1.46 1.62 2014 1.23 1.39 1.56 1.75 1.35 1.52 1.70 1.91 1.29 1.45 1.63 1.83 1.44 1.62 1.81 2.03 1.20 1.35 1.51 1.70 2015 1.27 1.44 1.63 1.85 1.39 1.58 1.79 2.03 1.33 1.51 1.71 1.93 1.48 1.68 1.90 2.16 1.21 1.38 1.56 1.77 2016 1.31 1.50 1.71 1.96 1.42 1.63 1.87 2.13 1.36 1.56 1.78 2.04 1.52 1.75 2.00 2.28 1.24 1.42 1.62 1.86 2017 1.35 1.56 1.80 2.08 1.46 1.68 1.95 2.25 1.39 1.61 1.87 2.15 1.57 1.81 2.10 2.42 1.25 1.45 1.67 1.93 2018 1.39 1.63 1.90 2.21 1.49 1.74 2.03 2.37 1.43 1.68 1.96 2.28 1.61 1.89 2.20 2.56 1.27 1.48 1.73 2.01 2019 1.44 1.70 2.00 2.35 1.52 1.80 2.12 2.49 1.48 1.75 2.06 2.43 1.66 1.96 2.31 2.72 1.28 1.51 1.78 2.10 2020 1.49 1.77 2.11 2.50 1.56 1.86 2.21 2.63 1.53 1.82 2.17 2.57 1.72 2.04 2.43 2.89 1.31 1.56 1.85 2.20 2021 1.53 1.84 2.22 2.66 1.59 1.92 2.31 2.77 1.57 1.89 2.26 2.72 1.76 2.12 2.55 3.06 1.32 1.59 1.91 2.29 2022 1.58 1.92 2.33 2.82 1.63 1.98 2.41 2.91 1.61 1.96 2.37 2.87 1.82 2.21 2.68 3.25 1.35 1.64 1.99 2.40 2023 1.63 2.00 2.45 3.00 1.67 2.05 2.51 3.07 1.65 2.03 2.48 3.03 1.87 2.30 2.81 3.44 1.36 1.67 2.05 2.50 2024 1.68 2.08 2.58 3.18 1.71 2.12 2.62 3.24 1.70 2.10 2.60 3.21 1.93 2.39 2.95 3.64 1.39 1.72 2.13 2.63 2025 1.73 2.17 2.71 3.38 1.75 2.19 2.73 3.41 1.74 2.18 2.72 3.39 1.98 2.48 3.10 3.87 1.40 1.76 2.20 2.74 2026 1.79 2.26 2.85 3.58 1.79 2.27 2.86 3.59 1.78 2.25 2.84 3.57 2.05 2.58 3.26 4.10 1.43 1.81 2.28 2.87 2027 1.84 2.35 2.99 3.80 1.83 2.34 2.98 3.78 1.83 2.34 2.98 3.78 2.10 2.68 3.42 4.34 1.46 1.86 2.37 3.02 2028 1.90 2.45 3.15 4.04 1.88 2.42 3.11 3.99 1.88 2.42 3.11 3.99 2.17 2.79 3.59 4.60 1.49 1.92 2.47 3.17 2029 1.96 2.55 3.31 4.29 1.92 2.50 3.25 4.20 1.93 2.51 3.26 4.22 2.23 2.91 3.77 4.88 1.52 1.98 2.57 3.33 2030 2.02 2.66 3.48 4.55 1.97 2.58 3.39 4.43 1.98 2.60 3.41 4.45 2.30 3.02 3.95 5.17 1.55 2.04 2.67 3.49 2031 2.08 2.77 3.66 4.83 2.01 2.67 3.54 4.67 2.03 2.70 3.57 4.71 2.36 3.14 4.15 5.48 1.58 2.10 2.78 3.67 2032 2.15 2.88 3.85 5.13 2.06 2.76 3.69 4.92 2.08 2.79 3.73 4.97 2.44 3.26 4.36 5.81 1.61 2.16 2.89 3.85
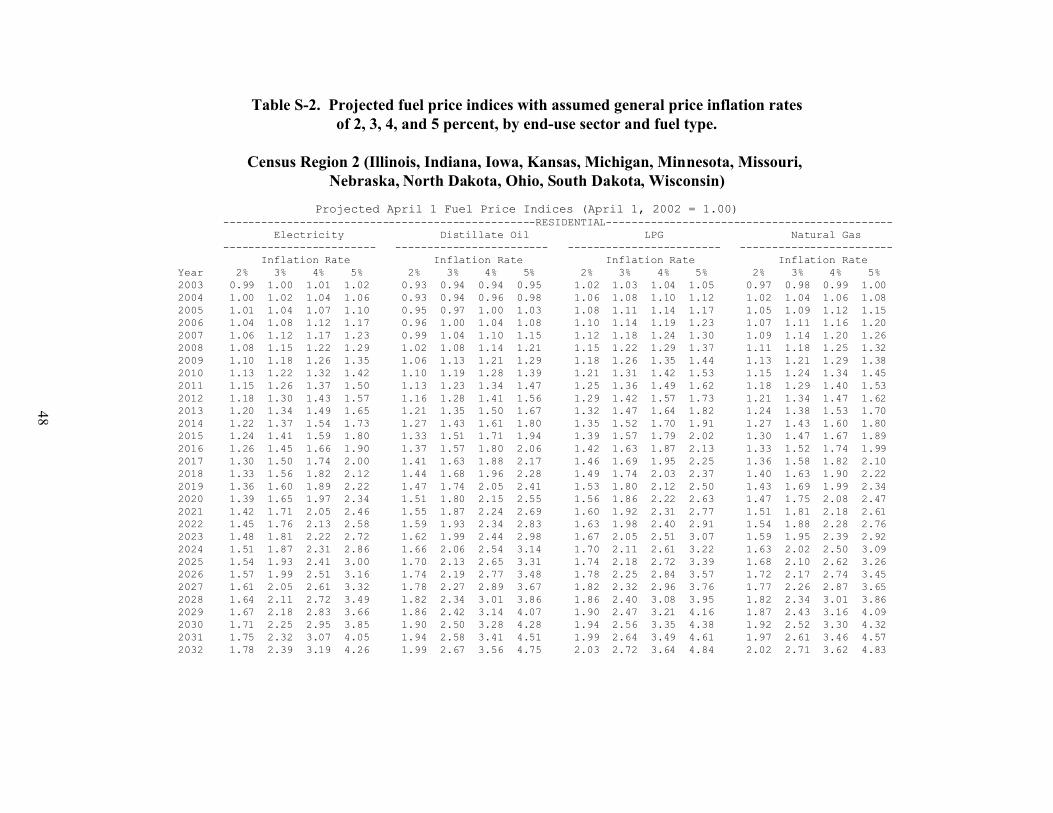
48
Table S-2. Projected fuel price indices with assumed general price inflation ratesof 2, 3, 4, and 5 percent, by end-use sector and fuel type.
Census Region 2 (Illinois, Indiana, Iowa, Kansas, Michigan, Minnesota, Missouri, Nebraska, North Dakota, Ohio, South Dakota, Wisconsin)
Projected April 1 Fuel Price Indices (April 1, 2002 = 1.00) -------------------------------------------------RESIDENTIAL--------------------------------------------- Electricity Distillate Oil LPG Natural Gas ------------------------ ------------------------ ------------------------ ------------------------ Inflation Rate Inflation Rate Inflation Rate Inflation Rate Year 2% 3% 4% 5% 2% 3% 4% 5% 2% 3% 4% 5% 2% 3% 4% 5% 2003 0.99 1.00 1.01 1.02 0.93 0.94 0.94 0.95 1.02 1.03 1.04 1.05 0.97 0.98 0.99 1.00 2004 1.00 1.02 1.04 1.06 0.93 0.94 0.96 0.98 1.06 1.08 1.10 1.12 1.02 1.04 1.06 1.08 2005 1.01 1.04 1.07 1.10 0.95 0.97 1.00 1.03 1.08 1.11 1.14 1.17 1.05 1.09 1.12 1.15 2006 1.04 1.08 1.12 1.17 0.96 1.00 1.04 1.08 1.10 1.14 1.19 1.23 1.07 1.11 1.16 1.20 2007 1.06 1.12 1.17 1.23 0.99 1.04 1.10 1.15 1.12 1.18 1.24 1.30 1.09 1.14 1.20 1.26 2008 1.08 1.15 1.22 1.29 1.02 1.08 1.14 1.21 1.15 1.22 1.29 1.37 1.11 1.18 1.25 1.32 2009 1.10 1.18 1.26 1.35 1.06 1.13 1.21 1.29 1.18 1.26 1.35 1.44 1.13 1.21 1.29 1.38 2010 1.13 1.22 1.32 1.42 1.10 1.19 1.28 1.39 1.21 1.31 1.42 1.53 1.15 1.24 1.34 1.45 2011 1.15 1.26 1.37 1.50 1.13 1.23 1.34 1.47 1.25 1.36 1.49 1.62 1.18 1.29 1.40 1.53 2012 1.18 1.30 1.43 1.57 1.16 1.28 1.41 1.56 1.29 1.42 1.57 1.73 1.21 1.34 1.47 1.62 2013 1.20 1.34 1.49 1.65 1.21 1.35 1.50 1.67 1.32 1.47 1.64 1.82 1.24 1.38 1.53 1.70 2014 1.22 1.37 1.54 1.73 1.27 1.43 1.61 1.80 1.35 1.52 1.70 1.91 1.27 1.43 1.60 1.80 2015 1.24 1.41 1.59 1.80 1.33 1.51 1.71 1.94 1.39 1.57 1.79 2.02 1.30 1.47 1.67 1.89 2016 1.26 1.45 1.66 1.90 1.37 1.57 1.80 2.06 1.42 1.63 1.87 2.13 1.33 1.52 1.74 1.99 2017 1.30 1.50 1.74 2.00 1.41 1.63 1.88 2.17 1.46 1.69 1.95 2.25 1.36 1.58 1.82 2.10 2018 1.33 1.56 1.82 2.12 1.44 1.68 1.96 2.28 1.49 1.74 2.03 2.37 1.40 1.63 1.90 2.22 2019 1.36 1.60 1.89 2.22 1.47 1.74 2.05 2.41 1.53 1.80 2.12 2.50 1.43 1.69 1.99 2.34 2020 1.39 1.65 1.97 2.34 1.51 1.80 2.15 2.55 1.56 1.86 2.22 2.63 1.47 1.75 2.08 2.47 2021 1.42 1.71 2.05 2.46 1.55 1.87 2.24 2.69 1.60 1.92 2.31 2.77 1.51 1.81 2.18 2.61 2022 1.45 1.76 2.13 2.58 1.59 1.93 2.34 2.83 1.63 1.98 2.40 2.91 1.54 1.88 2.28 2.76 2023 1.48 1.81 2.22 2.72 1.62 1.99 2.44 2.98 1.67 2.05 2.51 3.07 1.59 1.95 2.39 2.92 2024 1.51 1.87 2.31 2.86 1.66 2.06 2.54 3.14 1.70 2.11 2.61 3.22 1.63 2.02 2.50 3.09 2025 1.54 1.93 2.41 3.00 1.70 2.13 2.65 3.31 1.74 2.18 2.72 3.39 1.68 2.10 2.62 3.26 2026 1.57 1.99 2.51 3.16 1.74 2.19 2.77 3.48 1.78 2.25 2.84 3.57 1.72 2.17 2.74 3.45 2027 1.61 2.05 2.61 3.32 1.78 2.27 2.89 3.67 1.82 2.32 2.96 3.76 1.77 2.26 2.87 3.65 2028 1.64 2.11 2.72 3.49 1.82 2.34 3.01 3.86 1.86 2.40 3.08 3.95 1.82 2.34 3.01 3.86 2029 1.67 2.18 2.83 3.66 1.86 2.42 3.14 4.07 1.90 2.47 3.21 4.16 1.87 2.43 3.16 4.09 2030 1.71 2.25 2.95 3.85 1.90 2.50 3.28 4.28 1.94 2.56 3.35 4.38 1.92 2.52 3.30 4.32 2031 1.75 2.32 3.07 4.05 1.94 2.58 3.41 4.51 1.99 2.64 3.49 4.61 1.97 2.61 3.46 4.57 2032 1.78 2.39 3.19 4.26 1.99 2.67 3.56 4.75 2.03 2.72 3.64 4.84 2.02 2.71 3.62 4.83
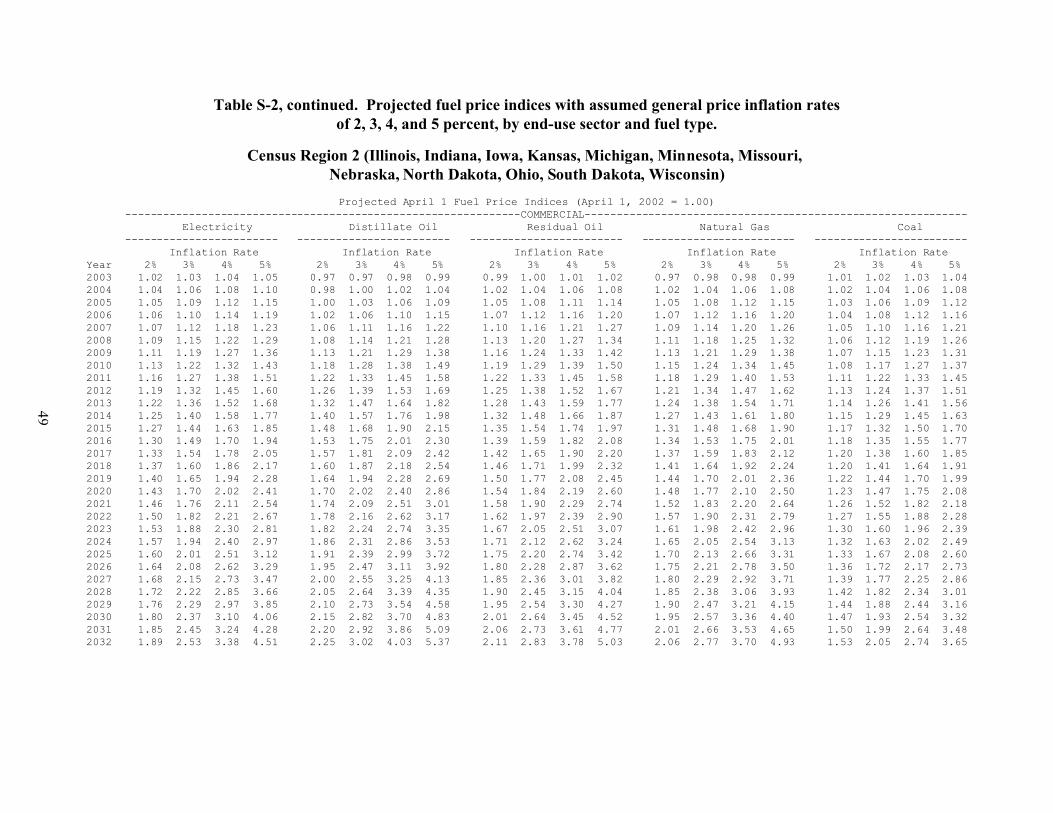
49
Table S-2, continued. Projected fuel price indices with assumed general price inflation ratesof 2, 3, 4, and 5 percent, by end-use sector and fuel type.
Census Region 2 (Illinois, Indiana, Iowa, Kansas, Michigan, Minnesota, Missouri, Nebraska, North Dakota, Ohio, South Dakota, Wisconsin)
Projected April 1 Fuel Price Indices (April 1, 2002 = 1.00) --------------------------------------------------------------COMMERCIAL------------------------------------------------------------ Electricity Distillate Oil Residual Oil Natural Gas Coal ------------------------ ------------------------ ------------------------ ------------------------ ------------------------ Inflation Rate Inflation Rate Inflation Rate Inflation Rate Inflation Rate Year 2% 3% 4% 5% 2% 3% 4% 5% 2% 3% 4% 5% 2% 3% 4% 5% 2% 3% 4% 5% 2003 1.02 1.03 1.04 1.05 0.97 0.97 0.98 0.99 0.99 1.00 1.01 1.02 0.97 0.98 0.98 0.99 1.01 1.02 1.03 1.04 2004 1.04 1.06 1.08 1.10 0.98 1.00 1.02 1.04 1.02 1.04 1.06 1.08 1.02 1.04 1.06 1.08 1.02 1.04 1.06 1.08 2005 1.05 1.09 1.12 1.15 1.00 1.03 1.06 1.09 1.05 1.08 1.11 1.14 1.05 1.08 1.12 1.15 1.03 1.06 1.09 1.12 2006 1.06 1.10 1.14 1.19 1.02 1.06 1.10 1.15 1.07 1.12 1.16 1.20 1.07 1.12 1.16 1.20 1.04 1.08 1.12 1.16 2007 1.07 1.12 1.18 1.23 1.06 1.11 1.16 1.22 1.10 1.16 1.21 1.27 1.09 1.14 1.20 1.26 1.05 1.10 1.16 1.21 2008 1.09 1.15 1.22 1.29 1.08 1.14 1.21 1.28 1.13 1.20 1.27 1.34 1.11 1.18 1.25 1.32 1.06 1.12 1.19 1.26 2009 1.11 1.19 1.27 1.36 1.13 1.21 1.29 1.38 1.16 1.24 1.33 1.42 1.13 1.21 1.29 1.38 1.07 1.15 1.23 1.31 2010 1.13 1.22 1.32 1.43 1.18 1.28 1.38 1.49 1.19 1.29 1.39 1.50 1.15 1.24 1.34 1.45 1.08 1.17 1.27 1.37 2011 1.16 1.27 1.38 1.51 1.22 1.33 1.45 1.58 1.22 1.33 1.45 1.58 1.18 1.29 1.40 1.53 1.11 1.22 1.33 1.45 2012 1.19 1.32 1.45 1.60 1.26 1.39 1.53 1.69 1.25 1.38 1.52 1.67 1.21 1.34 1.47 1.62 1.13 1.24 1.37 1.51 2013 1.22 1.36 1.52 1.68 1.32 1.47 1.64 1.82 1.28 1.43 1.59 1.77 1.24 1.38 1.54 1.71 1.14 1.26 1.41 1.56 2014 1.25 1.40 1.58 1.77 1.40 1.57 1.76 1.98 1.32 1.48 1.66 1.87 1.27 1.43 1.61 1.80 1.15 1.29 1.45 1.63 2015 1.27 1.44 1.63 1.85 1.48 1.68 1.90 2.15 1.35 1.54 1.74 1.97 1.31 1.48 1.68 1.90 1.17 1.32 1.50 1.70 2016 1.30 1.49 1.70 1.94 1.53 1.75 2.01 2.30 1.39 1.59 1.82 2.08 1.34 1.53 1.75 2.01 1.18 1.35 1.55 1.77 2017 1.33 1.54 1.78 2.05 1.57 1.81 2.09 2.42 1.42 1.65 1.90 2.20 1.37 1.59 1.83 2.12 1.20 1.38 1.60 1.85 2018 1.37 1.60 1.86 2.17 1.60 1.87 2.18 2.54 1.46 1.71 1.99 2.32 1.41 1.64 1.92 2.24 1.20 1.41 1.64 1.91 2019 1.40 1.65 1.94 2.28 1.64 1.94 2.28 2.69 1.50 1.77 2.08 2.45 1.44 1.70 2.01 2.36 1.22 1.44 1.70 1.99 2020 1.43 1.70 2.02 2.41 1.70 2.02 2.40 2.86 1.54 1.84 2.19 2.60 1.48 1.77 2.10 2.50 1.23 1.47 1.75 2.08 2021 1.46 1.76 2.11 2.54 1.74 2.09 2.51 3.01 1.58 1.90 2.29 2.74 1.52 1.83 2.20 2.64 1.26 1.52 1.82 2.18 2022 1.50 1.82 2.21 2.67 1.78 2.16 2.62 3.17 1.62 1.97 2.39 2.90 1.57 1.90 2.31 2.79 1.27 1.55 1.88 2.28 2023 1.53 1.88 2.30 2.81 1.82 2.24 2.74 3.35 1.67 2.05 2.51 3.07 1.61 1.98 2.42 2.96 1.30 1.60 1.96 2.39 2024 1.57 1.94 2.40 2.97 1.86 2.31 2.86 3.53 1.71 2.12 2.62 3.24 1.65 2.05 2.54 3.13 1.32 1.63 2.02 2.49 2025 1.60 2.01 2.51 3.12 1.91 2.39 2.99 3.72 1.75 2.20 2.74 3.42 1.70 2.13 2.66 3.31 1.33 1.67 2.08 2.60 2026 1.64 2.08 2.62 3.29 1.95 2.47 3.11 3.92 1.80 2.28 2.87 3.62 1.75 2.21 2.78 3.50 1.36 1.72 2.17 2.73 2027 1.68 2.15 2.73 3.47 2.00 2.55 3.25 4.13 1.85 2.36 3.01 3.82 1.80 2.29 2.92 3.71 1.39 1.77 2.25 2.86 2028 1.72 2.22 2.85 3.66 2.05 2.64 3.39 4.35 1.90 2.45 3.15 4.04 1.85 2.38 3.06 3.93 1.42 1.82 2.34 3.01 2029 1.76 2.29 2.97 3.85 2.10 2.73 3.54 4.58 1.95 2.54 3.30 4.27 1.90 2.47 3.21 4.15 1.44 1.88 2.44 3.16 2030 1.80 2.37 3.10 4.06 2.15 2.82 3.70 4.83 2.01 2.64 3.45 4.52 1.95 2.57 3.36 4.40 1.47 1.93 2.54 3.32 2031 1.85 2.45 3.24 4.28 2.20 2.92 3.86 5.09 2.06 2.73 3.61 4.77 2.01 2.66 3.53 4.65 1.50 1.99 2.64 3.48 2032 1.89 2.53 3.38 4.51 2.25 3.02 4.03 5.37 2.11 2.83 3.78 5.03 2.06 2.77 3.70 4.93 1.53 2.05 2.74 3.65

50
Table S-2, continued. Projected fuel price indices with assumed general price inflation ratesof 2, 3, 4, and 5 percent, by end-use sector and fuel type.
Census Region 2 (Illinois, Indiana, Iowa, Kansas, Michigan, Minnesota, Missouri,Nebraska, North Dakota, Ohio, South Dakota, Wisconsin)
Projected April 1 Fuel Price Indices (April 1, 2002 = 1.00) ---------------------------------------------------------------INDUSTRIAL----------------------------------------------------------- Electricity Distillate Oil Residual Oil Natural Gas Coal ------------------------ ------------------------ ------------------------ ------------------------ ------------------------ Inflation Rate Inflation Rate Inflation Rate Inflation Rate Inflation Rate Year 2% 3% 4% 5% 2% 3% 4% 5% 2% 3% 4% 5% 2% 3% 4% 5% 2% 3% 4% 5% 2003 1.02 1.03 1.04 1.05 0.98 0.98 0.99 1.00 0.99 1.00 1.01 1.02 0.97 0.98 0.99 1.00 1.00 1.01 1.02 1.02 2004 1.05 1.07 1.09 1.12 0.99 1.01 1.03 1.05 1.02 1.04 1.06 1.08 1.07 1.09 1.11 1.13 1.01 1.03 1.05 1.07 2005 1.07 1.11 1.14 1.17 1.01 1.04 1.07 1.10 1.04 1.07 1.10 1.14 1.12 1.16 1.19 1.22 1.03 1.06 1.09 1.12 2006 1.08 1.12 1.17 1.21 1.03 1.07 1.12 1.16 1.07 1.11 1.16 1.20 1.16 1.20 1.25 1.30 1.04 1.08 1.12 1.17 2007 1.09 1.14 1.20 1.26 1.07 1.12 1.18 1.23 1.10 1.15 1.21 1.27 1.18 1.24 1.30 1.37 1.05 1.10 1.16 1.22 2008 1.12 1.18 1.25 1.33 1.09 1.16 1.22 1.30 1.13 1.19 1.27 1.34 1.22 1.30 1.37 1.45 1.06 1.13 1.19 1.27 2009 1.14 1.22 1.31 1.40 1.14 1.22 1.30 1.40 1.16 1.24 1.32 1.42 1.26 1.35 1.44 1.54 1.08 1.15 1.23 1.32 2010 1.17 1.27 1.37 1.48 1.19 1.29 1.39 1.50 1.19 1.28 1.38 1.50 1.29 1.40 1.51 1.63 1.10 1.19 1.28 1.38 2011 1.21 1.32 1.44 1.57 1.23 1.34 1.46 1.59 1.22 1.33 1.45 1.58 1.34 1.46 1.59 1.74 1.11 1.21 1.32 1.44 2012 1.24 1.37 1.51 1.66 1.27 1.40 1.54 1.69 1.25 1.38 1.52 1.67 1.39 1.53 1.68 1.85 1.12 1.24 1.36 1.50 2013 1.28 1.42 1.58 1.76 1.32 1.47 1.64 1.82 1.28 1.43 1.59 1.76 1.43 1.59 1.77 1.97 1.14 1.27 1.42 1.57 2014 1.31 1.47 1.65 1.85 1.39 1.57 1.76 1.97 1.31 1.48 1.66 1.86 1.47 1.65 1.85 2.08 1.16 1.30 1.46 1.64 2015 1.33 1.51 1.71 1.94 1.47 1.67 1.89 2.14 1.35 1.53 1.73 1.96 1.51 1.72 1.95 2.21 1.17 1.33 1.51 1.70 2016 1.36 1.56 1.79 2.05 1.52 1.74 1.99 2.28 1.38 1.58 1.81 2.07 1.56 1.78 2.04 2.34 1.19 1.37 1.57 1.79 2017 1.41 1.63 1.88 2.17 1.56 1.80 2.08 2.41 1.42 1.64 1.90 2.19 1.60 1.85 2.14 2.47 1.21 1.40 1.61 1.86 2018 1.45 1.70 1.98 2.31 1.59 1.86 2.17 2.53 1.45 1.70 1.98 2.31 1.65 1.93 2.25 2.62 1.22 1.42 1.66 1.94 2019 1.49 1.76 2.07 2.43 1.63 1.93 2.27 2.67 1.49 1.76 2.08 2.44 1.69 2.00 2.36 2.77 1.23 1.45 1.71 2.02 2020 1.53 1.82 2.16 2.57 1.68 2.00 2.39 2.83 1.53 1.82 2.17 2.58 1.75 2.09 2.48 2.95 1.25 1.48 1.77 2.10 2021 1.57 1.89 2.27 2.72 1.72 2.07 2.49 2.99 1.57 1.89 2.27 2.72 1.80 2.17 2.61 3.13 1.27 1.53 1.84 2.20 2022 1.61 1.95 2.37 2.87 1.76 2.14 2.60 3.15 1.61 1.96 2.38 2.88 1.86 2.26 2.75 3.32 1.28 1.56 1.89 2.29 2023 1.65 2.03 2.48 3.04 1.80 2.22 2.71 3.32 1.66 2.03 2.49 3.04 1.92 2.35 2.88 3.52 1.31 1.61 1.97 2.41 2024 1.69 2.10 2.60 3.21 1.85 2.29 2.83 3.50 1.70 2.11 2.61 3.22 1.98 2.45 3.03 3.75 1.32 1.64 2.03 2.50 2025 1.74 2.18 2.72 3.39 1.89 2.37 2.96 3.68 1.75 2.19 2.73 3.40 2.04 2.55 3.19 3.97 1.35 1.69 2.11 2.63 2026 1.79 2.26 2.85 3.58 1.93 2.44 3.08 3.88 1.79 2.26 2.85 3.59 2.10 2.66 3.35 4.22 1.38 1.74 2.19 2.76 2027 1.83 2.34 2.98 3.79 1.98 2.53 3.22 4.09 1.84 2.35 2.99 3.80 2.17 2.76 3.52 4.47 1.40 1.79 2.28 2.90 2028 1.88 2.43 3.12 4.00 2.03 2.61 3.36 4.31 1.89 2.43 3.13 4.01 2.23 2.88 3.70 4.75 1.43 1.85 2.37 3.04 2029 1.93 2.51 3.26 4.23 2.08 2.70 3.51 4.54 1.94 2.53 3.28 4.24 2.31 3.00 3.89 5.04 1.46 1.90 2.47 3.20 2030 1.98 2.61 3.42 4.47 2.12 2.79 3.66 4.78 1.99 2.61 3.43 4.48 2.38 3.12 4.10 5.35 1.49 1.96 2.57 3.36 2031 2.04 2.70 3.58 4.72 2.17 2.89 3.82 5.04 2.05 2.71 3.59 4.74 2.45 3.25 4.30 5.67 1.52 2.02 2.67 3.52 2032 2.09 2.80 3.74 4.99 2.22 2.98 3.98 5.31 2.10 2.81 3.76 5.00 2.52 3.38 4.52 6.02 1.55 2.08 2.78 3.70
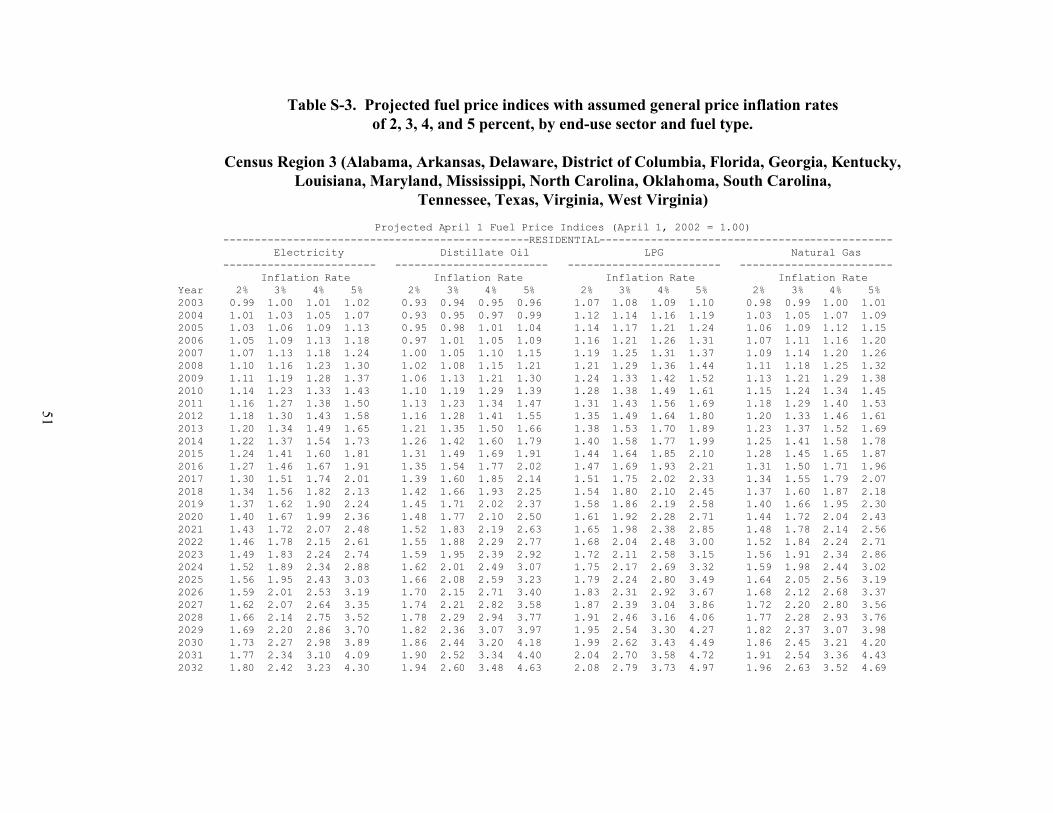
51
Table S-3. Projected fuel price indices with assumed general price inflation ratesof 2, 3, 4, and 5 percent, by end-use sector and fuel type.
Census Region 3 (Alabama, Arkansas, Delaware, District of Columbia, Florida, Georgia, Kentucky,Louisiana, Maryland, Mississippi, North Carolina, Oklahoma, South Carolina,
Tennessee, Texas, Virginia, West Virginia)
Projected April 1 Fuel Price Indices (April 1, 2002 = 1.00) ------------------------------------------------RESIDENTIAL---------------------------------------------- Electricity Distillate Oil LPG Natural Gas ------------------------ ------------------------ ------------------------ ------------------------ Inflation Rate Inflation Rate Inflation Rate Inflation Rate Year 2% 3% 4% 5% 2% 3% 4% 5% 2% 3% 4% 5% 2% 3% 4% 5% 2003 0.99 1.00 1.01 1.02 0.93 0.94 0.95 0.96 1.07 1.08 1.09 1.10 0.98 0.99 1.00 1.01 2004 1.01 1.03 1.05 1.07 0.93 0.95 0.97 0.99 1.12 1.14 1.16 1.19 1.03 1.05 1.07 1.09 2005 1.03 1.06 1.09 1.13 0.95 0.98 1.01 1.04 1.14 1.17 1.21 1.24 1.06 1.09 1.12 1.15 2006 1.05 1.09 1.13 1.18 0.97 1.01 1.05 1.09 1.16 1.21 1.26 1.31 1.07 1.11 1.16 1.20 2007 1.07 1.13 1.18 1.24 1.00 1.05 1.10 1.15 1.19 1.25 1.31 1.37 1.09 1.14 1.20 1.26 2008 1.10 1.16 1.23 1.30 1.02 1.08 1.15 1.21 1.21 1.29 1.36 1.44 1.11 1.18 1.25 1.32 2009 1.11 1.19 1.28 1.37 1.06 1.13 1.21 1.30 1.24 1.33 1.42 1.52 1.13 1.21 1.29 1.38 2010 1.14 1.23 1.33 1.43 1.10 1.19 1.29 1.39 1.28 1.38 1.49 1.61 1.15 1.24 1.34 1.45 2011 1.16 1.27 1.38 1.50 1.13 1.23 1.34 1.47 1.31 1.43 1.56 1.69 1.18 1.29 1.40 1.53 2012 1.18 1.30 1.43 1.58 1.16 1.28 1.41 1.55 1.35 1.49 1.64 1.80 1.20 1.33 1.46 1.61 2013 1.20 1.34 1.49 1.65 1.21 1.35 1.50 1.66 1.38 1.53 1.70 1.89 1.23 1.37 1.52 1.69 2014 1.22 1.37 1.54 1.73 1.26 1.42 1.60 1.79 1.40 1.58 1.77 1.99 1.25 1.41 1.58 1.78 2015 1.24 1.41 1.60 1.81 1.31 1.49 1.69 1.91 1.44 1.64 1.85 2.10 1.28 1.45 1.65 1.87 2016 1.27 1.46 1.67 1.91 1.35 1.54 1.77 2.02 1.47 1.69 1.93 2.21 1.31 1.50 1.71 1.96 2017 1.30 1.51 1.74 2.01 1.39 1.60 1.85 2.14 1.51 1.75 2.02 2.33 1.34 1.55 1.79 2.07 2018 1.34 1.56 1.82 2.13 1.42 1.66 1.93 2.25 1.54 1.80 2.10 2.45 1.37 1.60 1.87 2.18 2019 1.37 1.62 1.90 2.24 1.45 1.71 2.02 2.37 1.58 1.86 2.19 2.58 1.40 1.66 1.95 2.30 2020 1.40 1.67 1.99 2.36 1.48 1.77 2.10 2.50 1.61 1.92 2.28 2.71 1.44 1.72 2.04 2.43 2021 1.43 1.72 2.07 2.48 1.52 1.83 2.19 2.63 1.65 1.98 2.38 2.85 1.48 1.78 2.14 2.56 2022 1.46 1.78 2.15 2.61 1.55 1.88 2.29 2.77 1.68 2.04 2.48 3.00 1.52 1.84 2.24 2.71 2023 1.49 1.83 2.24 2.74 1.59 1.95 2.39 2.92 1.72 2.11 2.58 3.15 1.56 1.91 2.34 2.86 2024 1.52 1.89 2.34 2.88 1.62 2.01 2.49 3.07 1.75 2.17 2.69 3.32 1.59 1.98 2.44 3.02 2025 1.56 1.95 2.43 3.03 1.66 2.08 2.59 3.23 1.79 2.24 2.80 3.49 1.64 2.05 2.56 3.19 2026 1.59 2.01 2.53 3.19 1.70 2.15 2.71 3.40 1.83 2.31 2.92 3.67 1.68 2.12 2.68 3.37 2027 1.62 2.07 2.64 3.35 1.74 2.21 2.82 3.58 1.87 2.39 3.04 3.86 1.72 2.20 2.80 3.56 2028 1.66 2.14 2.75 3.52 1.78 2.29 2.94 3.77 1.91 2.46 3.16 4.06 1.77 2.28 2.93 3.76 2029 1.69 2.20 2.86 3.70 1.82 2.36 3.07 3.97 1.95 2.54 3.30 4.27 1.82 2.37 3.07 3.98 2030 1.73 2.27 2.98 3.89 1.86 2.44 3.20 4.18 1.99 2.62 3.43 4.49 1.86 2.45 3.21 4.20 2031 1.77 2.34 3.10 4.09 1.90 2.52 3.34 4.40 2.04 2.70 3.58 4.72 1.91 2.54 3.36 4.43 2032 1.80 2.42 3.23 4.30 1.94 2.60 3.48 4.63 2.08 2.79 3.73 4.97 1.96 2.63 3.52 4.69
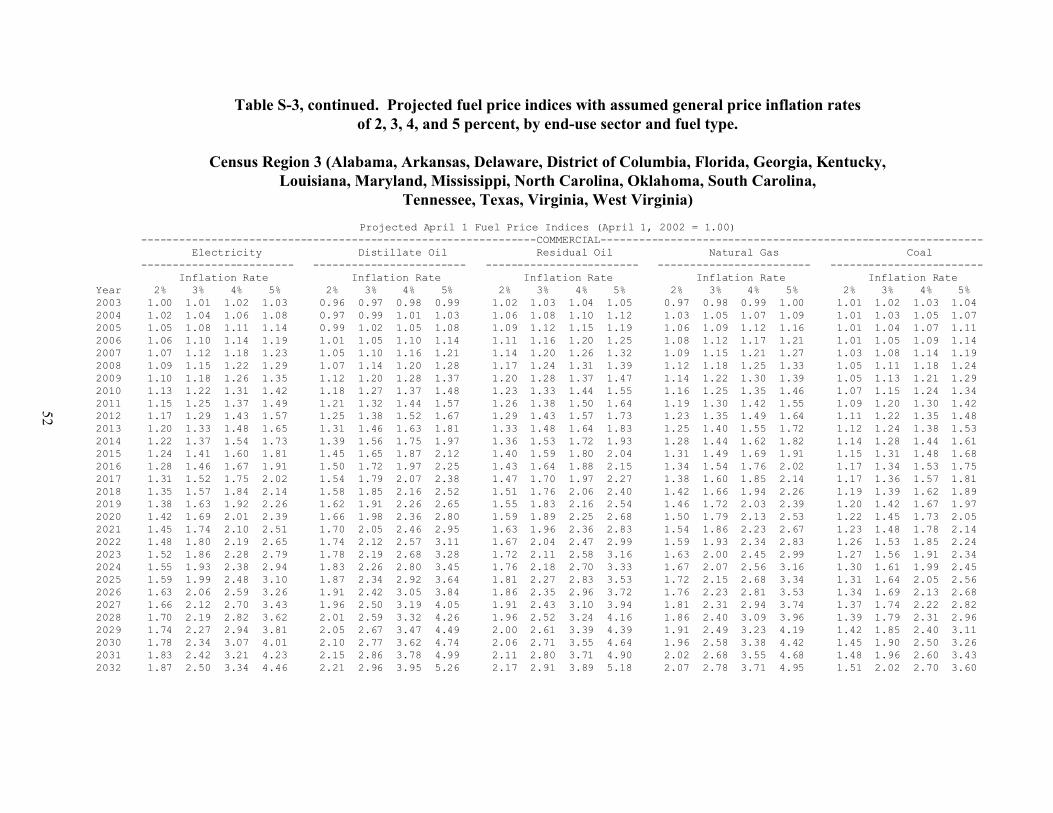
52
Table S-3, continued. Projected fuel price indices with assumed general price inflation ratesof 2, 3, 4, and 5 percent, by end-use sector and fuel type.
Census Region 3 (Alabama, Arkansas, Delaware, District of Columbia, Florida, Georgia, Kentucky,Louisiana, Maryland, Mississippi, North Carolina, Oklahoma, South Carolina,
Tennessee, Texas, Virginia, West Virginia)
Projected April 1 Fuel Price Indices (April 1, 2002 = 1.00) --------------------------------------------------------------COMMERCIAL------------------------------------------------------------ Electricity Distillate Oil Residual Oil Natural Gas Coal ------------------------ ------------------------ ------------------------ ------------------------ ------------------------ Inflation Rate Inflation Rate Inflation Rate Inflation Rate Inflation Rate Year 2% 3% 4% 5% 2% 3% 4% 5% 2% 3% 4% 5% 2% 3% 4% 5% 2% 3% 4% 5% 2003 1.00 1.01 1.02 1.03 0.96 0.97 0.98 0.99 1.02 1.03 1.04 1.05 0.97 0.98 0.99 1.00 1.01 1.02 1.03 1.04 2004 1.02 1.04 1.06 1.08 0.97 0.99 1.01 1.03 1.06 1.08 1.10 1.12 1.03 1.05 1.07 1.09 1.01 1.03 1.05 1.07 2005 1.05 1.08 1.11 1.14 0.99 1.02 1.05 1.08 1.09 1.12 1.15 1.19 1.06 1.09 1.12 1.16 1.01 1.04 1.07 1.11 2006 1.06 1.10 1.14 1.19 1.01 1.05 1.10 1.14 1.11 1.16 1.20 1.25 1.08 1.12 1.17 1.21 1.01 1.05 1.09 1.14 2007 1.07 1.12 1.18 1.23 1.05 1.10 1.16 1.21 1.14 1.20 1.26 1.32 1.09 1.15 1.21 1.27 1.03 1.08 1.14 1.19 2008 1.09 1.15 1.22 1.29 1.07 1.14 1.20 1.28 1.17 1.24 1.31 1.39 1.12 1.18 1.25 1.33 1.05 1.11 1.18 1.24 2009 1.10 1.18 1.26 1.35 1.12 1.20 1.28 1.37 1.20 1.28 1.37 1.47 1.14 1.22 1.30 1.39 1.05 1.13 1.21 1.29 2010 1.13 1.22 1.31 1.42 1.18 1.27 1.37 1.48 1.23 1.33 1.44 1.55 1.16 1.25 1.35 1.46 1.07 1.15 1.24 1.34 2011 1.15 1.25 1.37 1.49 1.21 1.32 1.44 1.57 1.26 1.38 1.50 1.64 1.19 1.30 1.42 1.55 1.09 1.20 1.30 1.42 2012 1.17 1.29 1.43 1.57 1.25 1.38 1.52 1.67 1.29 1.43 1.57 1.73 1.23 1.35 1.49 1.64 1.11 1.22 1.35 1.48 2013 1.20 1.33 1.48 1.65 1.31 1.46 1.63 1.81 1.33 1.48 1.64 1.83 1.25 1.40 1.55 1.72 1.12 1.24 1.38 1.53 2014 1.22 1.37 1.54 1.73 1.39 1.56 1.75 1.97 1.36 1.53 1.72 1.93 1.28 1.44 1.62 1.82 1.14 1.28 1.44 1.61 2015 1.24 1.41 1.60 1.81 1.45 1.65 1.87 2.12 1.40 1.59 1.80 2.04 1.31 1.49 1.69 1.91 1.15 1.31 1.48 1.68 2016 1.28 1.46 1.67 1.91 1.50 1.72 1.97 2.25 1.43 1.64 1.88 2.15 1.34 1.54 1.76 2.02 1.17 1.34 1.53 1.75 2017 1.31 1.52 1.75 2.02 1.54 1.79 2.07 2.38 1.47 1.70 1.97 2.27 1.38 1.60 1.85 2.14 1.17 1.36 1.57 1.81 2018 1.35 1.57 1.84 2.14 1.58 1.85 2.16 2.52 1.51 1.76 2.06 2.40 1.42 1.66 1.94 2.26 1.19 1.39 1.62 1.89 2019 1.38 1.63 1.92 2.26 1.62 1.91 2.26 2.65 1.55 1.83 2.16 2.54 1.46 1.72 2.03 2.39 1.20 1.42 1.67 1.97 2020 1.42 1.69 2.01 2.39 1.66 1.98 2.36 2.80 1.59 1.89 2.25 2.68 1.50 1.79 2.13 2.53 1.22 1.45 1.73 2.05 2021 1.45 1.74 2.10 2.51 1.70 2.05 2.46 2.95 1.63 1.96 2.36 2.83 1.54 1.86 2.23 2.67 1.23 1.48 1.78 2.14 2022 1.48 1.80 2.19 2.65 1.74 2.12 2.57 3.11 1.67 2.04 2.47 2.99 1.59 1.93 2.34 2.83 1.26 1.53 1.85 2.24 2023 1.52 1.86 2.28 2.79 1.78 2.19 2.68 3.28 1.72 2.11 2.58 3.16 1.63 2.00 2.45 2.99 1.27 1.56 1.91 2.34 2024 1.55 1.93 2.38 2.94 1.83 2.26 2.80 3.45 1.76 2.18 2.70 3.33 1.67 2.07 2.56 3.16 1.30 1.61 1.99 2.45 2025 1.59 1.99 2.48 3.10 1.87 2.34 2.92 3.64 1.81 2.27 2.83 3.53 1.72 2.15 2.68 3.34 1.31 1.64 2.05 2.56 2026 1.63 2.06 2.59 3.26 1.91 2.42 3.05 3.84 1.86 2.35 2.96 3.72 1.76 2.23 2.81 3.53 1.34 1.69 2.13 2.68 2027 1.66 2.12 2.70 3.43 1.96 2.50 3.19 4.05 1.91 2.43 3.10 3.94 1.81 2.31 2.94 3.74 1.37 1.74 2.22 2.82 2028 1.70 2.19 2.82 3.62 2.01 2.59 3.32 4.26 1.96 2.52 3.24 4.16 1.86 2.40 3.09 3.96 1.39 1.79 2.31 2.96 2029 1.74 2.27 2.94 3.81 2.05 2.67 3.47 4.49 2.00 2.61 3.39 4.39 1.91 2.49 3.23 4.19 1.42 1.85 2.40 3.11 2030 1.78 2.34 3.07 4.01 2.10 2.77 3.62 4.74 2.06 2.71 3.55 4.64 1.96 2.58 3.38 4.42 1.45 1.90 2.50 3.26 2031 1.83 2.42 3.21 4.23 2.15 2.86 3.78 4.99 2.11 2.80 3.71 4.90 2.02 2.68 3.55 4.68 1.48 1.96 2.60 3.43 2032 1.87 2.50 3.34 4.46 2.21 2.96 3.95 5.26 2.17 2.91 3.89 5.18 2.07 2.78 3.71 4.95 1.51 2.02 2.70 3.60
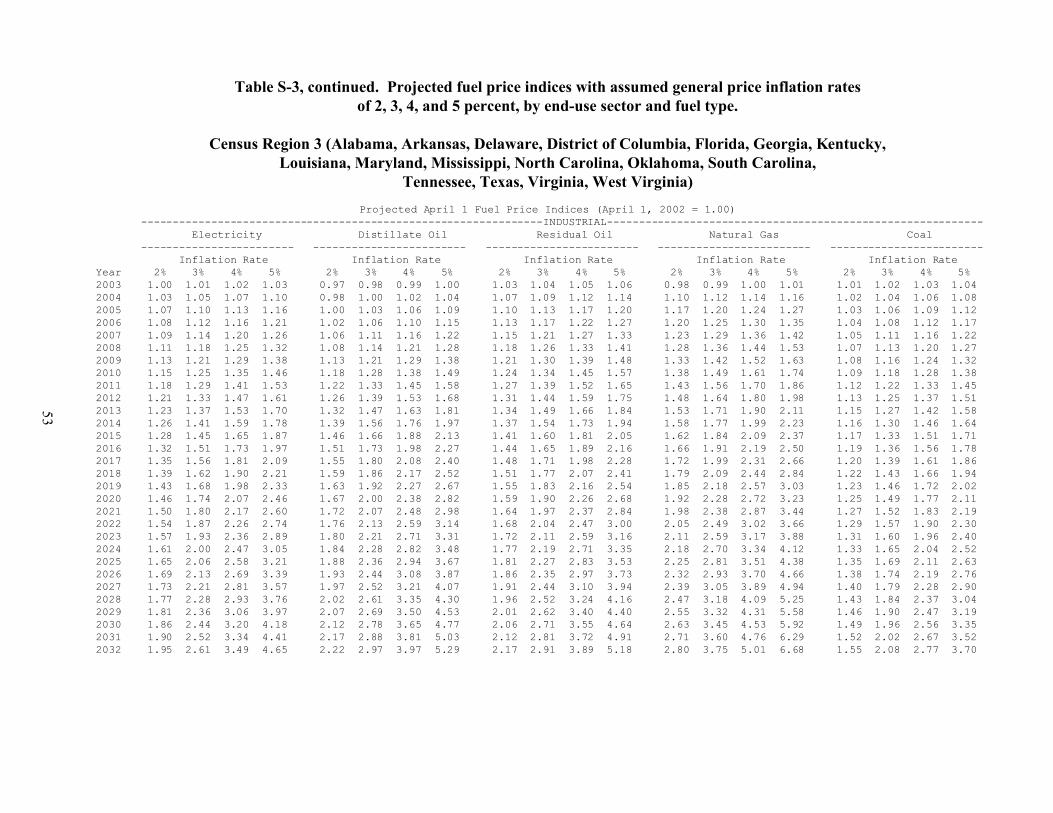
53
Table S-3, continued. Projected fuel price indices with assumed general price inflation ratesof 2, 3, 4, and 5 percent, by end-use sector and fuel type.
Census Region 3 (Alabama, Arkansas, Delaware, District of Columbia, Florida, Georgia, Kentucky,Louisiana, Maryland, Mississippi, North Carolina, Oklahoma, South Carolina,
Tennessee, Texas, Virginia, West Virginia)
Projected April 1 Fuel Price Indices (April 1, 2002 = 1.00) ---------------------------------------------------------------INDUSTRIAL----------------------------------------------------------- Electricity Distillate Oil Residual Oil Natural Gas Coal ------------------------ ------------------------ ------------------------ ------------------------ ------------------------ Inflation Rate Inflation Rate Inflation Rate Inflation Rate Inflation Rate Year 2% 3% 4% 5% 2% 3% 4% 5% 2% 3% 4% 5% 2% 3% 4% 5% 2% 3% 4% 5% 2003 1.00 1.01 1.02 1.03 0.97 0.98 0.99 1.00 1.03 1.04 1.05 1.06 0.98 0.99 1.00 1.01 1.01 1.02 1.03 1.04 2004 1.03 1.05 1.07 1.10 0.98 1.00 1.02 1.04 1.07 1.09 1.12 1.14 1.10 1.12 1.14 1.16 1.02 1.04 1.06 1.08 2005 1.07 1.10 1.13 1.16 1.00 1.03 1.06 1.09 1.10 1.13 1.17 1.20 1.17 1.20 1.24 1.27 1.03 1.06 1.09 1.12 2006 1.08 1.12 1.16 1.21 1.02 1.06 1.10 1.15 1.13 1.17 1.22 1.27 1.20 1.25 1.30 1.35 1.04 1.08 1.12 1.17 2007 1.09 1.14 1.20 1.26 1.06 1.11 1.16 1.22 1.15 1.21 1.27 1.33 1.23 1.29 1.36 1.42 1.05 1.11 1.16 1.22 2008 1.11 1.18 1.25 1.32 1.08 1.14 1.21 1.28 1.18 1.26 1.33 1.41 1.28 1.36 1.44 1.53 1.07 1.13 1.20 1.27 2009 1.13 1.21 1.29 1.38 1.13 1.21 1.29 1.38 1.21 1.30 1.39 1.48 1.33 1.42 1.52 1.63 1.08 1.16 1.24 1.32 2010 1.15 1.25 1.35 1.46 1.18 1.28 1.38 1.49 1.24 1.34 1.45 1.57 1.38 1.49 1.61 1.74 1.09 1.18 1.28 1.38 2011 1.18 1.29 1.41 1.53 1.22 1.33 1.45 1.58 1.27 1.39 1.52 1.65 1.43 1.56 1.70 1.86 1.12 1.22 1.33 1.45 2012 1.21 1.33 1.47 1.61 1.26 1.39 1.53 1.68 1.31 1.44 1.59 1.75 1.48 1.64 1.80 1.98 1.13 1.25 1.37 1.51 2013 1.23 1.37 1.53 1.70 1.32 1.47 1.63 1.81 1.34 1.49 1.66 1.84 1.53 1.71 1.90 2.11 1.15 1.27 1.42 1.58 2014 1.26 1.41 1.59 1.78 1.39 1.56 1.76 1.97 1.37 1.54 1.73 1.94 1.58 1.77 1.99 2.23 1.16 1.30 1.46 1.64 2015 1.28 1.45 1.65 1.87 1.46 1.66 1.88 2.13 1.41 1.60 1.81 2.05 1.62 1.84 2.09 2.37 1.17 1.33 1.51 1.71 2016 1.32 1.51 1.73 1.97 1.51 1.73 1.98 2.27 1.44 1.65 1.89 2.16 1.66 1.91 2.19 2.50 1.19 1.36 1.56 1.78 2017 1.35 1.56 1.81 2.09 1.55 1.80 2.08 2.40 1.48 1.71 1.98 2.28 1.72 1.99 2.31 2.66 1.20 1.39 1.61 1.86 2018 1.39 1.62 1.90 2.21 1.59 1.86 2.17 2.52 1.51 1.77 2.07 2.41 1.79 2.09 2.44 2.84 1.22 1.43 1.66 1.94 2019 1.43 1.68 1.98 2.33 1.63 1.92 2.27 2.67 1.55 1.83 2.16 2.54 1.85 2.18 2.57 3.03 1.23 1.46 1.72 2.02 2020 1.46 1.74 2.07 2.46 1.67 2.00 2.38 2.82 1.59 1.90 2.26 2.68 1.92 2.28 2.72 3.23 1.25 1.49 1.77 2.11 2021 1.50 1.80 2.17 2.60 1.72 2.07 2.48 2.98 1.64 1.97 2.37 2.84 1.98 2.38 2.87 3.44 1.27 1.52 1.83 2.19 2022 1.54 1.87 2.26 2.74 1.76 2.13 2.59 3.14 1.68 2.04 2.47 3.00 2.05 2.49 3.02 3.66 1.29 1.57 1.90 2.30 2023 1.57 1.93 2.36 2.89 1.80 2.21 2.71 3.31 1.72 2.11 2.59 3.16 2.11 2.59 3.17 3.88 1.31 1.60 1.96 2.40 2024 1.61 2.00 2.47 3.05 1.84 2.28 2.82 3.48 1.77 2.19 2.71 3.35 2.18 2.70 3.34 4.12 1.33 1.65 2.04 2.52 2025 1.65 2.06 2.58 3.21 1.88 2.36 2.94 3.67 1.81 2.27 2.83 3.53 2.25 2.81 3.51 4.38 1.35 1.69 2.11 2.63 2026 1.69 2.13 2.69 3.39 1.93 2.44 3.08 3.87 1.86 2.35 2.97 3.73 2.32 2.93 3.70 4.66 1.38 1.74 2.19 2.76 2027 1.73 2.21 2.81 3.57 1.97 2.52 3.21 4.07 1.91 2.44 3.10 3.94 2.39 3.05 3.89 4.94 1.40 1.79 2.28 2.90 2028 1.77 2.28 2.93 3.76 2.02 2.61 3.35 4.30 1.96 2.52 3.24 4.16 2.47 3.18 4.09 5.25 1.43 1.84 2.37 3.04 2029 1.81 2.36 3.06 3.97 2.07 2.69 3.50 4.53 2.01 2.62 3.40 4.40 2.55 3.32 4.31 5.58 1.46 1.90 2.47 3.19 2030 1.86 2.44 3.20 4.18 2.12 2.78 3.65 4.77 2.06 2.71 3.55 4.64 2.63 3.45 4.53 5.92 1.49 1.96 2.56 3.35 2031 1.90 2.52 3.34 4.41 2.17 2.88 3.81 5.03 2.12 2.81 3.72 4.91 2.71 3.60 4.76 6.29 1.52 2.02 2.67 3.52 2032 1.95 2.61 3.49 4.65 2.22 2.97 3.97 5.29 2.17 2.91 3.89 5.18 2.80 3.75 5.01 6.68 1.55 2.08 2.77 3.70
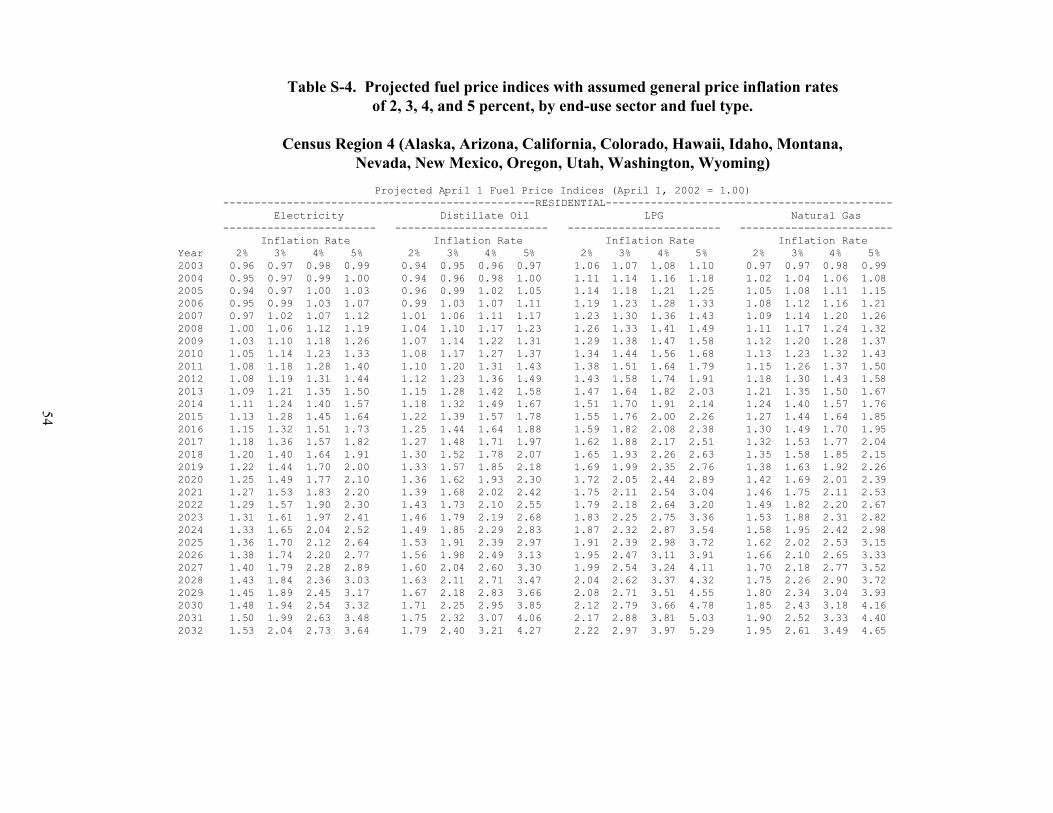
54
Table S-4. Projected fuel price indices with assumed general price inflation ratesof 2, 3, 4, and 5 percent, by end-use sector and fuel type.
Census Region 4 (Alaska, Arizona, California, Colorado, Hawaii, Idaho, Montana,Nevada, New Mexico, Oregon, Utah, Washington, Wyoming)
Projected April 1 Fuel Price Indices (April 1, 2002 = 1.00) -------------------------------------------------RESIDENTIAL--------------------------------------------- Electricity Distillate Oil LPG Natural Gas ------------------------ ------------------------ ------------------------ ------------------------ Inflation Rate Inflation Rate Inflation Rate Inflation Rate Year 2% 3% 4% 5% 2% 3% 4% 5% 2% 3% 4% 5% 2% 3% 4% 5% 2003 0.96 0.97 0.98 0.99 0.94 0.95 0.96 0.97 1.06 1.07 1.08 1.10 0.97 0.97 0.98 0.99 2004 0.95 0.97 0.99 1.00 0.94 0.96 0.98 1.00 1.11 1.14 1.16 1.18 1.02 1.04 1.06 1.08 2005 0.94 0.97 1.00 1.03 0.96 0.99 1.02 1.05 1.14 1.18 1.21 1.25 1.05 1.08 1.11 1.15 2006 0.95 0.99 1.03 1.07 0.99 1.03 1.07 1.11 1.19 1.23 1.28 1.33 1.08 1.12 1.16 1.21 2007 0.97 1.02 1.07 1.12 1.01 1.06 1.11 1.17 1.23 1.30 1.36 1.43 1.09 1.14 1.20 1.26 2008 1.00 1.06 1.12 1.19 1.04 1.10 1.17 1.23 1.26 1.33 1.41 1.49 1.11 1.17 1.24 1.32 2009 1.03 1.10 1.18 1.26 1.07 1.14 1.22 1.31 1.29 1.38 1.47 1.58 1.12 1.20 1.28 1.37 2010 1.05 1.14 1.23 1.33 1.08 1.17 1.27 1.37 1.34 1.44 1.56 1.68 1.13 1.23 1.32 1.43 2011 1.08 1.18 1.28 1.40 1.10 1.20 1.31 1.43 1.38 1.51 1.64 1.79 1.15 1.26 1.37 1.50 2012 1.08 1.19 1.31 1.44 1.12 1.23 1.36 1.49 1.43 1.58 1.74 1.91 1.18 1.30 1.43 1.58 2013 1.09 1.21 1.35 1.50 1.15 1.28 1.42 1.58 1.47 1.64 1.82 2.03 1.21 1.35 1.50 1.67 2014 1.11 1.24 1.40 1.57 1.18 1.32 1.49 1.67 1.51 1.70 1.91 2.14 1.24 1.40 1.57 1.76 2015 1.13 1.28 1.45 1.64 1.22 1.39 1.57 1.78 1.55 1.76 2.00 2.26 1.27 1.44 1.64 1.85 2016 1.15 1.32 1.51 1.73 1.25 1.44 1.64 1.88 1.59 1.82 2.08 2.38 1.30 1.49 1.70 1.95 2017 1.18 1.36 1.57 1.82 1.27 1.48 1.71 1.97 1.62 1.88 2.17 2.51 1.32 1.53 1.77 2.04 2018 1.20 1.40 1.64 1.91 1.30 1.52 1.78 2.07 1.65 1.93 2.26 2.63 1.35 1.58 1.85 2.15 2019 1.22 1.44 1.70 2.00 1.33 1.57 1.85 2.18 1.69 1.99 2.35 2.76 1.38 1.63 1.92 2.26 2020 1.25 1.49 1.77 2.10 1.36 1.62 1.93 2.30 1.72 2.05 2.44 2.89 1.42 1.69 2.01 2.39 2021 1.27 1.53 1.83 2.20 1.39 1.68 2.02 2.42 1.75 2.11 2.54 3.04 1.46 1.75 2.11 2.53 2022 1.29 1.57 1.90 2.30 1.43 1.73 2.10 2.55 1.79 2.18 2.64 3.20 1.49 1.82 2.20 2.67 2023 1.31 1.61 1.97 2.41 1.46 1.79 2.19 2.68 1.83 2.25 2.75 3.36 1.53 1.88 2.31 2.82 2024 1.33 1.65 2.04 2.52 1.49 1.85 2.29 2.83 1.87 2.32 2.87 3.54 1.58 1.95 2.42 2.98 2025 1.36 1.70 2.12 2.64 1.53 1.91 2.39 2.97 1.91 2.39 2.98 3.72 1.62 2.02 2.53 3.15 2026 1.38 1.74 2.20 2.77 1.56 1.98 2.49 3.13 1.95 2.47 3.11 3.91 1.66 2.10 2.65 3.33 2027 1.40 1.79 2.28 2.89 1.60 2.04 2.60 3.30 1.99 2.54 3.24 4.11 1.70 2.18 2.77 3.52 2028 1.43 1.84 2.36 3.03 1.63 2.11 2.71 3.47 2.04 2.62 3.37 4.32 1.75 2.26 2.90 3.72 2029 1.45 1.89 2.45 3.17 1.67 2.18 2.83 3.66 2.08 2.71 3.51 4.55 1.80 2.34 3.04 3.93 2030 1.48 1.94 2.54 3.32 1.71 2.25 2.95 3.85 2.12 2.79 3.66 4.78 1.85 2.43 3.18 4.16 2031 1.50 1.99 2.63 3.48 1.75 2.32 3.07 4.06 2.17 2.88 3.81 5.03 1.90 2.52 3.33 4.40 2032 1.53 2.04 2.73 3.64 1.79 2.40 3.21 4.27 2.22 2.97 3.97 5.29 1.95 2.61 3.49 4.65

55
Table S-4, continued. Projected fuel price indices with assumed general price inflation ratesof 2, 3, 4, and 5 percent, by end-use sector and fuel type.
Census Region 4 (Alaska, Arizona, California, Colorado, Hawaii, Idaho, Montana,Nevada, New Mexico, Oregon, Utah, Washington, Wyoming)
Projected April 1 Fuel Price Indices (April 1, 2002 = 1.00) --------------------------------------------------------------COMMERCIAL------------------------------------------------------------
Electricity Distillate Oil Residual Oil Natural Gas Coal ------------------------ ------------------------ ------------------------ ------------------------ ------------------------ Inflation Rate Inflation Rate Inflation Rate Inflation Rate Inflation Rate Year 2% 3% 4% 5% 2% 3% 4% 5% 2% 3% 4% 5% 2% 3% 4% 5% 2% 3% 4% 5% 2003 0.94 0.95 0.96 0.97 0.97 0.98 0.99 1.00 1.00 1.01 1.02 1.03 0.96 0.97 0.98 0.99 1.00 1.01 1.02 1.03 2004 0.92 0.94 0.96 0.98 0.99 1.01 1.03 1.05 1.03 1.05 1.07 1.09 1.02 1.04 1.06 1.08 1.02 1.04 1.06 1.08 2005 0.90 0.93 0.95 0.98 1.01 1.04 1.07 1.11 1.06 1.09 1.12 1.15 1.05 1.08 1.12 1.15 1.02 1.05 1.08 1.12 2006 0.90 0.93 0.97 1.01 1.04 1.08 1.12 1.17 1.09 1.13 1.17 1.22 1.08 1.12 1.16 1.21 1.04 1.08 1.12 1.16 2007 0.91 0.96 1.00 1.05 1.07 1.12 1.17 1.23 1.11 1.17 1.23 1.29 1.09 1.15 1.20 1.26 1.05 1.10 1.16 1.22 2008 0.93 0.99 1.05 1.11 1.09 1.16 1.23 1.30 1.14 1.21 1.28 1.36 1.11 1.18 1.25 1.32 1.06 1.12 1.19 1.26 2009 0.95 1.02 1.09 1.17 1.13 1.21 1.30 1.39 1.17 1.25 1.34 1.43 1.13 1.21 1.29 1.38 1.08 1.16 1.24 1.32 2010 0.97 1.05 1.13 1.22 1.15 1.25 1.35 1.45 1.20 1.30 1.40 1.51 1.14 1.23 1.33 1.43 1.09 1.18 1.28 1.38 2011 0.99 1.08 1.18 1.29 1.17 1.28 1.39 1.52 1.23 1.34 1.46 1.60 1.16 1.26 1.38 1.50 1.12 1.22 1.33 1.45 2012 0.98 1.08 1.19 1.31 1.19 1.31 1.45 1.59 1.26 1.39 1.53 1.68 1.19 1.31 1.44 1.59 1.13 1.25 1.37 1.51 2013 0.99 1.11 1.23 1.37 1.23 1.37 1.52 1.69 1.29 1.44 1.60 1.78 1.23 1.37 1.52 1.69 1.15 1.29 1.43 1.59 2014 1.01 1.13 1.27 1.43 1.27 1.43 1.61 1.80 1.33 1.49 1.67 1.88 1.26 1.41 1.58 1.78 1.17 1.32 1.48 1.66 2015 1.03 1.17 1.32 1.50 1.33 1.51 1.71 1.94 1.36 1.54 1.75 1.98 1.29 1.46 1.66 1.88 1.19 1.35 1.53 1.73 2016 1.05 1.20 1.38 1.58 1.37 1.57 1.80 2.05 1.39 1.60 1.83 2.09 1.32 1.51 1.73 1.98 1.20 1.38 1.58 1.80 2017 1.07 1.24 1.44 1.66 1.40 1.62 1.87 2.16 1.43 1.66 1.91 2.21 1.34 1.56 1.80 2.08 1.22 1.41 1.63 1.88 2018 1.09 1.28 1.49 1.74 1.43 1.67 1.95 2.27 1.47 1.71 2.00 2.33 1.37 1.60 1.87 2.18 1.23 1.44 1.68 1.96 2019 1.11 1.32 1.55 1.82 1.47 1.73 2.04 2.40 1.50 1.78 2.09 2.46 1.41 1.66 1.96 2.30 1.25 1.48 1.74 2.05 2020 1.13 1.35 1.61 1.91 1.50 1.79 2.13 2.54 1.54 1.84 2.19 2.60 1.45 1.73 2.05 2.44 1.27 1.51 1.80 2.13 2021 1.15 1.39 1.67 2.00 1.54 1.85 2.23 2.67 1.58 1.90 2.29 2.74 1.49 1.79 2.15 2.58 1.28 1.54 1.86 2.23 2022 1.17 1.42 1.73 2.09 1.58 1.92 2.33 2.82 1.62 1.97 2.39 2.90 1.53 1.86 2.26 2.73 1.31 1.59 1.93 2.34 2023 1.19 1.46 1.79 2.19 1.61 1.98 2.43 2.97 1.67 2.05 2.51 3.06 1.57 1.93 2.36 2.89 1.33 1.63 1.99 2.44 2024 1.21 1.50 1.85 2.29 1.66 2.05 2.54 3.13 1.71 2.12 2.62 3.23 1.61 2.00 2.48 3.06 1.35 1.68 2.07 2.56 2025 1.23 1.54 1.92 2.39 1.69 2.12 2.65 3.30 1.75 2.19 2.74 3.41 1.66 2.08 2.59 3.23 1.37 1.72 2.14 2.67 2026 1.25 1.58 1.99 2.50 1.73 2.19 2.76 3.47 1.80 2.28 2.87 3.61 1.70 2.15 2.72 3.42 1.40 1.77 2.23 2.80 2027 1.27 1.62 2.06 2.61 1.78 2.27 2.89 3.67 1.85 2.36 3.00 3.81 1.75 2.23 2.84 3.61 1.43 1.82 2.32 2.94 2028 1.29 1.66 2.13 2.73 1.82 2.34 3.01 3.86 1.90 2.45 3.14 4.03 1.80 2.32 2.98 3.82 1.45 1.87 2.41 3.09 2029 1.31 1.70 2.21 2.86 1.86 2.42 3.15 4.07 1.95 2.53 3.29 4.26 1.85 2.41 3.13 4.05 1.48 1.93 2.51 3.24 2030 1.33 1.74 2.29 2.99 1.91 2.50 3.28 4.29 2.00 2.63 3.44 4.50 1.90 2.50 3.28 4.28 1.51 1.99 2.61 3.41 2031 1.35 1.79 2.37 3.13 1.95 2.59 3.43 4.53 2.05 2.72 3.60 4.75 1.96 2.60 3.43 4.53 1.54 2.05 2.71 3.58 2032 1.37 1.84 2.45 3.27 2.00 2.68 3.58 4.77 2.10 2.82 3.76 5.01 2.01 2.69 3.59 4.79 1.57 2.11 2.82 3.76
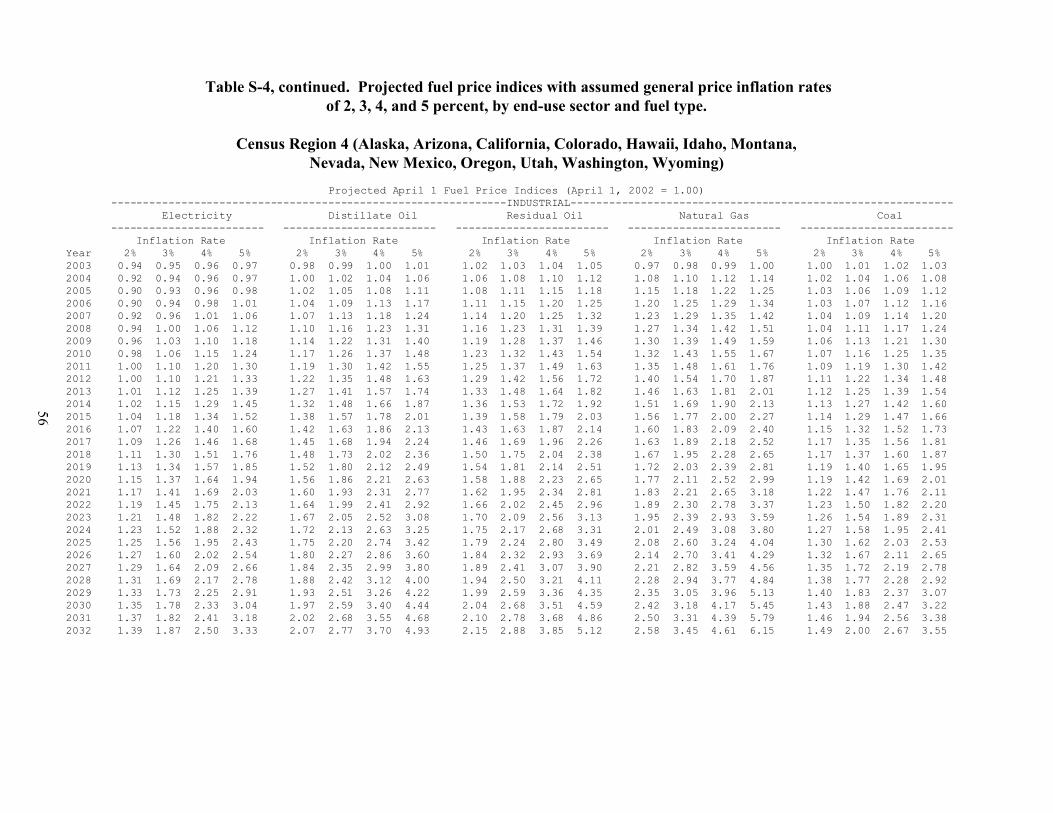
56
Table S-4, continued. Projected fuel price indices with assumed general price inflation ratesof 2, 3, 4, and 5 percent, by end-use sector and fuel type.
Census Region 4 (Alaska, Arizona, California, Colorado, Hawaii, Idaho, Montana,Nevada, New Mexico, Oregon, Utah, Washington, Wyoming)
Projected April 1 Fuel Price Indices (April 1, 2002 = 1.00) --------------------------------------------------------------INDUSTRIAL------------------------------------------------------------ Electricity Distillate Oil Residual Oil Natural Gas Coal ------------------------ ------------------------ ------------------------ ------------------------ ------------------------ Inflation Rate Inflation Rate Inflation Rate Inflation Rate Inflation Rate Year 2% 3% 4% 5% 2% 3% 4% 5% 2% 3% 4% 5% 2% 3% 4% 5% 2% 3% 4% 5% 2003 0.94 0.95 0.96 0.97 0.98 0.99 1.00 1.01 1.02 1.03 1.04 1.05 0.97 0.98 0.99 1.00 1.00 1.01 1.02 1.03 2004 0.92 0.94 0.96 0.97 1.00 1.02 1.04 1.06 1.06 1.08 1.10 1.12 1.08 1.10 1.12 1.14 1.02 1.04 1.06 1.08 2005 0.90 0.93 0.96 0.98 1.02 1.05 1.08 1.11 1.08 1.11 1.15 1.18 1.15 1.18 1.22 1.25 1.03 1.06 1.09 1.12 2006 0.90 0.94 0.98 1.01 1.04 1.09 1.13 1.17 1.11 1.15 1.20 1.25 1.20 1.25 1.29 1.34 1.03 1.07 1.12 1.16 2007 0.92 0.96 1.01 1.06 1.07 1.13 1.18 1.24 1.14 1.20 1.25 1.32 1.23 1.29 1.35 1.42 1.04 1.09 1.14 1.20 2008 0.94 1.00 1.06 1.12 1.10 1.16 1.23 1.31 1.16 1.23 1.31 1.39 1.27 1.34 1.42 1.51 1.04 1.11 1.17 1.24 2009 0.96 1.03 1.10 1.18 1.14 1.22 1.31 1.40 1.19 1.28 1.37 1.46 1.30 1.39 1.49 1.59 1.06 1.13 1.21 1.30 2010 0.98 1.06 1.15 1.24 1.17 1.26 1.37 1.48 1.23 1.32 1.43 1.54 1.32 1.43 1.55 1.67 1.07 1.16 1.25 1.35 2011 1.00 1.10 1.20 1.30 1.19 1.30 1.42 1.55 1.25 1.37 1.49 1.63 1.35 1.48 1.61 1.76 1.09 1.19 1.30 1.42 2012 1.00 1.10 1.21 1.33 1.22 1.35 1.48 1.63 1.29 1.42 1.56 1.72 1.40 1.54 1.70 1.87 1.11 1.22 1.34 1.48 2013 1.01 1.12 1.25 1.39 1.27 1.41 1.57 1.74 1.33 1.48 1.64 1.82 1.46 1.63 1.81 2.01 1.12 1.25 1.39 1.54 2014 1.02 1.15 1.29 1.45 1.32 1.48 1.66 1.87 1.36 1.53 1.72 1.92 1.51 1.69 1.90 2.13 1.13 1.27 1.42 1.60 2015 1.04 1.18 1.34 1.52 1.38 1.57 1.78 2.01 1.39 1.58 1.79 2.03 1.56 1.77 2.00 2.27 1.14 1.29 1.47 1.66 2016 1.07 1.22 1.40 1.60 1.42 1.63 1.86 2.13 1.43 1.63 1.87 2.14 1.60 1.83 2.09 2.40 1.15 1.32 1.52 1.73 2017 1.09 1.26 1.46 1.68 1.45 1.68 1.94 2.24 1.46 1.69 1.96 2.26 1.63 1.89 2.18 2.52 1.17 1.35 1.56 1.81 2018 1.11 1.30 1.51 1.76 1.48 1.73 2.02 2.36 1.50 1.75 2.04 2.38 1.67 1.95 2.28 2.65 1.17 1.37 1.60 1.87 2019 1.13 1.34 1.57 1.85 1.52 1.80 2.12 2.49 1.54 1.81 2.14 2.51 1.72 2.03 2.39 2.81 1.19 1.40 1.65 1.95 2020 1.15 1.37 1.64 1.94 1.56 1.86 2.21 2.63 1.58 1.88 2.23 2.65 1.77 2.11 2.52 2.99 1.19 1.42 1.69 2.01 2021 1.17 1.41 1.69 2.03 1.60 1.93 2.31 2.77 1.62 1.95 2.34 2.81 1.83 2.21 2.65 3.18 1.22 1.47 1.76 2.11 2022 1.19 1.45 1.75 2.13 1.64 1.99 2.41 2.92 1.66 2.02 2.45 2.96 1.89 2.30 2.78 3.37 1.23 1.50 1.82 2.20 2023 1.21 1.48 1.82 2.22 1.67 2.05 2.52 3.08 1.70 2.09 2.56 3.13 1.95 2.39 2.93 3.59 1.26 1.54 1.89 2.31 2024 1.23 1.52 1.88 2.32 1.72 2.13 2.63 3.25 1.75 2.17 2.68 3.31 2.01 2.49 3.08 3.80 1.27 1.58 1.95 2.41 2025 1.25 1.56 1.95 2.43 1.75 2.20 2.74 3.42 1.79 2.24 2.80 3.49 2.08 2.60 3.24 4.04 1.30 1.62 2.03 2.53 2026 1.27 1.60 2.02 2.54 1.80 2.27 2.86 3.60 1.84 2.32 2.93 3.69 2.14 2.70 3.41 4.29 1.32 1.67 2.11 2.65 2027 1.29 1.64 2.09 2.66 1.84 2.35 2.99 3.80 1.89 2.41 3.07 3.90 2.21 2.82 3.59 4.56 1.35 1.72 2.19 2.78 2028 1.31 1.69 2.17 2.78 1.88 2.42 3.12 4.00 1.94 2.50 3.21 4.11 2.28 2.94 3.77 4.84 1.38 1.77 2.28 2.92 2029 1.33 1.73 2.25 2.91 1.93 2.51 3.26 4.22 1.99 2.59 3.36 4.35 2.35 3.05 3.96 5.13 1.40 1.83 2.37 3.07 2030 1.35 1.78 2.33 3.04 1.97 2.59 3.40 4.44 2.04 2.68 3.51 4.59 2.42 3.18 4.17 5.45 1.43 1.88 2.47 3.22 2031 1.37 1.82 2.41 3.18 2.02 2.68 3.55 4.68 2.10 2.78 3.68 4.86 2.50 3.31 4.39 5.79 1.46 1.94 2.56 3.38 2032 1.39 1.87 2.50 3.33 2.07 2.77 3.70 4.93 2.15 2.88 3.85 5.12 2.58 3.45 4.61 6.15 1.49 2.00 2.67 3.55
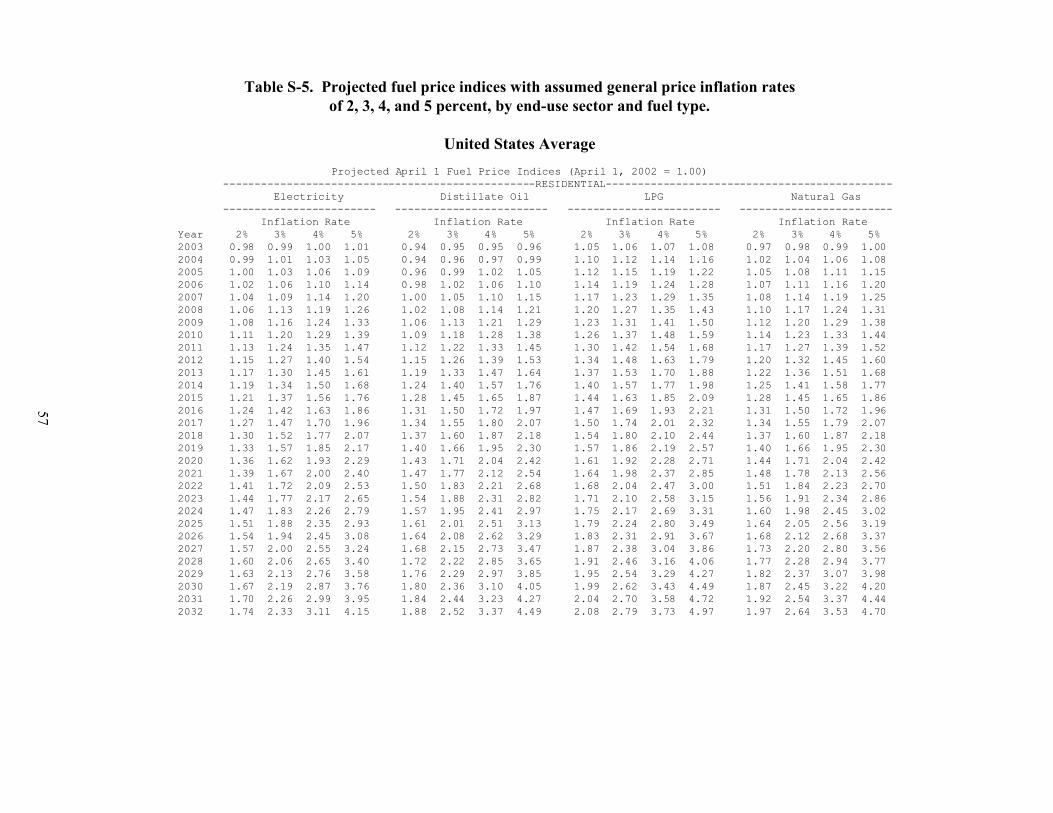
57
Table S-5. Projected fuel price indices with assumed general price inflation ratesof 2, 3, 4, and 5 percent, by end-use sector and fuel type.
United States Average
Projected April 1 Fuel Price Indices (April 1, 2002 = 1.00) -------------------------------------------------RESIDENTIAL--------------------------------------------- Electricity Distillate Oil LPG Natural Gas ------------------------ ------------------------ ------------------------ ------------------------ Inflation Rate Inflation Rate Inflation Rate Inflation Rate Year 2% 3% 4% 5% 2% 3% 4% 5% 2% 3% 4% 5% 2% 3% 4% 5% 2003 0.98 0.99 1.00 1.01 0.94 0.95 0.95 0.96 1.05 1.06 1.07 1.08 0.97 0.98 0.99 1.00 2004 0.99 1.01 1.03 1.05 0.94 0.96 0.97 0.99 1.10 1.12 1.14 1.16 1.02 1.04 1.06 1.08 2005 1.00 1.03 1.06 1.09 0.96 0.99 1.02 1.05 1.12 1.15 1.19 1.22 1.05 1.08 1.11 1.15 2006 1.02 1.06 1.10 1.14 0.98 1.02 1.06 1.10 1.14 1.19 1.24 1.28 1.07 1.11 1.16 1.20 2007 1.04 1.09 1.14 1.20 1.00 1.05 1.10 1.15 1.17 1.23 1.29 1.35 1.08 1.14 1.19 1.25 2008 1.06 1.13 1.19 1.26 1.02 1.08 1.14 1.21 1.20 1.27 1.35 1.43 1.10 1.17 1.24 1.31 2009 1.08 1.16 1.24 1.33 1.06 1.13 1.21 1.29 1.23 1.31 1.41 1.50 1.12 1.20 1.29 1.38 2010 1.11 1.20 1.29 1.39 1.09 1.18 1.28 1.38 1.26 1.37 1.48 1.59 1.14 1.23 1.33 1.44 2011 1.13 1.24 1.35 1.47 1.12 1.22 1.33 1.45 1.30 1.42 1.54 1.68 1.17 1.27 1.39 1.52 2012 1.15 1.27 1.40 1.54 1.15 1.26 1.39 1.53 1.34 1.48 1.63 1.79 1.20 1.32 1.45 1.60 2013 1.17 1.30 1.45 1.61 1.19 1.33 1.47 1.64 1.37 1.53 1.70 1.88 1.22 1.36 1.51 1.68 2014 1.19 1.34 1.50 1.68 1.24 1.40 1.57 1.76 1.40 1.57 1.77 1.98 1.25 1.41 1.58 1.77 2015 1.21 1.37 1.56 1.76 1.28 1.45 1.65 1.87 1.44 1.63 1.85 2.09 1.28 1.45 1.65 1.86 2016 1.24 1.42 1.63 1.86 1.31 1.50 1.72 1.97 1.47 1.69 1.93 2.21 1.31 1.50 1.72 1.96 2017 1.27 1.47 1.70 1.96 1.34 1.55 1.80 2.07 1.50 1.74 2.01 2.32 1.34 1.55 1.79 2.07 2018 1.30 1.52 1.77 2.07 1.37 1.60 1.87 2.18 1.54 1.80 2.10 2.44 1.37 1.60 1.87 2.18 2019 1.33 1.57 1.85 2.17 1.40 1.66 1.95 2.30 1.57 1.86 2.19 2.57 1.40 1.66 1.95 2.30 2020 1.36 1.62 1.93 2.29 1.43 1.71 2.04 2.42 1.61 1.92 2.28 2.71 1.44 1.71 2.04 2.42 2021 1.39 1.67 2.00 2.40 1.47 1.77 2.12 2.54 1.64 1.98 2.37 2.85 1.48 1.78 2.13 2.56 2022 1.41 1.72 2.09 2.53 1.50 1.83 2.21 2.68 1.68 2.04 2.47 3.00 1.51 1.84 2.23 2.70 2023 1.44 1.77 2.17 2.65 1.54 1.88 2.31 2.82 1.71 2.10 2.58 3.15 1.56 1.91 2.34 2.86 2024 1.47 1.83 2.26 2.79 1.57 1.95 2.41 2.97 1.75 2.17 2.69 3.31 1.60 1.98 2.45 3.02 2025 1.51 1.88 2.35 2.93 1.61 2.01 2.51 3.13 1.79 2.24 2.80 3.49 1.64 2.05 2.56 3.19 2026 1.54 1.94 2.45 3.08 1.64 2.08 2.62 3.29 1.83 2.31 2.91 3.67 1.68 2.12 2.68 3.37 2027 1.57 2.00 2.55 3.24 1.68 2.15 2.73 3.47 1.87 2.38 3.04 3.86 1.73 2.20 2.80 3.56 2028 1.60 2.06 2.65 3.40 1.72 2.22 2.85 3.65 1.91 2.46 3.16 4.06 1.77 2.28 2.94 3.77 2029 1.63 2.13 2.76 3.58 1.76 2.29 2.97 3.85 1.95 2.54 3.29 4.27 1.82 2.37 3.07 3.98 2030 1.67 2.19 2.87 3.76 1.80 2.36 3.10 4.05 1.99 2.62 3.43 4.49 1.87 2.45 3.22 4.20 2031 1.70 2.26 2.99 3.95 1.84 2.44 3.23 4.27 2.04 2.70 3.58 4.72 1.92 2.54 3.37 4.44 2032 1.74 2.33 3.11 4.15 1.88 2.52 3.37 4.49 2.08 2.79 3.73 4.97 1.97 2.64 3.53 4.70
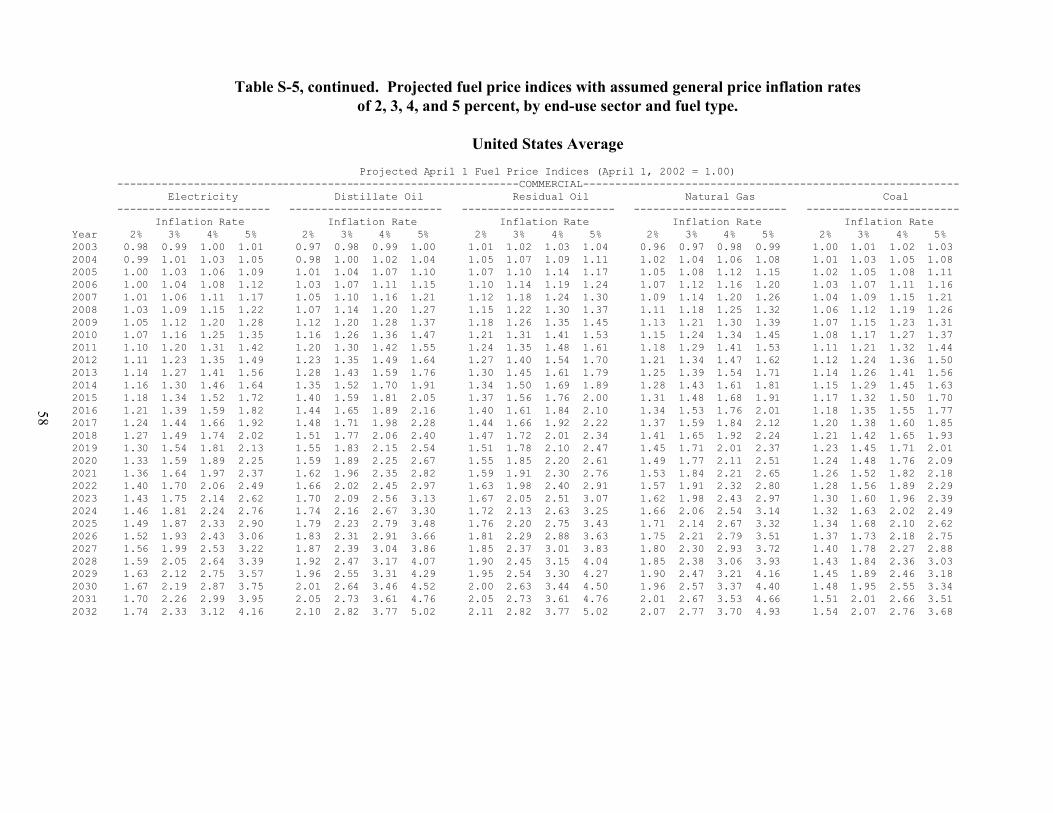
58
Table S-5, continued. Projected fuel price indices with assumed general price inflation ratesof 2, 3, 4, and 5 percent, by end-use sector and fuel type.
United States Average
Projected April 1 Fuel Price Indices (April 1, 2002 = 1.00) ---------------------------------------------------------------COMMERCIAL----------------------------------------------------------- Electricity Distillate Oil Residual Oil Natural Gas Coal ------------------------ ------------------------ ------------------------ ------------------------ ------------------------ Inflation Rate Inflation Rate Inflation Rate Inflation Rate Inflation Rate Year 2% 3% 4% 5% 2% 3% 4% 5% 2% 3% 4% 5% 2% 3% 4% 5% 2% 3% 4% 5% 2003 0.98 0.99 1.00 1.01 0.97 0.98 0.99 1.00 1.01 1.02 1.03 1.04 0.96 0.97 0.98 0.99 1.00 1.01 1.02 1.03 2004 0.99 1.01 1.03 1.05 0.98 1.00 1.02 1.04 1.05 1.07 1.09 1.11 1.02 1.04 1.06 1.08 1.01 1.03 1.05 1.08 2005 1.00 1.03 1.06 1.09 1.01 1.04 1.07 1.10 1.07 1.10 1.14 1.17 1.05 1.08 1.12 1.15 1.02 1.05 1.08 1.11 2006 1.00 1.04 1.08 1.12 1.03 1.07 1.11 1.15 1.10 1.14 1.19 1.24 1.07 1.12 1.16 1.20 1.03 1.07 1.11 1.16 2007 1.01 1.06 1.11 1.17 1.05 1.10 1.16 1.21 1.12 1.18 1.24 1.30 1.09 1.14 1.20 1.26 1.04 1.09 1.15 1.21 2008 1.03 1.09 1.15 1.22 1.07 1.14 1.20 1.27 1.15 1.22 1.30 1.37 1.11 1.18 1.25 1.32 1.06 1.12 1.19 1.26 2009 1.05 1.12 1.20 1.28 1.12 1.20 1.28 1.37 1.18 1.26 1.35 1.45 1.13 1.21 1.30 1.39 1.07 1.15 1.23 1.31 2010 1.07 1.16 1.25 1.35 1.16 1.26 1.36 1.47 1.21 1.31 1.41 1.53 1.15 1.24 1.34 1.45 1.08 1.17 1.27 1.37 2011 1.10 1.20 1.31 1.42 1.20 1.30 1.42 1.55 1.24 1.35 1.48 1.61 1.18 1.29 1.41 1.53 1.11 1.21 1.32 1.44 2012 1.11 1.23 1.35 1.49 1.23 1.35 1.49 1.64 1.27 1.40 1.54 1.70 1.21 1.34 1.47 1.62 1.12 1.24 1.36 1.50 2013 1.14 1.27 1.41 1.56 1.28 1.43 1.59 1.76 1.30 1.45 1.61 1.79 1.25 1.39 1.54 1.71 1.14 1.26 1.41 1.56 2014 1.16 1.30 1.46 1.64 1.35 1.52 1.70 1.91 1.34 1.50 1.69 1.89 1.28 1.43 1.61 1.81 1.15 1.29 1.45 1.63 2015 1.18 1.34 1.52 1.72 1.40 1.59 1.81 2.05 1.37 1.56 1.76 2.00 1.31 1.48 1.68 1.91 1.17 1.32 1.50 1.70 2016 1.21 1.39 1.59 1.82 1.44 1.65 1.89 2.16 1.40 1.61 1.84 2.10 1.34 1.53 1.76 2.01 1.18 1.35 1.55 1.77 2017 1.24 1.44 1.66 1.92 1.48 1.71 1.98 2.28 1.44 1.66 1.92 2.22 1.37 1.59 1.84 2.12 1.20 1.38 1.60 1.85 2018 1.27 1.49 1.74 2.02 1.51 1.77 2.06 2.40 1.47 1.72 2.01 2.34 1.41 1.65 1.92 2.24 1.21 1.42 1.65 1.93 2019 1.30 1.54 1.81 2.13 1.55 1.83 2.15 2.54 1.51 1.78 2.10 2.47 1.45 1.71 2.01 2.37 1.23 1.45 1.71 2.01 2020 1.33 1.59 1.89 2.25 1.59 1.89 2.25 2.67 1.55 1.85 2.20 2.61 1.49 1.77 2.11 2.51 1.24 1.48 1.76 2.09 2021 1.36 1.64 1.97 2.37 1.62 1.96 2.35 2.82 1.59 1.91 2.30 2.76 1.53 1.84 2.21 2.65 1.26 1.52 1.82 2.18 2022 1.40 1.70 2.06 2.49 1.66 2.02 2.45 2.97 1.63 1.98 2.40 2.91 1.57 1.91 2.32 2.80 1.28 1.56 1.89 2.29 2023 1.43 1.75 2.14 2.62 1.70 2.09 2.56 3.13 1.67 2.05 2.51 3.07 1.62 1.98 2.43 2.97 1.30 1.60 1.96 2.39 2024 1.46 1.81 2.24 2.76 1.74 2.16 2.67 3.30 1.72 2.13 2.63 3.25 1.66 2.06 2.54 3.14 1.32 1.63 2.02 2.49 2025 1.49 1.87 2.33 2.90 1.79 2.23 2.79 3.48 1.76 2.20 2.75 3.43 1.71 2.14 2.67 3.32 1.34 1.68 2.10 2.62 2026 1.52 1.93 2.43 3.06 1.83 2.31 2.91 3.66 1.81 2.29 2.88 3.63 1.75 2.21 2.79 3.51 1.37 1.73 2.18 2.75 2027 1.56 1.99 2.53 3.22 1.87 2.39 3.04 3.86 1.85 2.37 3.01 3.83 1.80 2.30 2.93 3.72 1.40 1.78 2.27 2.88 2028 1.59 2.05 2.64 3.39 1.92 2.47 3.17 4.07 1.90 2.45 3.15 4.04 1.85 2.38 3.06 3.93 1.43 1.84 2.36 3.03 2029 1.63 2.12 2.75 3.57 1.96 2.55 3.31 4.29 1.95 2.54 3.30 4.27 1.90 2.47 3.21 4.16 1.45 1.89 2.46 3.18 2030 1.67 2.19 2.87 3.75 2.01 2.64 3.46 4.52 2.00 2.63 3.44 4.50 1.96 2.57 3.37 4.40 1.48 1.95 2.55 3.34 2031 1.70 2.26 2.99 3.95 2.05 2.73 3.61 4.76 2.05 2.73 3.61 4.76 2.01 2.67 3.53 4.66 1.51 2.01 2.66 3.51 2032 1.74 2.33 3.12 4.16 2.10 2.82 3.77 5.02 2.11 2.82 3.77 5.02 2.07 2.77 3.70 4.93 1.54 2.07 2.76 3.68
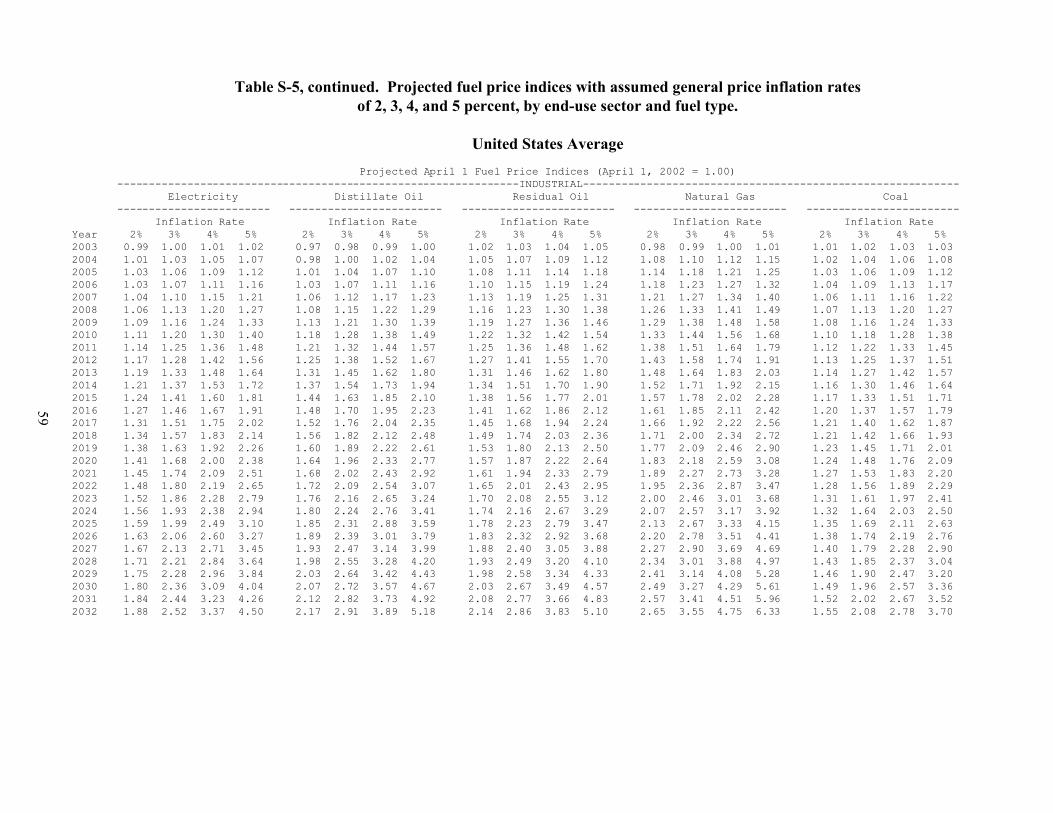
59
Table S-5, continued. Projected fuel price indices with assumed general price inflation ratesof 2, 3, 4, and 5 percent, by end-use sector and fuel type.
United States Average
Projected April 1 Fuel Price Indices (April 1, 2002 = 1.00) ---------------------------------------------------------------INDUSTRIAL----------------------------------------------------------- Electricity Distillate Oil Residual Oil Natural Gas Coal ------------------------ ------------------------ ------------------------ ------------------------ ------------------------ Inflation Rate Inflation Rate Inflation Rate Inflation Rate Inflation Rate Year 2% 3% 4% 5% 2% 3% 4% 5% 2% 3% 4% 5% 2% 3% 4% 5% 2% 3% 4% 5% 2003 0.99 1.00 1.01 1.02 0.97 0.98 0.99 1.00 1.02 1.03 1.04 1.05 0.98 0.99 1.00 1.01 1.01 1.02 1.03 1.03 2004 1.01 1.03 1.05 1.07 0.98 1.00 1.02 1.04 1.05 1.07 1.09 1.12 1.08 1.10 1.12 1.15 1.02 1.04 1.06 1.08 2005 1.03 1.06 1.09 1.12 1.01 1.04 1.07 1.10 1.08 1.11 1.14 1.18 1.14 1.18 1.21 1.25 1.03 1.06 1.09 1.12 2006 1.03 1.07 1.11 1.16 1.03 1.07 1.11 1.16 1.10 1.15 1.19 1.24 1.18 1.23 1.27 1.32 1.04 1.09 1.13 1.17 2007 1.04 1.10 1.15 1.21 1.06 1.12 1.17 1.23 1.13 1.19 1.25 1.31 1.21 1.27 1.34 1.40 1.06 1.11 1.16 1.22 2008 1.06 1.13 1.20 1.27 1.08 1.15 1.22 1.29 1.16 1.23 1.30 1.38 1.26 1.33 1.41 1.49 1.07 1.13 1.20 1.27 2009 1.09 1.16 1.24 1.33 1.13 1.21 1.30 1.39 1.19 1.27 1.36 1.46 1.29 1.38 1.48 1.58 1.08 1.16 1.24 1.33 2010 1.11 1.20 1.30 1.40 1.18 1.28 1.38 1.49 1.22 1.32 1.42 1.54 1.33 1.44 1.56 1.68 1.10 1.18 1.28 1.38 2011 1.14 1.25 1.36 1.48 1.21 1.32 1.44 1.57 1.25 1.36 1.48 1.62 1.38 1.51 1.64 1.79 1.12 1.22 1.33 1.45 2012 1.17 1.28 1.42 1.56 1.25 1.38 1.52 1.67 1.27 1.41 1.55 1.70 1.43 1.58 1.74 1.91 1.13 1.25 1.37 1.51 2013 1.19 1.33 1.48 1.64 1.31 1.45 1.62 1.80 1.31 1.46 1.62 1.80 1.48 1.64 1.83 2.03 1.14 1.27 1.42 1.57 2014 1.21 1.37 1.53 1.72 1.37 1.54 1.73 1.94 1.34 1.51 1.70 1.90 1.52 1.71 1.92 2.15 1.16 1.30 1.46 1.64 2015 1.24 1.41 1.60 1.81 1.44 1.63 1.85 2.10 1.38 1.56 1.77 2.01 1.57 1.78 2.02 2.28 1.17 1.33 1.51 1.71 2016 1.27 1.46 1.67 1.91 1.48 1.70 1.95 2.23 1.41 1.62 1.86 2.12 1.61 1.85 2.11 2.42 1.20 1.37 1.57 1.79 2017 1.31 1.51 1.75 2.02 1.52 1.76 2.04 2.35 1.45 1.68 1.94 2.24 1.66 1.92 2.22 2.56 1.21 1.40 1.62 1.87 2018 1.34 1.57 1.83 2.14 1.56 1.82 2.12 2.48 1.49 1.74 2.03 2.36 1.71 2.00 2.34 2.72 1.21 1.42 1.66 1.93 2019 1.38 1.63 1.92 2.26 1.60 1.89 2.22 2.61 1.53 1.80 2.13 2.50 1.77 2.09 2.46 2.90 1.23 1.45 1.71 2.01 2020 1.41 1.68 2.00 2.38 1.64 1.96 2.33 2.77 1.57 1.87 2.22 2.64 1.83 2.18 2.59 3.08 1.24 1.48 1.76 2.09 2021 1.45 1.74 2.09 2.51 1.68 2.02 2.43 2.92 1.61 1.94 2.33 2.79 1.89 2.27 2.73 3.28 1.27 1.53 1.83 2.20 2022 1.48 1.80 2.19 2.65 1.72 2.09 2.54 3.07 1.65 2.01 2.43 2.95 1.95 2.36 2.87 3.47 1.28 1.56 1.89 2.29 2023 1.52 1.86 2.28 2.79 1.76 2.16 2.65 3.24 1.70 2.08 2.55 3.12 2.00 2.46 3.01 3.68 1.31 1.61 1.97 2.41 2024 1.56 1.93 2.38 2.94 1.80 2.24 2.76 3.41 1.74 2.16 2.67 3.29 2.07 2.57 3.17 3.92 1.32 1.64 2.03 2.50 2025 1.59 1.99 2.49 3.10 1.85 2.31 2.88 3.59 1.78 2.23 2.79 3.47 2.13 2.67 3.33 4.15 1.35 1.69 2.11 2.63 2026 1.63 2.06 2.60 3.27 1.89 2.39 3.01 3.79 1.83 2.32 2.92 3.68 2.20 2.78 3.51 4.41 1.38 1.74 2.19 2.76 2027 1.67 2.13 2.71 3.45 1.93 2.47 3.14 3.99 1.88 2.40 3.05 3.88 2.27 2.90 3.69 4.69 1.40 1.79 2.28 2.90 2028 1.71 2.21 2.84 3.64 1.98 2.55 3.28 4.20 1.93 2.49 3.20 4.10 2.34 3.01 3.88 4.97 1.43 1.85 2.37 3.04 2029 1.75 2.28 2.96 3.84 2.03 2.64 3.42 4.43 1.98 2.58 3.34 4.33 2.41 3.14 4.08 5.28 1.46 1.90 2.47 3.20 2030 1.80 2.36 3.09 4.04 2.07 2.72 3.57 4.67 2.03 2.67 3.49 4.57 2.49 3.27 4.29 5.61 1.49 1.96 2.57 3.36 2031 1.84 2.44 3.23 4.26 2.12 2.82 3.73 4.92 2.08 2.77 3.66 4.83 2.57 3.41 4.51 5.96 1.52 2.02 2.67 3.52 2032 1.88 2.52 3.37 4.50 2.17 2.91 3.89 5.18 2.14 2.86 3.83 5.10 2.65 3.55 4.75 6.33 1.55 2.08 2.78 3.70