energy price increases in the uk
TRANSCRIPT

8/12/2019 Energy Price Increases in the UK
http://slidepdf.com/reader/full/energy-price-increases-in-the-uk 1/16
Energy Prices
Standard Note: SN/SG/4153
Last updated: 31 January 2014
Author: Paul Bolton
Section Social & General Statistics
This note includes a limited amount of information on the different elements thatmake up an energy bill. The new note Components of an Energy Bill includes muchmore detail on this and the different factors behind price rises.
Interim Update
The data in the charts and tables in this note were updated on 31 January 2014.The analysis has not been changed since November 2013 and will be updated inthe near future.
The price of domestic gas and electricity has generally increased over the past eight yearsafter around a decade of falling prices. The cost of heating oil has increased by a largeramount. There have been some price cuts over the past few years, but these have beensmaller than the price rises. Last winter all of the big six energy suppliers increased gas andelectricity prices by between 6% and 11%. So far this autumn four of the big six haveannounced price increases of between 8.5% and 11.1% which will be implemented beforethe end of the year. Domestic prices have ratcheted up as higher operating, network andenvironmental costs and higher supplier margins have magnified the impact of longer termincreases in wholesale costs. In the medium to long term the pressures on price all appear tobe upwards and the only way for most consumers to reduce the impact of increased unitcosts, and even to reduce their bills, is through energy efficiency improvements.
This note focuses on trends in the domestic market -the costs of gas, electricity and otherfuels used for heating and the impact on fuel poverty. Most data is in price indices thestatistical literacy guide on index numbers gives some advice on interpreting them. Ananalysis of the impact of earlier price trends on levels on consumption can be found inEnergy price rises and their impact on demand . The note Fuel Poverty looks at trends,patterns and projections of fuel poverty and the article Energy prices and fuel poverty gives abrief snapshot of trends in prices, fuel poverty and prospects for the future. Help with EnergyBills gives information on sources of financial and practical help for individuals. The recentEnergy and Climate Change Select Committee Report Energy Prices, Profits and Poverty contains information that many readers of this note may find useful.
Ofgem’s detailed analysis of the retail energy sector can be found on their Retail MarketReview pages and regular updates of trends in the broad make-up of a bill in their weekly
This information is provided to Members of Parliament in support of their parliamentary duties and is not intended toaddress the specific circumstances of any particular individual. It should not be relied upon as being up to date; the law orpolicies may have changed since it was last updated; and it should not be relied upon as legal or professional advice or asa substitute for it. A suitably qualified professional should be consulted if specific advice or information is required.
This information is provided subject to our general terms and conditions which are available online or may be provided onrequest in hard copy. Authors are available to discuss the content of this briefing with Members and their staff, but not withthe general public.

8/12/2019 Energy Price Increases in the UK
http://slidepdf.com/reader/full/energy-price-increases-in-the-uk 2/16
2
Electricity and Gas Supply Market Indicators . A more detailed analysis is included inHousehold bills explained . The Department for Energy and Climate Change (DECC)produces an annual analysis of the impact of energy and climate change policies on averagebills. This looks at current bills and forecasts through to 2020 and beyond. DECC ’s QuarterlyEnergy Prices contains comprehensive national and international statistics. This note doesnot look at road fuel prices. Trends in these are summarised in Road fuel prices: Social
Indicators page and crude oil price trends are described in Oil prices .
60
70
80
90
100
110
120
130
140
1970 1975 1980 1985 1990 1995 2000 2005 2010
Index of real domestic fuel and light prices (Q1 1987=100)
Source: Quarterly fuel prices, DECC. Table 2.1.1
Contents
1 Domestic sector 3
Summary of energy use 3
1.1 Price changes 3
1.2 Domestic expenditure on energy 5
Average gas and electricity bills for typical consumers 5
Other estimates of average bills 6
Actual household expenditure 7
International comparisons 8
1.3 Impact on fuel poverty 9
2 Why have gas and electricity prices increase so much? 9
2.1 Spot wholesale gas prices 10
2.2
Overall assessments and projections to 2020 11
3 Reference tables 14

8/12/2019 Energy Price Increases in the UK
http://slidepdf.com/reader/full/energy-price-increases-in-the-uk 3/16
3
1 Domestic sectorSummary of energy use
In 2012 the domestic sector was responsible for 29% of final energy consumption in the UK.Gas made up 68% of total domestic energy use, followed by electricity (23%), petroleum
products (6%) and coal/solid fuel 2%. Total energy use by this sector fell by almost 20% in2011, in large part due to the milder winter, before increasing by 11% in 2012. Domesticenergy use increased by 16% between 1970 and 2012 and 6% was has increased by 6%since 1990. 1
An estimated 97% of households in Great Britain had central heating in 2011. Among thosehomes with central heating 85% used gas, 8% electricity, 4% oil and 1% solid fuel. Overall53% of the energy used in homes in 2012 was for space heating, 30% for lighting andappliances, 14% for water heating, and 3% for cooking. 2
1.1 Price changes
The first chart opposite givesmonthly index values forselected fuel components of theRetail Prices Index (RPI) since1987. This shows how the realprice of each has change overthis time and helps comparetrends. The second chart belowseparates out each series to
better identify the trends forindividual fuel types. This datais summarised in Table 1 at theend of this note.
1 Digest of UK energy statistics 2013 , DECC. Table 1.1.52 Energy Consumption in the UK 2013, DECC
50
70
90
110
130
150
170
190
210
230
1987 1990 1993 1996 1999 2002 2005 2008 2011 2014
Index prices of selected fuel components of the RPIindices relative to the all items RPI, January 1987=100
Coal and smokeless f uels
Gas
Electricity
Heating oils
Source: ONS series DOBW, DOBY, DOBX, DOBZ and CHAW

8/12/2019 Energy Price Increases in the UK
http://slidepdf.com/reader/full/energy-price-increases-in-the-uk 4/16

8/12/2019 Energy Price Increases in the UK
http://slidepdf.com/reader/full/energy-price-increases-in-the-uk 5/16
8/12/2019 Energy Price Increases in the UK
http://slidepdf.com/reader/full/energy-price-increases-in-the-uk 6/16
6
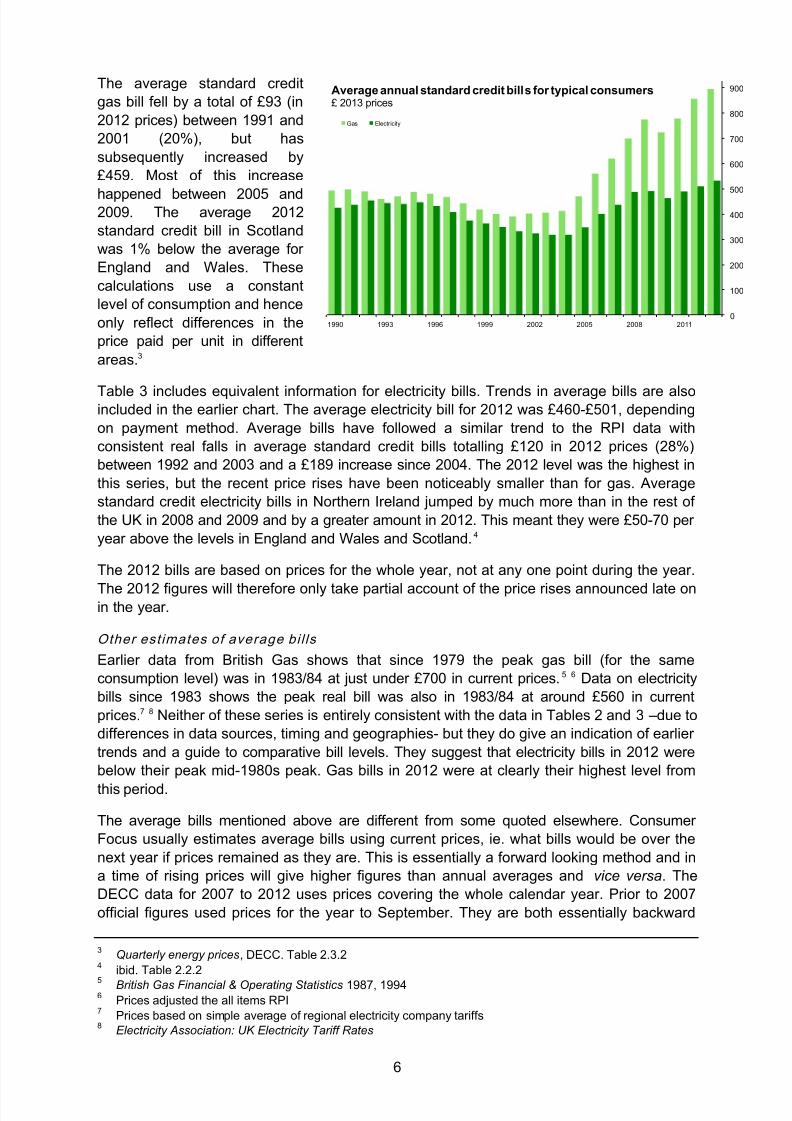
The average standard creditgas bill fell by a total of £93 (in2012 prices) between 1991 and2001 (20%), but hassubsequently increased by£459. Most of this increase
happened between 2005 and2009. The average 2012standard credit bill in Scotlandwas 1% below the average forEngland and Wales. Thesecalculations use a constantlevel of consumption and henceonly reflect differences in theprice paid per unit in differentareas. 3
Table 3 includes equivalent information for electricity bills. Trends in average bills are alsoincluded in the earlier chart. The average electricity bill for 2012 was £460-£501, dependingon payment method. Average bills have followed a similar trend to the RPI data withconsistent real falls in average standard credit bills totalling £120 in 2012 prices (28%)between 1992 and 2003 and a £189 increase since 2004. The 2012 level was the highest inthis series, but the recent price rises have been noticeably smaller than for gas. Averagestandard credit electricity bills in Northern Ireland jumped by much more than in the rest ofthe UK in 2008 and 2009 and by a greater amount in 2012. This meant they were £50-70 peryear above the levels in England and Wales and Scotland. 4
The 2012 bills are based on prices for the whole year, not at any one point during the year.
The 2012 figures will therefore only take partial account of the price rises announced late onin the year.
Other est imates of average bi l ls
Earlier data from British Gas shows that since 1979 the peak gas bill (for the sameconsumption level) was in 1983/84 at just under £700 in current prices. 5 6 Data on electricitybills since 1983 shows the peak real bill was also in 1983/84 at around £560 in currentprices. 7 8 Neither of these series is entirely consistent with the data in Tables 2 and 3 –due todifferences in data sources, timing and geographies- but they do give an indication of earliertrends and a guide to comparative bill levels. They suggest that electricity bills in 2012 werebelow their peak mid-1980s peak. Gas bills in 2012 were at clearly their highest level fromthis period.
The average bills mentioned above are different from some quoted elsewhere. ConsumerFocus usually estimates average bills using current prices, ie. what bills would be over thenext year if prices remained as they are. This is essentially a forward looking method and ina time of rising prices will give higher figures than annual averages and vice versa . TheDECC data for 2007 to 2012 uses prices covering the whole calendar year. Prior to 2007official figures used prices for the year to September. They are both essentially backward
3 Quarterly energy prices , DECC. Table 2.3.24 ibid. Table 2.2.25 British Gas Financial & Operating Statistics 1987, 19946 Prices adjusted the all items RPI7 Prices based on simple average of regional electricity company tariffs8 Electricity Association: UK Electricity Tariff Rates
0
100
200
300
400
500
600
700
800
900
1990 1993 1996 1999 2002 2005 2008 2011
Gas Electricity
Average annual standard credit bills for typical consumers£ 2013 prices

8/12/2019 Energy Price Increases in the UK
http://slidepdf.com/reader/full/energy-price-increases-in-the-uk 7/16
7
looking, so gives a lower figure when prices are rising. In addition the average bill dataproduced by DECC uses ‘typical’ domestic consumption levels of 3,300 kWh and18,000 kWh for gas and electricity respectively. These levels had been commonly used inthe industry, although some organisations, including Ofgem have recently revised down theirgas consumption levels.
While the level of ‘typical ’ consumption used has no effect on trends in average bills, it doesaffect the absolute value and hence the impact in pounds and pence of any given percentagechange. In 2012 the average domestic consumption of electricity and gas was 4,200 kWhand 15,300 kWh respectively. 9 The gas figure especially has fallen over time. Ordinarily thisis connected to a mild winter, but high prices and improvements in energy efficiency will alsohave been a factor over recent years. Gas consumption had been 20,000-20,500 kWh perhousehold over the period 2001-04. Actual 2012 consumption levels would cut around £125a year off the figure for a ‘typical’ gas consumer and add around £140 a year to the figure forthe ‘typical’ electricity consumer. 10 Mean consumption levels can be skewed by a relativelysmall number of very high users. It is likely that households with electric central heating skewthe mean electricity figure above the median value and the ‘typical’ consumption level is
closer to consumption levels for households with other forms of heating.
Heating oil and coal pricesThe average price for deliveries of up to 1,000 litres of heating oil in August 2012 was55.3 pence per litre. The trend in prices is illustrated in the earlier charts. The price peaked at64.4 pence per litre in April 2012 which was just above the earlier peak of 64 pence in July2008, it was below 20 pence per litre in the first months of 2004 and 10 pence a litre in early1999. 11 The average price of 50kg of smokeless fuel in September 2012 was £20.04. Thiswas up from £10.90 January 2004; a real increase of 37%. 12
Actu al hou sehold expenditure
According the Expenditure and Food Survey mean household expenditure on all (non-motor)fuels in 2010 was £23.46 a week or around £1,220 a year. Expenditure on motor fuel alonewas almost £16 a week more than this. 13 Average spending on non-motor fuels forhouseholds in the lowest income decile was £13.90 a week (8.0% of total spending)compared to £31.70 in the top decile (3.0% of all spending). 14
The 2009 average weekly spend on non-motor fuels was the highest in real terms since thelate 1980s, but still relatively low when considering the period from the mid-1970s. The reallevel of spending per household increased during the late 1970s and early 1980s to a peakof £29 a week or £1,500 a year (2011 prices) in 1985. Average spending fell in most of thenext 15 years and was below £20 from 1997 to 2006. These trends will be affected by
consumption levels and household size as well as unit prices. The same survey found thataverage spending on electricity for households with electric central heating was £15.30 aweek in 2011 or £800 a year. Average spending on gas for households with gas centralheating was £12.46 a week or £650 a year. 15
9 Energy consumption in the UK 2013, DECC10 Based on average cost per kWh from Tables 2 and 311 Quarterly energy prices , DECC. Tables 4.1.1 and 4.1.212 ONS series CZMN and CHAW13 Quarterly energy prices , DECC. Table 2.6.214 Family spending 2012, ONS. Table A615 Quarterly energy prices , DECC. Table 2.6.2
8/12/2019 Energy Price Increases in the UK
http://slidepdf.com/reader/full/energy-price-increases-in-the-uk 8/16
8
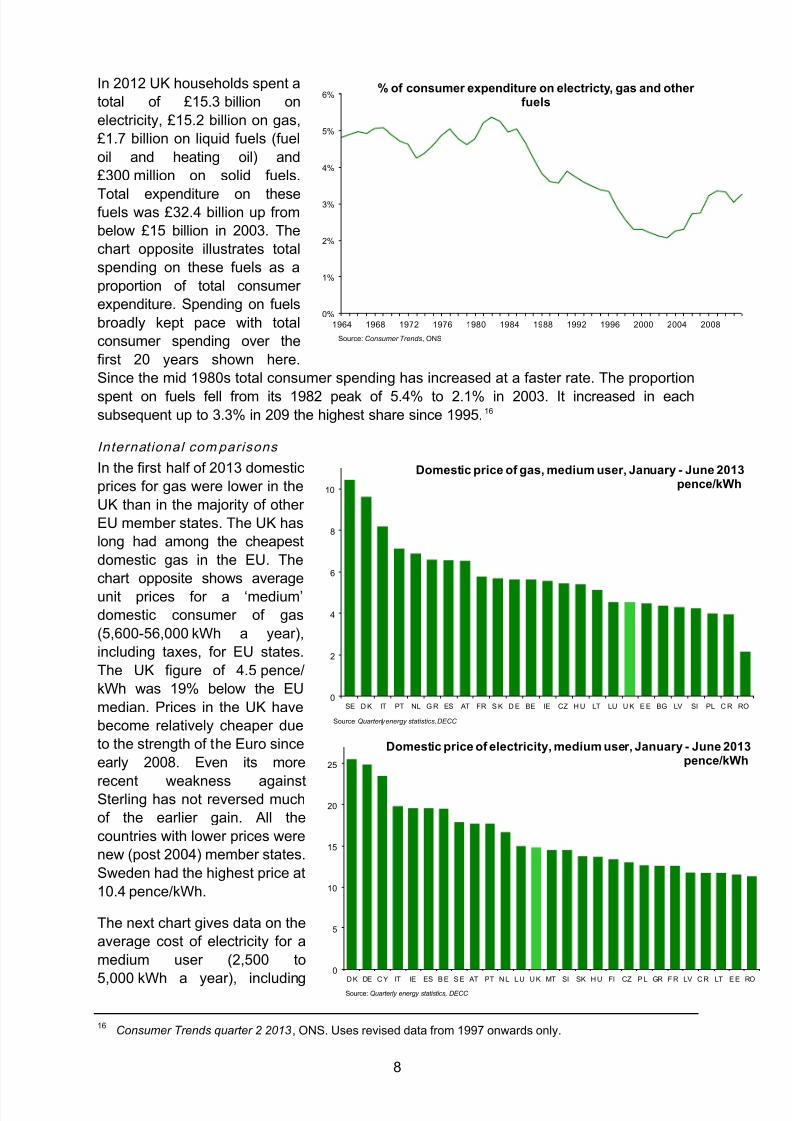
In 2012 UK households spent atotal of £15.3 billion onelectricity, £15.2 billion on gas,£1.7 billion on liquid fuels (fueloil and heating oil) and£300 million on solid fuels.
Total expenditure on thesefuels was £32.4 billion up frombelow £15 billion in 2003. Thechart opposite illustrates totalspending on these fuels as aproportion of total consumerexpenditure. Spending on fuelsbroadly kept pace with totalconsumer spending over thefirst 20 years shown here.Since the mid 1980s total consumer spending has increased at a faster rate. The proportionspent on fuels fell from its 1982 peak of 5.4% to 2.1% in 2003. It increased in eachsubsequent up to 3.3% in 209 the highest share since 1995. 16
Internat ional com parisons
In the first half of 2013 domesticprices for gas were lower in theUK than in the majority of otherEU member states. The UK haslong had among the cheapestdomestic gas in the EU. Thechart opposite shows averageunit prices for a ‘medium’domestic consumer of gas(5,600-56,000 kWh a year),including taxes, for EU states.The UK figure of 4.5 pence/kWh was 19% below the EUmedian. Prices in the UK havebecome relatively cheaper dueto the strength of the Euro sinceearly 2008. Even its more
recent weakness againstSterling has not reversed muchof the earlier gain. All thecountries with lower prices werenew (post 2004) member states.Sweden had the highest price at10.4 pence/kWh.
The next chart gives data on theaverage cost of electricity for amedium user (2,500 to
5,000 kWh a year), including
16 Consumer Trends quarter 2 2013 , ONS. Uses revised data from 1997 onwards only.
0%
1%
2%
3%
4%
5%
6%
1964 1968 1972 1976 1980 1984 1988 1992 1996 2000 2004 2008
% of consumer expenditure on electricty, gas and otherfuels
Source: Consumer Trends , ONS
0
2
4
6
8
10
SE D K IT PT NL G R ES AT FR S K D E BE IE CZ H U LT LU U K E E BG LV SI PL C R RO
Domestic price of gas, medium user, January - June 2013pence/kWh
Source: Quarterly energy statistics, DECC
0
5
10
15
20
25
D K DE C Y IT IE ES B E S E AT PT N L L U U K MT SI SK H U FI CZ P L GR F R LV C R LT E E RO
Domestic price of electricity, medium user, January - June 2013pence/kWh
Source: Quarterly energy statistics, DECC
8/12/2019 Energy Price Increases in the UK
http://slidepdf.com/reader/full/energy-price-increases-in-the-uk 9/16
9
taxes, for all EU28 states. The price in the UK was just ranked in the top half and was 2%below the EU median.
VaasaEtt, an energy think tank, publishes monthly domestic gas and electricity prices formajor cities in EU countries. Their latest Household Energy Price Index (September 2013)broadly confirms the relative picture shown above. Based on simple exchange rates London
had the twelfth most expensive electricity (out of 23) and the seventh cheapest gas (out of22). London prices become relatively cheaper if real exchange rates are used 17 as thesemake prices in Central and Eastern Europe relatively more expensive and London moves toseventh cheapest for electricity and second cheapest for gas. The report also breaks downthese prices by their constituent parts. Cities with the highest prices tended to haveparticularly large percentage contributions from energy taxes and VAT.
1.3 Impact on fuel poverty
A household is said to be in fuel poverty if it needs to spend more than 10% of its income onfuel to maintain a satisfactory heating regime. Between 1996 and 2003 and 2004 the numberof UK households in fuel poverty fell from around 6.5 million to around 2 million. The number
of vulnerable households (those in receipt of means tested or disability related benefit) in fuelpoverty fell from around 5 million to around 1.5 million over the same period. Energy pricerises since then have seen the total number of households in fuel poverty increase to anestimated 5.6 million in 209 before falling to 4.5 million in 2011 (3.5 million vulnerable).Subsequent price rises are expected to increase fuel poverty further. 18 A more detailedanalysis of fuel poverty trends and patterns can be found in the Fuel Poverty Statistics note.
2 Why have gas and electricity prices increase so much?There have been three ‘waves’ of increased prices for domestic gas and electricity price ssince the late 1980s; 2005/2006, 2008 and 2011/12. The earlier analysis has shown that
trends in gas and electricity prices have been similar, but there has been some difference inthe size of and timing of price spikes. Gas has generally been the single most important fuelused to generate power, 19 so we would expect some connection between prices. Generatorscan switch to other fuels (mainly coal) to a limited extent, but this additional demandincreases the price of these fuels.
Broadly speaking there a re five elements that make up a customer’s energy bill; thewholesale cost of fuel, the costs of supply – transmission, distribution and metering, costs ofGovernment/EU policy, VAT and supplier margins. Ofgem estimates that wholesale fuelcosts are the largest single element; 44% of typical dual fuel bills in October 2013. 20 Thecosts of supply are thought to be next most important; around 25% of a typical electricity and
22% of a typical gas bill in December 2012.21
Costs of policy are higher for electricity thangas, 11% compared to 6% according to Ofgem, but estimates vary depending on whichpolicies are included. VAT has remained at 5% since 1997. Ofgem’s October 2013 estimateof supplier margins for a dual fuel customer was 5% of their bill and company operating costsaround 10%. 22
17 Purchasing Power Standards18 Annual report on fuel poverty statistics 2013, DECC19 Recent higher gas prices have meant that more coal is used to generate power in the UK than gas, but
variations in gas prices still provide a good guide to changes in costs of marginal generation20 Electricity and Gas Supply Market Indicators , Ofgem (October 2013)21 Household Energy Bills Explained , Ofgem (February 2013)22 Electricity and Gas Supply Market Indicators , October 2013 (and earlier)

8/12/2019 Energy Price Increases in the UK
http://slidepdf.com/reader/full/energy-price-increases-in-the-uk 10/16
10
2.1 Spot wholesale gas prices
The chart opposite illustratestrends in wholesale gas pricesin the UK to October 2013. Thisclearly shows the very sharppeaks in late 2005 and early2006 and the generally higherprices during this period. Therehave been large relative pricechanges since then, but not onthe same scale. There is someevidence of lower levels of pricevolatility in 2007 and, apart fromearly 2013, most of the periodsince 2009. The chart alsoshows a steady increase in thewholesale price of gas from spring 2007.
The peak in the wholesale price of gas and electricity in late summer 2005 fed throughquickly to higher industrial prices and more slowly to higher domestic prices. Fallingwholesale prices in the second half of 2006 meant lower industrial prices, domestic pricesstarted to fall in early 2007.
The 2005/06 price spikeThere were specific aggravating factors behind this spike; the lack of UK import and storagecapacity and insufficient imports through the gas interconnector with France. A written answerstated that there was 'general concern' that other governments' rules were diverting supplies ofliquefied natural gas away from Great Britain and that supplies through the interconnector werenot fully responding to recent strong price signals. 23 Higher UK wholesale prices in winter2005/06 should have resulted in greater quantities of gas flowing from continental Europe tothe UK than were actually seen. The preliminary findings of a European Commission inquiryidentified a range of market distortions that have the effect of driving up prices and reducingchoice. These were said to largely result from former monopoly suppliers on the continentremaining in dominant positions and effectively preventing new suppliers from entering themarket. 24 Increased LNG capacity and new pipelines to the Netherlands and Norway havehelped to diversity gas import sources and hence reduce the possibility of supply squeezes.
23 HC Deb 15 December 2005 c2254w24 Towards an Efficient and Integrated European Energy Market – First Findings and Next Steps , European
Commission Conference, Energy Sector Inquiry – Public Presentation of the Preliminary Findings. 16February 2005
0
1
2
3
4
5
0
1
2
3
4
5
Oct 05 Apr 06 Oct 06 Apr 07 O ct 07 Apr 08 Oct 08 Apr 09 Oct 09 Apr 10 O ct 10 Apr 11 Oct 11 Apr 12 Oct 12 Apr 13 Oct 13
Wholesale price of gas in the UK, pence/kWhDaily system average price
Thirt y day average
Source: www.nationalgrid.com
8/12/2019 Energy Price Increases in the UK
http://slidepdf.com/reader/full/energy-price-increases-in-the-uk 11/16
11
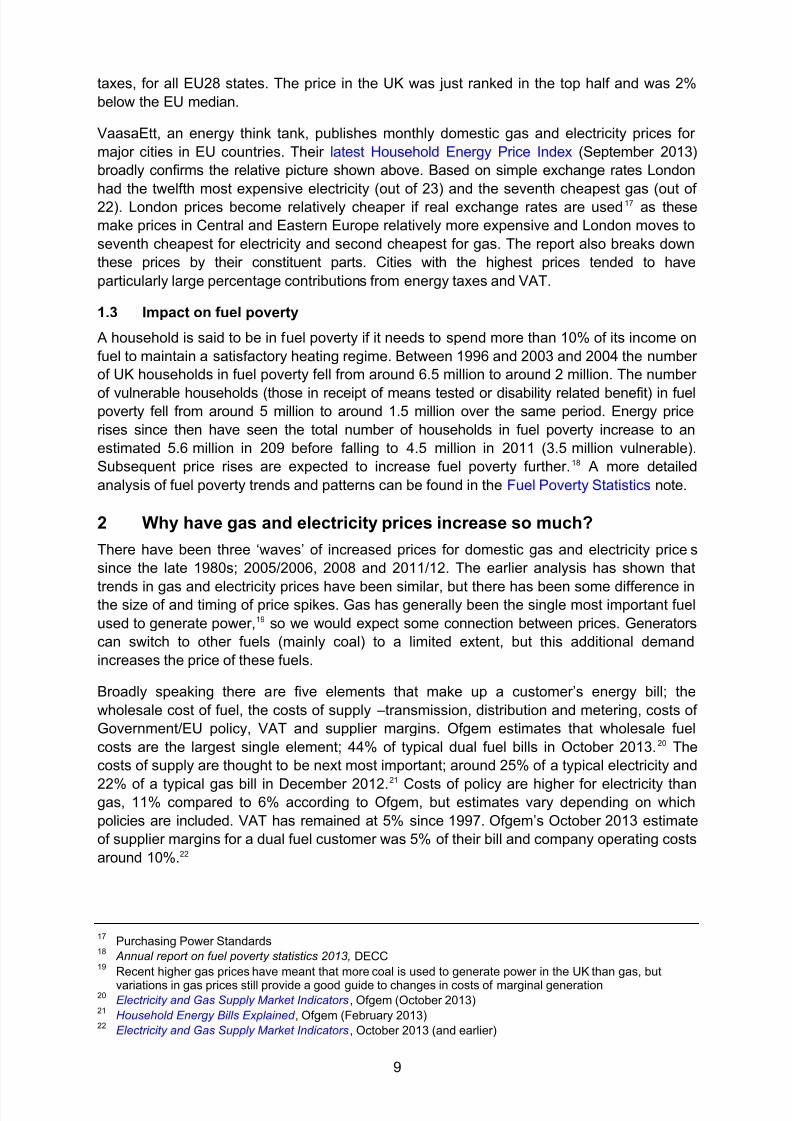
The more recent price risesare less clear from the earlierchart as it is dominated bythe price spikes in 2005/06.They are clear in the chartopposite which starts in
spring 2006. Pricesincreased from 0.5-1.0 penceper kWh in early 2007 tomore than 2.0 pence perkWh in spring and summer2008. Increased wholesaleprices led to a round of pricerises in early 2008.Continued high forwardprices were said to be behindfurther price rises announced in summer 2008.
There was a large amount of volatility after the summer 2008 peak in oil prices, but thesedaily wholesale prices did not start to fall until February 2009. They reached their recent lowof around 0.5 pence per kWh in early autumn 2009. The first domestic price cuts followingthese price falls did not happen until February 2010. They averaged 6%, a similar price cut tothat seen a year earlier. 25 Wholesale prices increased steadily back up to around the2.0 pence per kWh level from early 2011 onwards. The 30-day average neared 3.0 penceper kWh in early 2013, but soon returned to close to its earlier levels.
These figures are spot prices and suppliers frequently quote forward gas prices, especiallythose for the coming winter. Forward contracts can cover the period of a few months or years
ahead and suppliers will have a variety of buying strategies to hedge against the volatility inshort term prices and ideally to cut their costs.
2.2 Overall assessments and projections to 2020
Ofgem carried out detailed analysis of gas and electricity markets and specifically looked athow prices charged to consumers reflected changes in wholesale forward prices. Thisanalysis can be found in the report of their Energy Supply Probe . The actual information fromsuppliers on hedging strategies was not published, but concentrated much of their analysison an 18-month hedge strategy. Statistical analysis of this strategy showed a very closematch with retail prices. The broad trends in wholesale costs they estimate are similar to thespot prices given above, but they are much less volatile. The report concluded that there wasno evidence that price rises were passes on more quickly than price cuts and no evidencethat the big six suppliers were acting as a cartel.
After this publication Ofgem started to publish quarterly wholesale/retail price reports whichlook at changes in the two and alongside their other costs, estimate supplier margins. Ofgemhas now started publishing headline indicators of average bills and estimated costs everyweek. These can be found on their Electricity and Gas Supply Market Indicators pages.
One important point to note is that while the main factor in consumer bills is the wholesalecost of fuel, bills are ‘ratcheting up’. Over time a given wholesale price implies a higher retailprice. Thi s is not just connected with profit levels, although Ofgem’s evidence suggests that
these have increased recently, it is with other costs to suppliers listed earlier. Ofgem
25 ONS series DOBY
0.0
0.5
1.0
1.5
2.0
2.5
3.0
3.5
0.0
0.5
1.0
1.5
2.0
2.5
3.0
3.5
M ay 06 No v 06 M ay 07 No v 0 7 May 08 Nov 0 8 M ay 09 No v 0 9 M ay 10 Nov 1 0 M ay 11 No v 11 M ay 12 Nov 1 2 M ay 13 Nov 13
Wholesale price of gas in the UK, pence/kWhDaily system average price
Thirty day average
Source: www.nationalgrid.comSource: www.nationalgrid.com
8/12/2019 Energy Price Increases in the UK
http://slidepdf.com/reader/full/energy-price-increases-in-the-uk 12/16
12
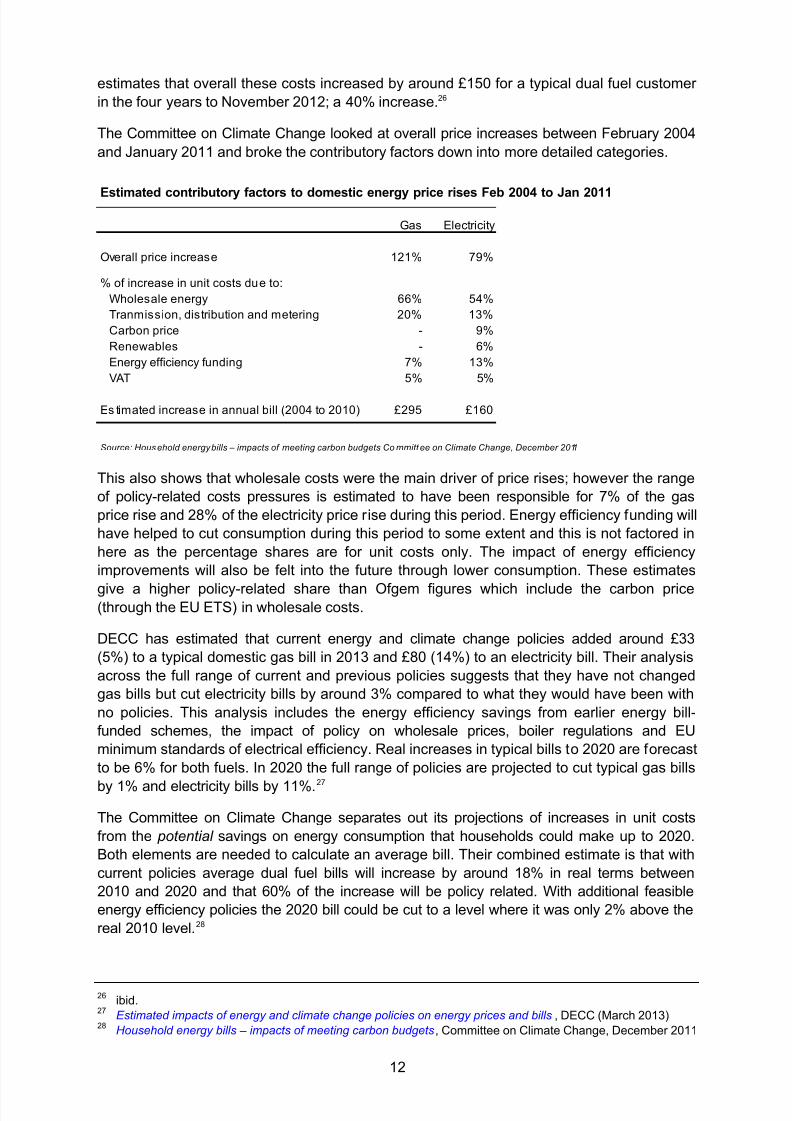
estimates that overall these costs increased by around £150 for a typical dual fuel customerin the four years to November 2012; a 40% increase. 26
The Committee on Climate Change looked at overall price increases between February 2004and January 2011 and broke the contributory factors down into more detailed categories.
Estimated contributory factors to domestic energy price rises Feb 2004 to Jan 2011
Gas Electricity
Overall price increase 121% 79%
% of increase in unit costs due to:Wholesale energy 66% 54%Tranmission, distribution and metering 20% 13%Carbon price - 9%Renewables - 6%Energy efficiency f unding 7% 13%VAT 5% 5%
Es timated increase in annual bill (2004 to 2010) £295 £160
Source: Hous ehold energy bills – impacts of meeting carbon budgets Co mmitt ee on Climate Change, December 2011
This also shows that wholesale costs were the main driver of price rises; however the rangeof policy-related costs pressures is estimated to have been responsible for 7% of the gasprice rise and 28% of the electricity price rise during this period. Energy efficiency funding willhave helped to cut consumption during this period to some extent and this is not factored inhere as the percentage shares are for unit costs only. The impact of energy efficiencyimprovements will also be felt into the future through lower consumption. These estimates
give a higher policy-related share than Ofgem figures which include the carbon price(through the EU ETS) in wholesale costs.
DECC has estimated that current energy and climate change policies added around £33(5%) to a typical domestic gas bill in 2013 and £80 (14%) to an electricity bill. Their analysisacross the full range of current and previous policies suggests that they have not changedgas bills but cut electricity bills by around 3% compared to what they would have been withno policies. This analysis includes the energy efficiency savings from earlier energy bill-funded schemes, the impact of policy on wholesale prices, boiler regulations and EUminimum standards of electrical efficiency. Real increases in typical bills to 2020 are forecastto be 6% for both fuels. In 2020 the full range of policies are projected to cut typical gas bills
by 1% and electricity bills by 11%.27
The Committee on Climate Change separates out its projections of increases in unit costsfrom the potential savings on energy consumption that households could make up to 2020.Both elements are needed to calculate an average bill. Their combined estimate is that withcurrent policies average dual fuel bills will increase by around 18% in real terms between2010 and 2020 and that 60% of the increase will be policy related. With additional feasibleenergy efficiency policies the 2020 bill could be cut to a level where it was only 2% above thereal 2010 level. 28
26 ibid.27 Estimated impacts of energy and climate change policies on energy prices and bills , DECC (March 2013)28 Household energy bills – impacts of meeting carbon budgets , Committee on Climate Change, December 2011
8/12/2019 Energy Price Increases in the UK
http://slidepdf.com/reader/full/energy-price-increases-in-the-uk 13/16
13
There are a number of reasons for longer term increase in wholesale prices. According toOfgem the two main causes of the increased price of domestic gas are high oil prices anddeclining UK gas supplies. 29 The gas interconnector with Europe means that the UK is part ofthe European gas market. Continental gas prices are contractually linked to oil prices so thesharp increase in oil prices have fed through to wholesale gas prices in Europe and the UK.The UK became a net importer of gas in 2004 for the first time in recent history. This means
suppliers generally have to pay more for such gas. According to the (then) DTI the UK’sincreasing import dependence is likely to result in higher gas prices in the medium term. 30 More recent increases in the price of coal and the higher price of allowances on the EUEmissions Trading Scheme will also increase electricity prices.
29 Household energy bills explained , Ofgem (September 2005)30 Energy Trends September 2005 , DTI.

8/12/2019 Energy Price Increases in the UK
http://slidepdf.com/reader/full/energy-price-increases-in-the-uk 14/16
14
3 Reference tablesTable 1
Fuel price components of the RPIIndices relative to the all-items RPI, January 1987=100
Coal andsmokeless
fuels Electricity GasHeating
oilsFuel and
light
Jan 1987 100.0 100.0 100.0 100.0 100.0Jan 1988 98.5 96.8 92.4 94.2 95.2Jan 1989 92.9 97.8 91.2 80.5 93.9
Jan 1990 88.2 96.8 87.5 104.2 92.6Jan 1991 86.4 96.9 88.6 114.3 93.4Jan 1992 86.7 102.9 88.1 77.1 94.2Jan 1993 86.0 103.5 82.2 82.7 92.2Jan 1994 84.9 98.5 80.2 77.1 88.7Jan 1995 87.9 101.4 84.1 76.6 91.8
Jan 1996 85.7 98.1 82.8 79.0 89.8Jan 1997 84.8 92.3 80.5 87.6 86.3Jan 1998 81.6 83.8 74.8 69.6 78.7Jan 1999 81.5 81.1 72.7 58.0 76.1
Jan 2000 81.3 79.0 70.7 86.0 75.3Jan 2001 81.6 74.6 66.9 93.2 71.9Jan 2002 85.6 74.1 72.2 79.6 73.7Jan 2003 85.1 72.3 70.9 92.5 73.0Jan 2004 84.8 72.1 71.6 89.8 73.2Jan 2005 91.1 78.1 80.5 104.0 80.9Jan 2006 95.7 84.1 90.1 135.3 89.6Jan 2007 99.1 102.2 121.0 116.7 110.4
Jan 2008 103.6 93.7 100.9 159.9 100.0Jan 2009 136.1 122.1 152.5 145.3 134.9
Jan 2010 131.7 108.4 138.3 177.8 123.0Jan 2011 127.5 104.8 130.2 205.1 119.9Jan 2012 131.2 114.1 149.2 206.0 132.6Jan 2013 126.2 114.8 152.1 203.3 133.9
Oct 2013 125.2 113.8 149.9 189.1 131.9Nov 2013 126.4 113.7 149.8 186.1 131.7Dec 2013 125.9 120.4 159.3 189.5 139.1
Changes
Last 12 months +0.3% +5.4% +5.2% -8.2% +4.2%
Last two years -3.4% +6.1% +7.4% -7.3% +5.6%
Sources: ONS series CHA W, CHGB , DOBW, DOB Y, DOB X, DOB Z

8/12/2019 Energy Price Increases in the UK
http://slidepdf.com/reader/full/energy-price-increases-in-the-uk 15/16
15
Table 2
Average annual domestic gas bills for a typical consumer in Great Britain£ 2013 prices
Standard credit Direct debit Prepayment
Homesuppliers
Non-homes uppliers All
Homesuppliers
Non-homes uppliers All
Homesuppliers
Non-homes uppliers All
1990 .. .. 493 .. .. .. .. .. 5241991 .. .. 498 .. .. .. .. .. 5241992 .. .. 490 .. .. .. .. .. 5181993 .. .. 459 .. .. .. .. .. 4871994 .. .. 469 .. .. .. .. .. 510
1995 .. .. 488 .. .. 464 .. .. 5181996 479 444 479 447 418 447 508 508 5081997 469 397 468 438 379 438 498 479 4981998 448 368 441 393 348 388 463 456 463
1999 433 360 418 375 342 367 434 448 4362000 420 353 401 370 336 359 420 439 4232001 409 347 389 364 328 353 409 424 4112002 423 354 402 383 335 364 424 424 4242003 425 367 406 383 349 371 425 435 4262004 427 383 413 393 367 383 440 424 435
2005 489 430 469 443 411 429 494 471 4882006 603 505 560 536 473 501 609 552 5892007 630 607 619 552 566 560 677 639 6622008 700 699 700 645 651 648 748 705 7292009 783 764 776 728 707 714 827 793 810
2010 732 713 724 700 667 679 730 721 7262011 791 758 778 764 703 724 792 755 7722012 883 821 857 853 759 789 880 819 8452013 923 861 896 883 794 823 921 866 890
Not es: British Gas is the home supplier, none home suppliers are all ot hersData before 2007 are for Quarter 4 from the previous year to quarter 3 of the named year. From 2007 data are for the calendar year Data adjust ed to 2013 prices using Dec ember 2013 GDP def lato rs
Source: Quarterly energy prices, DECC , Table 2.2.1

8/12/2019 Energy Price Increases in the UK
http://slidepdf.com/reader/full/energy-price-increases-in-the-uk 16/16
Table 3
Average annual domestic electricity bills for a typical consumer in the UK£ 2013 prices
Standard credit Direct debit Prepayment
Homesuppliers
Non-homesuppliers All
Homesuppliers
Non-homesuppliers All
Homesuppliers
Non-homes uppliers All
1990 .. .. 424 .. .. .. .. .. 4571991 .. .. 436 .. .. .. .. .. 4701992 .. .. 454 .. .. .. .. .. 4881993 .. .. 444 .. .. .. .. .. 4761994 .. .. 440 .. .. 436 .. .. 471
1995 .. .. 446 .. .. 440 .. .. 4761996 .. .. 431 .. .. 422 .. .. 4601997 .. .. 406 .. .. 395 .. .. 4311998 .. .. 375 .. .. 361 .. .. 3991999 364 336 362 349 319 347 385 370 385
2000 353 328 349 338 314 333 374 371 3722001 339 315 332 326 302 318 356 348 3552002 332 302 323 320 289 307 350 332 3442003 327 301 317 315 287 302 340 331 3382004 329 302 318 318 286 302 349 327 340
2005 358 331 347 344 311 327 376 362 3702006 405 392 400 386 358 370 419 431 4242007 452 417 437 428 385 402 459 450 4552008 506 464 487 483 424 448 515 501 5082009 514 466 491 483 428 448 515 486 501
2010 484 441 462 453 407 423 487 461 4742011 508 475 490 471 440 451 509 487 4972012 527 497 511 489 460 470 529 499 5122013 548 519 532 509 482 491 550 524 534
No tes: Fo rmer public electricit y suppliers are hom e supplier within their own areas, none hom e suppliers are all ot hersData befo re 2007 are fo r Quarter 4 from t he previous year to quarter 3 of t he named year. From 2007 data are for t he calendar year Data adjust ed to 2013 prices using Dec ember 2013 GDP def lato rs
Source: Quarterly energy prices, DECC , Table 2.3.1