energy poverty in developing countries' urban poor ... · we are thankful to our external...
TRANSCRIPT

Energy poverty in developing countries' urban poor communities: assessments and recommendations Country Report 2014
Case Study Thailand February 2014 Final Version

Global Network on Energy for Sustainable Development (GNESD) UNPE Risø Centre, Bldg. 142 Frederiksborgvej 399 P.O. Box 49 DK 4000 Roskilde Denmark tel: +45 4677 5189 fax:+ 45 4632 1999 http://www.gnesd.org/ Acknowledgment:
This report was prepared for the Global Network on Energy for Sustainable Development by The Asian Institute of Technology (AIT), Bangkok, Thailand. Authors: S. Kumar, P. Abdul Salam & P. Shrestha. Front cover photo of High tension power cables strung across the creek in Vashi, Navi Mumbai. Photo courtesy of Deepak Sharma, 2011. Suggested Citation:
GNESD 2014. Country report (Thailand). Energy poverty in developing countries' urban poor communities: assessments and recommendations. Urban and Peri-urban energy access III. Report prepared for the Global Network on Energy for Sustainable Development by The Asian Institute of Technology (AIT).
Disclaimer: The opinions and recommendations expressed in this report are those of the authors and do not necessarily reflect those of UNEP, UN-Energy and GNESD. The designations employed and the presentation of the material in this publication do not imply the expression of any opinion whatsoever on the part of UNEP, UN-Energy or GNESD concerning the legal status of any country, territory, city, or area or of its authorities.

Table of Contents
Acknowledgements ................................................................................................................................ 2
List of Tables ........................................................................................................................................... 3
List of Figures .......................................................................................................................................... 4
Executive Summary ................................................................................................................................ 7
1. Introduction .................................................................................................................................... 9
1.1 Background and Objectives ......................................................................................................... 9
1.2 Methodology............................................................................................................................... 10
1.3 Report structure.......................................................................................................................... 11
2. Setting the Context ....................................................................................................................... 13
2.1 Location and demographic profile.......................................................................................... 13
2.2 Profile of urban poor .............................................................................................................. 14
2.3 Access to legal and clean energy by the urban poor in Greater Bangkok ............................... 19
3. Energy plan for the urban poor .................................................................................................... 26
3.1 National Development Plans, Policies and Programs .............................................................. 26
3.2 Poverty related plans, policies and programmes .................................................................... 28
3.3 Energy related plans, policies and programs .......................................................................... 30
3.4 Major findings of analysis of plans/policies ............................................................................ 33
4. Barriers to Energy Access .............................................................................................................. 35
4.1 Supply Side Barriers ............................................................................................................... 35
4.2 Demand Side Barriers ............................................................................................................ 40
5. Best Practices ................................................................................................................................ 44
5.1 Best Practices from Thailand .................................................................................................. 44
5.2 Best Practices outside Thailand .............................................................................................. 49
6. Recommendations ........................................................................................................................ 56
6.1 Barrier specific recommendations ......................................................................................... 56
6.2 Recommendations for further study ...................................................................................... 59
References ............................................................................................................................................ 61
Annex 1: Sample questionnaire utilized for semi-structured interviews with supply agency ............. 66
Annex 2: Sample questionnaire utilized for HH surveys in slum areas ................................................ 71
Picture Story ......................................................................................................................................... 78
1

Acknowledgements
We would like to thank Global Network on Energy for Sustainable Development (GNESD) for the financial support and The Energy and Resources Institute (TERI) for providing the methodological framework for conducting this study.
The present study could not have been possible without the time, contribution and generous feedback of many people and institutions, and we would like to acknowledge each of them.
We extend our sincere gratitude to the participants who attended the consultative workshop on 4 October 2011 and the policy dialogue on 6 March 2012, and gave valuable suggestions
We are also grateful to Mr. Pichai Sanguanchaipaiwong from Metropolitan Electricity Authority (MEA); Ms. Chirapaporn Laima and Mr. Uthai Muangseemuengdee from Energy Policy and Planning Office (EPPO); Mr. Songwoot Khandee from Provincial Electricity Authority (PEA); Mr. Pornchai Patiparnprechavut from Energy Regulatory Commission (ERC); Mr. Ruangyuth Teeravanich from National Housing Authority (NHA) and Dr. Kurujit Nakornthap from the Ministry of Energy for their time and inputs during the interviews.
Special thanks also go to Ms. Nutta Ratanachaichan from Community Organizations Development Institute (CODI); Mr. Thanee Prichantintranee from MEA and Mr. Thiyagarajan Velumail from UNDP for the information and feedback on the report.
We owe our gratitude to the community leaders and the people residing in the urban poor areas of Bangkok (Soi Daeng Bunga community and New Development community) who participated in the survey.
We would also like to acknowledge Ms. Sirirat Muneesawang for her contribution to the study.
We are thankful to our external reviewer Dr. Bundit Limmeechokchai from Sirindhorn International Institute of Technology, Thammasat University, Thailand, for his useful comments and feedback on the report.
S. Kumar P. Abdul Salam P. Shrestha
December 2012
2

List of Tables Table 1: Slum housing in Bangkok (2010) ........................................................................................... 15 Table 2: Summary of low income households ................................................................................... 15 Table 3: Monthly income of surveyed slum communities ............................................................... 17 Table 4: Service availability in Bangkok slums (1994) ...................................................................... 18 Table 5: Surveyed electrical appliances in slum communities in Bangkok.................................... 19 Table 6: Electricity expenditures in surveyed households ............................................................... 21 Table 7: Perceptions of surveyed households on electricity (% of HH).......................................... 21 Table 8: Average Consumption of Electricity of Poor and Non-Poor Households ....................... 22 Table 9: MEA electricity tariff for residential customers .................................................................. 31 Table 10: Key findings from the interviews with energy supply agencies .................................... 36 Table 11: Renewable energy and energy conservation activities of BMA during 2006-2008 ...... 39 Table 12: The retail LPG price in Bangkok including VAT for different brands ........................... 40 Table 13: Key findings from the household survey of the urban poor ........................................... 41 Table 14: Criteria for electricity pricing for residential customers .................................................. 45 Table 15: Selected best practices that address specific barrier ......................................................... 50 Table 16: Barrier specific recommendations ....................................................................................... 56
3

List of Figures Figure 1 Overall framework of the UPEA study ............................................................................... 10 Figure 2: Map of Bangkok and its Peri-Urban areas ......................................................................... 13 Figure 3: Distribution of slum areas in Bangkok ............................................................................... 14 Figure 4: Location of surveyed slum areas for the UPEA II study ................................................. 15 Figure 5: The percentage of five-top occupations found in low income residents over 15 years16 Figure 6: The distribution of housing tenure in low income households ...................................... 17 Figure 7: Housing tenureship of the surveyed households ............................................................. 18 Figure 8: Cooking fuels used by the surveyed households ............................................................. 20 Figure 9: Use of energy for income generation .................................................................................. 22 Figure 10: Connections through MEA and neighbors ...................................................................... 23 Figure 11: Perception on reliability of LPG supply ........................................................................... 24 Figure 12: Income ranges of surveyed households ........................................................................... 41 Figure 13: Number of Members in HHs ............................................................................................. 41 Figure 14: Percentage of household satisfied with free electricity policy ...................................... 46 Figure 15: Benefits of free electricity policy ....................................................................................... 46 Figure 16: Percentage of household satisfied with LPG pricing policy ......................................... 47
BOXES Box 1: The Secure Housing Project (Baan Mankong Programme) ........................................................... 29 Box 2: Programme promoting energy efficient appliance........................................................................ 32
4
List of Abbreviations
AAGR Average Annual Growth Rate
ADB Asian Development Bank
AIT Asian Institute of Technology
BMA Bangkok Metropolitan Administration
BMR Bangkok Metropolitan Region
CFL Compact Fluorescent Lamp
CODI Community Organizations Development Institute
DEDE Department of Alternative Energy Development and Efficiency
DOEB Department of Energy Business
EE Energy Efficiency
EGAT Electricity Generating Authority of Thailand
EPPO Energy Policy and Planning Office
ERC Energy Regulatory Commission
GB Greater Bangkok
GBMA Greater Bangkok Metropolitan Area
GNESD Global Network on Energy for Sustainable Development
HH Household
ID Identification
IPP Independent Power Producer
KMITL King Mongkut’s Institute of Technology Ladkrabang
LPG Liquefied Petroleum Gas
MFI Micro Finance Institution
MDG Millennium Development Goal
MEA Metropolitan Electricity Authority
NESDB National Economic and Social Development Board
NESDP National Economic and Social Development Plan
NHA National Housing Authority
NSO National Statistics Office
PEA Provincial Electricity Authority
5
RE Renewable Energy
RET Renewable Energy Technology
SIP Social Investment Project
SOE State Owned Enterprise
SPP Small Power Producer
SSPL Social Sector Program Loans
TERI The Energy and Resources Institute
TPEE Thailand Promotion of Electricity Energy Efficiency
UCDO Urban Community Development Office
UNEP United Nations Environment Programme
UPEA Urban Peri Urban Energy Access
VSPP Very Small Power Producer
6

Executive Summary
Energy is a crucial input for social and economic development. But, more than a billion people in the Asia-Pacific region do not have access to electricity and 1.7 billion are dependent on traditional biomass fuel for cooking and heating needs. Though energy access in the rural areas has been well recognized and documented, there are considerable number of poor living in urban areas who have low income and lack access to clean and modern sources of energy. Modern, affordable and improved access to energy and its services are crucial to stimulate social, economic and environmental development. The main objectives of this study, UPEA III, was to identify best practices and barriers to energy access for the urban poor and to provide specific recommendations to overcome the barriers. The study was based on the findings of the earlier UPEA studies, literature review, policy review and active engagement of stakeholders through interviews, consultative meetings and policy dialogue.
Thailand is a developing country with high level of access to modern forms of energy. Approximately 34% of its 63.9 million people are living in municipal areas (NSO, 2010) and although the overall poverty level in the country has decreased1, pockets of poverty especially in urban and peri urban areas still exist that are either incapable to afford or are denied the access to legal, affordable and reliable source of energy. Targeted policy actions for electricity coverage (e.g. the accelerated electrification programme of Thai government, introduction of lifeline tariff) have resulted in the widespread energy access throughout the country, including the urban poor. However, there are increasing numbers of urban poor population who do not have legal supply of electricity due to their tenureship and their inability to pay the associated costs and therefore get their electricity supply from the neighbors. This often leads to situation when urban poor cannot avail themselves of the lifeline tariff and end up paying far more per unit of electricity consumed than others. Similarly, although a wide range of energy efficiency mechanisms have been put into place for general consumers, energy efficiency improvements have few considerations for the urban poor.
Evidence from published data and field survey of the urban poor in Bangkok shows that the availability of modern energy access to the urban poor, specifically who live in the slum areas of Greater Bangkok is probably not the main issue due to high level of electrification and convenient LPG distribution. However, many poor households are not able to obtain legal, affordable and efficient (clean) sources of energy and its services particularly due to their illegal status and low affordability.
The review shows that energy access in the urban poor is high due to the poverty alleviation and urban development programme of the government. Although intrinsically not linked to the energy issue itself, most of the poverty alleviation and urban development policies have a component on urban poverty that help in the expansion of basic need coverage (like housing, water supply, energy). Moreover, low-income housing policies of the government and the slum upgrading programmes have had direct impact in the livelihood of the urban poor and their access to energy. For example, in the housing units developed for the urban poor and those living in the slum areas, electricity is included in the package with the house ensuring reliability and affordability to the low income groups. Community organizations also play a major role in uniting poor people to improve the settlements, and act as a bridge of communication between the poor and government authorities.
1 Thailand has already achieved its Millennium Development Goal 1, which is to halve, between 1990 and 2015, the proportion of population living in extreme poverty (NESDB, 2009)
7

The major barrier impeding the suppliers to provide clean energy and for the urban poor to obtain it was found to be mainly due to the illegal status of the poor i.e. lack of household registration number. There were considerable poor households in the slum areas that were unaware about the procedure to apply for housing registration number (i.e. the temporary household ID) and therefore obtained electricity from neighbors at higher cost. Thus, the issue of energy access to urban poor in Bangkok is probably not mainly related to availability of modern energy supply, instead it is about how to make improvements to their access in terms of affordability, efficiency and services. The key factors to the poor households’ high cost of electricity and LPG are due to high upfront cost of electricity connection, cost of electricity tariff that has gradually increased, high upfront cost to use high energy efficient appliances, and the social characteristics of comparatively larger sizes of urban poor HHs making them unable to benefit the free electricity policy.
The barriers for improving modern energy access and energy efficiency in the urban poor were found to be the following:
• Financial (upfront cost and the extra cost related to improved energy access and energy efficiency deters the poor’s ability to access reliable, modern and efficient source of energy); Policy (there exist no specific policies, plans and programmes that look after the energy efficiency aspect to the urban poor);
• Physical (the physical location of urban poor community which is usually narrow, over- crowed, limited and unsafe that can affect the installation, delivery and monitoring of electricity and LPG supply);
• Awareness (lack of awareness in the slum communities that even though they might not be eligible for permanent housing registration number, they could still apply for a ‘quasi household ID’ which could be used to get a metered connection of electricity from MEA);
• Institutional (lack of coordination between among the departments and between different agencies in planning and dealing effectively the energy issues of urban poor).
Measures to address these and other barriers were identified and proposed, and best practices from Thailand and other countries to improve energy access have been compiled.
The recommendations were further discussed with stakeholders for promoting legal, affordable and efficient access of energy and its services to the urban poor.
8
1. Introduction 1.1 Background and Objectives
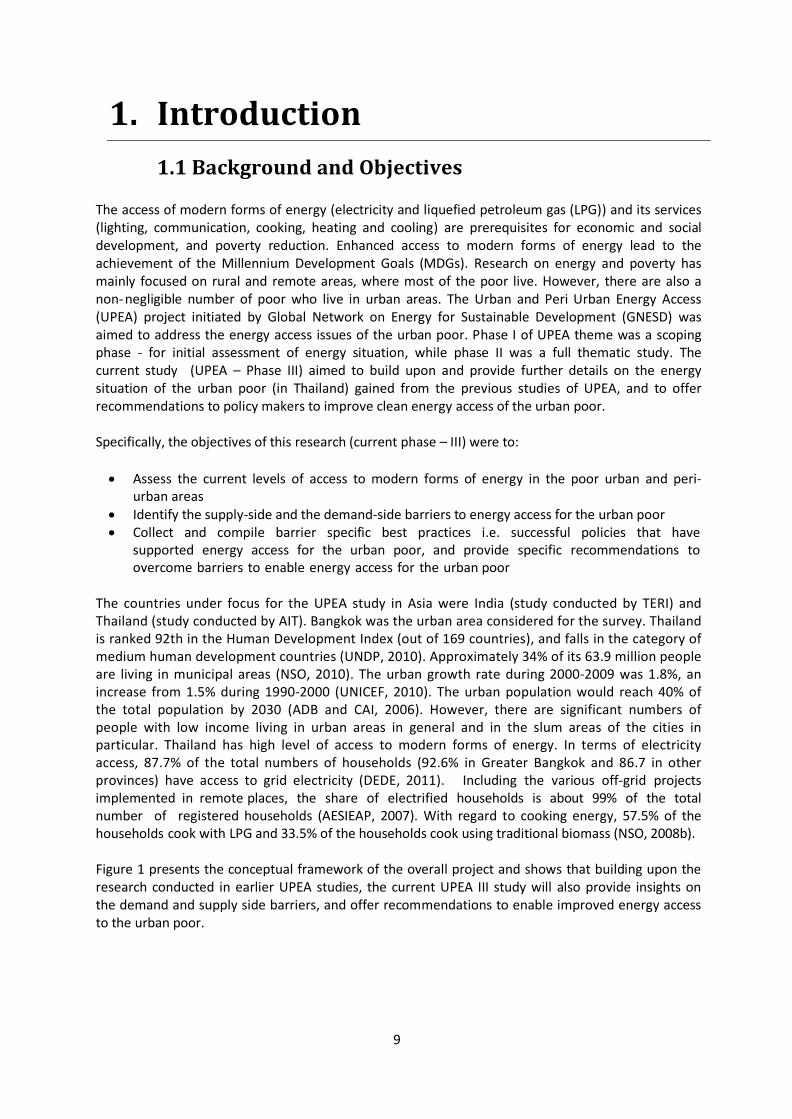
The access of modern forms of energy (electricity and liquefied petroleum gas (LPG)) and its services (lighting, communication, cooking, heating and cooling) are prerequisites for economic and social development, and poverty reduction. Enhanced access to modern forms of energy lead to the achievement of the Millennium Development Goals (MDGs). Research on energy and poverty has mainly focused on rural and remote areas, where most of the poor live. However, there are also a non-negligible number of poor who live in urban areas. The Urban and Peri Urban Energy Access (UPEA) project initiated by Global Network on Energy for Sustainable Development (GNESD) was aimed to address the energy access issues of the urban poor. Phase I of UPEA theme was a scoping phase - for initial assessment of energy situation, while phase II was a full thematic study. The current study (UPEA – Phase III) aimed to build upon and provide further details on the energy situation of the urban poor (in Thailand) gained from the previous studies of UPEA, and to offer recommendations to policy makers to improve clean energy access of the urban poor.
Specifically, the objectives of this research (current phase – III) were to:
• Assess the current levels of access to modern forms of energy in the poor urban and peri-
urban areas • Identify the supply-side and the demand-side barriers to energy access for the urban poor • Collect and compile barrier specific best practices i.e. successful policies that have
supported energy access for the urban poor, and provide specific recommendations to overcome barriers to enable energy access for the urban poor
The countries under focus for the UPEA study in Asia were India (study conducted by TERI) and Thailand (study conducted by AIT). Bangkok was the urban area considered for the survey. Thailand is ranked 92th in the Human Development Index (out of 169 countries), and falls in the category of medium human development countries (UNDP, 2010). Approximately 34% of its 63.9 million people are living in municipal areas (NSO, 2010). The urban growth rate during 2000-2009 was 1.8%, an increase from 1.5% during 1990-2000 (UNICEF, 2010). The urban population would reach 40% of the total population by 2030 (ADB and CAI, 2006). However, there are significant numbers of people with low income living in urban areas in general and in the slum areas of the cities in particular. Thailand has high level of access to modern forms of energy. In terms of electricity access, 87.7% of the total numbers of households (92.6% in Greater Bangkok and 86.7 in other provinces) have access to grid electricity (DEDE, 2011). Including the various off-grid projects implemented in remote places, the share of electrified households is about 99% of the total number of registered households (AESIEAP, 2007). With regard to cooking energy, 57.5% of the households cook with LPG and 33.5% of the households cook using traditional biomass (NSO, 2008b).
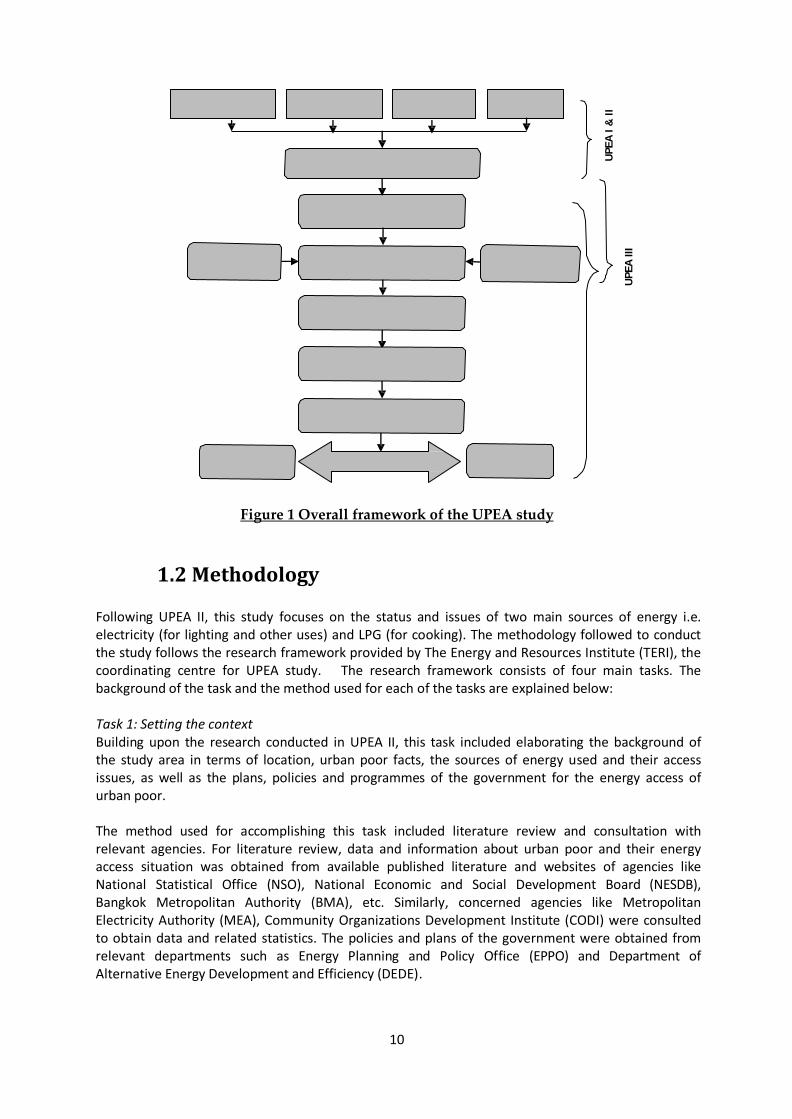
Figure 1 presents the conceptual framework of the overall project and shows that building upon the research conducted in earlier UPEA studies, the current UPEA III study will also provide insights on the demand and supply side barriers, and offer recommendations to enable improved energy access to the urban poor.
9
UPE
A I
& II
UPE
A II
I
Urban Poor Facts Energy Sources Key Issues Policies
Urban & Peri Urban Energy Status
Stakeholders Consultative Meeting (October 2011)
Supply Side Barriers
Identification of Barriers Demand Side Barriers
Best Practices
Proposed Recommendations
Policy Dialogue (March 2012)
Stakeholders &
Agencies
Final Recommendations GNESD
Figure 1 Overall framework of the UPEA study
1.2 Methodology
Following UPEA II, this study focuses on the status and issues of two main sources of energy i.e. electricity (for lighting and other uses) and LPG (for cooking). The methodology followed to conduct the study follows the research framework provided by The Energy and Resources Institute (TERI), the coordinating centre for UPEA study. The research framework consists of four main tasks. The background of the task and the method used for each of the tasks are explained below:
Task 1: Setting the context Building upon the research conducted in UPEA II, this task included elaborating the background of the study area in terms of location, urban poor facts, the sources of energy used and their access issues, as well as the plans, policies and programmes of the government for the energy access of urban poor.
The method used for accomplishing this task included literature review and consultation with relevant agencies. For literature review, data and information about urban poor and their energy access situation was obtained from available published literature and websites of agencies like National Statistical Office (NSO), National Economic and Social Development Board (NESDB), Bangkok Metropolitan Authority (BMA), etc. Similarly, concerned agencies like Metropolitan Electricity Authority (MEA), Community Organizations Development Institute (CODI) were consulted to obtain data and related statistics. The policies and plans of the government were obtained from relevant departments such as Energy Planning and Policy Office (EPPO) and Department of Alternative Energy Development and Efficiency (DEDE).
10

Task 2: Identifying barriers to energy access Task 2 involved identifying and categorizing the energy access for the urban poor in terms of supply side and demand side barriers. In order to identify the supply side barriers, the suppliers of energy were interviewed. A consultative meeting with stakeholders influencing the provision of energy access and services to the urban poor was organized on 4 October 2011 to understand their perspectives on the barriers to energy access. Stakeholders consulted included representatives from the government agencies; local authority; energy suppliers; housing authority; regulatory agency; NGOs and academia.
The demand side barriers were identified using information from UPEA II and the surveys conducted in UPEA II and UPEA III (this study). In 2007, hundred households from five slum communities in Bangkok namely Pom Mahakarn in Phranakorn District; Soi Daeng Bunga in Phrayathai District; New Development 7-12 in Klong Toei District; Mahadthai 1 in Pravet district and Bangkroi in Nonthaburi were surveyed, During January 2012, a survey of forty households were conducted in two of the same slum areas of Bangkok i.e. Soi Deang Bunga and New Development 7-12. The survey was mainly aimed at finding the household details in terms of family size, total income; identifying the major fuels used for cooking and lighting purposes, and the pattern of fuel usage and expenditure in the households. This was done by initially contacting the community slum leader and a brief about the purpose of the research and survey was made. The community leader then introduced the researchers to the slum community and the households were randomly surveyed. The questionnaire used for the survey is attached in Annex 1 (supply agencies) and Annex 2 (households) of the report. The survey was conducted in Thai language and each survey lasted for approximately 15-20 minutes.
Task 3: Best Practices Barriers specific best practices i.e. successful policies/ initiatives that have supported or enabled improved energy access were identified based on literature review and discussed during the stakeholders’ discussion. Best practices for the cases outside Thailand were obtained from UNEP, UN-Habitat, UNDP, etc.
Task 4: Recommendations Based on the discussions with the relevant stakeholders, analysis and the compilation of best practices; specific recommendations were proposed to overcome the barriers. A policy dialogue was organized on 6 March 2012 to further discuss the recommendations, and to exchange information with the stakeholders on the issues related to modern, efficient and improved energy access to the urban poor. The same categories of stakeholders that were consulted during first workshop in October 2011 were again consulted for the policy dialogue.
This final report essentially is an updated version based on the inputs and suggestions obtained during and after the policy dialogue. The final report (with recommendations) will be submitted to national policy makers and local government for their inputs.
1.3 Report structure
This report is organized as follows:
The second chapter introduces the study area in terms of its geographic location, demographic profile, and presents details of the urban poor and the energy access situation of the urban poor including energy sources and energy access issues.
11

The third chapter reviews the key plans, policies and programs for the urban poor and evaluates whether energy access for urban poor has been adequately addressed in these plans/policies and programs.
The fourth chapter of the report identifies the supply and demand barriers to modern and reliable energy access in the urban poor areas.
The fifth chapter is a compilation of barrier specific best practices i.e. successful policies and initiatives, both from and outside of Thailand that have supported or enabled energy access for the urban poor.
The final chapter gives the conclusions and recommendations.
12

2. Setting the Context 2.1 Location and demographic profile
Bangkok, the capital city of Thailand, is the cultural, commercial, economic and administrative center of Thailand. Bangkok Metropolis and the three adjacent provinces of Nonthaburi, Pathum Thani and Samut Prakan (Figure 2) are often referred to as Greater Bangkok Metropolitan Area (GBMA) or Greater Bangkok (GB). The region comprising Greater Bangkok and the two provinces of Nakhon Pathom and Samut Sakhon is also defined as Bangkok Metropolitan Region (BMR).
Figure 2: Map of Bangkok and its Peri-Urban areas2
Situated in the central region of Thailand, the Bangkok administrative area covers 1,568.7 km2 (606 mile2). It is the world’s 73rd and the south-east Asia’s 4th largest city in terms of land area (City Mayor, 2010). Greater Bangkok covers an area of 4,720.8 km2 and BMR constitutes an area of more than 7,750 km2. Lying on the Chao Phraya river basin adjacent to the Gulf of Thailand, Bangkok and its vicinities comprises a series of plains and river deltas that are about two meters above sea level.
The population of Bangkok Metropolis in 2010 was 5,701,394, and 26% of the total urban population of Thailand lived in Bangkok Metropolis (Department of Provincial Administration, 2010). However, this figure does not take into account the unregistered population in Bangkok, especially the migrant workers. Urban areas of Thailand have been the center of attraction for labor migration because of comparatively better facilities, transportation, public health and other infrastructure. About 81% of the dwellers in Bangkok region have migrated from other regions or slums and 78% are permanently settled in the region anticipating higher prospect of employment and better chance of rented housing availability (Guerra, 2004). Although the registered population of Bangkok metropolis is over 5.5 million, the actual population could be up to 8.7 million, mainly due to large influxes of migrants from Northeast Thailand and neighboring countries (BMA, 2012). Figure 2 shows that most of slum settlements of Bangkok are located in the areas where the main commercial activities are concentrated.
2 Map source: www.wiz.to and www.nectec.or.th accessed 28/12/2012 13

2.2 Profile of urban poor 2.2.1 Total urban poor population
The absolute poverty, in Thailand, is defined as the population with a monthly average income below the poverty line defined by National Economic and Social Development Board (NESDB). The poverty line of municipal area in Thailand in 2010 was 1,863 Baht/person/month and 2.57% of total municipal population was considered poor (NESDB, 2011).
Another measure on the extent of poverty in municipal areas is to report the number of slums3 and squatters. According to Pornchokchai (2003), slums and squatter settlements in Thailand are similar in terms of their substandard housing appearance with only difference in their legal status. Slums are mostly on rented land; while, squatter slums or squatter settlements are on illegally-occupied land and there are few slums where the land and houses are owned by the dwellers themselves. Based mainly on the data obtained from Community Organizations Development Institute (CODI), the Bangkok Metropolitan Authority (BMA) has given the magnitude of slums in Bangkok Metropolis (Table 1). In Bangkok Metropolis, the total slum population in 2010 accounted for 34.585% of its total population. Figure 3 shows the location of the slum communities in Bangkok. Table 2 shows the total number of low income households in Bangkok and other regions of Thailand (CODI, 2008). The BMA report gives the data of slum communities, whereas CODI’s data is for low income households.
Figure 3: Distribution of slum areas in Bangkok
Source: CODI, 2005) Since all the people residing in slum areas are not poor and the entire poor people do not reside on slum areas, it is necessary that the database for urban poor be updated. In UPEA II, five slum communities in Bangkok were surveyed to represent the urban poor of Greater Bangkok (see figure 4) - two communities on rented areas, two squatter communities on public lands and one squatter community on private land. The results and observations of the study are available in UPEA II report available in GNESD website and are briefly presented in the following sections.
3 In Thailand, the definition of slum by the National Housing Authority is a dirty, damp, swampy or unhealthy area with overcrowded buildings and dwellers which can be harmful for health or lives or can be a source of unlawful or immoral actions with minimum number of housing units per rai (1, 600 sq.metres) as 30. The Bangkok Metropolitan Administrative use a similar definition of slum as an overcrowded, orderly and dilapidated community with unample environment which can be harmful for health and lives with minimum number of housing units per rai as 15 (Pornchockchai, 2003).
14

Table 1: Slum housing in Bangkok (2010)
Location Bangkok Metropolis Total no. of slums 2007
Slum population (persons) 1,971,624
Slum household 425,425 Population of Bangkok Metropolis 5,701,394 Share of slum population to the total population of Bangkok Metropolis
(Source: BMA, 2010)
34.58%
Table 2: Summary of low income households
Region
Total no. of houses No. of low
income No. of low
income Share of low
income families houses houses (%)
Bangkok 364,344 327,990 232,435 18.07 Bangkok Peri Urban (Nonthaburi, 877,173 181,791 138,030 10.73 Samut Prakarn, Pathumthani) North 474,674 168,386 105,492 8.20 North-East 815,348 371,594 320,887 24.95 East 345,228 152,593 118,878 9.24 Central 349,309 156,820 133,213 10.36 West 318,141 24,623 22,175 1.72 South 741,329 266,650 215,255 16.73 (Source: CODI, 2008)
Nontaburi
5
1. Pom Mahakarn, Phranakorn district 1 2 2. Soi Daeng Bunga, Phrayathai district
3. New Development 7-12, Klong Toei 3 district
4 4. Mahadthai 1, Pravet district 5. BangKroi, Nonthaburi
Samut Songkram
Samut Prakan
Figure 4: Location of surveyed slum areas for the UPEA II study
15

9%
Com
pany
/ret
ail
empl
oyee
s
Trad
er
Daily
-wag
e w
orke
rs
Tem
pora
ry
wor
kers
Mot
orbi
ke/t
axi
driv
er
2.2.2 Socio-economic characteristics of urban poor in Greater Bangkok
i. Occupation and income
A survey of low income communities in urban areas of Thailand conducted by NSO in 2006 showed that private sector (company and retail) employees made up the largest share of occupation among low income populations in Greater Bangkok, followed by traders, daily-wage workers, and temporary workers. Figure 5 presents the occupation of low income residents in Bangkok and its peri-urban area.
Figure 5: The percentage of five-top occupations found in low income residents over 15 years
50%
40%
30%
20%
10%
0%
39%
36%
23%
20% 17% 10%
5% 7%6%
Bangkok
Peri-Urban
(Source: NSO, 2006)
A recent field survey for the current study in 2012 (UPEA III) confirms similar results. Majority of the surveyed households worked as retail/ company workers (32.5%), such as Port Authority. The second category was households, who had a grocery shop or small food stalls (32.5%) as their main source of income. Driving motorbike taxi and taxi (10%) and daily wage (7.5%) were another important occupation for the low income households in the surveyed areas.
The survey by NSO in 2006 also showed that, in general, the average income of low income population who were employed in Bangkok was Baht 3,001-6,000 per week or Baht 12,000-18,000 per month in 2006. The survey of 100 slum households in the Greater Bangkok region during 2007 (UPEA II) also showed similar results. The survey indicated that the average monthly income was Baht 12,102/household or Baht 2,630/capita. The incidence of poverty is therefore higher in the surveyed slums than in Greater Bangkok. These numbers, however, confirm that not all slum dwellers are poor and that a number of the poor in Bangkok do not live in slums. Table 3 shows the average monthly income of the surveyed households.
16

4.
Table 3: Monthly income of surveyed slum communities
Community Field Survey, 2007 Field Survey, 2012 Average Monthly Income Average Monthly Income
(Baht/HH) (Baht/HH) Name Type
New Development Block 7-12
Rented Area 9,026 23,785
Dang BhuNgha Squat on Government and Private Land
13,667 15,400
Baan Kroi Rented Area 10,815 NA
Ma Had Thai 1 Squat on
Government Land 12,663 NA
Pom Mahakarn Squat on Government Land
14,342 NA
Average for the surveyed communities 12,103 19,592
NA – not surveyed in 2012 Source: Field Surveys, 2007 (UPEA II) and 2012 (UPEA III)
ii. Housing tenureship
According to the national survey (NSO, 2006), most of the low income households in Greater Bangkok owned their houses either in their own lands or in rented lands. About 20-30% of them rented houses or units and the rest were dwellers without payment as shown in Figure 6. The dwellers without payments refer to people who mostly are relatives of the house owners and are allowed to stay in the houses without payment. Owners on rented land refer to those, who own only their houses that are located on the public lands. The owners of most public lands are temples, the Treasury Department, The Crown Property of Bureau, etc, who negotiated with communities and allowed them lease the lands for long term (about 30 years).
Figure 6: The distribution of housing tenure in low income households
40%
32.4%
37.9% 34.2%
30%
20%
10%
0%
30.8% 30.8%
6.4% 1%
23.3%
0.1%
Bangkok
Peri-Urban
House and House Dweller Tenant Other land owner owner on
rented land
without payment
(Source: NSO, 2006)
17

Services Availability (% of households)
Figure 7: Housing tenureship of the surveyed households
50%
40%
30%
20%
10%
0%
32.5%
7.5%
40.0%
20.0%
Squat on Government
Land
Squat on Private Land
Rented Area Others
Surveyed HHs
(Source: Field Survey, 2012)
However, the survey conducted in 2012 for this UPEA study (UPEA III) showed that many households do not have land ownership, as their houses are built on rented land owned by private or government companies. As shown in Figure 7, majority of the surveyed households (40%) lived in the houses owned by them in rented areas. This is probably due to the result of government’s programmes on upgrading the slum areas and work of social institutions such as CODI, that some of the slum areas have now been able to rent the entire area from the government or private land holders on a contract basis as a part of the slum upgrading programme. However, greater extents of slum dwellers still squat on government land (32.5%) or squat on private land (7.5%). Few households (20%) had moved from other areas to the surveyed areas and had recently rented the house (including the land).
iii. The availability of legal basic services
The survey conducted by NSO in 1994 indicates the living environment of Bangkok slums. It reveals the availability of basic services as shown in Table 4. Interestingly, the availability of electricity supply is higher than any other basic services even almost two decades ago. Table 4 also suggests that there are a higher number of households having access to electricity than being officially registered.
Table 4: Service availability in Bangkok slums (1994)
House registration number 89 Electricity supply 99 Water supply 97 Garbage disposal 58 Drainage 52 Day-care centre 19
(Source: Pornchokchai, 2003)
18

2.3 Access to legal and clean energy by the urban poor in Greater Bangkok
2.3.1 Main energy sources used by the urban poor
i. Electricity
Consistent with the national statistics (DEDE, 2011), the surveys reveal that all the low income households in Greater Bangkok have good access to electricity. Out of the 100 households interviewed during the field survey in 2007 (UPEA II), all of them reported having access to electricity, and 54 of them said they had access to electricity for more than 10 years. A similar survey of 100 slum households in Bangkok published in Cook et al. (2005) also reveals an electricity access of 100%. The recent survey in January 2012 (UPEA III), covering 40 households in the same area, reconfirmed that 100% of slum households have electricity access.
For greater Bangkok, a proxy that can be used to estimate the level of electricity access is the ownership of common electrical appliances. In 2009, 97.4% of households reported ownership of a neo-light, therefore implying the availability of a source of electricity and 97.8% declared having a TV (NSO, 2009a). A 2002 survey of one slum community revealed that all the slum households possessed a TV, implying that all of them had access to electricity (Pornchokchai, 2003). Similar trend of high level of TV and electric fans possession is also found in the surveyed slums in 2007 and 2012 for the UPEA study. Table 5 presents ownership rates of various appliances in slum households, implying the use of electricity for the purpose of comfort and daily activities such as, food preservation, laundering or entertainment. The average number of electric appliances per household were 8 (2012 survey) consisting of devices such as TV, fans, DVD players, rice cookers, etc. and the number of these devices (e.g. fan, TV) was more than one in many households.
Table 5: Surveyed electrical appliances in slum communities in Bangkok
2002 Survey1 2007 Survey2 2012 Survey3
% of total households % of total households % of total owning the appliance owning the appliance households owning
the appliance
Appliance type
Television 100 100 100 Refrigerator Washing machine Air-conditioning unit Electric water heater Rice cooker Fans Computer Microwave oven Video player
96 65 15 12 N.A. N.A. N.A. N.A. N.A.
99 90 N.A. 57.5 N.A. 25 N.A. 45 90 87.5 90 100 N.A. 32.5 N.A. 20 N.A. 57.5
Source:1Pornchokchai (2003), 2 Field survey (UPEA II) 3Field Survey (UPEA III)
ii. Energy for cooking
In Greater Bangkok, the main fuel used for cooking is LPG, and was used by 77.2% of households in 2009 compared with 67.2% in 2004. The second energy source for cooking is electricity used by 7.4% of households in 2009, a decrease from 13.3% in 2004. Charcoal, wood, kerosene and others are used by 1.3% of the population, a decrease from 3.2% in 2004. Interestingly, 14.2% of the total households in Greater Bangkok do not cook at home, and therefore do not consume any energy for cooking (NSO, 2009). These numbers however do not reflect the situation of the poor households.
19

6.0% 0.0%
In Thailand, households usually use several fuels to cook - LPG for the main dish, electricity for rice (rice cooker) or boiling water (electric kettle), and charcoal and wood to grill food. Poor households also use different cooking fuels for various uses as shown by the results of the survey presented in Figure 8. The recent survey of 2012 (UPEA III) showed that even though the poor households do not have a separate kitchen to cook food, majority of the households had a LPG cylinder with a stove attached on top for cooking. Interestingly, people in the surveyed areas, purchase street food. Therefore, it was not necessary that a household would prepare entire set of their meal in their house. Instead, they could buy certain kinds of food (e.g. grilled meat, rice) and prepare few at their home (e.g. rice, vegetables). Hence, LPG cylinders were found in majority of households (87.5%) either with separate stove or a small stove just attached on top of the cylinder. Even if the households did not cook at home, the LPG was used for boiling water or reheating.
Furthermore, no household was found to rely only on biomass for cooking. The main reason quoted to explain the use of LPG and electricity for cooking was that both sources are readily available and the supply is reliable. Similarly, many houses also used charcoal as their secondary fuel. The main reason to use charcoal as a secondary fuel was not due to unreliability of the primary fuel (LPG). Instead it was to cook special food (e.g. barbeque meat) or to boil water and other broth. Few houses (7.5%) were found to rely only on charcoal for cooking and the reason was found to be individual perception on the use of LPG cylinders such as its safety.
Figure 8: Cooking fuels used by the surveyed households
100%
80%
60%
40%
87.0%
37.5%
87.5% 54.0%
34.0%
50.0%
2007
2012
20%
0%
7.5% LPG Electricity Charcoal LPG &
Charcoal
0.0% 5.0%
Wood No cooking done at home
2.3.2 Key energy access issues
i. Electricity
Affordability
On average, in the surveyed households (during UPEA II) the electricity consumption was found to be 250 kWh/month, and ranging between 60 and 1,100 kWh/month. These figures were calculated from the reported electricity expenses4. The average monthly electricity expenditure for the surveyed households in 2007 was found to be Baht 865/household, and in 2012 it was found to be
4 The interviewees did not always have their latest electricity bills and felt more comfortable to answer in terms of electricity expenditures rather than electricity units consumed.
20

Baht 1223.75/household. Table 6 summarizes the household electricity expenditures in the surveyed slum households during 2007 and 2012. However, electricity expenses also could vary with time of the year. The latest survey was conducted in December 2011 -January 2012. It is likely that the electricity expenditure increases in summer compared to winter, due to higher usage of cooling devices such as fans, air conditioners, ice-box etc.
Table 6: Electricity expenditures in surveyed households
Field Survey 2007 Field Survey 2012
Surveyed HH Surveyed HH with income Surveyed HH below poverty line
Average Monthly Electricity Expenditure (Baht)
856 728 1223.75
Share in the total income (%) 7.1 11.5 8.1
Source: Field surveys in 2007 (UPEA II) and 2012 (UPEA III)
The expense for electricity paid by households below the poverty line is much higher than that by households above the poverty line. There are several reasons for the relative high electricity expenditure among the urban poor.
The increase in electricity tariff. Due to the global increase of the prices of oil and natural gas, the
electricity tariff has correspondingly increased. Table7 summarizes the perception of slum households on electricity in terms of electricity tariff, reliability of supply and their ability to pay. It is important note that households reporting expensiveness of the electricity tariff and explaining difficulties to pay for their monthly electricity bill were mostly those who were getting electricity from their neighbors.
Table 7: Perceptions of surveyed households on electricity (% of HH)
Survey Year
Electricity Tariff Reliability of supply Difficulties to pay
Expensive Cheap No Opinion
Increasing Decreasing Medium Reliable Not Reliable
No Opinion
2007 77 22 1 100 0 73 21 6 22
2012 55 5 2.5 NA 5 32.5 100 0 0 NA
(Source: Field surveys) One proxy that can be considered for poor households is the number of MEA customers consuming less than 150kWh/month and benefiting from reduced tariff. Table 8 presents the average electricity consumption and expenditure of poor and non-poor households in the Bangkok Metropolis, Nonthaburi and Samut Prakan region, using MEA customers benefiting from the reduced tariff as a proxy for poor. Table 8 shows that average electricity expenses have increased during 2002-2005 for both poor and non-poor in spite of an almost constant average monthly consumption. The average annual growth rate (AAGR) of average monthly electricity consumption was -0.8% and 0.06% for poor and non-poor respectively. However, the
21

Average consumption Average electricity Average electricity Average electricity
of poor households expenses of poor consumption of non- expenses of non-
(kWh/month) households poor households poor households (Baht/month) (kWh/month) (Baht/month)
Year
increase of electricity expenses of the poor (AAGR 4.25%) was slightly higher than that of the non-poor (AAGR 3.91%).
Table 8: Average Consumption of Electricity of Poor and Non-Poor Households
2002 91.05 197 408.81 1167 2003 88.64 196 412.03 1097 2004 89.79 214 411.71 1268 2005 88.88 223 409.51 1313
(Source: The figures in the table are calculated from MEA: http://www.mea.or.th/internet/Elecvalue/tarifftype1.htm accessed 20/10/2006)
The use of electricity for productive activities- During the survey, many of the interviewed
households reported generating income with energy. The main activities quoted were workshops with electrical appliances, refrigerator and icebox for small stores and food stalls. Figure 9 shows that the urban poor use energy to generate income (both the surveys of 2007 and 2012) through small- scale enterprises. However, the amount spent to power the different productive activities could not be assessed. Some also reported that they rented rooms in their house and charged for the electricity consumed by the tenant, and this was seen as an additional source of income. For example, one of the surveyed HHs in 2012 charged Baht 20/unit to its tenant, which is almost ten times higher than the tariff set by MEA.
40% 30% 20% 10%
0%
32.0% 35.0%
HHs using energy for income
generation
2007
2012
Some households reported having a small restaurant inside their house and therefore used LPG, electricity (to cook rice; refrigerator for ice) and charcoal (to grill meat and fish) to generate income. Another useful income generating activity used by few households in the surveyed area (Field survey, 2012) was renting of washing machine for community use. The household reportedly made a profit of around Baht 2000/month by renting washing machine in the slum community. It is also likely that in many of the surveyed households some household members use energy for informal income generating activities which are not the main source of income of the household.
Lifestyle of the urban poor. Family size in a slum household is on average bigger than in a
households located in a non-slum area. There are therefore more people staying all day at home (elderly, children) and therefore some appliances (e.g. TV, fans) are likely to be used for longer hours in slum households than in non-slum areas of the city - thereby consuming more electricity.
Figure 9: Use of energy for income generation (Source: Field surveys)
22
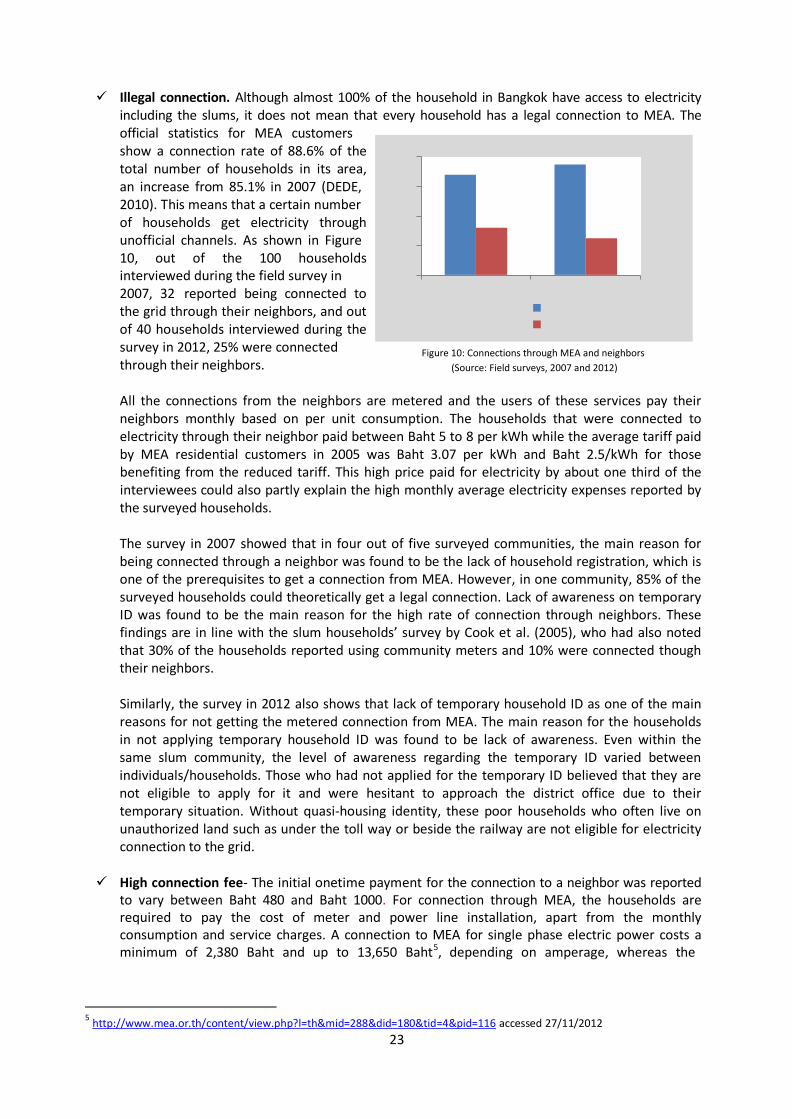
Illegal connection. Although almost 100% of the household in Bangkok have access to electricity including the slums, it does not mean that every household has a legal connection to MEA. The official statistics for MEA customers show a connection rate of 88.6% of the total number of households in its area, an increase from 85.1% in 2007 (DEDE, 2010). This means that a certain number
80% 60%
68.0%
75.0%
of households get electricity through unofficial channels. As shown in Figure 10, out of the 100 households interviewed during the field survey in 2007, 32 reported being connected to the grid through their neighbors, and out of 40 households interviewed during the survey in 2012, 25% were connected
40% 20% 0%
32.0% 25.0%
2007 2012
MEA connections Neighbor connections
through their neighbors.
All the connections from the neighbors are metered and the users of these services pay their neighbors monthly based on per unit consumption. The households that were connected to electricity through their neighbor paid between Baht 5 to 8 per kWh while the average tariff paid by MEA residential customers in 2005 was Baht 3.07 per kWh and Baht 2.5/kWh for those benefiting from the reduced tariff. This high price paid for electricity by about one third of the interviewees could also partly explain the high monthly average electricity expenses reported by the surveyed households.
The survey in 2007 showed that in four out of five surveyed communities, the main reason for being connected through a neighbor was found to be the lack of household registration, which is one of the prerequisites to get a connection from MEA. However, in one community, 85% of the surveyed households could theoretically get a legal connection. Lack of awareness on temporary ID was found to be the main reason for the high rate of connection through neighbors. These findings are in line with the slum households’ survey by Cook et al. (2005), who had also noted that 30% of the households reported using community meters and 10% were connected though their neighbors.
Similarly, the survey in 2012 also shows that lack of temporary household ID as one of the main reasons for not getting the metered connection from MEA. The main reason for the households in not applying temporary household ID was found to be lack of awareness. Even within the same slum community, the level of awareness regarding the temporary ID varied between individuals/households. Those who had not applied for the temporary ID believed that they are not eligible to apply for it and were hesitant to approach the district office due to their temporary situation. Without quasi-housing identity, these poor households who often live on unauthorized land such as under the toll way or beside the railway are not eligible for electricity connection to the grid.
High connection fee- The initial onetime payment for the connection to a neighbor was reported
to vary between Baht 480 and Baht 1000. For connection through MEA, the households are required to pay the cost of meter and power line installation, apart from the monthly consumption and service charges. A connection to MEA for single phase electric power costs a minimum of 2,380 Baht and up to 13,650 Baht5, depending on amperage, whereas the
5 http://www.mea.or.th/content/view.php?l=th&mid=288&did=180&tid=4&pid=116 accessed 27/11/2012
Figure 10: Connections through MEA and neighbors (Source: Field surveys, 2007 and 2012)
23

households getting electricity connections through their neighbors required paying either minimum or no upfront cost and they were charged only for their consumption. This explains the reluctance of some households to register for a local connection with MEA.
The use of inefficient electric appliances and light bulbs. A study by Ministry of Energy indicates
that household switching to energy efficient appliances has greater electricity saving potential. For example, replacing incandescent lamps with CFL can save about 80% energy and replacing 10-watt magnetic ballasts with 1-watt electronic ballasts can save about 90% energy (MoE, 2011). However, since appliances with energy efficient labeling, use advanced technologies to reduce the amount of energy consumed6, it is usually more expensive than the conventional ones and it is likely that the poor households are unable to afford it. Data of NSO supports this assumption by showing the relatively high percentage of fluorescent light bulbs used in households in Greater Bangkok (97.5%) in comparison to the lower percentage of more efficient lamp like CFL which were used in 26.2% of households in 2010. Similarly, the survey of 2012 (UPEA III) in the slum areas revealed that the even though there is a fair amount of awareness regarding the use of electric efficient appliance (especially the CFL bulbs), the households were reluctant to resort to it as they believed they would need to change the entire wiring and connections system to change from fluorescent light bulbs to CFLs.
ii. LPG for cooking
Affordability
The wholesale price of LPG is fixed by the government but the retail price is deregulated. However, the profit margin is controlled by Department of Internal Trade. Since May 2004, the wholesale price of LPG has been fixed at Baht 12.4569/kg. Although the average retail price in 2007 is Baht 15.81 per kg, the retail price varies with the quantity sold and the profit margin of the retailers from Baht 16.8/kg for large cylinders (15 kg), with higher prices (up to Baht 25-26/kg) for small cylinders (4kg) (EPPO, 2007). The survey in the slum areas revealed that the poor households preferred having small cylinders (4 kg) as it would fit easily in their small rooms and also would also be cheaper to purchase. This however, puts the poorest households at a disadvantage, because they cannot afford to buy LPG in a standard (15 kg) cylinder and eventually end up paying substantially higher price (unit price) than the average retail price of LPG.
Supply reliability The surveys reveal that in general LPG is readily available and the supply is reliable. Figure 11 shows the perception of the urban poor on the reliability of LPG supply, which is quite high in both 2007 and 2012. All the households surveyed in 2012 informed that the supply of LPG was reliable. The LPG cylinders were readily available from LPG outlets nearby the community and the cylinders were delivered by the shops to individual/household doorsteps.
6 http://energystar.supportportal.com/ics/support/splash.asp accessed 28/11/2012
Figure 11: Perception on reliability of LPG supply (Source: Field surveys, 2007 and 2012)
24
In conclusion, government published statistics and field surveys clearly show that the availability of modern energy access to the urban poor specifically who live in slum areas in Greater Bangkok, Thailand is not currently the main issue due to the high level of electrification and LPG distribution. The next chapter describes the initiatives undertaken and contributed to the success in high level of energy access to slum households in Thailand.
25
3. Energy plan for the urban poor
This section assesses the key plans, policies and programs that have major influence in the provision of energy access to the urban poor. Since the plans, policies and programs for urban poor are intrinsically linked to country’s development strategy, the following sections categorize the plans, policies and programs into development related policies; poverty related policies, and energy related policies
3.1 National Development Plans, Policies and Programs
As stated in the earlier sections, households have high access to electricity in Thailand and this was also found to be the case for the urban poor in Bangkok. Some of the major policies and programs that have contributed to the high electricity access are discussed below:
3.1.1 The National Economic and Social Development Plans
The periodic National Economic and Social Development Plans (NESDPs) of Thailand has been the cornerstone of national social and economic development. The country started its planned development under fiver year national plans starting from its first plan in the year 1961. In the past 50 years, Thailand has completed 10 five year NESDPs and currently the 11th NESDP (2012-2016) is under way. Although not specifically directed only at the urban energy issue, these plans have been an overall strategic plan for the development direction leading to strengthening of its social and economic sectors in order to lift the quality of life of the citizens.
National development during the First and Second Plan periods (1961-1966, and 1967-1971) focused on the acceleration of economic growth through the diversification of investment in infrastructure projects, including road, electricity, and water supply networks. Urban poverty was not much an issue as the country was still developing and urban areas were growing. Due to the rapid expansion of Bangkok Metropolitan Area and lack of legal enforcement of land use, the problems associated with slums and squatter settlements were slowly realized during the third and fourth NESDPs (1972- 1976, 1977-1981). Even though initiatives of building housing for low income families were existent, no specific plans and programmes were aimed at upgrading the slum areas. For example, the fifth NESDP (1982-1986) developed plans for ‘slum improvement’ involving clearing of slums and run down areas and providing low income people with government housing (6th NSEDP, 1987). However the low-income housing was still in short supply and subletting and reselling had resulted in middle- income people moving into low-income housing; and the service had not reached the intended target group (6th NESDP, 1987). The sixth NESDP (1987-1991) for the first time developed plans and programmes for constructing housing for low income groups and upgrading slums especially by providing water supply, electricity, sanitation, etc., and by finding a solution to the property rights, supporting community development organizations and promoting private sector cooperation. Similar initiatives were undertaken in the seventh NESDP (1992-1996) and rigorous housing development programmes for the low income families were undertaken. For example, the government had a target to upgrade 80,000 households in urban slums (73,000 households in the Bangkok and vicinity towns) and set up an efficient community management system (7th NESDP, 1992). The initiatives for addressing the problems of over-crowed and low income communities in the urban areas to improve their quality of life have continued in every NESDP´s. More recently, the need to support the urban poor to have greater economic opportunities to enable them to have job security with regular income and promotion of small-scale employment and short term skill training and development have been acknowledged, and subsequently targeted programmes have been developed.
26
The NESDPs have played an equally important role in addressing and managing energy production, consumption, distribution, and pricing. Throughout the duration of plans, energy prices, energy consumption and substitution have been adjusted timely to the world energy situation and based on the national income. The energy pricing policies for all forms of energy were restructured to cover the true cost and subsidies were devised to help the poor and vulnerable groups. Similarly, plans and programs to induce efficient use of electricity and conservation were formulated. All these measures have directly affected the access and affordability of energy services to the entire population, including the urban poor.
In short, the NESDPs have been crucial in addressing the problems of low income families in the urban areas and have played a greater role in upgrading their wellbeing and quality of life. Provision of accessible, reliable and affordable energy (particularly electricity) to the urban poor has been one of the major spin-offs of these national development plans.
3.1.2 Electrification programmes of the Thai government
Electrification has received high priority in the government’s development strategy in Thailand. To extend electrification in different parts of the country, in the early 1970s, the Thai government had planned to provide electricity to every village within a period of 25 years to improve the quality of life of rural areas (Chullakesa, 1991, as cited in Green, 2005). The government reduced the time- frame for electrification to 15 years in 1975. Importantly, the high priority of electrification program was driven by national development goals. To fulfill the aim of being the industrial country during 1961-1971 and the export-manufacturing center of the region during 1984-1997, a large amount of development budget was dedicated to energy sector during such period (Webster and Theeratham, 2004). As a result of the accelerated electrification program, household access to electricity supply increased to 97 % by 2000 (Shrestha et al., 2004). Factors behind Thailand’s high electrification level include the following:
Sustained high economic growth. The Thai economy grew at the average annual rate of 6 % during 1976-1986 and by 8.7 % per annum thereafter during 1986-1997. The sustained high economic growth increased not only the purchasing power of both urban and rural households but also the commercial and industrial consumer base, which provided resources to subsidize the residential consumers.
Adequate electricity generation capacity. Unlike in many developing countries, the generating
capacity was not a barrier to expand electricity access to both rural and urban households in Thailand. The Electricity Generating Authority of Thailand (EGAT), which was almost solely responsible for generation and transmission of electricity in Thailand till the early 1990s, was able to expand the generation capacity to meet the projected demand. Following electricity sector reform in 1992, the country opened up its power generation industry to private investment, which led to significant investment by independent power producers (IPPs), small power producers (SPPs) and very small power producers (VSPPs). Currently, IPPs and SPPs accounted for over 45 % of total generating capacity in 2011.
Electricity subsidy. Electricity tariff for small residential consumers is subsidized, making
electricity more affordable to the poor households. Cost recovery by utilities. Overall, the financial viability of the organizations involved in
electricity supply in Thailand has been maintained. Subsidy involved in electricity supply to residential users is generated through higher tariffs for the industrial and commercial consumers.
27
3.2 Poverty related plans, policies and programmes
3.2.1 Poverty alleviation strategies
Several decades of extensive rural and urban development programmes undertaken by various government and non-government agencies have resulted in overall achievement in reducing poverty, improving nutrition, and meeting basic human needs of the entire population (NESDB and UNRC, 2004). It has also already achieved its Millennium Development Goal 1, which is to halve, between 1990 and 2015, the proportion of people living in extreme poverty as poverty incidence reduced from 27.2% in 1990 to 9.8% in 2002 (NESDB and UNRC, 2004). The poverty alleviation policy was explicitly included for the first time in the fifth NESDP and following that poverty issues have been incorporated in the policy to enhance the quality of life (Suksiriserekul, 2000).
Several projects and schemes under the poverty reduction strategy of the government (particularly during 1997-1999) were instrumental in responding to the basic need of the poor and improving their living conditions (Suksiriserekul, 2000). Programmes such as Social Sector Program Loans (SSPL), for example, a loan from ADB totaling US$500 million and Social Investment Project (SIP), a loan from international institutions totaling US$450 million were administered to strengthen the poor communities by covering wide range of activities such as job creation, social welfare, education and health improvement. These programmes also played important roles in the issues related to squatter settlement and on proposing appropriate measures and responses.
3.2.2 Housing plans and programmes for low income households
Decent shelter is fundamental to physical and psychological well-being and the socio-economic stability of the communities and lack of housing options for the growing urban population is the major cause of increasing numbers of informal settlements in the burgeoning slums in many urban areas (IHC, 2009). The Thai government has been implementing several programs for slum upgrading, e.g., re-blocking (re-design), reconstruction, land-sharing and relocation in slum areas (Guerra and Guerra, 2004). Similarly, the government has encouraged private investors to provide low-cost housing for the targeted dwellers currently living in some squatter settlement on land owned by temples or by the Crown Property Bureau (Guerra and Guerra, 2004). The policies for low- cost housing and infrastructure development in slums make access to electricity and other modern forms of energy easier. For housings built under this program, an electricity connection comes in the package of the housing before the houses are handed over (Guerra and Guerra, 2004). This means that people who buy these houses do not need to make separate arrangements for an electricity connection. This again contributes to easy access to electricity by the slum-dwellers.
From the support of development organizations such as Urban Community Development Office (UCDO7) and then the Community Organizations Development Institute (CODI8), several community networks9 were set up to work with local authorities in development planning and on shared problems of housing, livelihoods and access to basic services. For example, UCDO worked with various community networks to administer integrated loans which could be used for housing, income generation or revolving funds (Boonyabancha, 2003). The various kinds of loans were:
7 UCDO was set up by the government of Thailand in 1992 to address urban poverty and was located within the National Housing Authority. 8 In 2000, UCDO merged with a Rural Development Fund to become a new public organization called the CODI which continues to support the UCDO programmes but it has its own legal entity as a public organization. 9 One example of community network in poor regions is the Khon Kaen Community Network which is mostly made up of groups who live in squatter settlements and who make their living recycling rubbish in this north-eastern city. The network has built a recycling centre to allow fair prices for recyclers and has put in place a community welfare programme. Its membership includes 21 groups and over 1,200 households (Boonyabancha, 2003).
28

i. Revolving funds: used as a revolving fund for a saving group;
ii. Income generation loan: used for individual or group business investment; iii. Housing project loan: used fo r a community with immediate problems purchasing land and
constructing housing iv. Housing non-project loan: used for repair and extension of houses and utilities
Box 1: The Secure Housing Project (Baan Mankong Programme)
In January 2003, the Thai government announced two new programmes for the urban poor that sought to reach 1 million low-income households. The first is the Baan Mankong (“secure housing”) programme, which channels government funds in the form of development subsidies and housing loans to upgrade existing urban poor communities, directly to urban poor organizations who plan and carry out improvements to their land, housing, environment and basic services with the help of community development organizations such as CODI (Boonyabancha, 2005). The second was Baan Ua Arthorn programme, in which the National Housing Authority (NHA) designs, constructs and sells ready-to-occupy flats and houses built by contractors at subsidized rates to low-income households.
To explore new approaches, ten Baan Mankong pilot projects were supported initially in 2003 and some of those pilot projects (in Bangkok region) include:
Land purchase and re-blocking (pilot project in Charoenchai Nimitmai of Bangkok bound by railway tract and drainage canals
Post-fire reconstruction and a long-term lease (in Bon Kai squatter community living on land owned by the Crown Property Bureau in Klong Toey in central Bangkok)
Relocation to nearby land (Klong Toey Block 7–12 squatter settlement on land belonging to the Port Authority of Thailand)
Scaling up pilot projects (in the Ramkhamhaeng area of Bangkok in squatter communities in Crown Property Bureau land)
Land sharing (in the canal-side community of Klong Lumnoon in suburbs of Bangkok)
(Source: Boonyabancha, 2005)
Community networks have now been accepted as an important development mechanism by most formal development agencies in the country. More than 1,000 million Baht has been provided as various kinds of loans and more than half of the loans have already been fully repaid and the community savings now total more than 500 million Baht (Boonyabancha, 2003). These community- owned savings are being used as rapid release revolving funds circulating among community members. These community led programmes have been effective in developing community welfare programmes, and also including access and affordability to basic services like energy. Box 1 gives an example of a successful housing project developed for the urban poor communities.
29

3.2.3 Housing registration policy
Thailand introduced compulsory household registration in 1956. A household registration (document) is a prerequisite for obtaining a connection to the electricity distribution utility (MEA in Bangkok metropolis, Nonthaburi and Samut Prakan, and PEA elsewhere). This means that households without an official registration are not able to apply for a legal electricity connection with the distribution utility. Providing public services, including electricity, to urban poor households that do not have a legal household identification had been a problem and such households have had to make illegal connections to the lines serving their legally resident neighbors, often paying those neighbors more than the electricity would cost if they had a service of their own (ADB, 2005).
In order to better integrate people living in Thailand without an official household registration, the Thai government began to issue temporary registration numbers or “quasi-household IDs” around 1995 (Cook et al., 2005). This policy was one of the outcomes of a campaign for better recognition of and living conditions for the urban poor, and started in 1987. These quasi-household registrations allow their owners to apply for a legal electricity connection with the relevant utility, besides other benefits.
However, in terms of electricity connection, the monetary deposit required for the electric meter is higher for a temporarily registered household than for a fully registered household10.
3.3 Energy related plans, policies and programs
3.3.1 Electricity pricing policies
Electricity tariff in Thailand has greatly helped to increase the poor’s ability to afford, and hence their access to, electricity. Energy pricing policies for helping the poor have been constantly developed to minimize the number of non-poor who gain benefit from the policies. There are two different kinds of electricity tariffs for residential users: (1) tariff for households connected to 220 V supply with a watt-hour meter of 5 ampere and with monthly electricity consumption up to 150 kWh; and (2) tariff for households with monthly electricity consumption exceeding 150 kWh.
Table 9 presents the MEA tariff for residential customers. The monthly service charge for users consuming not more than 150 kWh per month is Baht 8.19, which is significantly lower than that for households with monthly electricity consumption exceeding 150 kWh (which is Baht 38.22 under recent tariff structure). Not only is the fixed monthly service charge less, but the charge per unit of electricity is also significantly less for a household having monthly consumption not exceeding 150 kWh. Furthermore, the residential electricity tariff, especially the reduced tariff, is progressive and increases with the quantity of electricity consumed. Thus, consumers who consume less than 150 kWh per month receive special benefit from this pricing policy. It should be noted, however, that if the electricity consumption of the consumers under the reduced tariff exceeds 150 kWh per month for 3 consecutive months, they will be charged under the standard tariff (i.e., the tariff for the consumer category whose consumption exceeds 150 kWh/ month) thereafter. If, however, the monthly consumption of such consumers falls below 150 kWh for 3 consecutive months subsequently, they will be reclassified under the reduced tariff.
10 Personal communication with Khun Panthip, Senior Officer, CODI (February 21, 2007) as cited in (Martin et al., 2007). 30

Table 9: MEA electricity tariff for residential customers11
Currently, pricing policy has been revised by exempting charges on power usage to small-sized residences installed with 5-ampere meters and using less than 90 units per month. The normal tariff with consumption not exceeding 150 unit/month continually for 3 month with installed electricity measure not exceeding 5(15) ampere and the electricity consumption not over 90 unit/month will have free electricity. However, according to the Energy Policy and Planning Office Cabinet decision12 on November 30, 2011, the government has decided to lower the threshold of those entitled to free electricity support from 90 units per month to 50 units per month (effective in first quarter of 2012). As there are non-poor who benefit from the existing pricing policy, this new scheme is expected to help only the poor who use only necessary electric appliances including three light bulbs, TV, electric fan, and rice cookers.
3.3.2 Energy efficiency programme for residential sectors
Thailand has developed several measures and incentives for the household sector to reduce electricity consumption during peak period and to encourage energy conservation and efficiency in the household (AERPC, 2010). The measures include:
i. Setting minimum Energy Performance Standards (MEPS) for equipment; ii. High Energy Performance Standards (HEPS) for equipment (for e.g. for air conditioners,
refrigerators, ballasts, fluorescent lamps and compact fluorescent lamps; iii. Energy labeling program for appliances and house; iv. Promotion of energy efficiency in home design, and; v. Public awareness campaigns.
Box 2 gives an example for energy efficiency campaign for promoting energy efficient appliances. Although these energy efficiency measures include provisions for residential sector, they are not particularly aimed at low-income households.
11 Pers. com (representative from MEA, 2012) and http://www.mea.or.th/internet/Elecvalue/doc/ELECTRICRATE4854.pdf accessed 10/01/ 2012 12 http://www.eppo.go.th/nepc/kpc/kpc-139.htm accessed 22/01/2012
31

Box 2: Programme promoting energy efficient appliance Thailand Promotion of Electricity Energy Efficiency (TPEEE), during 1993-2000, was a showcase of effective energy efficiency labeling campaign that gained high public recognition and influenced customers’ behavior of purchasing appliances and equipment. TPEEE project consisted of a number of components and activities including the promotion of energy efficient appliances, the provision of energy audit to non-residential buildings, and capacity building for energy efficiency and energy conservation. One of the well-known activities was the promotion of label 5 appliances. Co-financed by several international organizations, TPEEE as a demand-side management plan was implemented by the Electricity Generating Authority of Thailand (EGAT) which continues to promote label 5 programs and awareness raising campaigns after TPEEE project terminated in 2000. It is estimated that 17.0-23.5 terawatt-hours were saved and 12.6-17.4 MtCO2eg were reduced during 1993-2004 under TPEEE. However, EGAT energy efficiency campaigns had targeted residential sector, and not specifically the poor households. Source: The World Bank, 2006
However, under cooperation between the NHA and Department Alternative Energy Development and Efficiency (DEDE), energy efficiency program for low income housing was initiated in 2004. Aiming to improve energy efficiency of public housing, Baan Ua-Arthorn, built by the NHA, the program was implemented in selected public housing as a pilot project. Measures were recommended for two types of public housing: detached houses and multi-storey residential buildings and included measures with architectural changes and measures with the improvement of energy efficiency appliances. Only some measures were selected for implementation in a pilot project. For example, the installation of roof insulation and the replacement of inefficient lamps in detached houses. The reduction of electricity consumption and an increase in energy affordability were expected for low income households undertaking building retrofit.
3.3.3 LPG pricing policies
LPG is the most popular fuel for cooking in urban areas of Thailand for the poor and the non- poor. A major reason for the high access to LPG of the households is believed to be the significant level of subsidy, which has greatly enhanced the poor’s ability to afford the fuel. The government has fixed the wholesale price of LPG; however, the retail price is controlled and set by the Department of Internal Trade, Ministry of Commerce. The retail price varies with the quantity sold and the profit margin of the retailers. The LPG price has been subsidized in Thailand for decades, which amounted to more than US $500 million in the first seven months of 2011 itself (Kojima, 2011). The Oil Stabilization Fund has historically been used to subsidize LPG which leaves the ex- refinery prices to be a fraction of world price of world price. LPG price has been frozen at 18.13 Bhat per kg since 2008, and although the price of LPG for transportation and industry sectors have been deregulated, the price of LPG for residential sector will remain same at least until 2012 and will increase only by Baht 2/kg in the end of 2012(Kojima, 2011). This very small increase in the amount of retail price reflects the government’s intention to minimize the financial burden of general households.
32

3.4 Major findings of analysis of plans/policies
The analysis of major plans and policies related to energy access and urban poverty in Thailand reveals the following:
i. Energy access improvements as a spin-off of poverty alleviation. Most of the issues of the poor
communities are intrinsically related to poverty, and programs on poverty alleviation can not only directly help in the expansion of basic needs coverage (e.g. access to affordable housing, provision of infrastructure and services) of the poor communities, but also provide intangible benefits to the poor (e.g. income generating capacity) which can enhance the quality of life of the poor communities.
ii. Critical link between urban development programmes and urban poverty. Considering that a
huge proportion of poor people live in the urban areas, the plans, policies and programmes on urban development strategy of the government usually have a component on urban poverty that has direct impact on improving the livelihood of the poor people in the urban areas.
iii. Slum upgrading programmes have crucial role to play in enhancement of living standards. The
earlier policies (before 1980s) of the Thai government on the issues of slum communities were based on the concept that the slums and squatter settlements have to be evicted out of the city. However, in recent years, the government policy on the slum communities were focused more on upgrading slum and squatter settlements within the city through options such as securing tenure rights, and expansion of services and infrastructure. For e.g., in the low income housing units developed by the NHA, electricity comes in package with the houses, ensuring its reliability and affordability to the low income people.
iv. Community organizations and community networks are key to implement effective policies.
Supply of basic services including affordable and reliable energy to the urban poor cannot be achieved effectively only by government’s effort. Community organizations (e.g. savings cooperatives set up by slum communities) play a major role in uniting poor people to improve their own settlements As an individual, a poor person in a slum is not capable to address his/her issue. As a group, they are empowered to address the issue at the community level and act as a bridge of communication between the poor and government authorities. Similarly, the importance of community organization networks cannot be overlooked as networks can help to address the issue of the poor more effectively in a collective way.
v. A funding mechanism targeted for urban poor is imperative for their development . Any
programme for development of urban poor cannot be achieved only by broad development goals and subsequent allocation of budget. It is important that a targeted funding mechanism (e.g. Social Sector Program Loan, SSLP and Social Investment Project, SIP) be set up that can assist the urban poor by lending money, generating income, secure housing and by expanding and extending infrastructure and services.
vi. Housing security13 is essential for reliable energy access. The main reason for lack of access and
reliability of energy services to the poor people have been due to their temporary and illegal nature of settlement. Due to lack of housing IDs (which is essential to apply for energy services) many households in the slum areas have not been able to access and rely on energy facilities. Providing tenure rights and affordable housing can easily address the energy access issues.
13 Housing security is among the ten standards for the quality of life of Thai people endorsed by the cabinet 2003 (NESDB, 2004)
33

vii. Addressing energy efficiency to low income households to be both reactive and proactive. The reason for addressing energy efficiency is to reduce consumption and ultimately reduce energy expenses. But there is general feeling that addressing energy efficiency to poor settlements is not necessary as their consumption is already low and the cost is subsidized. Therefore, the initiatives on addressing energy efficiency in poor households were found to be mainly reactive approach like conversion of fluorescent bulbs to energy efficient CFLs. However, this may not be enough, and policies and plans on energy efficiency to low income households should also be proactive, particularly while developing and designing the low income housing in aspects such as orientation of the house, use of appropriate building materials and use of natural light.
viii. Diversity within the urban poor not considered. Urban planning usually considers slum and
squatter communities as a whole without effectively probing the differences in the nature and conditions of the communities and its people. For example, within the same slum settlements the income status and awareness level of the households differ and consequently their access to services also differ. There is lack of plans and programmes with explicit focus on urban poor taking into account the diverse characteristics and livelihood of the people in different areas.
ix. Energy access to urban poor not recognized as a target. Although broad development goals
related to urban planning and poverty alleviation have been successful in addressing the energy access in the poor communities; there is lack of targeted actions and policies for energy access in the urban poor area. Provision of energy access in the urban poor areas cannot only be a byproduct of broad poverty alleviation and developmental goals as there could be problems of mis-matched allocation of resources and priorities. Since urban poverty is likely to increase with time, and access to modern and reliable energy is basic service essential for social and economic development of the poor, it is important that a targeted plans and actions related to energy access in these areas be given priority.
34
4. Barriers to Energy Access
Barriers are any status, circumstances, mechanisms or initiatives that impede or delay the supply and demand of energy services to the people. Demand side barriers for this study, are the barriers faced by agencies associated with the provision of energy supply to the urban poor, while supply side barriers are those faced by urban poor consumers to have access to electricity and LPG.
4.1 Supply Side Barriers
4.1.1 Introduction and Methodology
In order to understand the barriers faced by suppliers for promoting access of energy to the urban poor, a consultative meeting with key stakeholders representing the agencies associated with provision of energy service was held on October 2011 at Bangkok. Besides, structured interviews were conducted with selected agencies using questionnaire during January-February 2012.
i. Electricity supply in Greater Bangkok
The two main suppliers of electric power in Thailand to the consumers are the Provincial Electricity Authority (PEA) and the Metropolitan Electricity Authority (MEA). MEA is responsible for supplying electricity to Greater Bangkok, while PEA supplies to the remaining parts of the country. The present study is based on provisions of MEA as the study area is Bangkok.
MEA is the state owned enterprise under Ministry of Interior established on 1958 under Metropolitan Electricity Authority Act responsible for supplying the electric energy to people living in Bangkok Metropolis, Nonthaburi, and Samut Prakan provinces (Greater Bangkok region). At present MEA acquires and supply electric energy and carry out business related to electric energy in the Greater Bangkok region covering distribution area of 3,191.6 sq. kms (MEA annual report, 2010).
ii. Gas supply (LPG) in Greater Bangkok
The gas industry in Thailand is dominant by the Petroleum Authority of Thailand (PTT) which acts as the major purchaser, transporter and distributor of natural gas in Thailand (Nikomborirak, 2011). LPG (propane) is mainly used for cooking, and the present study focuses on LPG which is available in different sized cylinders. LPG is distributed under various brands (Siam gas, Unique gas, Picnic gas, PTT etc.), and in different sizes which can be bought from local retailers and agents.
The gas industry in Thailand is governed by two major laws: the Petroleum Act 1971 (regulated by Energy Policy and Planning Office) which stipulates rules concerning the extraction and production of natural gas and the Energy Industry Act 2007 (regulated by Energy Regulatory Commission) that prescribes rules on the transmission of natural gas, compression of gas into liquid form, distribution of gas and wholesale and retail sale of gas (Nikomborirak, 2011).
4.1.2 Observations from the supply agencies
Based on the consultations with the energy service providers related to electricity and LPG, Table 10 has been prepared that summarizes the findings in terms of key functions, coverage, procedural aspects, issues of the urban poor, etc that were based on the structured interviews.
35

Table 10: Key findings from the interviews with energy supply agencies
Description Electricity Supply Agency LPG Supply Agency
Key functions To support new demand growth and reinforce the power system reliability; construction/expansion/improvement of electrical power; to conduct electricity business in pursuit of sustainability and to adhere a commitment to the responsibility for the society and the environment
To supply LPG to the customers through new connection and refilling existing cylinders; to provide delivery services; and to impart knowledge on usage and safety of LPG
Service coverage/ Customer categories
MEA divides the customers into following 7 categories i. Residential ii. Small general service iii. Medium general service iv. Large general service v. Special business vi. Government institution and non-
profit organization vii. Public light
The customers are usually divided into groups such as: i. Cooking cus tomers- LP G used fo r
cooking in household, restaurant, stores etc.
ii. Autogas customers- LPG used in autogas stations for selling it to transportation use like taxi, tuk-tuk etc.
iii. Industrial customers- LPG used in factories for manufacturing purposes
Procedure for new connection
Getting a new electricity connection requires submitting application form with required documents followed by internal wiring and safety inspection by MEA and finally settling meter and sanctioning of electricity
A customer can walk into LPG supplier (outlet shops, grocery stores, distributors) and purchase a cylinder of required size. A deposit is required for the first time purchaser of the cylinder.
Documents required
Personal identification; house registration/certificate of house no. or a permit of house construction; house registration of the applicant In the slum communities which have been upgraded (e.g. in cooperation with CODI, NHA and local co-operatives), a letter from cooperative involved in the upgrading of the area, is also required to obtain a new electricity connection
No documents required
Criteria for sanctioning a new connection
In case of urban area like Bangkok, the household registration number (permanent or temporary) act as a deciding factor in sanctioning a new connection. The electricity utilities are not allowed to provide new connection to illegal settlements (e.g. near railway track, nearby canals) where urban poor normally reside. However availability of at least a ‘Temporary household registration no’ guarantees the utilities some sort of legality or permanency of the slum location in order to provide the electricity services.
Nothing except the affordability of the customers to pay the required amount.
36

Connection for poor households
The policy that let the electricity utilities to provide new connection to customers even on the basis of temporary household registration number (in absence of permanent household registration no) was a major step to ensure accessibility of electricity to poor communities.
No specific procedures for connection to poor households exist except that few brands of cylinders (particularly the small ones) come with a small metal stove attached on the top, making it easier for people having less space to cook.
Barriers faced in providing connection to urban poor, especially those residing in illegal housing colonies
i. Lack of required document i.e. permanent/temporary housing household registration no
ii. Location of slum as many slum
communities are illegally settled in informal locations and for utility company (which is a State Owned Enterprise), and so supporting them is like promoting illegal activity
i. Physical/congested n a t u r e o f s l u m settlements that can cause safety concern on supplying LPG
ii. Preferred taste of food cooked in
charcoal than in gas- sometimes the taste of people who prefer food cooked in charcoal more than that cooked in LPG, can impede the maximum use of LPG
Monitoring mechanisms for energy connection to poor households
Bills are generated monthly, based on meter reading and the payment can be made online or in banks, post office or local convenient stores
Prepaid
Specific targets for urban poor
The supply agency (PEA) and CODI had signed an MOU in which PEA agreed to shoulder the cost of network installation to connect upgraded slums to the power grid. But these options are available in only those slums that have been upgraded. There are many other poor urban areas where no any programmes specifically targeted at poor people exist.
Not any
Subsidy to the urban poor households
The cost of electricity is subsidized to certain minimal consumption which also applies to the urban poor. The electricity pricing is pro-poor as there is provision for free electricity to household consuming less than 90 units and there is sliding tariff where prices increases with increased consumption However, according to the recent cabinet decision (November 30, 2011) the provision of free electricity to consumption less than 90 units will be decreased to 50 units in the near future (first quarter of 2012)
LPG to the residential sector is already highly subsidized by the government which also applies to the urban poor. However t h e r e i s n o s u b s i d y f o r t h e upfront cost of the LPG which can be expensive to some poor households.
4.1.3 Electricity supply barrier
Though there is a high level of energy access electricity in urban and peri-urban areas of Thailand, the issue in urban areas is more towards improving energy efficiency. The barriers to be addressed are as follows:
37

i. Institutional Barriers
There is no specific institution responsible for energy issues (including energy efficiency) for the urban poor. Local or city authorities in Thailand do not have any specific departments or divisions looking at energy policies. For example, the local authority of Bangkok, the BMA has a Department of Environment which is involved in urban environmental management of the city, including energy issues. This department has three divisions dealing with waste management, air and noise quality, and public parks, and there is no specific division for dealing with energy management.
There appears to be lack of collaboration among agencies related to providing energy services or to improving energy efficiency in the poor households. NHA and CODI are the two main organizations related to housing of the poor. However, they lack technical knowledge, availability of technologies, and financial resources to help low income households more energy efficient. This could be carried out by collaboration of organizations under the Ministry of Energy, like EPPO and DEDE, and financial institutions to construct or retrofit houses of the urban poor at affordable price or with microfinance program.
ii. Policy barriers
Organizations that had no direct responsibility related to energy issues did not have direct energy policies targeting the urban poor. In their opinion, only those specific organizations under the Ministry of Energy should take care of the issue of energy access to the urban poor. It was also observed that there are no energy policies that specifically target urban poor, especially in relation to improving energy efficiency or cleaner energy. The initiatives for energy efficiency have been mostly reactive (e.g. changing of bulbs in more energy efficient CFLs). Proactive approaches that consider energy efficiency from the project design phase (e.g. consideration of aspects like building orientation, building materials, use of space etc.) are not much of a priority.
Home appliance energy label campaigns promoted by EPPO and Green product label campaigns promoted by Thailand Environment Institute (TEI) both target general household consumers, and not the poor households. Similarly, a review of BMA’s plans and projects during 2006-2007, when BMA put high priority to energy management, and worked in partnership with United Nations Environment Program (UNEP) and private sector on climate change, shows that BMA launched a number of activities to encourage energy conservation and the use of renewable energy as listed in Table 11. All campaigns and activities focused on BMA buildings, schools, hospital, and the public, but not the slum areas or low income households.
38

Table 11: Renewable energy and energy conservation activities of BMA during 2006-2008
(Source: BMA, 2008 and BMA, 2009)
iii. Financial barriers
The upfront cost to invest in energy efficient appliances was the most significant barrier that prevented the poor to use energy efficiently, as claimed by most participants. The Demand Side Management (DSM) efforts in Thailand were mostly focused on industry and commercial sectors.
iv. Physical barriers
Temporary condition of the poor’s houses is one of the main barriers preventing local authority such as BMA to provide the quasi housing identification. Without a household registration (not even a temporary one), the utility companies are not allowed to provide electricity services. Another important issue is the physical constraint of the poor communities which are usually very crowded with narrow walkways. This poor condition causes difficulty in the installation of the power line and the regular check of the electricity meters.
v. Perception barrier
Planning agencies perceive slum communities keep moving and do not live in an area for a long time and hence are reluctant to invest and plan in those areas for long term. Moreover, the costs for the poor are already subsidized and they enjoy free electricity those consuming less than 90 units. There probably exists a belief that addressing energy efficiency in low income household is not necessary and important than those in high and middle income households.
4.1.4 LPG supply barrier
i. High price of per unit of LPG cylinder
Although the government has regulated the ex-refinery price of LPG through subsidy, the retail price of LPG varies with brands and cylinder sizes. Smaller size cylinders are popular with urban poor, and the price per unit of small cylinder was considered as the significant barrier to them. Due to economies of scale and marketing strategy of the suppliers to promote larger cylinders, the per unit price of larger cylinders are cheaper than those of smaller ones.
39

Price: US Dollars / barrel. Price: Baht / Cylinder.
PTT. UNIQUE SIAM PICNIC. WORLD V 2 GAS. PTT. GAS. GAS. Picnic GAS. v Two Gas.
Unique Gas. Siam Gas. gas. World Gas.
Table 12: The retail LPG price in Bangkok including VAT for different brands
Tank size 4 kg 100-116. 101.63. 77.0656. 105-110. 83. 63. Tank size 7 kg 145-160. Tank size 11.5 kg 221.83. 221.8236. Tank size 13.5 kg 253. 253. Tank size 15 kg 280-290. 283.63. 273.6260. 273. 276. 236. Tank size i48 kg 882-890. 900.69. 875.8072. 875. 866. 756. Effective / Effective. Source: EPPO14
30 Jan 08. 30 Jan 08. 30 Jan 08. 30 Jan 08. 30 Jan 08. 13 Oct 10.
Table 12 presents the retail LPG prices of six brands in Bangkok since 2008.The higher price per unit of the smallest cylinder can be observed in all brands. Although the unit price of 4 kg cylinder is the highest, the cylinder price is only half that of the 15 kg cylinder, making it more affordable in the view of low income earners.
ii. Physical barrier
Physical nature of the slum areas which are generally over-crowded and located in narrow and congested areas cause safety concerns on supplying LPG. For example, a poor household could only have a small single room where a family with children could be sleeping, cooking, playing, working and eating. This lack of space and proper ventilation could cause safety hazard by the use of LPG.
iii. Lifestyle barrier
Many poor households prefer the taste of some food cooked in charcoal than in gas and are happy to use charcoal or keep it as a secondary fuel. This preference of cooking method could sometimes impede the demand and consequently the supply of LPG.
4.2 Demand Side Barriers
4.2.1 Introduction and Methodology
To assess the status of energy access in the urban poor areas of Bangkok and to identify the barriers faced by the poor households, a random survey of 100 households was conducted in 2007 (UPEA II study). More recently (in 2012), to revalidate the previous findings, a similar survey was conducted covering 40 households in the same areas (Refer Annex 2 for the sample questionnaire). The questionnaire covered aspects like income level of the household and their energy related expenditure; patterns of different energy usage, and subsequently challenges and barriers related to the pattern of energy usage. The following section provides basic status of the households where the latest survey was conducted.
14 http://www.eppo.go.th/retail_LPG_prices.html accessed 02/02/12 40

Although the average incomes of the households were approximately Baht 19,593/month, most of the households (i.e. 40%) had income range below Baht 10,000/month (Figure 12). The average household size was 5 members. Almost 45% of the HHs were medium sized consisting of 4 to 5 members, followed by 25% consisting of 25% and 15% each consisting of 6 to 7 and 8 to 10 members (Figure 13).
% HHs in different income ranges HH Sizes
22.5%
10.0%
27.5%
40.0%
Less than Baht 10,000/month Between Baht 10,000- 17,500/month Between Baht 17,500- 25,000/month More than Baht 25,000/month
15%
15%
25% 45%
1 to 3
4 to 5 6 to 7
8 to 10
4.2.2 Findings from the household survey
The findings from the survey of 40 households in 2012 in terms of their impression on energy access, energy use pattern, grievances, willingness to pay issues, etc. are presented in Table 13. The energy services considered were mainly through the provision of electricity and LPG. Participants in the policy dialogue commented on the small sample size used, but it was clarified that this survey was only to update/verify the earlier survey and results from other studies, and the results to be seen as more showing the trend.
Table 13: Key findings from the household survey of the urban poor
Characteristics Energy for lighting (electricity) Energy for cooking (LPG, charcoal)
Access to clean sources of energy
The urban poor of the Bangkok region have had access to electricity on an average for more than 10 years. The field surveys (in 2007 and 2012) confirmed that the entire households have electricity access. However, not all houses were connected through MEA as some households obtained electricity through their neighbors. - 100% of the surveyed HHs in 2007
and 2012 have access to electricity - 68% of the surveyed HHs in 2007
had access to electricity through MEA connections
- 75% of the surveyed HHs in 2012 had access to electricity through MEA connections
The major energy source used for cooking purpose in the urban poor areas is LPG. Around 87% of the households surveyed in 2012 used LPG as the primary fuel for cooking. Many households also use charcoal as a secondary fuel mainly to cook certain food items which are more suitable for charcoal use. Similarly, electricity is used mainly for cooking rice (rice cooker) and boiling water (electric kettle).
Figure 12: Income ranges of surveyed households (Source: Field survey, 2012)
Figure 13: Number of Members in HHs (Source: Field survey, 2012)
41
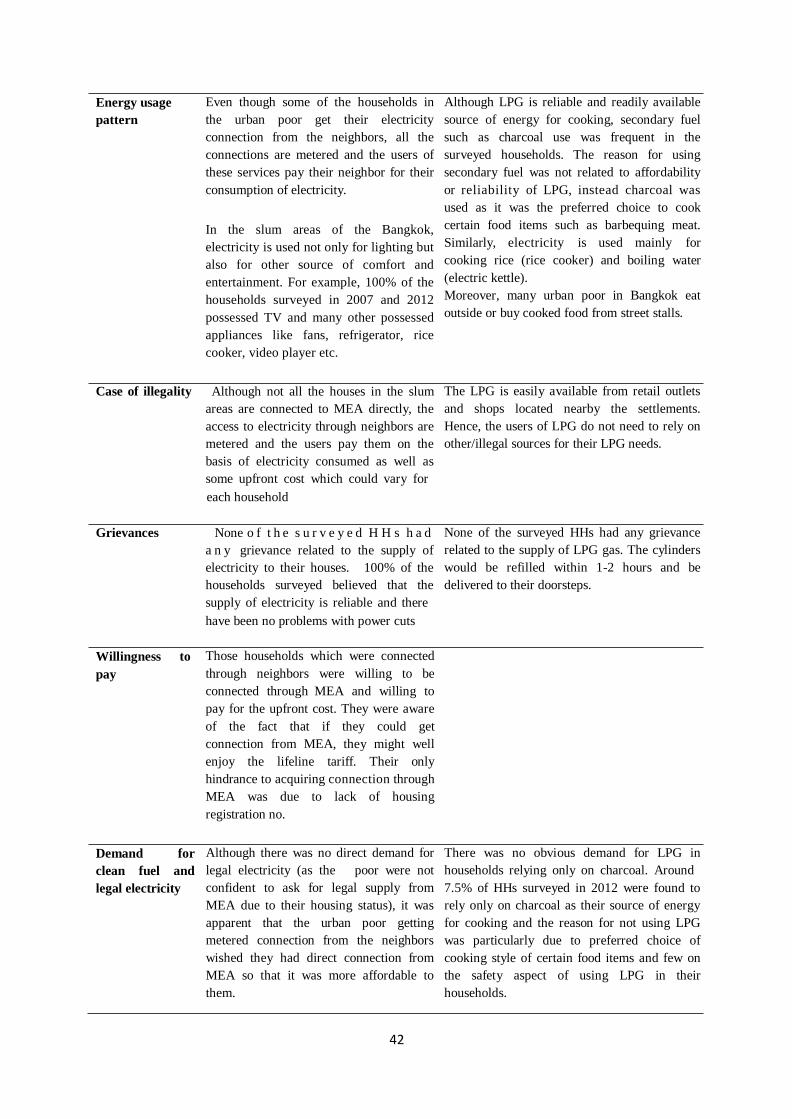
Energy usage pattern
Even though some of the households in the urban poor get their electricity connection from the neighbors, all the connections are metered and the users of these services pay their neighbor for their consumption of electricity. In the slum areas of the Bangkok, electricity is used not only for lighting but also for other source of comfort and entertainment. For example, 100% of the households surveyed in 2007 and 2012 possessed TV and many other possessed appliances like fans, refrigerator, rice cooker, video player etc.
Although LPG is reliable and readily available source of energy for cooking, secondary fuel such as charcoal use was frequent in the surveyed households. The reason for using secondary fuel was not related to affordability or reliability of LPG, instead charcoal was used as it was the preferred choice to cook certain food items such as barbequing meat. Similarly, electricity is used mainly for cooking rice (rice cooker) and boiling water (electric kettle). Moreover, many urban poor in Bangkok eat outside or buy cooked food from street stalls.
Case of illegality Although not all the houses in the slum
areas are connected to MEA directly, the access to electricity through neighbors are metered and the users pay them on the basis of electricity consumed as well as some upfront cost which could vary for each household
The LPG is easily available from retail outlets and shops located nearby the settlements. Hence, the users of LPG do not need to rely on other/illegal sources for their LPG needs.
Grievances None o f t h e s u r v e y e d H H s h a d
a n y grievance related to the supply of electricity to their houses. 100% of the households surveyed believed that the supply of electricity is reliable and there have been no problems with power cuts
None of the surveyed HHs had any grievance related to the supply of LPG gas. The cylinders would be refilled within 1-2 hours and be delivered to their doorsteps.
Willingness to pay
Those households which were connected through neighbors were willing to be connected through MEA and willing to pay for the upfront cost. They were aware of the fact that if they could get connection from MEA, they might well enjoy the lifeline tariff. Their only hindrance to acquiring connection through MEA was due to lack of housing registration no.
Demand for clean fuel and legal electricity
Although there was no direct demand for legal electricity (as the poor were not confident to ask for legal supply from MEA due to their housing status), it was apparent that the urban poor getting metered connection from the neighbors wished they had direct connection from MEA so that it was more affordable to them.
There was no obvious demand for LPG in households relying only on charcoal. Around 7.5% of HHs surveyed in 2012 were found to rely only on charcoal as their source of energy for cooking and the reason for not using LPG was particularly due to preferred choice of cooking style of certain food items and few on the safety aspect of using LPG in their households.
42

4.2.3 Key factors impacting urban poor’s access to clean energy
As described in the earlier sections, the main barrier to reliable and modern energy access to the urban poor in Greater Bangkok is the illegal status and affordability to pay for the services.
The key factors to the poor households’ high cost of electricity and LPG compared with their total household income are summarized below.
i. High electricity connection fee
The high upfront cost of electricity connection, which ranges from a fixed cost of 2380 Baht to up to 13,650 Baht depends on the amperage and distance from the electric pole, is a barrier for some of the poor families to legally connect to the grid. Evidences from the field survey show that the connection cost from the neighbor is cheaper. Therefore, some poor families decide to pay less amount of upfront cost for electricity access, although this will cost them higher monthly electricity bill due to higher price per unit.
ii. High electricity tariff
Although the electricity tariff in Thailand has been designed on the basis of real costs with life line rates for the poor, it has also increased gradually over the time. Majority of the surveyed slum households (77% in 2007 and 55% in 2012, field survey) felt that the electricity tariff was still expensive for them, especially if they want to use several electric appliances such as refrigerator, air conditioner, etc.
iii. The use of energy inefficient appliances
High upfront cost and the need to change the existing wiring/connection system is possibly the major barrier to use high energy efficient appliances and lamps in poor households. This is reflected in a pilot project of public housing implemented for energy efficiency programs. It was informed during the consultative meeting that a number of low income dwellers replaced CFLs with cheaper lamps, such as incandescent bulbs and fluorescent tubes, once the CFLs life expired.
iv. A lack of awareness among slum households
About 30% in 2007 and 25% in 2012 of the surveyed slum households did not have housing registration number, and so were ineligible to obtain legal electricity connection. There are about over 20% of poor households that are able to apply for temporary housing registration. The main reason for their reluctance was likely to be their lack of awareness. Some slum dwellers (according to 2012 field survey) also believed that they could not ask for a temporary housing id and were reluctant to approach the district office on their own to apply. Therefore, there is general lack of awareness regarding temporary id even among different households living in the same slum community.
v. Social characteristics of the urban poor
The comparatively larger sizes of urban poor HHs than the average HHs as well as the fact that many poor HHS use energy for productive uses, such as, owning a grocery store, laundering and selling food in their house, leads to higher electricity consumption. Therefore, they are unable to reap the benefit of free electricity policy as their consumption is more than 90 units.
43

5. Best Practices
This chapter presents the best practices from Thailand and outside of Thailand on promoting energy access to the urban poor.
5.1 Best Practices from Thailand
Thailand has been a unique case in the study of energy access in the urban poor region. Unlike many other developing countries, the provision of clean and modern energy services in the slum areas is relatively better in Thailand. These have been the result of plans, policies and programmes of the government for the socio-economic development and poverty alleviation strategies that have had both direct and indirect impact to the livelihoods of the urban poor including their access to basic services like energy.
Based on a review of various policies and programs initiated by energy suppliers, government agencies, and local authority, successful policies and programs which have enabled the urban poor in Thailand to have better access to electricity and LPG are summarized below:
i. Quasi housing identity
Housing registration policies initiated in 1987 have had an important effect on the urban poor by providing them opportunity to have legal connection to the grid. Earlier, only house owners whose houses were constructed in accordance with the Building Code of 1979 and constructed on the authorized lands were eligible to have official house identification and to legally have electricity connection. Therefore, the urban poor who mostly encroached on the public lands to settle their own communities could not ask for housing registration and basic utility connection (electricity and water supply). To help this poor population of the cities to have better access to infrastructure, the Housing Registration Act of 1992 was formulated and housing registration was classified into two types: permanent and temporary housing registration. The latter is defined as “the housing registration that a register issues for a house built on public lands or encroached on protected forests or a house constructed without complying with the Building Code of 1979” (the Housing Registration Act of 1992).
The survey of 100 households in Bangkok in 2007 indicated that 58 households were found not having an official household registration. Of the households without an official registration, 53 had a quasi-household ID (i.e., “temporary registration”). Out of the 53 households with a temporary registration, almost half (26) had a legal connection to MEA. Similarly, in the survey of 40 households in Bangkok in 2012, 10 households were found not having a quasi-household ID and these were the households who obtained connection for electricity through their neighbors. This finding is similar to that of Cook et al. (2005), who observed that the quasi household IDs have substantially reduced the number of illegal electricity connections (connection through a neighbor) in Thailand.
Having a temporary registration, however, is not a guarantee for slum dwellers’ eligibility of getting electricity connection. Complaints have been made by some slum dwellers who indicated that their application for electricity connection was disapproved although they had temporary registration (Prachathai, 2010). The time duration to be connected to the electricity through the utilities for a household with temporary registration could be significantly longer (more than 3 months15). This is
15 Pers com. (representative from electricity utility company, 2012) 44
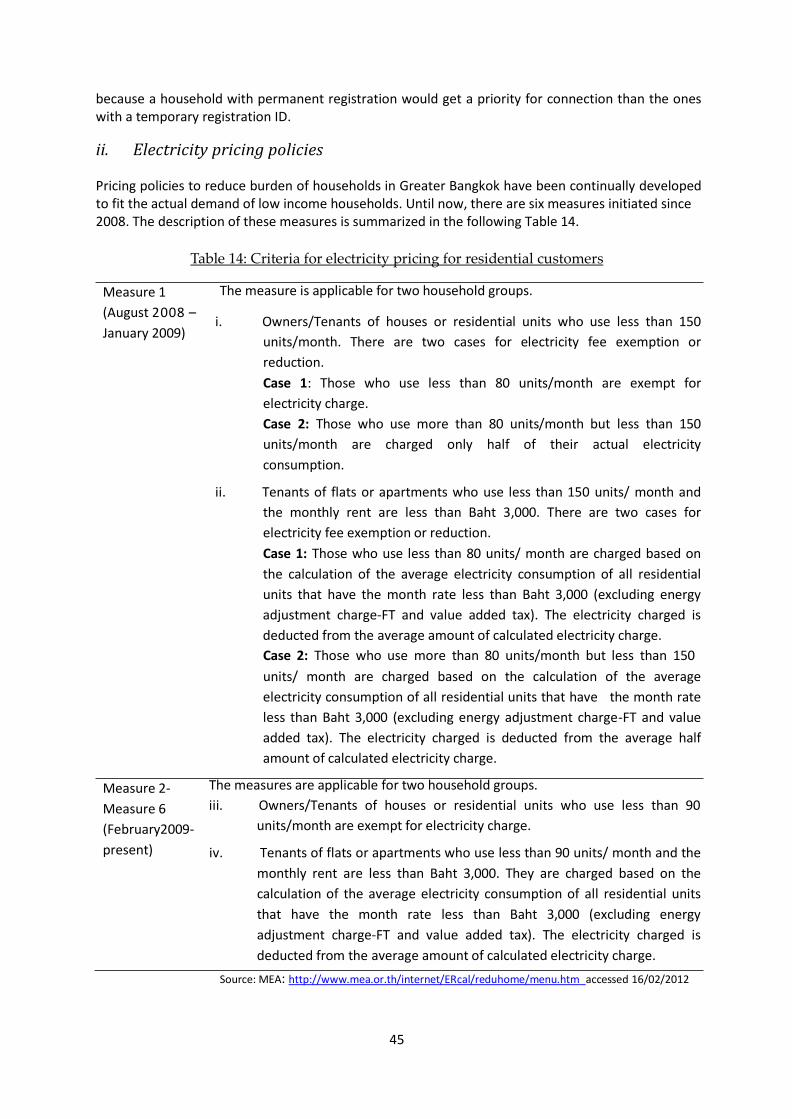
because a household with permanent registration would get a priority for connection than the ones with a temporary registration ID.
ii. Electricity pricing policies
Pricing policies to reduce burden of households in Greater Bangkok have been continually developed to fit the actual demand of low income households. Until now, there are six measures initiated since 2008. The description of these measures is summarized in the following Table 14.
Table 14: Criteria for electricity pricing for residential customers
Measure 1 (August 2008 – January 2009)
Measure 2- Measure 6 (February2009- present)
The measure is applicable for two household groups. i. Owners/Tenants of houses or residential units who use less than 150
units/month. There are two cases for electricity fee exemption or reduction. Case 1: Those who use less than 80 units/month are exempt for electricity charge. Case 2: Those who use more than 80 units/month but less than 150 units/month are charged only half of their actual electricity consumption.
ii. Tenants of flats or apartments who use less than 150 units/ month and the monthly rent are less than Baht 3,000. There are two cases for electricity fee exemption or reduction. Case 1: Those who use less than 80 units/ month are charged based on the calculation of the average electricity consumption of all residential units that have the month rate less than Baht 3,000 (excluding energy adjustment charge-FT and value added tax). The electricity charged is deducted from the average amount of calculated electricity charge. Case 2: Those who use more than 80 units/month but less than 150 units/ month are charged based on the calculation of the average electricity consumption of all residential units that have the month rate less than Baht 3,000 (excluding energy adjustment charge-FT and value added tax). The electricity charged is deducted from the average half amount of calculated electricity charge.
The measures are applicable for two household groups. iii. Owners/Tenants of houses or residential units who use less than 90
units/month are exempt for electricity charge.
iv. Tenants of flats or apartments who use less than 90 units/ month and the monthly rent are less than Baht 3,000. They are charged based on the calculation of the average electricity consumption of all residential units that have the month rate less than Baht 3,000 (excluding energy adjustment charge-FT and value added tax). The electricity charged is deducted from the average amount of calculated electricity charge.
Source: MEA: http://www.mea.or.th/internet/ERcal/reduhome/menu.htm accessed 16/02/2012
45
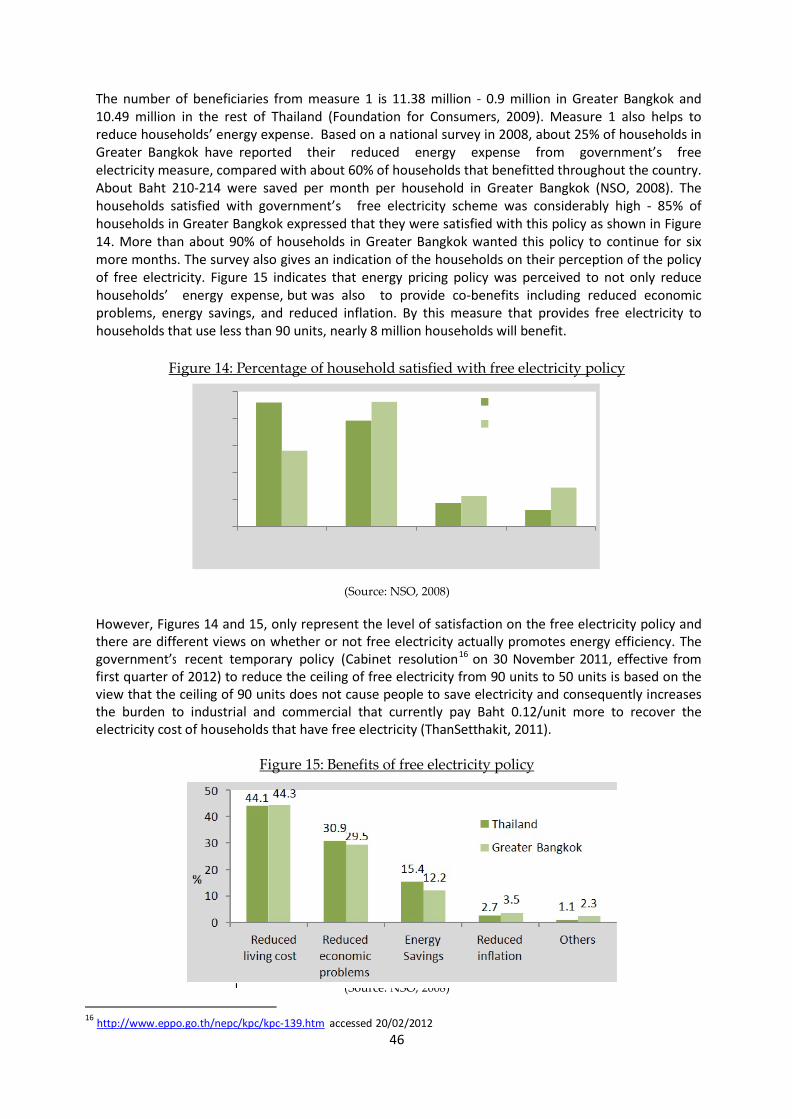
The number of beneficiaries from measure 1 is 11.38 million - 0.9 million in Greater Bangkok and 10.49 million in the rest of Thailand (Foundation for Consumers, 2009). Measure 1 also helps to reduce households’ energy expense. Based on a national survey in 2008, about 25% of households in Greater Bangkok have reported their reduced energy expense from government’s free electricity measure, compared with about 60% of households that benefitted throughout the country. About Baht 210-214 were saved per month per household in Greater Bangkok (NSO, 2008). The households satisfied with government’s free electricity scheme was considerably high - 85% of households in Greater Bangkok expressed that they were satisfied with this policy as shown in Figure 14. More than about 90% of households in Greater Bangkok wanted this policy to continue for six more months. The survey also gives an indication of the households on their perception of the policy of free electricity. Figure 15 indicates that energy pricing policy was perceived to not only reduce households’ energy expense, but was also to provide co-benefits including reduced economic problems, energy savings, and reduced inflation. By this measure that provides free electricity to households that use less than 90 units, nearly 8 million households will benefit.
Figure 14: Percentage of household satisfied with free electricity policy
50
40
30
% 20
10
46
28.1
39.3
46.3 Thailand
Greater Bangkok
11.3 14.3 8.7 6
0 Very satisfied Moderately
satisfied
Slightly satisfied Dissatisfied
(Source: NSO, 2008)
However, Figures 14 and 15, only represent the level of satisfaction on the free electricity policy and there are different views on whether or not free electricity actually promotes energy efficiency. The government’s recent temporary policy (Cabinet resolution16 on 30 November 2011, effective from first quarter of 2012) to reduce the ceiling of free electricity from 90 units to 50 units is based on the view that the ceiling of 90 units does not cause people to save electricity and consequently increases the burden to industrial and commercial that currently pay Baht 0.12/unit more to recover the electricity cost of households that have free electricity (ThanSetthakit, 2011).
Figure 15: Benefits of free electricity policy
(Source: NSO, 2008)
16 http://www.eppo.go.th/nepc/kpc/kpc-139.htm accessed 20/02/2012 46

iii. MEA’s activities in slum communities (Community service project)
Initiated in 2001, MEA has had annual activities in many slum communities of Greater Bangkok. The services included the provision of electricity connection application, electricity bill payment unit, power line and electricity pole maintenance, and electricity-related consultation such as to use electricity safely and economically (MEA, 2001). In 2011, MEA had activities in 18 communities in Greater Bangkok (MEA, 2011) and a number of poor households have used this facility to receive electricity connection and related services.
iv. LPG pricing policies
According to NSO’s statistics (2009), over 76% of the households in Thailand had LPG stoves indicating that the majority of population gained from the government’s subsidy of LPG price for the residential sector. A survey of public opinion on government policy about the fixed LPG price in 2008 reveals the similar percentage of households benefited from this policy. About 72% of households in Greater Bangkok claimed that they took advantage from the fixed price of LPG and 95.4% of households reported their satisfaction with the policy (NSO, 2008). Figure 16 illustrates the level of satisfaction with the LPG pricing policy among households in Thailand and in Greater Bangkok.
The Thai government uses the oil fund to subsidize the price of LPG for all sectors including industrial, transportation and household sectors. The government has set the ex-refinery price at US$ 333/ton, or 10.43 Baht/kg and the retail LPG price of 18.13 Baht/kg. When compared with the cost of imported LPG, which is about US$ 934/ton or about 29.28 Baht/kg, for which a subsidy is paid by the government at a rate of about 19.22 Baht/kg, the present retail LPG price is still much lower than the actual cost (MoE, 2012). However, pursuant to the cabinet resolution of 4 October 2011 regarding the LPG price structure reform, the LPG price for the transportation sector and industrial sector will gradually increase whereas the price of LPG for household use will be fixed until the end of 2012 (MoE, 2012).
Figure 16: Percentage of household satisfied with LPG pricing policy
70
60
50
40 %
30
20
28.4 26.4
54.7
58.7
Thailand
Greater Bangkok 13.4 10.5
10 3.5
0
4.6
Very satisfied Moderately satisfied
(Source: NSO, 2008)
Slightly satisfied Dissatisfied
47

v. Permitting grocery shops to sell LPG cylinders Domestic supply of LPG is available from distributors, such as, gas shops and retail outlets, where customers pay a onetime deposit for the cylinder and an appropriate amount for each refill. The distributors also deliver the cylinder to individual households. Most distributors carry a variety of LPG brands owned by LPG companies and will be able to carry out the cylinder swap procedure should a customer decide to change from one brand to another and also ensure the safety of the customer by carrying out safety checks as well as assist in installation of new connections for the first-time users17.
Apart from the availability of grocery shops and retail LPG outlet covering residential areas including slum areas, the services that distributors offering to household consumers is another key factor for the extensive use of LPG. The following is the list of common services offered by the LPG distributors.
Delivery service to doorstep; Having a variety of LPG brands and swapping the different brand cylinder when a customer
requires. As each LPG brand has different retail price, a customer can choose the one that match their preferences regarding price and quality;
Assistance for first-time users to install LPG cylinder.
LPG distribution shops are required to obtain permission from Department of Energy Business (DOEB).There are detailed requirements and code of practices laid down by DOEB regarding the storage, loading/unloading, use, trading and safety (fire prevention) aspect of LPG for occupiers, suppliers and traders of LPG. According to the Decree of Ministry of Energy 2006, the distribution LPG shops need to be isolated (300 meters away from adjacent buildings) and built from refractory materials. However, the permission process is not required for grocery shops. According to DOEB, the grocery shop owners are eligible to sell LPG but they can keep not more than four 15 kg LPG cylinders in their shops (Thairath, 2011). This system helps the owners of grocery shops to avoid complex process of application and to have less investment cost. The availability of LPG cylinders in the grocery shops have led to increased and easy access of LPG to the population, including the urban poor.
Currently, there are about 10,000 grocery shops and 5,000 retail outlets registered with DOEB (Thairath, 2011). The statistics from EPPO for 2001 (ten years ago) shows that there are over 600 retail LPG outlets in Greater Bangkok18. This system enables LPG supply to be easily accessible for households as grocery shops are extensively distributed in Thailand.
vi. Slum upgrading and public housing projects
With the assistance of two major organizations, CODI and NHA, the poor living environments of the urban poor have been upgraded either by improving the existing conditions or by relocating them to the new communities. The discussion during the consultative meeting indicated that slum upgrading projects provided an opportunity for the urban poor to have permanent houses with improved infrastructure, allowing them to have permanent housing identification. Based on the survey of 16 upgraded communities assisted by CODI, water and energy consumption costs of households were reduced by 10% and 5% respectively. Provision of legal electricity connection was thought as the main reason for energy cost reduction, as the household paid a cheaper (standard) rate than the one they paid before when they were connected through their neighbors. However,
17 http://pirun.ku.ac.th/~b4754090/LPG.pdf accessed 29/01/2012 18 http://www.eppo.go.th/lpg/lpg-table4.html accessed 29/01/2012
48

an increased number of electric appliances used are one of the reasons for slum householders’ increased electricity consumption after upgrading.
5.2 Best Practices outside Thailand
Table 15 illustrates some best practice case studies on energy related issues from Philippines, Indonesia, South Africa, Tanzania, Brazil, and Sweden. Although these countries have diverse social - economical, environmental, cultural and political background, initiatives in addressing some energy related issues have been successful. Thailand could learn and replicate similar efforts in dealing with its issues related to energy access improvements and efficiency for the urban poor.
The best practice cases presented here have been compiled from studies carried out by ICLEI, UNEP and UN-Habitat, International Energy Agency, UNDP and ESMAP.
The case studies are presented addressing specific barriers. The description of the barrier is based on the information presented in Chapter 4.
49

Table 15: Selected best practices that address specific barrier
Type of Barrier Description Example of Best Practice Policy Barrier There e x i s t n o specific policies,
plans and programmes that look after the energy efficiency aspect to the urban poor. Energy efficiency has not been a target for urban poor and the initiatives for energy efficiency in housing projects that have been developed for low income households are reactive (e.g. change of light bulbs) rather than proactive (e.g. considering energy efficiency while designing the house)
Best Practice 1: More energy efficient homes in Puerto Princesa City, Puerto Princesa, Philippines Puerto Princesa is a multi-awarded and pioneer city for environmental initiatives in the Philippines. It is the capital and chief seaport and airport of the Province of Palawan. The rising urban population of Puerto Princesa has led to congestion in the city’s bay area, threatening the people’s quality of life and coastal reserve areas. Housing projects on the coast in Puerto Princesa City have been designed to reduce energy demand through increased natural light, improved ventilation, the cooling effect of the roofing material, and strategically planting at least one fruit tree per household. The anticipated annual energy savings from the use of Compact Fluorescent Lamps (CFL) instead of incandescent bulbs alone is 21,414 KWh (equivalent to US $ 35,106) and have reduced energy bills by 64%. The potential annual carbon savings is estimated to be at least 72 tons for the 330 households. Other green features of the housing projects include the installation of a rainwater catchment facility that reduces the demand of water pumping; prohibiting the use of wood for the roof and interior frames; and an appropriate disposal system for non-recyclables and non-biodegradables18. Best Practice 2: Cuba’s Programme for Low Energy and Material Consumption for Housing Villa Clara Province Cuba With housing resources scare in Cuba due to the economic crisis in the early nineties affecting the production of building materials and aggravated by recurring hurricanes, a national Programme for Low Energy and Material Consumption for Housing was established. As a result of this programme, over 50,000 new homes have been built since 1992 using the scare resources available in a rational and sustainable manner. The technologies developed are geared towards small-scale production, with a focus on stimulating the local economy through the creation of new job opportunities. The
1 8 Website: www.iclei.org/fileadmin/user_upload/documents/SEA/Case_Studies/Puerto_Princesa.pdf as in ICLEI, UNEP and UN-Habitat, 2009
50

programme has an innovative process of technology development and transfer, which has resulted in a set of appropriate technologies for the manufacture of building materials ‘eco-materials’-building materials m a d e w i t h l o w e m b o d i e d e n e r g y , o f t e n through recycling wastes at municipal level such as micro-concrete roofing tiles, lime-possolana cement, pre-cast hollow concrete blocks, bio-wastes s fuel and use of bamboo in construction. The whole process has been organized as a south-south endeavor, as machinery and know-how come from Cuba and other countries in Latin America. These new techniques have been applied not only in the construction of new housing but also in reconstruction and rehabilitation of old housing stock.
A total of approximately 200 new direct jobs have been created, as well as a large number of indirect jobs (in masonry, carpentry), as a consequence of the boost in the local construction market. The energy benefits of this intervention include low energy input, minor transportation costs, and substantial energy savings by the usage of an alternative binder for cement, as well as using alternative fuel and producing lower carbon emissions19.
Financial Barrier Sustained and sufficient availability
of income is always a significant problem of the urban poor. The upfront cost and the extra cost related to energy efficiency and improved energy access belter the poor’s ability in the access of reliable, modern and efficient source of energy
Best Practice 1: Cash transfer programme to mitigate the impact of fuel price hikes Jakarta, Indonesia With the fuel price hikes in 2008, it was the urban poor in Indonesia that suffered the most as their average earnings bought them less food than before. To mitigate the impact of the fuel price hikes, the government had allocated Rp14.1 trillion for a cash transfer programme to 19.1 million low-income households nationwide, comprising 76.4 million people. Each household was to receive Rp100, 000 per month and 15kg of cheap rice until the end of this year 2008. According to the government, the cash transfer, disbursed through post offices, proceeded smoothly and the benefits had been received by almost 95 per cent of the targeted households. The well-meaning scheme, however, had drawn criticism from community leaders and local government officials who said it might cause
19 www.worldhabitatawards.org/winners-and-finalists/project-details.cfm?lang=00&theProjectID=8CF5995B-15C5-F4C0-997B214C8DFB72F7 and
www.bestpractices.org/bpbriefs/housing.html as in ICLEI, UNEP and UN-Habitat, 2009
51

conflict and create social jealousy. The fuel price increase enabled the government to save US$3.8 billion for the 2008 fiscal year, of which US$1.6 billion was ploughed into the cash transfer20.
Physical Barrier The physical location of urban poor
community which is usually narrow, over-crowed, limited and unsafe and dangerously located around railway tracks can affect the installation, delivery and monitoring o f e n e r g y r e s o u r c e s like electricity and LPG.
Best Practice 1: Installation of prepaid electricity meters as a part of Integrated National Electricity Programme (INEP) of South Africa (IEA, 2010) Prepaid electricity meters formed part of the installation for all new connections under the INEP. Initially, their introduction aimed at displacing “conventional” credit meters in order to reduce the administrative costs associated with monthly readings and billings. Further, credit meters were generally mounted on external walls of dwellings (in all residential areas), and suspicion was widespread that supply was accessed by unauthorized users. Hence, prepaid meters, mounted inside dwellings, offered security while also affording the opportunity for consumers to monitor the consumption of the appliances they use. These meters also reduced the problem of non-payment. When selling prepaid electricity, the challenge of providing a convenient payment point close to every home can easily be underestimated. In most instances, the change from credit meters to prepaid meters was started with a focus on the installation of meters, but it was soon found that the system only started to operate smoothly once the focus included the sales channel as well. Since either a mechanism (such as an unattended vending machine) or a person was needed to collect the cash during the transaction, this also formed the most challenging part of the community to sell to. However, as long as there was cell phone reception, cell phone vending had few boundaries and could reach informal settlements and newly developed suburbs with very little infrastructure. Best Practice 2: Solar streetlights as part of regeneration plans, Johannesburg, South Africa The streets of inner city Johannesburg might be lit by solar powered street lights as the Johannesburg Development Agency (JDA) adopts an environmentally friendly lighting strategy. Established in April 2001 as a limited liability company, the JDA is an agency of
20 www.nst.com.my/Current_News/NST/Wednesday/Columns/2275890/Article/pppull_index_html as in ICLEI, UNEP and UN-Habitat, 2009 and http://www.thejakartapost.com/news/2008/05/27/mitigating-impact-fuel-prices-increase.html accessed 08/02/ 2012
52

the City of Johannesburg that stimulates and supports area based economic development initiatives throughout the Johannesburg metropolitan area in support of Johannesburg’s Growth and Development Strategy. As part of an initial pilot project, three locally manufactured solar streetlights have been installed on Kenmare Street in Yeoville by Broadwing Technologies. If the pilot is a success more lights will be installed in surrounding areas and the rest of the city. Renewable energy from the sun meant independence from the power utility Eskom’s coal-based generation of power, which in turn meant cost savings and environmental gains.
An evaluation that was done jointly by Broadwing Technologies and JDA, to monitor performance, showed that the solar street lights compare favorably with the cost of installation of conventional streetlights. The lifecycle maintenance costs of the installation are also favorable as the LED bulbs used in the streetlights, use a lower voltage to produce a brighter light and can be used without replacement for about 20 years. According to figures estimated by Broadwing Technologies, the City would be able to achieve a saving of 1 MW for every 12 000 or 15 000 street lights that are retrofitted21.
Lifestyle Barrier Even though LPG is readily available
to the urban poor in the Bangkok reason, many surveyed HHs were still using Charcoal as a secondary source of cooking fuel. Many houses used traditional charcoal stoves t h e r e b y increasing the chances of indoor pollution and the related health impacts
Best Practice 1: Use of Improved Charcoal Stoves for Energy Efficiency in urban areas of Tanzania
The Improved Charcoal Stove (ICS) was first introduced in Dar es Salaam by the Ministry of Energy and Minerals in 1988 with assistance from the World Bank. Adapted from the Kenyan ceramic jiko, this stove consists of a metal outer casing, a ceramic firebox and an insulation collar. The stove had been promoted because it is low-cost, reduces cooking time, improves thermal efficiency by 30-36%, and reduces the consumption of charcoal. The reduced use of charcoal improves indoor air quality and therefore reduces health problems and also reduces the amount of charcoal a household must purchase, which saves money for the poor households. In 1992, the Tanzania Traditional Energy Development and Environment Organization (TaTEDO) assumed responsibility for disseminating this technology in the country. It had
21 www.engineeringnews.co.za/article.php?a_id=131170 as in ICLEI,UNEP and UN-Habitat, 2009
53

trained artisans to produce the stoves and helped establish workshops and repair centers by offering small loans, training and technical support.22
Awareness Barrier
The major reason for the urban poor in Bangkok region to be connected to the electricity through their neighbors was found to be unavailability of house registration number. However, there was lack of awareness among the individuals within and between the slum communities that even though they might not be eligible for permanent housing registration number, they could still apply for a quasi-household ID’ which could be used to get a metered connection of electricity from MEA.
Best Practice 1: COELBA COMMUNITY AGENT PROJECT in Salvador Brazil (ESMAP, 2011) The city of Salvador is the state capital of Bahia state. It is the third largest city of Brazil, as well as one of the oldest. About 35% of its population lives at or below the poverty level. The configuration and location of dwellings in the urban slums, and the lack of formal property registration meant that basic tools for communication between the service providers and customers—identifiable addresses, roads, telephone, and postal service— were lacking. The environment fostered a conflicting relationship between utility companies and the community, where non-paying consumers preferred to remain invisible and the utility’s only recourse to non-compliance was service discontinuation and legal remedies. The COELBA Community Agent project was an electrification and energy-efficiency initiative for low income areas. It was carried out by a local NGO, Cooperação para o Desenvolvimento e Moradora Humana (CDM), in the city of Salvador, Bahia state, and was coordinated and financed by the electrical distribution company COELBA. The objectives of the COELBA Community Agents project were to: invest in customer relations through the mediation of agents embedded in communities; reduce commercial losses from non---paying legally connected customers; reduce number of illegal connections and adjust energy consumption (bills) of low--income consumers to their ability to pay; use a combined approach of information and energy efficiency improvements delivered by community agents, together with increased utilization of government subsidies (social tariff); and rely on an intermediary NGO to reach customers and establish a balanced relationship of mutual trust between customers and the company. Community associations in intervention areas were key components of this project, guaranteeing implementation and monitoring of activities with a high level of community participation, including selection of community agents to be hired by the project.
22 http://sgp.undp.org/download/SGP_Tanzania1.pdf accessed 12/01/2012
54
Institutional Barrier
There is, in general, lack of coordination between among the departments and between different agencies in planning and dealing effectively the energy issues of urban poor, particularly in addressing the energy efficiency aspects
Best Practice 1: FOKUS --- Strategic planning effort informed by monitoring and evaluation in Sweden (IEA, 2011) FOKUS is the strategic planning process used by the Swedish Energy Agency (SEA). Created in 2006, it formulates the vision, sets priorities, and identifies the short and medium---term goals of the programme for energy RD&D, innovation and commercialization. To achieve those goals, it targets a wide range of measures ranging from basic research and support for large scale demonstration plants to product development. The process covers six themes. For each of these themes, a “Development Platform” is established to guide the programme through the involvement of stakeholders (predominantly industry). The strategies and priorities resulting from using FOKUS are then translated into yearly implementation plans for the SEA. Activities and results are reported yearly to the government. Funding is allocated largely through planning groups and studies, with the help of stakeholder representatives or other advisory bodies. Regular peer reviews are undertaken to ensure quality and relevance. Besides top-down planning, FOKUS identifies bottom-up opportunities for researchers and entrepreneurs. It supports innovation and product development projects, which are evaluated on the basis of business plans, commercial prospects, and relevance in the fields of technology and energy. Therefore the structured analysis process helped to define coherent priorities an d optimize investment with further improvements particularly with regard to co---operation with other national and international actors. Moreover, the programme demonstrated strong collaborative approach as stakeholder involvement was organized through the development platforms that provide guidance to the programme.
55

6. Recommendations
6.1 Barrier specific recommendations
Considering the status of energy access in Bangkok, discussions with relevant stakeholders, and analysis, the barrier specific recommendations proposed are presented in Table 16. This specifically describes the type of barrier, the efforts made to address the barrier, and the recommendations to address/overcome the barrier. Suitable/appropriate examples are also noted.
Table 16: Barrier specific recommendations
Barriers Efforts so far to addressed Recommendations/suggestions to overcome the the barrier barrier
Policy Barrier No specific policy/plan
programmes that considers energy efficiency aspect of urban poor
Initiatives developed for energy efficiency for low income households are more reactive than proactive
Some programmes for addressing energy efficiency in the low income households have been initiated but those are limited to few new housing units and demonstration projects.
It i s recommended tha t the energy policy and planning process to also give importance to energy efficiency in urban poor areas and in existing infrastructure, set realistic targets and put in place plans and enabling environment to deliver them in coordination with local communities and community organizations. Example of a project that influenced government’s commitment to renewable energy access23
A project entitled "Capacity Building for Rapid Commercialization of Renewable Energy (CRE)’ initiated by the State Environment Protection Agency and National Development and Reform Commission of China (1998-2002) played an important role in promoting widespread adoption of RETs through a comprehensive set of capacity building measures for key public and private organizations, supported by influencing national policies on renewable energy sector and supporting the promulgation of national Renewable Energy Law. The passing of the law led to an acceleration of new projects (particularly in wind, solar and biomass) and has achieved a dramatic shift in the political and social atmosphere regarding RE.
Financial Barrier
The u p f r o n t c o s t a n d t h e extra cost associated with energy efficient appliances and s y s t e m s a r e i s s u e s to urban poor
The government administers funds in partnership with banking sector for energy conservation (for example, ESCO Fund24 is a grant from DEDE and totals five
Since the initiatives related to energy efficiency are usually expensive in the beginning with benefits accruing only over the time, it is recommended that flexible and combination of financing structure including subsidies on capital equipment, project loans, end user micro- credit be
23 Based on case studies compiled in UNDP, 2011 24 http://www.ecft.org/home/index.php?lang=en accessed 05/02/2012
56

hundred million baht which invests in clean energy, renewable energy, energy efficiency as well as building retrofit projects).
provided particularly for projects dealing with energy efficiency in low income communities. Example of a project that expanded energy access through RE solution using commercially viable delivery channel and micro-finance25
The Energy Services Delivery Project (ESD, 1997- 2002) and the Renewable Energy for Rural Economic Development (RERED, 2005-2012) Project in Sri Lanka have aimed to promote the commercialization of RETs through setting up commercially viable delivery and financing channels. Since building on a new market involves immense uncertainty and large financial outlays, RERED used donor funds to create a financial services sub-sector for funding RE within Sri Lanka’s existing financial system,. When lack of credit presented a critical barrier to popularizing RE, the project turned to Micro Finance Institutions (MFI) which had a large outreach. Over the time, with considerable capacity development efforts, a host of financial institutions beyond MFIs-including finance companies, leasing companies and merchant banks-were brought in as participating credit institutions who received refinancing from the program for extending micro-credit services.
Physical Barrier
The physical location of the urban poor particularly in the slum areas are narrow, congested and unsafe which causes the installation, delivery and monitoring of energy services difficult
Slum upgrading programmes are existent which apart from other developments also covers aspects such as improvement of sanitary conditions and development of adequate space for improved living conditions (e.g. The Baan Mankong Project)
Urban development and slum upgradation can be complimentary as both targets towards sustainable city development. The government should work with the local community in a participatory approach involving them in the revitalization of their community. Example of urban renewable initiative for providing basic services to the urban poor26
Jawaharlal Nehru National Urban Renewable Mission (JNNURM) is an initiative the government of India during 2005-2006 to revamp and upgrade infrastructure development in the cities and urban agglomerations. It encouraged reforms and fast track planned development of identified areas through efficiency in urban infrastructure and service delivery mechanism, community participation and accountability of local bodies and authorities towards its citizens. It
25 Based on case studies compiled in UNDP, 2011 26 http://jnnurm.nic.in/wp-content/uploads/2011/01/UIGOverview.pdf accessed 15/02/12
57

also had plans and programmes for urban poor through integrated development of slums, housing and infrastructure, environmental improvement and maintenance of basic services to the urban poor.
Lifestyle Barrier
Due to their preference of food cooked food in charcoal and for additional income generation by selling the food, many slum households are still using the traditional cooking stove.
Nothing specifically has been done to discourage the use of inefficient charcoal stove in the urban poor areas
Work with the local group and community networks to promote awareness on economical and health benefits of using improved charcoal stove and provide small loans, trainings and technical help for improvements. Example of innovative marketing and distribution models for dissemination of improved stoves27
StoveTec, global supplier of energy efficient stoves manufactured in China, uses a marketing strategy that relies on multiple distribution channels and partners including electricity utilities, microfinance institutions, energy stores and humanitarian programmes in developing countries. The dissemination of stoves in developing countries are subsidized through the sale of stoves at market place to developed countries
Awareness Barrier
Lack of awareness among the slum dwellers in applying for a temporary household id, which can be used to get a legal connection of electricity from MEA
Lack o f awareness among the slum dwellers for household energy efficiency improvements
The authorities have been working in partnership with local NGOs, and private sectors to launch number of activities to encourage energy conservation and the use of renewable energy focused on BMA buildings, schools, hospital, and the public areas.
Involve NGOs and community organizations to raise awareness in each slum communities informing and helping them for the application of temporary household id so that they can legally acquire the electricity services. Extend the awareness generating activities and campaigns for energy efficiency focused at slum areas as well.
Institutional Barrier
Lack of dedicated institutional structure for addressing energy efficiency for urban poor
Lack of capacity and coordination between the agencies involved in the provision of energy efficiency improvements in the urban poor
There has been some coordination among government departments /agencies like CODI, EPPO, DEDE, NHA, BMA for slum upgradation, housing services and maintenance of basic services to the urban poor
A dedicated institutional structure responsible for looking at urban energy issues particularly in poor area is necessary. This will ensure utilizing appropriately the funds and opportunities for addressing energy efficiency in urban poor region. Since, the urban poor of Bangkok are within the jurisdiction of BMA, a dedicated section/department within BMA to oversee the energy service need of the urban poor could be a first step.
27 Based on case studies compiled in UNDP, 2011
58

A common platform (agency, network, etc) could be envisaged where DEDE, EPPO, NHA,CODI, BMA and also the 17 different departments within BMA could interact and work together to deal with the energy access and efficiency issue of the urban poor, Capacity d e v e l o p m e n t o f l o c a l a u t h o r i t i e s , service providers, community development organizations to improve their energy access and energy efficiency services to the urban poor.
A summary of the results of this study was presented at an International Conference on ‘Sustainable Future Energy 2012’ in November 2012 (Kumar et al., 2012)
6.2 Recommendations for further study
The general recommendations are based on the stakeholder consultations (6 March 2012), who provided inputs on the assumptions used and suggestions for further analysis. These are summarized below:
i. Energy use:
The study on energy access to urban poor should also focus on other uses of energy, such as, energy used for transportation purposes.
ii. Awareness:
An important target group who could help raise awareness to the urban poor regarding energy conservation and efficiency and to address the financial barriers is the employers of the urban poor. Since most of the urban poor work as the retail or company workers, their employers could be engaged in programmes such as capacity building and micro financing options for imparting energy conservation behavior to their employee.
The local authority, particularly the BMA, could promote activities about energy efficiency and conservation and the starting point to gain public participation on such activities could be by promoting awareness to the students in the schools.
The national and the local government should give more priority to make plans and policies related to energy efficiency than the present situation.
iii. Database:
There exist huge population (4 million) in Bangkok who are not registered and there is lack of information on what percentage of urban poor is included in that figure. Similarly, there is lack of data on what fraction of urban poor gets energy supply form MEA and from neighbors. Therefore, in order to formulate any kind of targeted plans, policies and programmes for the urban poor, it is first necessary to build a strong database about the urban poor in terms of their coverage; available services and infrastructure; actual consumption; share and pattern of utilities usage, etc
iv. Renewable energy development:
An alternative option to deal with the issue of illegal electricity connection in the urban poor due to lack of household registration number could be to develop the poor communities
59

themselves as energy provider through innovative programmes, such as, solar power or energy generated through wastes, so that they are self-sustainable.
Low cost and solar efficient appliances such as cooker, heater, battery charger, electricity capacitor should be provided to the urban poor.
v. Financial barrier for LPG:
As the initial deposit of the LPG cylinder is high to the urban poor, a free circulation LPG cylinder could be provided. To safeguard the theft of LPG cylinder, a ‘chip embedded’ cylinder could be promoted.
60

References
ADB (2005). Assessing the impact of Transport and Energy Infrastructure on Poverty Reduction. Asian Development Bank, DFID, JBIC, and World Bank.
ADB and CAI-Asia (2006). Country synthesis report on Urban Air Quality Management Thailand. Discussion Draft, December 2006. Asian Development Bank and the Clean Air Initiative for Asian Cities. Philippines.
APERC (2010). Compendium of Energy Efficiency Policies of APEC Economies - Thailand. Asia Pacific Energy Research Centre. Tokyo. Available at: www.ieej.or.jp/aperc/PREE/PREE_Thailand.pdf.
ASESIEAP (2007). ASESIEAP Goldbook. Association of the Electricity Supply Industry of East Asia and Western Pacific. Asian Power.
BMA (2009). Bangkok Assessment Report on Climate Change 2009. Bangkok Metropolitan Administration. Retrieved from http://www.unep.org/Dewa/pdf/BKK_assessment_report2009.pdf
Boonyabancha, S. (2003). Decade of change: from the Urban Community Development office (UCDO) to the Community Organizations development Institute (CODI) in Thailand. Increasing community options through a national government development programme. IIED working paper 12 on poverty reduction in urban areas. International Institute for Environment and Development.
Boonyabancha, S. (2005). Scaling up slums and squatter settlements upgrading in Thailand leading to community-driven integrated social development at city-wide level. Arusha Conference. New frontiers of social policy. December 12-15.
City Mayors Statistics (2010). The Largest Cities in the World by Land Area, Population and Density. Retrieved from http://www.citymayors.com/statistics/largest-cities-area-125.html
CODI (2005). Ban Mankong Cities: A publication of CODI. Community Organizations Development Institute. October.
CODI (2008). A draft report of slum communities’ survey in Bangkok, Bangkok Peri Urban, North Region, Central Region, North-East Region, East Region, East Region, West Region, South Region. Community Organizations Development Institute.
CODI (2009). The Study of the Impact on Socio-Economic Development of a Pilot Project, New Development 7-12 (KlongToei). Retrieved from http://www.codi.or.th/baanmankong/index.php?option=com_docman&task=doc_download&grid=22 &Itemid=66
Cook, C.C., Duncan, T., Jitsuchon, S., Sharma, A., Guobao, W. (eds) (2005). Assessing the Impact of Transport and Energy Infrastructure on Poverty Reduction. Asian Development Bank. Manila.
DEDE (2007). Electric Power in Thailand. Department of Alternative Energy Development and Efficiency Retrieved from http://www.dede.go.th/dede/fileadmin/upload/cc/EleThai110951.pdf
DEDE (2010). Electric Power in Thailand. Department of Alternative Energy Development and Efficiency. Retrieved from http://www.dede.go.th/dede/images/stories/060554_circular/report_electric_%202553_3.pdf
61

DEDE (2011). Electric Power in Thailand. Department of Alternative Energy Development and Efficiency.
Department of Energy Business (2011). Statistics of the Sale of LPG. Retrieved from http://www.doeb.go.th/info/data/datadistribution/dispose_lpg.xls
Department of Provincial Authority (2010). Population and Housing Statistics of Thailand. Ministry of Interior. Retrieved from http://service.nso.go.th/nso/thailand/dataFile/01/J01W/J01W/th/0.htm
BMA (2008). Bangkok State of Environment 2006-2007. Department of Environment. Retrieved from http://office.bangkok.go.th/environment/pdf/bsofe2549-2550.pdf
BMA (2009). Bangkok Assessment Report on Climate Change 2009. Bangkok Metropolitan Administration Retrieved from http://www.unep.org/Dewa/pdf/BKK_assessment_report2009.pdf
BMA (2010). Statistical Profile of BMA. Bangkok Metropolitan Administration Retrieved from http://office.bangkok.go.th/pipd/05_Stat/08Stat(En)/Stat(En)53/stat_eng2010.pdf
BMA (2012). Public Hearing: Viewing Bangkok 2032. Presentation by Bangkok Metropolitan Administration. Available online at http://www.polsci.chula.ac.th/qapolsci/BKK2032/Document/BKKvision.pptx.
EPPO (2007). LPG Price Today. Energy Policy and Planning. Retrieved from http://www.ryt9.com/s/nepo/466830.
EPPO (2011). LPG Price Today. Energy Policy and Planning. Retrieved from http://www.ryt9.com/s/nepo/1308526.
ESMAP (2011). Improving energy access to urban poor in developing countries. The Energy Sector Management Assistance Programme. The World Bank.
Foundation for Consumers (2009). 3 Ways for Free Electricity: The New rate of 80 Units/Month. Retrieved from http://www.consumerthai.org/main/index.php?option=com_content&view=article&id=40:-3---80-- &catid=17:2008-12-15-07-03-49&Itemid=53
Green, D. (2005). The politics of environmental technology choice for rural electrification in northern Thailand. Conservation and Society, 3(2), 265-279.
Guerra, G.A.V., and Guerra, G.A.V., (2004). Urban Development Issues in Thailand; an Insight into Bangkok. Thesis submitted to fulfill Master of Science. Thesis No. 259. Royal Institute of Technology, Stockholm. Available at http://www.infra.kth.se/BYFA/publikationer/examensarbeten/2004/259.pdf.
Hartarto A., (2006). The challenges for Indonesia and opportunities for regional cooperation. Energy, Research, Science, Technology and Environment Committee. DPR RI 2004-2009. President of the Institution of Engineers, Indonesia (PII). International Energy Conference. Kuala Lumpur, 26th–29th November.
ICLEI, UNEP and UN-Habitat (2009). Sustainable Urban Energy Planning. A handbook for cities and towns in developing countries. ICLEI-Local Governments for Sustainability.
62

IEA (2010). Comparative study on rural electrification policies in emerging economies. Key to successful policy. International Energy Agency.
IEA (2011). Good practice policy framework for energy technology research, development and demonstration. Information paper. International Energy Agency.
IHC (2009). The challenge of an urban world: an opportunity for US foreign assistance. International Housing Coalition. Washington
Kojima, M (2011). The role of Liquidified Petroleum Gas in reducing energy poverty. Extractive industries for development series. World Bank.
Kumar, S., Shrestha, P., Salam, A (2012). Energy Access of the Urban Poor in Bangkok, Thailand. Paper presented at Sustainable Future Energy 2012, 21-23 November 2013, Brunei Darussalam.
Lee, Y.S., (2004). Intermediary institutions, community organizations, and urban environmental management: the case of three Bangkok slums. Word Development. Vol. 26. No. 6. pp. 993-1011.
Martin S, Shrestha, R. M, and Kumar, S., (2007). Initial Assessment of UPEA I. Submitted to GNESD. Asian Institute of Technology. (Unpublished report)
MEA (2001). MEA’s Mobile Units in the Occasion of Queen Sirikit’s Birthday Anniversary . Retrieved from http://www.mea.or.th/freeserv.htm.
MEA (2010). Metropolitan Electricity Authority. Annual Report.
MEA (2011). MEA’s Mobile Units in the Occasion of Queen Sirikit’s Birthday Anniversary. Retrieved from http://www.mea.or.th/news/th/index.php?option=com_content&view=article&id=304:2011-08- 18-03-07-10&catid=1:2008-08-26-18-26-28&Itemid=50
MoE (2011). Thailand 20-Year Energy Efficiency Development Plan (2011 - 2030). Available online at http://www.eppo.go.th/encon/ee-20yrs/EEDP_Eng.pdf .
MoE (2012). EPPO Cast Light on LPG Cost – It Is Actually Higher than the Present Retail Price. Thai Energy News. Ministry of Energy. Archived 17/01/2012 as in http://202.44.52.249/thaienergynews/en/NewsHiLightDetail.aspx?id=55
NESDB (2004). Thailand Millennium Development Goals Report. Office of the National Economic and Social Development Board.
NESDB (2007). Gross Regional Product and Gross Provincial Product (GRP and GPP) 2005 edition. The office of the National Economic and Social Development Board.
NESDB (2009). Thailand Millennium Development Goals Report. Office of the National Economic and Social Development Board.
NESDB (2010). Midyear Population (July 1st) from Population Projections by Region: 1990-2010. National Economic and Social Development Board.
63

NESDB (2011). Poverty and income distribution. Economic and Social Survey of Households. Office of the National Economic and Social Development Board. Available at http://social.nesdb.go.th/SocialStat/StatSubDefault_Final.aspx?catid=7
NSO (2006). The Characteristics Of Population And Social In Poor Communities Survey 2006 In Bangkok Metropolis. National Statistical Office. Ministry of Information and Communication Technology. Bangkok 2008.
NSO (2006c). The 2006 Household Energy Consumption Survey. National Statistical Office. Ministry of Information and Communication technology. Bangkok 2008.
NSO (2008). A Survey of Public Opinion about 6 Measures in 6 Months to Reduce Crisis for Everyone: 2008. National Statistical Office. Retrieved from http://service.nso.go.th/nso/nsopublish/servopin/files/rep6method.pdf
NSO (2008b). Report of the Child and Youth Survey 2008. National Statistical Office. Ministry of Information and Communication Technology. Bangkok, 2008.
NSO (2009). Report of the Child and Youth Survey 2009. National Statistical Office. Ministry of Information and Communication Technology, Bangkok, 2009.
NSO (2009a). Percentage of Household Appliance Ownership by Regions 2009. National Statistical Office
NSO (2009b). Percentage of Households by Major Housing Characteristics and Region. National Statistical Office.
NSO (2009c). Average Monthly Energy Consumption per Household by Type of Energy, Region and Area. National Statistical Office.
NSO (2009d). Average Monthly Energy Consumption per Household by Monthly Income, Region and Area: 2006. National Statistical Office.
NSO (2010). Population by Age Group, Sex, Region and Area. National Statistical Office.
NSO (2011). Demographic Statistics of Thailand. National Statistical Office. Retrieved from http://service.nso.go.th/nso/thailand/dataFile/01/J01W/J01W/th/0.htm.
Nikomborirak, D. (2011). Gas in Thailand. In: Impacts and benefits of structural reforms in transport, energy and telecommunications sectors. Asia-Pacific Economic Cooperation Secretariat (APEC).
Pornchokchai, S., (2003). Global Report on Human Settlements 2003. City Report: Bangkok. UN- Habitat. Nairobi.
Prachathai (2010). Community Dwellers Urged Minister of Interior to Sign the Draft Housing Law. Retrieved from http://prachatai.com/journal/2010/09/31033
Rockstrom J.. Axberg G. N., Falkenmark M., Lannerstad M., Rosemarin A., Caldwell I., Arvidson A. Nordström M., (2005). Sustainable Pathways to Attain the Millennium Developing Goals (MDGs).
64

Shrestha, R.M., Kumar, S., Martin, S. and Dhakal, A. (2008). Modern energy use by the urban poor in Thailand: a study of slum households in two cities. Energy for Sustainable Development. 12(4), 5-13.
Suksiriserekul, S. (2000). The poor at risk: surviving economic crisis in Southeast Asia. Case of Thailand. Final report of the project social safety net programs in selected Southeast Asian countries. Canada- Southeast Asia project team.
Thai Post (2011). The Energy Regulatory Commission revises the free electricity campaign for households. Retrieved from http://www.thaipost.net/news/130911/44924.
Thairath (2011). The sale of LPG in Grocery shops. Retrieved from http://www.thairath.co.th/content/eco/202372. 17 September
ThanSettakit (2011). Pichai Supported for the Reduction of Free Electricity. Retrieved from http://www.thanonline.com/index.php?option=com_content&view=article&id=84309:2011-09-19-03- 01-15&catid=88:2009-02-08-11-23-46&Itemid=418. 18-21 September
UNDP (2007). Energy and poverty in the Pacific Island Countries: Challenges and the way forward. Regional Energy Programme for Poverty Reduction. UNDP regional centre in Bangkok.
UNDP (2010). Human Development Report 2010. The real wealth of nations: Pathways to human development. Retrieved from http://hdr.undp.org/en/media/HDR_2010_EN_Tables_reprint.pdf
UNDP (2011). Towards Energy Plus Approach for the Poor: A review of good practices and lessons learned from the Asia and the Pacific. Environment and Energy. United Nations Development Programme. Retrieved from http://www.snap-undp.org/eLibrary/Publications/EnergyPlusReport.pdf
UNICEF (2010). Statistics of Thailand. Retrieved from http://www.unicef.org/infobycountry/Thailand_statistics.html
Webster, D. and Theeratham, P. (2004). Policy Coordination, Planning and Infrastructure Provision: A Case Study of Thailand. World Bank transcript.
World Bank (2006). Thailand Promotion of Electrical Energy Efficiency Project. Retrieved from http://www- wds.worldbank.org/external/default/WDSContentServer/WDSP/IB/2006/09/28/000011823_2006092 8115916/Rendered/PDF/374670TH0Impac1ect0P00464701PUBLIC1.pdf
65

Annex 1: Sample questionnaire utilized for semi-structured interviews with supply agency
Questionnaire No. Date of Interview:
Interviews of agencies responsible for supplying electricity in the city/region
Respondent details Name
Agency
Designation
Interviewer details Name Signature
ASIAN INTITUTE OF TECHNOLOGY (AIT)
Energy Field of Study
P.O. Box 4, Klong Luang Pathumthani 12120
Thailand
66

The questionnaire aims to understand the process of electricity provision (domestic connection) to urban poor in Greater Bangkok region with a specific focus on understanding the barriers faced by el ectric utilities in providing electricity to urban poor.
About the agency
1. Type of agency
a. Government
b. Private
c. Joint venture of government and private entity
d. Others, please specify
2. Spatial jurisdiction of the agency
a. Covers entire city/region
b. Covers part of city/region
3. What are the key goals/objectives of the agency?
4. What are the key functions of the agency?
67

Getting a new electricity connection
5. What is the procedure that a household needs to follow in order to get a new electricity
connection (domestic-residential connection)?
a. Steps
b. Documents to be submitted
6. What are the criteria used to sanction a domestic electricity connection for a household
(residential connection)?
a. Legal status of house/premises Yes_ No
b. Affordability level of household
-Ability to afford initial infrastructure cost of wiring, meters, etc.
Yes_ No
-Ability to pay security deposit and other upfront charges
Yes_ No
-Ability to pay monthly bills Yes_ No
c. Quality of housing structure (construction materials used, etc.) Yes_ No
d. Presence of main electricity infrastructure near the house Yes_ No
e. Others, Please specify
7. What is the time duration within which you have to provide the connection/respond to the
applicant? ............................................................................................................................. .....
68

Electricity connection for poor households
8. For poor households, many of whom live in illegal houses/colonies, do you have a different
procedure to apply for electricity connection? Yes_ No
a. If yes, then explain the difference
i. In steps
ii. In charges payable
iii. In documents required
iv. Others
v. Do the sanctioning criteria also change in their case? Are some criteria relaxed in their
case?
b. If no, then confirm if your policy is to -
i. treat poor households in a similar manner as higher income households and therefore
have same procedure for all to get new connections
Yes_ No
ii. have same approach for all despite the legality of their residential status
Yes_ No
iii. have same sanctioning criteria for all Yes_ No
9. In general, what are the common barriers faced by your agency in providing electricity
connections to poor (especially poor living in illegal houses/colonies)?
a. Legal status of their residences
b. Quality of their residences (temporary shelters using inflammable construction materials,
etc.)
c. Their inability to pay for initial cost of connection and other upfront charges
d. Their inability to pay monthly bills
e. Non-availability of main electricity infrastructure around urban poor pockets
f. Others, please specify
……...………………………………………………………………………………………………………………………………………
…………………………………………………………………………………………………………………………………………
10. Describe the monitoring mechanisms for electricity connections for urban poor.
……...………………………………………………………………………………………………………………………………………………………
………………………………………………………………………………………………………………………………………………………………
………………………………………………………………………………………………………………………………………………………
69

Your agencies strategies for urban poor
11. Do you have a focused strategy/program/scheme to provide electricity access to poor
households?
a. If Yes, please answer question 10 and 11.
b. If No, please give reasons
…………………………………………………………………………………………………………………………………………………………
…………………………………………………………………………………………………………………………………………………………
…………………………………………………………………………………………………………………………………………………
c. Are you planning to formulate such a strategy/program?
If Yes , please give details
………………………………………………………………………………………………………………………………………………………………
………………………………………………………………………………………………………………………………………………………………
………………………………………………………………………………………………………………………………………………………
If No, please give reasons
………………………………………………………………………………………………………………………………………………………………
………………………………………………………………………………………………………………………………………………………………
……………………………………………………………………………………………………………………………………………………..
12. Describe the strategies/programs and the specific actions implemented to improve electricity
access for urban poor.
70

Annex 2: Sample questionnaire utilized for HH surveys in slum areas
Questionnaire No. Date of Interview:
Questionnaire for the Urban Poor of the Bangkok region
Respondent details Name of the Slum
Name of the Respondent
Name of the Facilitator Location
Type of community
Rented area -------- Squat on government land-------- Squat on private land----- Others-----
Main occupation Total HH Income Contact No.
Interviewer details Name Signature
ASIAN INTITUTE OF TECHNOLOGY (AIT)
Energy Field of Study
P.O. Box 4, Klong Luang Pathumthani 12120
Thailand
71

Primary Secondary Tertiary
Household details
1. What is the size of your household? Male---- Female---- Total---
2. How much is your total income?
Household Income Less than 10,000 Bhatt per month Between 10,000 to 17,500 Bhatt per month Between 17,500 to 25,000 Bhatt per month More than 25,000 Bhatt per month
3. What is your monthly expenditure on the following?
i. Grocery/ Food items---------------- ii. Education (fee for school) ------------- Iii. Rent----------------- iv. Utilities, water supply----------- Electricity------- Gas----------- v. Transportation------------------ v. Others----------
Fuel for Cooking
4. What fuel you usually use for cooking?
i. Electricity ii. LPG iii. Charcoal iv. Kerosene v. Wood v. Others-------------- vi. No cooking done at home
5. Why do you have to use a secondary and/ or tertiary fuel?
i. Quantity of primary/secondary fuel is not enough ii. Price of primary/secondary fuel is too high iii. Others, please specify------------------------------------------------------------------
6. Incase LPG is not used at all, what is the reason for the same?
i. High upfront cost of connection ii. High refill cost iii. Difficult to get iv. Have no ID/or required documents--------- v. Others, please specify-------------------------------------------------------------------
72

Regulator Stove Others
Reliable Non-reliable
LPG Usage
7. How do you acquire LPG?
i. Door to door delivery service ii. LPG outlets ii. Grocery shops iii. Others----------------------------------------------------------
8. What size of cylinder you use?
i. 3 Kg ii. 7 Kg iii. 11 Kg iv. Others--------------------------------
9. What size of cylinder you prefer? Why
---------------------------------------------------------------------------------------------------------------------------------------- ---------------------------------------------------------------------------------------------------------------------------------------- ----------------------------------------------------------------------------------------------------------------------------------
10. How much did you pay for acquiring it initially? -------------------
11. What was the cost incurred to buy the following?
12. How much do you pay for a refill? ------------------
13. How long does it take to get the refill? ---------------------------
14. Are there any issues related to refilling? Please elaborate
---------------------------------------------------------------------------------------------------------------------------------------- ---------------------------------------------------------------------------------------------------------------------------------------- ----------------------------------------------------------------------------------------------------------------------------------
15. How long does the refill last? ------------------------------
16. What is your perception on the LPG cost?
Expensive Cheap Increasing Decreasing Difficult to Pay
17. How is the supply of LPG?
73

Charcoal Usage (Ask the following questions if charcoal is used otherwise skip this section)
18. How do you acquire charcoal?
i. Buy from market ii. Collect it from somewhere-------------
19. How much does it cost? ----------------------------------
20. How long does it last? ------------------------------------
21. Do you face any issues in accessing charcoal? Please elaborate
---------------------------------------------------------------------------------------------------------------------------------------- ---------------------------------------------------------------------------------------------------------------------------------------- ----------------------------------------------------------------------------------------------------------------------------------
Firewood Usage (Ask the following questions if firewood is used otherwise skip this section)
22. How do you acquire charcoal?
i. Buy from market ii. Collect it from somewhere-------------
23. How much does it cost? ----------------------------------
24. How long does it last? ------------------------------------
25. Do you face any issues in accessing firewood? Please elaborate
---------------------------------------------------------------------------------------------------------------------------------------- ------------------------------------------------------------------------------------------------------------------------------------
Electricity Usage
26. How do you acquire electricity?
i. Metered connection ii. Others------------------------------------------------------------------
27. Which electric appliance does the household possess?
Air Conditioner Light Bulb Compact Fluorescent Microwave oven Computer Radio Electrical pot Refrigerator Electrical Stove Toaster Fan TV Fluorescent Video/VCD/DVD Player Gas Stove Washing Machine Iron Water boiler
74

Reliable Non-reliable
For metered connection
28. For how long have you had the electricity connection? --------------------------------
29. How much did you pay while acquiring the connection? -----------------------------------
30. Was the cost of wiring and meter included in the cost? Yes--------- No------------
If No then how much did you pay extra for the wiring and meter------------------------------
31. What documents did you require to get the metered connection?
---------------------------------------------------------------------------------------------------------------------------------------- ---------------------------------------------------------------------------------------------------------------------------------------- ----------------------------------------------------------------------------------------------------------------------------------
32. What is your average monthly bill amount? (Request them to produce recent bills)
Bill Frequency Units consumed Bill amount
33. What is your perception on the electricity tariff?
Expensive Cheap Increasing Decreasing Difficult to Pay
34. Do you experience power cuts often? Yes-------- No----------
If yes then at what frequency? ---------------------------------
How is the supply?
35. Incase of interrupted power supply, who do you complain to? ----------------------------
36. Are your complaints timely and satisfactorily resolved? --------------------------------------------------------- ---------------------------------------------------------------------------------------------------------------------------------------- ----------------------------------------------------------------------------------------------------------------------------------
For Non-metered connection
37. How do you acquire electricity?
i. Neighbor ii. Middleman iii. Contractor iv. Others --------------------
38. How much did you have to pay upfront to acquire the connection? -----------------------
75

39. How do you pay the recurring cost of electricity?
Weekly-------------- Monthly--------------- Bi-monthly--------------
40. How much is the cost? ----------------------------
41. What is the basis for this cost? ------------------------------------------------------------------------------------------ ---------------------------------------------------------------------------------------------------------------------------------------- ---------------------------------------------------------------------------------------------------------------------------------
42. Do you have continuous electricity supply? Yes-------- No-----------
43. Do you experience power cuts often? Yes-------- No-----
If Yes then at what frequency? ---------------------
44. Would you be willing to take metered connection? Yes----- No---------
45. If Yes, how much are you willing to pay for it? ---------------------------
If No, then why? ----------------------------------------------------------------------------------------------------------------- ---------------------------------------------------------------------------------
46. What issues do you face in terms of electricity access? Please elaborate------------------------------------ ---------------------------------------------------------------------------------------------------------------------------------------- ---------------------------------------------------------------------------------------------------------------------------------------- --------------------------------------------------------------------------------------------------------------------------------
Energy for Transportation
47. Do you own any vehicle? Yes----------- No-------------
If Yes, which one? Motorbike------ Car--------
Mini-truck---- Van----- Others---------
48. How much is your average monthly transportation expenditure? ---------
Productive Usage of Energy
49. Have you generated any extra income due to access of energy (e.g. food stalls, stores etc)
No--------- Yes---------- Amount (per month)------------
If Yes, do you own any of the following
i. Workshops ii. Food stalls iii. Small stores iv. Others-------------
76

Fear of Eviction
50. Do you have any fear of eviction or resettlement while living in slum areas?
No---- Yes, Why----------------------------------------------------------------------------------------------------------------- ----------------------------------------------------------------------------------------------------------------------------- -----------------------------------------------------------------------------------------------------------------------
Does the fear affect your decision in regards to the use/access of energy? ---------------------------- ----------------------------------------------------------------------------------------------------------------------------- ----------------------------------------------------------------------------------------------------------------------------- --------------------------------------------------------------------------------------------------------------------
53. Do you have anything to say regarding the energy cost or access? Yes------ No-----
Please elaborate---------------------------------------------------------------------------------------- ---------------------------------------------------------------------------------------------------------------------------------------- ------------------------------------------------------------------------------------------------------------------------------------
52. Electric appliance Visually examine what sources of electricity are used in the household Visually examine the appliance efficiency (e.g. use of CFC bulbs) in the household
77

Picture Story
Picture 1: The squatter community in the land belonging to Railway Authority
Picture 2: The slum community (after slum up gradation programme) in a land rented from the Port Authority
78

Photo 3: Productive use of energy. Charcoal used for grilling meat and cooking rice
Photo 4: Productive use of energy. LPG used in street food stall
79

Photo 5: Metered connection of electricity through neighbour’s electricity line
Photo 6: LPG delivery (large and small cylinders) in the urban poor doorsteps
80

Photo 7: Small LPG cylinder with stove attached on top for household cooking
Photo 8: Community leader of the slum community in front of the office of the cooperative, announcing the community about the present study (UPEA)
81