energy performance of buildings group heating, ventilating, & air-conditioning: diagnostics...
TRANSCRIPT

Energy Performance of Buildings Group
Heating, Ventilating, & Air-Conditioning: Diagnostics & Controls to ImproveAir-Handling System Performance
Craig Wray, P.Eng.
Indoor Environment DepartmentLawrence Berkeley National Laboratory
Tel: 510-486-4021 Email: [email protected] http://epb.lbl.gov
American Physical Society Short CoursePhysics of Sustainable Energy: Using Energy Efficiently and Producing It Renewably
UC Berkeley, 1 March 2008

AcknowledgmentsAcknowledgments
• Assistant Secretary for Energy Efficiency and Renewable Energy, Office of the Building Technologies Program, U.S. Department of Energy
• California Energy Commission PIER Program
• Max Sherman, Iain Walker, Darryl Dickerhoff (LBNL)
• Cliff Federspiel (Federspiel Controls)
Energy Performance of Buildings Group

OverviewOverview
• Background– Opportunities for improvement
• Duct Leakage Diagnosis– Measuring leakage flows using the DeltaQ test
• Duct Pressure Diagnosis & Control– Demand-based reset with DDC/non-DDC controls
• Ventilation Control– Intermittent ventilation and efficacy
Energy Performance of Buildings Group

Opportunities for ImprovementOpportunities for Improvement• Duct Leakage and Operating Pressure
– Thousands of field assembled joints– System pressures not uniform or constant; impossible
to know location of each leak and pressure difference across each leak
– Unnecessarily closed dampers restrict flow– Large energy savings possible from sealing ducts and
optimizing duct static pressures
• Ventilation– Standards specify constant ventilation rates– Energy intensive process; sometimes can reduce IAQ– Intermittent ventilation more appropriate in some cases
Energy Performance of Buildings Group

OverviewOverview
• Background– Opportunities for improvement
• Duct Leakage Diagnosis– Measuring leakage flows using the DeltaQ test
• Duct Pressure Diagnosis & Control– Demand-based reset with DDC/non-DDC controls
• Ventilation Control– Intermittent ventilation and efficacy
Energy Performance of Buildings Group

Why Use DeltaQ Duct Leakage Test?Why Use DeltaQ Duct Leakage Test?
• Fast and easy– No register covering (less damage potential)– Coincidentally measures envelope leakage– Uses familiar equipment (blower door)– Self-diagnostic for uncertainty– Can be automated
• Accurate– Leaks to outside under operating conditions
• BUT…– Need a computer– Need to operate central blower
Energy Performance of Buildings Group
PressurizingAirflow
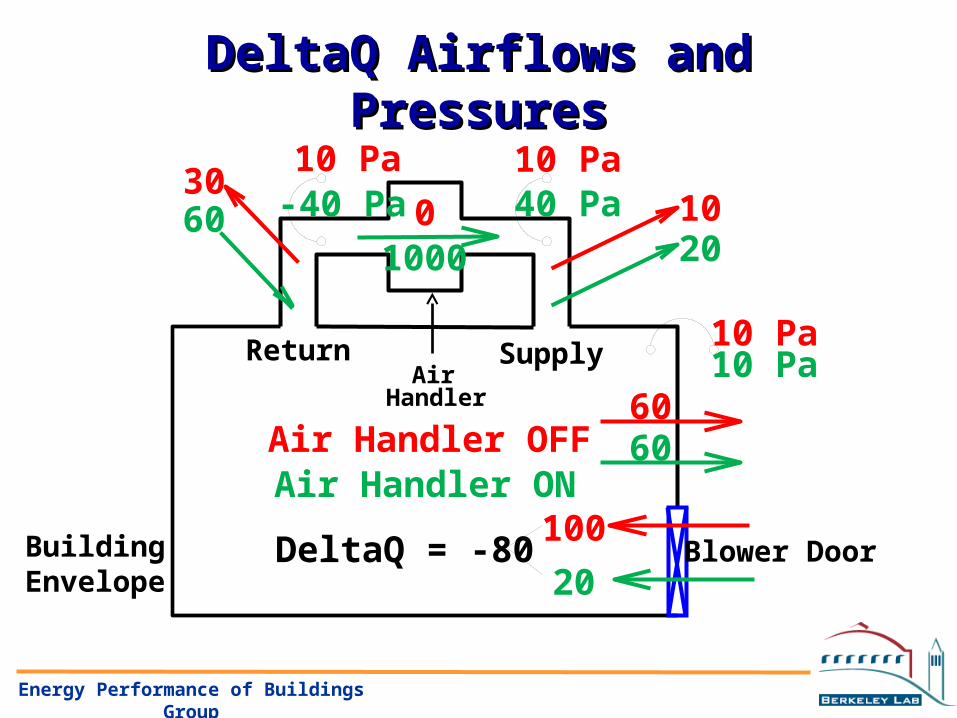
DeltaQ Airflows and PressuresDeltaQ Airflows and Pressures
Energy Performance of Buildings Group
AirHandler
Blower DoorDeltaQ = -80100
Air Handler OFF
10 Pa
030
10 Pa10
10 Pa
6010 Pa
20
Air Handler ON
2040 Pa
100060 -40 Pa
60
BuildingEnvelope
SupplyReturn

DeltaQ Test DataDeltaQ Test Data• Green = blower on• Red = blower off• Difference = DeltaQ
Energy Performance of Buildings Group

DeltaQ ModelDeltaQ Model
DeltaQ(P)=Qon(P)-Qoff(P)
Qon(P)=Qenv(P) + Cs(P+Ps)ns + Cr(P-Pr)nr
P = Envelope added pressurePs = Supply PressurePr = Return Pressure
Cs=Supply leak coefficientCr=Return leak coefficientQs=Supply leak flowQr=Return leak flow
Q=C(P)n
Qoff(P)=Qenv(P) + Cs(Pns) + Cr(Pnr)
DeltaQ(P)=Cs((P+Ps)ns-Pns) + Cr((P-Pr)nr-Pnr)
DeltaQ(P)=Qs((1+P/Ps)ns-(P/Ps)ns) - Qr((1-P/Pr)nr+(P/Pr)nr)
Energy Performance of Buildings Group

Pressure Scanning Error SurfacePressure Scanning Error Surface
Energy Performance of Buildings Group
Ps Pr
Solution at lowest error
For each supply and returnpressure pair, the least squareserror is calculated by comparingthe estimated ΔQ to the measured ΔQ
Error
0
0.1
0.2
0.3
0.4
0.5
0.6
0.7
-5 -4 -3 -2 -1 0 1 2 3 4 5
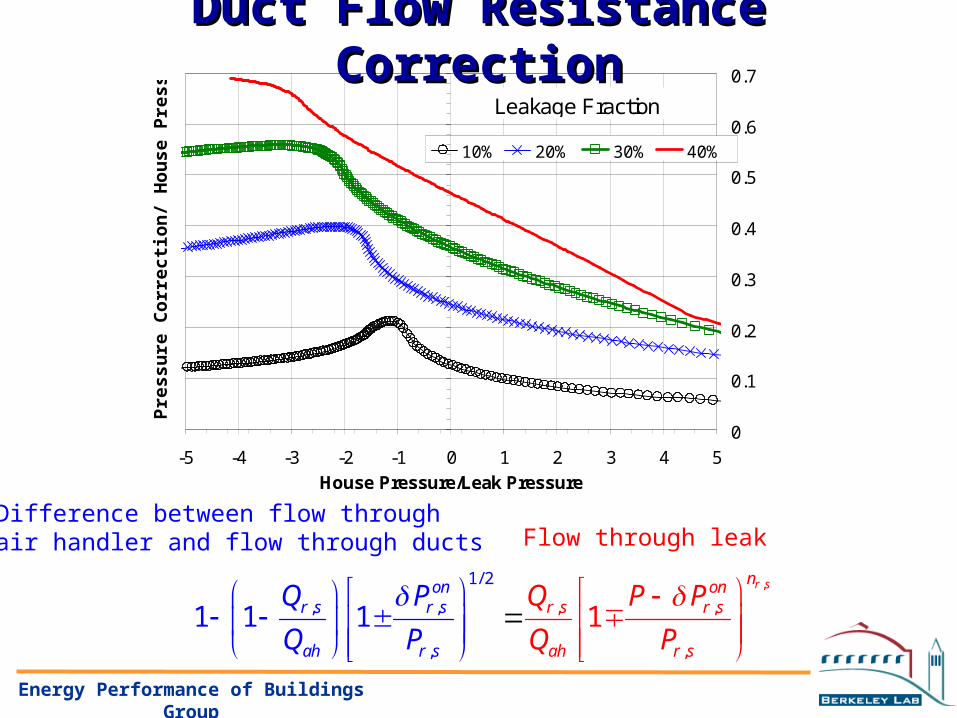
House Pressure/Leak Pressure
Pre
ssu
re C
orr
ecti
on
/ H
ou
se P
ress
ure
10% 20% 30% 40%
Leakage Fraction
Duct Flow Resistance CorrectionDuct Flow Resistance Correction
,1/
, ,
,
, ,
2
,
1 1 11r son
r s
nonr s r s
ah
r s
a s sr rh
Q PP
Q
P
Q P
Q
P
Flow through leakDifference between flow throughair handler and flow through ducts
Energy Performance of Buildings Group

OverviewOverview
• Background– Opportunities for improvement
• Duct Leakage Diagnosis– Measuring leakage flows using the DeltaQ test
• Duct Pressure Diagnosis & Control– Demand-based reset with DDC/non-DDC controls
• Ventilation Control– Intermittent ventilation and efficacy
Energy Performance of Buildings Group

Variable-Air-VolumeVariable-Air-VolumeSystem SchematicSystem Schematic
Energy Performance of Buildings Group
Return Fan
Supply FanCooling Coil
MixingBox
Air Filter
MinimumOA
EconomizerOA
ReliefAir
Ce
iling
Plen
um
Zone P1
Zone P2
Zone P3
Zone P4
Zone C1
ReturnAir
SupplyAir
ReheatBoxes
DownstreamLeakage
UpstreamLeakage
10.9 C19.9 C
22.7 C
22.4 C
11.7 C
23.5 C
23.2 C
21.9 C
23 C
24.9 C
11.7 C
11.7 C
11.7 C
11.7 C
11.7 C
19.9 C
0 kg/s
5.79 kg/s
1.04 kg/s
5.79 kg/s
5.79 kg/s
MassFlow
Temp.
0.64 kg/s0.71 kg/s
0.87 kg/s
0.96 kg/s
1 kg/s
1.11 kg/s
0.97 kg/s
1.08 kg/s
1.1 kg/s
1.22 kg/s
0.51 kg/s
0.71 kg/s
5.79 kg/s
-82800 W
0 W
0 W
0 W
0 W
0 W 6350 W
Coil Load
Load
4500 W
1620 W
Power
22.7 C
19.9 C
4.75 kg/s
7630 W
9970 W
10270 W
11100 W
14650 W
83% flow
79% flow
79% flow
91% flow
80% flow
71% flow
Lighting Load
Legend
VAV Duct Leakage Case: 10% Upstream / 10% Downstream (7 am, July 29)
(1 1/ )n
system system
Q P QW
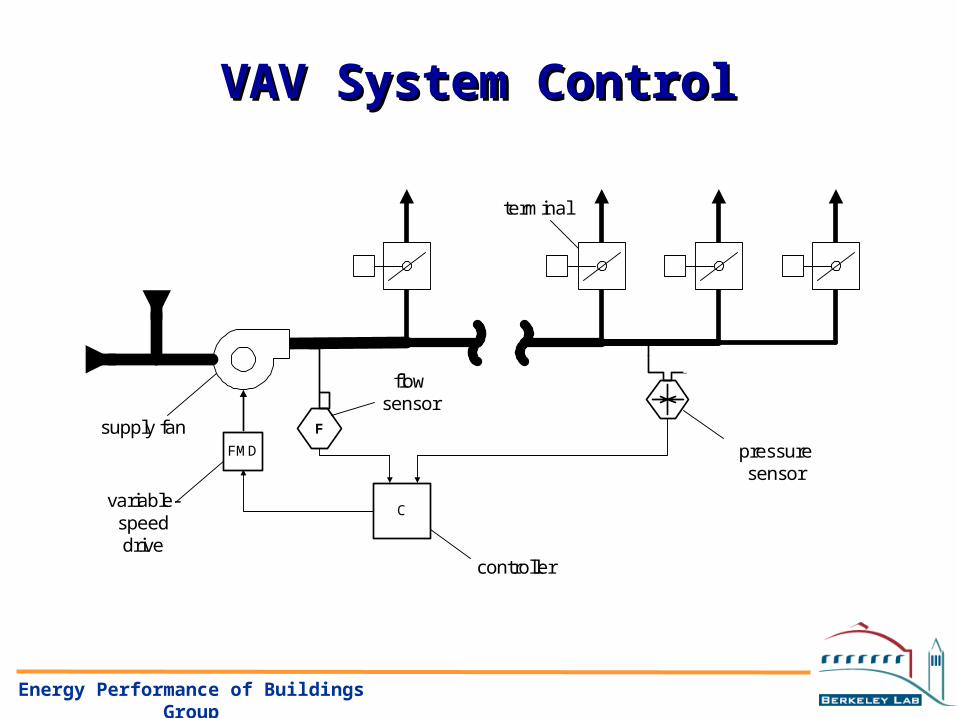
VAV System ControlVAV System Control
C
F
FMD
supply fan
terminal
pressuresensor
flowsensor
variable-speeddrive
controller
Energy Performance of Buildings Group

Duct Static Pressure Reset IssuesDuct Static Pressure Reset Issues• DDC systems with reset capability already exist, but
suffer from:– Inaccurate, open-loop position measurement
– Failures at terminal boxes
– Limited bandwidth and limited programming capabilities
• Many systems have pneumatic terminal controls
• Using total supply airflow signal from airflow station expands reset applicability
• Aggregation of terminal box flows makes control more robust to single terminal failure
Energy Performance of Buildings Group
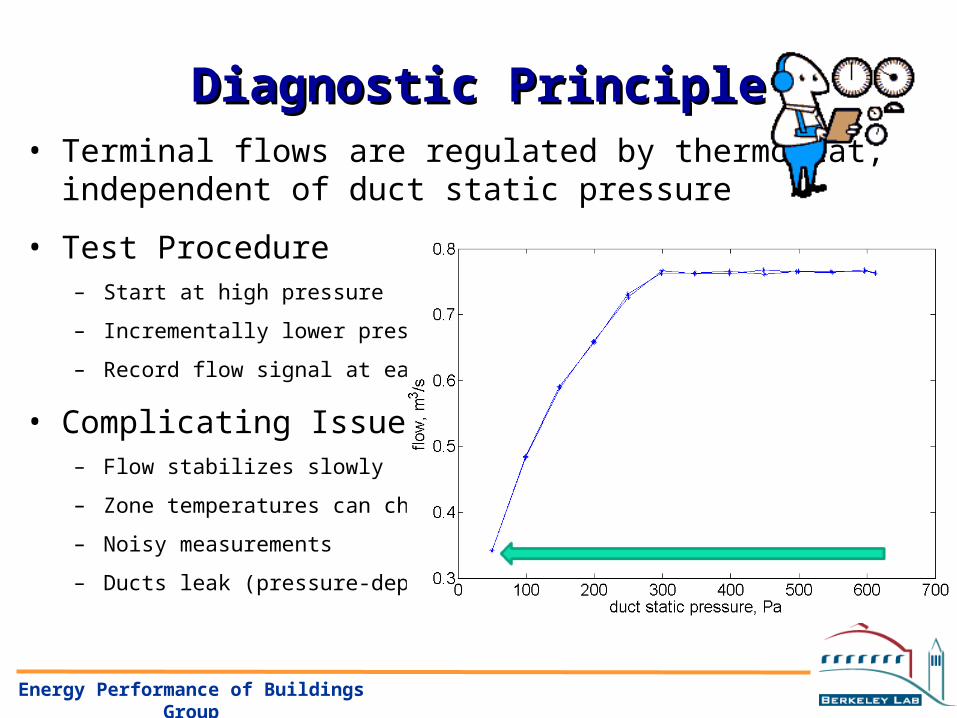
Diagnostic PrincipleDiagnostic Principle• Terminal flows are regulated by thermostat,
independent of duct static pressure
• Test Procedure– Start at high pressure
– Incrementally lower pressure
– Record flow signal at each step
• Complicating Issues– Flow stabilizes slowly
– Zone temperatures can change
– Noisy measurements
– Ducts leak (pressure-dependent)
Energy Performance of Buildings Group

Diagnostic: Dual-Model EstimationDiagnostic: Dual-Model Estimation• Model components
1. Constant component2. Time-varying component3. Leakage flow4. Starved behavior
• “In-Control”:
• “Starved”:
• At critical pressure, both models predict same flow; solve for transition using least squares fit
0.4
0.5
0.6
0.7
0.8
0.9
1
1.1
0 50 100 150 200 250 300 350
supply duct static pressure, Pa
sup
ply
du
ct f
low
, m3 /s
in-control
critical pressurestarved
Energy Performance of Buildings Group
0N
c t pQ Q C T C P
1 20 1 2
0
1N N N NtS p
C TQ C P C P C P C P
Q

11000
11500
12000
12500
13000
13500
14000
14500
15000
0.2 0.3 0.4 0.5 0.6 0.7 0.8
supply duct static pressure, in. w.c.
su
pp
ly d
uc
t a
irfl
ow
, CF
M
starved
in control
critical pressure
operatingpressure
Haas School of BusinessHaas School of Business
Energy Performance of Buildings Group

UCOPUCOP
0
20000
40000
60000
80000
100000
120000
140000
0 0.2 0.4 0.6 0.8 1 1.2static pressure, in. w.c.
sup
ply
air
flo
w, C
FM
starved
in-control
operatingpressure
criticalpressure
Energy Performance of Buildings Group
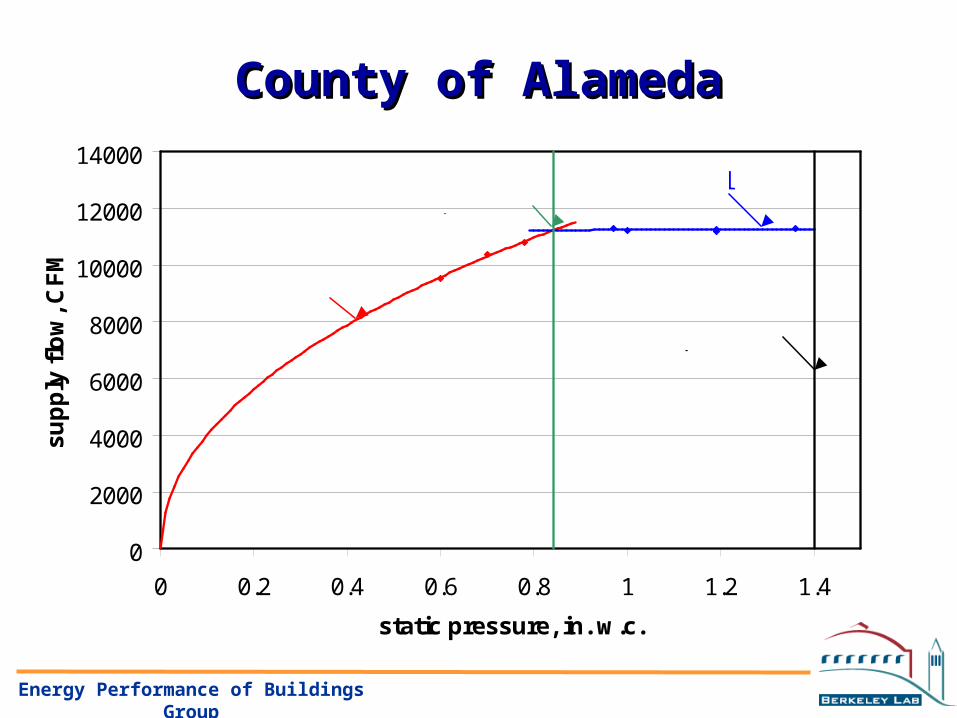
County of AlamedaCounty of Alameda
0
2000
4000
6000
8000
10000
12000
14000
0 0.2 0.4 0.6 0.8 1 1.2 1.4
static pressure, in. w.c.
sup
ply
flo
w, C
FM
starved
criticalpressure
in-control
operatingpressure
Energy Performance of Buildings Group
OverviewOverview
• Background– Opportunities for improvement
• Duct Leakage Diagnosis– Measuring leakage flows using the DeltaQ test
• Duct Pressure Diagnosis & Control– Demand-based reset with DDC/non-DDC controls
• Ventilation Control– Intermittent ventilation and efficacy
Energy Performance of Buildings Group

Intermittent Ventilation:Intermittent Ventilation:When Steady Won’t Always DoWhen Steady Won’t Always Do
• Ventilation (for acceptable IAQ) should not always be constant
• May be periods of the day when outdoor air (OA) quality is poor and one wishes to reduce amount of OA entering building
• Economizer operation can over-ventilate a space from IAQ point of view; energy savings can be achieved by reducing ventilation rates at other times to account for over-ventilation
• Demand charges or utility peak loads may make it advantageous to reduce ventilation for certain periods of the day
• Some HVAC equipment may make cyclic ventilationmore attractive than steady-state ventilation
– Example: residential or small commercial systems that coupleventilation to heating and cooling system operation
Energy Performance of Buildings Group

What’s The Problem?What’s The Problem?• Constant target ventilation (Aeq)
• Intermittent ventilation with cycle time (Tcycle),over-ventilation (Ahigh) for fractional time fhigh, andunder-ventilation (Alow) for fractional time flow
• Equivalency = same dose for constant contaminant source– Sherman & Wilson (1986); Std 136
• Means to demonstrate equivalency not obvious:– Designers want flexibility to use intermittent ventilation, but also
want to follow standards & guidelines
– Average not always same as constantEnergy Performance of Buildings Group

Efficacy is LinkEfficacy is Link• Provide calculation method to assess equivalency
– Find the temporal ventilation effectiveness (“efficacy”)of a given pattern of ventilation
• Definition:
• Typical Use:
(1 )eq
low low low high
A
f A f A
/
(1 )eq low low
highlow
A f AA
f
Energy Performance of Buildings Group
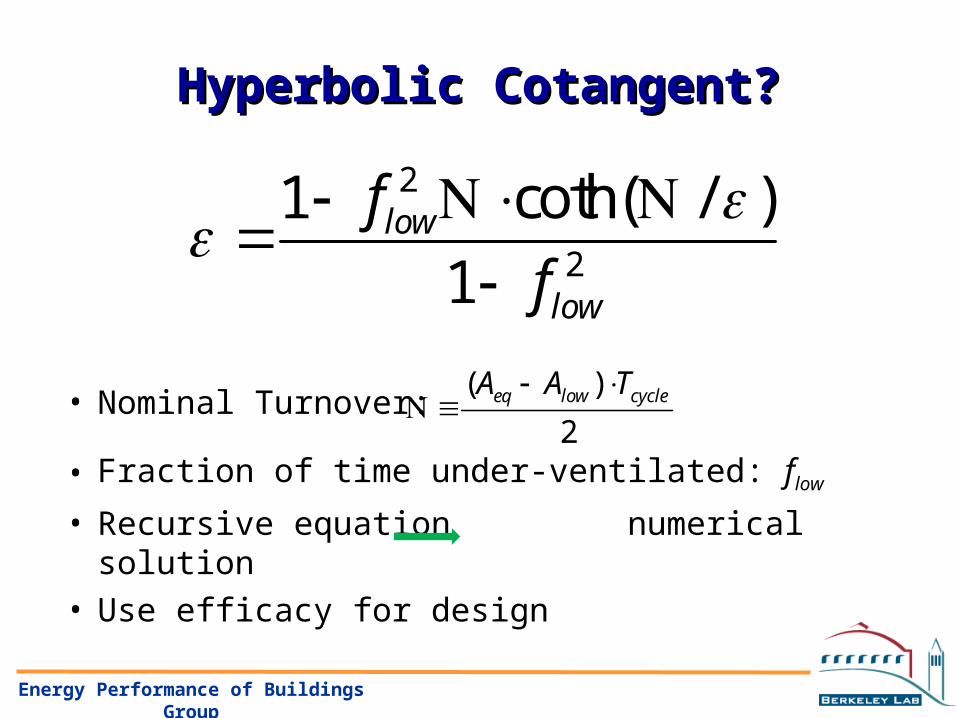
Hyperbolic Cotangent?Hyperbolic Cotangent?
• Nominal Turnover:
• Fraction of time under-ventilated: flow
• Recursive equation numerical solution• Use efficacy for design
2
2
1 coth( / )
1low
low
f
f
( )
2eq low cycleA A T
Energy Performance of Buildings Group
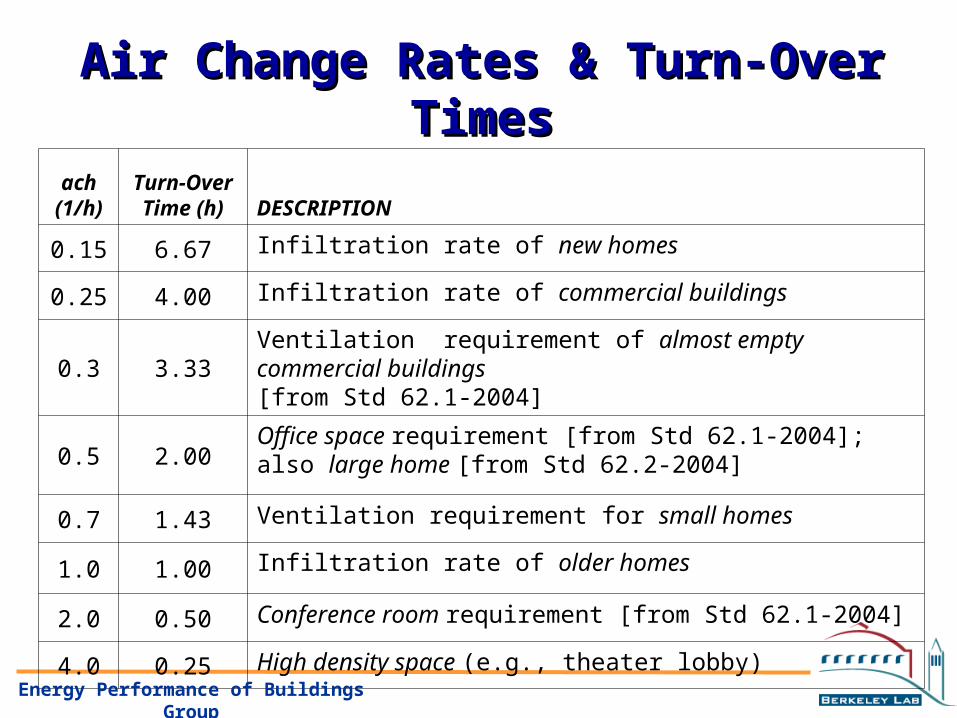
Air Change Rates & Turn-Over TimesAir Change Rates & Turn-Over Timesach (1/h)
Turn-Over Time (h) DESCRIPTION
0.15 6.67 Infiltration rate of new homes
0.25 4.00 Infiltration rate of commercial buildings
0.3 3.33Ventilation requirement of almost empty commercial buildings[from Std 62.1-2004]
0.5 2.00Office space requirement [from Std 62.1-2004];also large home [from Std 62.2-2004]
0.7 1.43 Ventilation requirement for small homes
1.0 1.00 Infiltration rate of older homes
2.0 0.50 Conference room requirement [from Std 62.1-2004]
4.0 0.25 High density space (e.g., theater lobby)
Energy Performance of Buildings Group
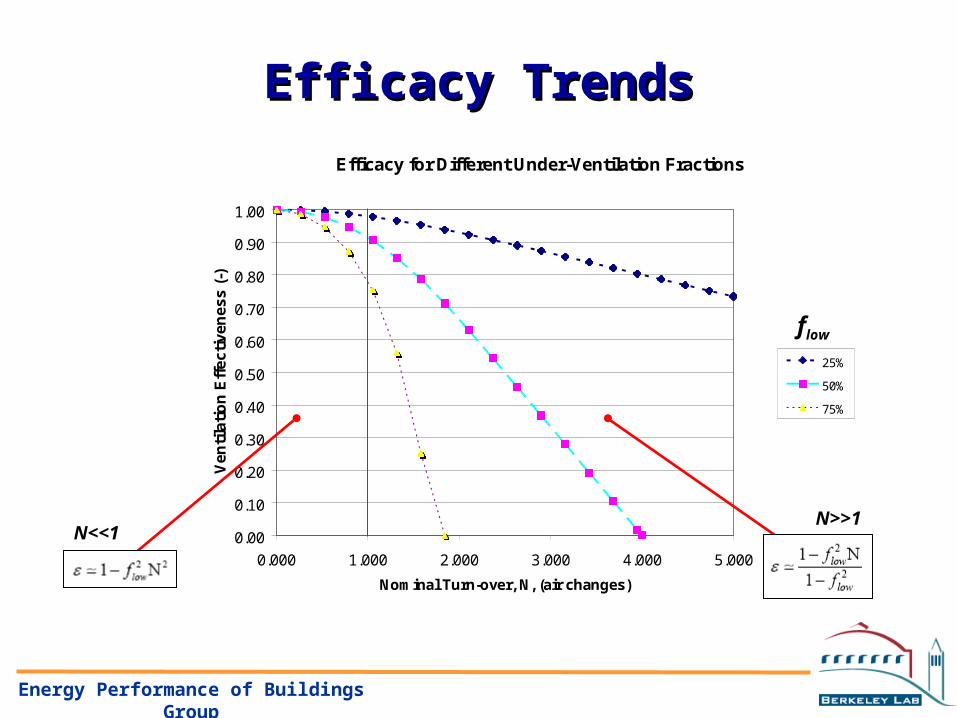
Efficacy TrendsEfficacy Trends
Energy Performance of Buildings Group
Efficacy for Different Under-Ventilation Fractions
0.00
0.10
0.20
0.30
0.40
0.50
0.60
0.70
0.80
0.90
1.00
0.000 1.000 2.000 3.000 4.000 5.000
Nominal Turn-over, N, (air changes)
Ve
nti
lati
on
Eff
ec
tiv
en
es
s (
-)
25%
50%
75%
N<<1N>>1
flow

Notch Ventilation at Various Air Change Rates
1
2
3
4
5
6
0 2 4 6 8Under-Ventilation Time (h)
Ve
nti
lati
on
Mu
ltip
liie
r(-)
0.5 ACH
1.0 ACH
0.5 ACH wi/ infiltration
1.0 ACH w/ infiltration
Energy Performance of Buildings Group

Energy Performance of Buildings Group
90% Efficacy at Various Air Change Rates
0.00
0.10
0.20
0.30
0.40
0.50
0.60
0.70
0.80
0.90
1.00
0 4 8 12 16 20 24
Cycle Time (h)
Un
der
-ven
tila
tio
n F
ract
ion
(-)
0.350.5124
ε > 90% for region to left and below each curve

Energy Performance of Buildings Group
Maximum Under-Ventilation
0
2
4
6
8
10
12
0 4 8 12 16 20 24
Cycle Time (h)
Un
der
Ve
nti
lati
on
Tim
e (
h)
No max
0.35
0.5
1
2
4
Low-Density Spaces
High-Density Spaces
Energy Performance of Buildings Group
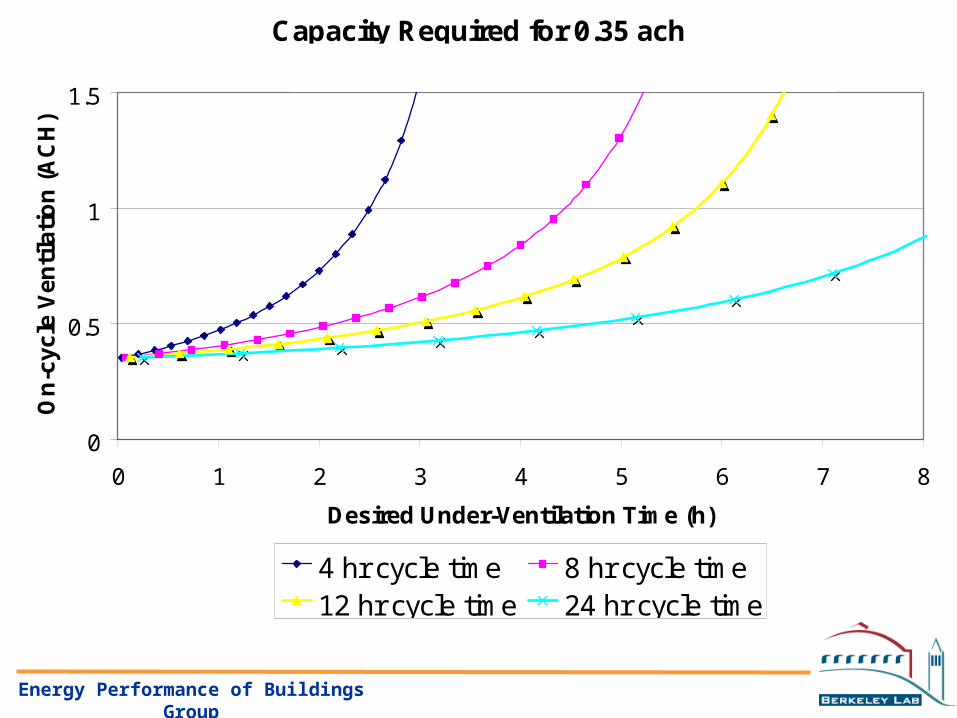
Capacity Required for 0.35 ach
0
0.5
1
1.5
0 1 2 3 4 5 6 7 8
Desired Under-Ventilation Time (h)
On
-cy
cle
Ve
nti
lati
on
(A
CH
)
4 hr cycle time 8 hr cycle time12 hr cycle time 24 hr cycle time

Questions?Questions?
• Background– Opportunities for improvement
• Duct Leakage Diagnosis– Measuring leakage flows using the DeltaQ test
• Duct Pressure Diagnosis & Control– Demand-based reset with DDC/non-DDC controls
• Ventilation Control– Intermittent ventilation and efficacy
Energy Performance of Buildings Group