energy monitoring hub data acquisition server installation ... · energy monitoring hub – data...
TRANSCRIPT

Energy Monitoring Hub – Data Acquisition Server
Installation and Operation Manual
Model A8812

Warranty Information
LIMITED FIVE YEAR WARRANTY AND EXCLUSIONS Leviton warrants to the original consumer purchaser and not for the benefit of anyone else that this product at the time of its sale by Leviton is free of defects in materials and workmanship under normal and proper use for five years from the purchase date. This Warranty is limited to repair or replacement of defective equipment returned Freight Pre-Paid to Leviton Manufacturing at 20497 SW Teton Ave., Tualatin, Oregon 97062, USA. User shall call 1-800-959-6004 and request a return authorization number to mark on the outside of the returning carton, to assure that the returned material will be properly received at Leviton. All equipment shipped back to Leviton must be carefully and properly packed to avoid shipping damage. Replacements or repaired equipment will be returned to sender freight prepaid, F.O.B. factory. Leviton is not responsible for removing or replacing equipment on the job site, and will not honor charges for such work. Leviton will not be responsible for any loss of use time or subsequent damages should any of the equipment fail during the warranty period, but agree only to repair or replace defective equipment returned to its plant in Tualatin, Oregon. This Warranty is void on any product that has been improperly installed, overloaded, short circuited, abused, or altered in any manner. Neither the seller nor Leviton shall be liable for any injury, loss or damage, direct or consequential arising out of the use of or inability to use the equipment. This Warranty does not cover lamps, ballasts, and other equipment which is supplied or warranted directly to the user by their manufacturer. Leviton makes no warranty as to the Fitness for Purpose or other implied Warranties. Notice Although the information contained within this operation manual is believed to be accurate at the time of printing, it is not guaranteed to be without fault and is subject to change without notice. For current information contact: Leviton Lighting & Energy Solutions Division 20497 SW Teton, Tualatin, OR 97062 Mailing Address: PO Box 2210 Tualatin, OR 97062 Customer Service: (800)736-6682 Technical Support: (800)959-6004 Fax: (503)404-5601
Email: [email protected] Internet: www.leviton.com Copyright © 2011 Leviton Manufacturing Company Incorporated. All Rights Reserved.
DANGER
Hazard of Electric Shock, Explosion or Arc Flash
Follow safe electrical work practices. See NFPA 70E in the USA, or applicable local codes. This equipment must only be installed and serviced by qualified electrical personnel. Read, understand and follow the instructions before installing this product. Turn off all power supplying equipment before working on or inside the equipment. Use properly rated voltage
sensing device to confirm power is off. DO NOT DEPEND ON THIS PRODUCT FOR VOLTAGE INDICATION Only install this product on insulated conductors. Failure to follow these instructions will result in death or serious injury.
NOTICE
This product is not intended for life safety applications. Do not install this product in hazardous or classified locations. The installer is responsible for conformance to all applicable codes.

FCC Part 15 Information
Note: This equipment has been tested by the manufacturer and found to comply with the limits of a class A digital device, pursuant to part 15 of the FCC rules. These limits are designed to provide reasonable protection against interference when the equipment is operated in a commercial environment. This equipment generates, uses, and can radiate radio frequency energy and, if not installed and used in accordance with the instruction manual, may cause harmful interference to radio communications. Operation of this equipment in a residential area is likely to cause harmful interference in which case the user will be required to correct the interference at their expense.
Modifications of this product without the express authorization of Leviton nullify this statement.

Table of Contents
Overview .......................................................................................................................................................................................................... 5 Installation Checklist ........................................................................................................................................................................................ 5 Markings and Symbols: .................................................................................................................................................................................... 5 Hardware Overview .......................................................................................................................................................................................... 6
A8812 Features and Specifications ...................................................................................................................................................... 6 Electrical Connections .......................................................................................................................................................................... 7 Hardware Installation ........................................................................................................................................................................... 7
Basic Network Configuration ......................................................................................................................................................................... 10 Laptop/Computer Setup ...................................................................................................................................................................... 11
Energy Monitoring Hub Administration Overview ........................................................................................................................................ 13 Security ........................................................................................................................................................................................................... 14 Modbus ........................................................................................................................................................................................................... 14
Modbus Device List ........................................................................................................................................................................... 14 Device List Options ................................................................................................................................................................ 15 Device Details ........................................................................................................................................................................ 16 Device Configuration ............................................................................................................................................................. 16 Advanced Configuration Options ........................................................................................................................................... 16 Manual Device Add Options .................................................................................................................................................. 17 Internal IO Configuration ....................................................................................................................................................... 18
Troubleshooting Modbus Devices ...................................................................................................................................................... 20 Modbus Setup ..................................................................................................................................................................................... 20 Alarm Setup ........................................................................................................................................................................................ 21 Modbus Framework............................................................................................................................................................................ 22
Wireless .......................................................................................................................................................................................................... 22 Sensor List .......................................................................................................................................................................................... 22 ModHopper Map ................................................................................................................................................................................ 22
Networking ..................................................................................................................................................................................................... 23 Network Status ................................................................................................................................................................................... 23 Ethernet setup ..................................................................................................................................................................................... 23 Troubleshooting Ethernet Problems ................................................................................................................................................... 23
System Options ............................................................................................................................................................................................... 24 Status .................................................................................................................................................................................................. 24 Processes ............................................................................................................................................................................................ 24 Date and Time .................................................................................................................................................................................... 24
Universal Time Is Your Friend............................................................................................................................................... 24 System logs ........................................................................................................................................................................................ 25 Firmware Update ................................................................................................................................................................................ 25
Diagnostics ..................................................................................................................................................................................................... 26 Host Lookup ....................................................................................................................................................................................... 26 Connection Test .................................................................................................................................................................................. 26
LCD Console .................................................................................................................................................................................................. 27 Log File Data .................................................................................................................................................................................................. 28
Log File Status.................................................................................................................................................................................... 28 Log File Format .................................................................................................................................................................................. 29 Log Storage Capacity ......................................................................................................................................................................... 30 Uploading data to the LEM website. .................................................................................................................................................. 31
Retrieving Data from the Energy Monitoring Hub ......................................................................................................................................... 32 HTTP Direct from the Energy Monitoring Hub ................................................................................................................................. 32 FTP Direct from the Energy Monitoring Hub .................................................................................................................................... 32 Enertrax download direct from the Energy Monitoring Hub .............................................................................................................. 32 HTTP/Post Upload To Energy Manager ........................................................................................................................................... 33 HTTP/Post Upload To Your Database Server .................................................................................................................................... 34 Removing Data from the Energy Monitoring Hub ............................................................................................................................. 34 Linking to Energy Monitoring Hub Device Status Pages ................................................................................................................... 34
Mechanical Drawings ..................................................................................................................................................................................... 35
Overview The Energy Monitoring Hub™ Data Acquisition Server is designed to allow owners and managers of commercial and industrial facilities with a cost-effective means of gathering crucial information in a timely manner. To meet these requirements, the Energy Monitoring Hub™ system provides the installer with all the tools necessary to install and configure the hardware and software with a minimum of time and investment.
Installation Checklist An Energy Monitoring Hub™ system installation has the following components:
Required hardware
Energy Monitoring Hub™ A8812 Data Acquisition Server (required) Data connection (Ethernet).
Ethernet Cat 5 cable (required for LAN or direct laptop-to-Energy Monitoring Hub connection) Optional hardware
Leviton Series 2000 and 3000 meters (Modbus RTU standard). Analog sensors for temperature, humidity, etc. Pulse output transducers for measuring gas, electricity, water, etc. from existing meters and sensors.
Next, choose one or more of the following connection methods.
For LAN installations only:
Ethernet 10/100Mbit connection point (hub or switch) IP address and Netmask (check with system administrator) Gateway address (check with system administrator) DNS server address (check with system administrator) HTTP Proxy address (optional), may be required if the Energy Monitoring Hub is behind a firewall (check with
system administrator)
Markings and Symbols: WARNING: A potential risk exists if the operating instructions are not followed
General Warning Symbol: This symbol indicates the need to consult the operating instructions provided with the
product.
This symbol indicates the presence of electric shock hazards.
This symbol indicates: Do not apply to or remove from hazardous live conductors. Direct Current symbol.

Hardware Overview
A8812 Features and Specifications
Processor Arm9 embedded CPU, Arm7 io coprocessor Operating System Linux 2.6 Memory 32 MB ram, 16 MB flash LED 8x input, 4 modem activity, Modbus TX/RX, power, system, io status Console 2 x 16 character LCD, two pushbuttons LAN RJ45 10/100 Ethernet, full half duplex, auto polarity Protocols Modbus/RTU, Modbus/TCP, TCP/IP, PPP, HTTP/HTML, FTP, NTP, XML, SNMP-Trap Power Supply 24VDC, 1A, class 2 wall brick transformer. North America: 110-120VAC, 60hz, primary. (standard, included) CE/Europe: 100-240VAC, 50-60hz, primary, with interchangeable plug adapters. (optional) Interval Recording User selectable 1-60 minutes. Default 15 minute interval Serial Port
1 RS-485 Modbus, supports up to 32 external devices (expandable)
Inputs1 8 flex-io inputs with multiple modes: voltage, current, resistance, pulse and status.
Voltage mode: 0-10vdc (min/max/average/instantaneous data) accuracy: +- 0.25% of full scale at 20ºc Current mode: 4-20mA (min/max/average/instantaneous data) accuracy: +- 0.25% of full scale at 20ºc Resistance mode: 100 ohms to 100k.
accuracy: 100 -1k +- 1% of 1k at 20ºc
1k – 10k +- 1% of 10k at 20ºc
10k – 47.5k +- 1% of 47.5k at 20ºc
47.5k – 100k +- 1% of 100k at 20ºc
100k 10M accuracy unrated. Pulse mode: intended for use with dry contact outputs. (consumption/rate/runtime/status) Standard and KYZ modes for form A and C relay outputs Input terminal supplies 3V ~ 5V at 5mA sense voltage to detect contact closures. Maximum rate: 10hz, minimum pulse width 50ms.
Adjustable contact closure threshold: 100 to 5k , broken wire sense above 10k optional. Pulse count and runtime values are stored in non-volatile memory. Outputs
1: 2 optically isolated outputs type: opto-fet, dry contacts. Rating: 30vdc, 150mA max.
Isolation2: The RJ45 Ethernet, RJ11 Modem, pulse outputs, and the primary side of the power adapter are
electrically isolated from the Energy Monitoring Hub main PCB board and inputs. Environmental North America: Indoor, temperature 0º - 50ºc, 0 - 95% humidity, non-condensing. CE/Europe: Indoor, temperature 5º - 40ºc, 0 - 90% humidity, non-condensing. EMC FCC CFR 47 Part 15, Class A
EN 61000, EN 61326 Size 8” x 9.25” x 2.5” (203mm x 235mm x 64mm) Mass 5lbs (2.3kg) 1 inputs are intended for low voltage class 2 outputs.
2 if the product is used in a manner not specified by the
manufacture, the protection provided by the equipment may be impaired.
A8812
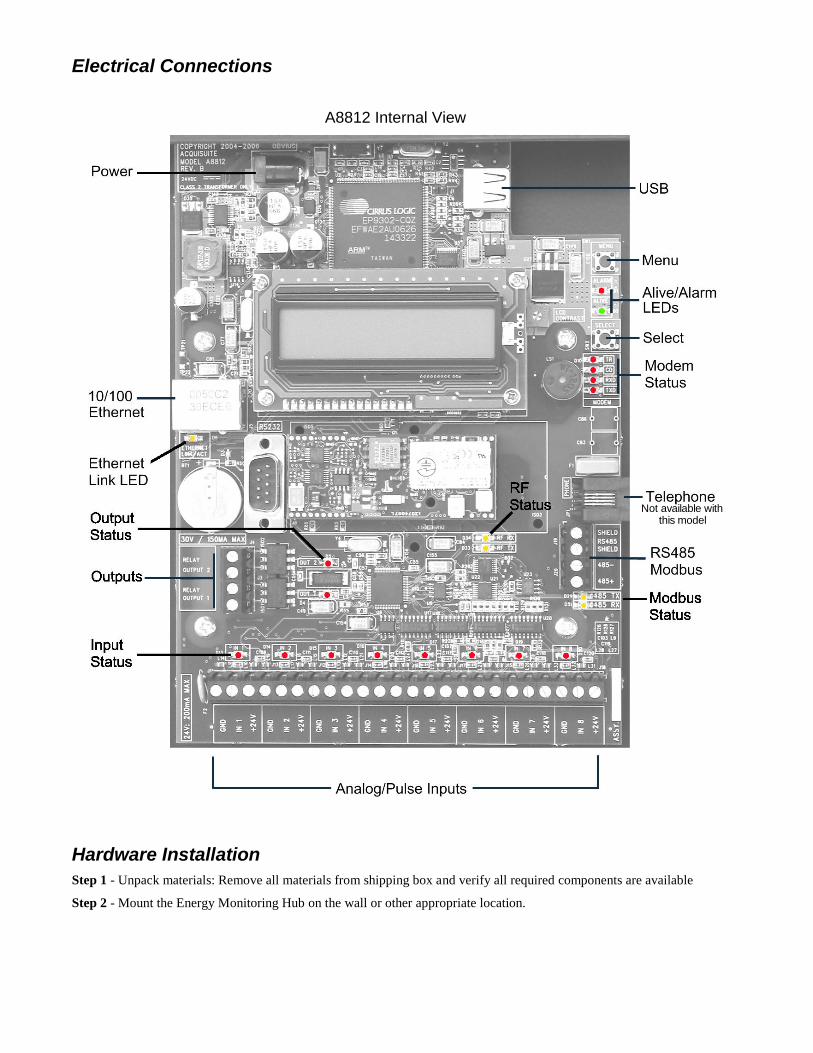
Electrical Connections
Not available with this model
A8812 Internal View
Hardware Installation
Step 1 - Unpack materials: Remove all materials from shipping box and verify all required components are available
Step 2 - Mount the Energy Monitoring Hub on the wall or other appropriate location.
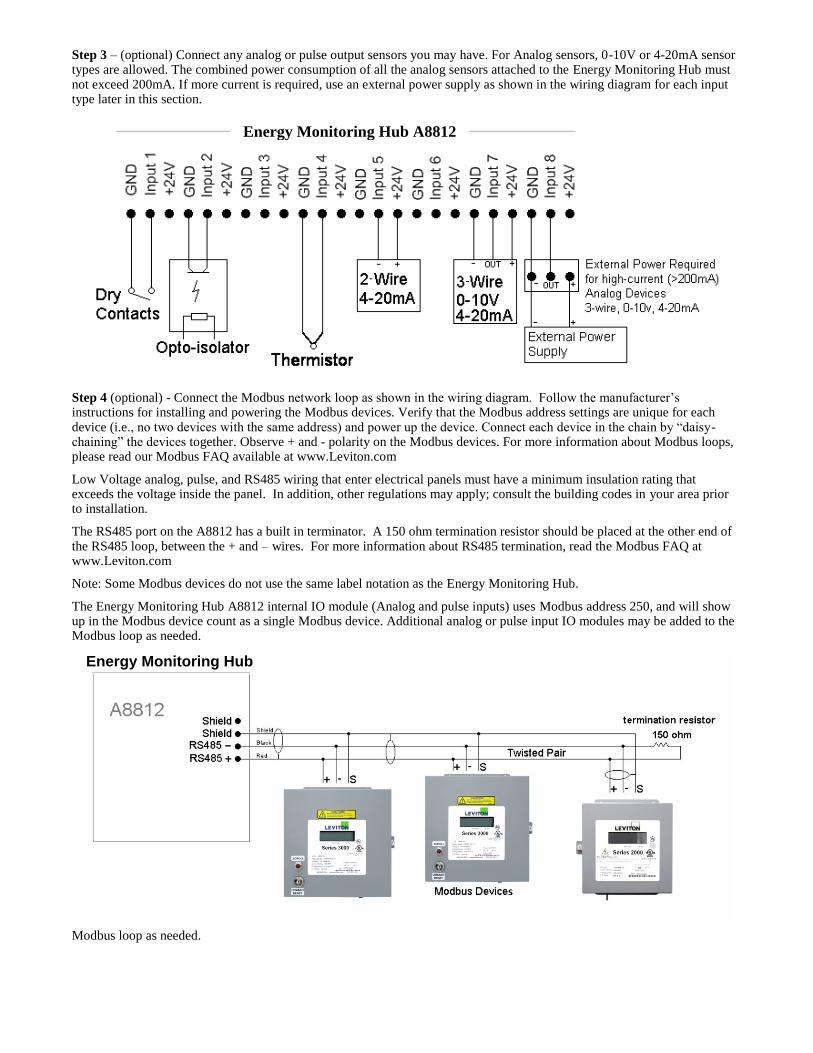
Step 3 – (optional) Connect any analog or pulse output sensors you may have. For Analog sensors, 0-10V or 4-20mA sensor types are allowed. The combined power consumption of all the analog sensors attached to the Energy Monitoring Hub must not exceed 200mA. If more current is required, use an external power supply as shown in the wiring diagram for each input type later in this section.
Step 4 (optional) - Connect the Modbus network loop as shown in the wiring diagram. Follow the manufacturer‟s instructions for installing and powering the Modbus devices. Verify that the Modbus address settings are unique for each device (i.e., no two devices with the same address) and power up the device. Connect each device in the chain by “daisy-chaining” the devices together. Observe + and - polarity on the Modbus devices. For more information about Modbus loops, please read our Modbus FAQ available at www.Leviton.com
Low Voltage analog, pulse, and RS485 wiring that enter electrical panels must have a minimum insulation rating that exceeds the voltage inside the panel. In addition, other regulations may apply; consult the building codes in your area prior to installation.
The RS485 port on the A8812 has a built in terminator. A 150 ohm termination resistor should be placed at the other end of the RS485 loop, between the + and – wires. For more information about RS485 termination, read the Modbus FAQ at www.Leviton.com
Note: Some Modbus devices do not use the same label notation as the Energy Monitoring Hub.
The Energy Monitoring Hub A8812 internal IO module (Analog and pulse inputs) uses Modbus address 250, and will show up in the Modbus device count as a single Modbus device. Additional analog or pulse input IO modules may be added to the Modbus loop as needed.
Energy Monitoring Hub
Modbus loop as needed.
Energy Monitoring Hub A8812

Step 5 - Power-up and diagnostics: Attach the power supply to the power input jack on the Energy Monitoring Hub, and plug the power brick into a wall outlet. The power brick should be in a location that is accessible for connection and disconnection. After power is applied, the green “Alive” light in the upper right of the Energy Monitoring Hub should come on and the LCD display will display a series of diagnostic screens ending with the following message on the LCD display (this boot sequence may require up to 20 seconds to complete):
AcquiSuite Ready
192.168.40.50
This indicates that the Energy Monitoring Hub has loaded properly and is ready for configuration and connection to the network and sensors. If the “Alive” light does not come on or the LCD display does not cycle to the above screen, verify that the power cord is plugged in. If after cycling the power the unit still does not power up (or if an error message appears in the LCD display), contact technical support. After the A8812 has been powered up for a minute, the green Alive LED should blink slowly once per second during normal operation.
Modbus TX/RX: The Modbus TX and RX LEDs blink to indicate data on the RS485/Modbus loop. The RX led blinks only when data is received by the Energy Monitoring Hub
Modem RTS: the modem is being monitored or operated by the Energy Monitoring Hub, off when the modem is idle. This LED will be on when a dialout call is in progress, or when dial in is enabled and waiting for an inbound call.
Modem CD: the modem has a carrier connection to a remote system.
Modem TX/RX: data is being sent or received on the modem.
Alive: blinks once per second while the system is operating correctly.
Alarm: blinks to indicate a problem.
Inputs 1-8: in pulse or status mode, the LED is on when contacts are closed. In analog 4-20mA and 0-10V mode, the led blinks quickly (2 Hz) to indicate an over-range alarm error. In 4-20mA mode when the input current is less than 4mA, or in resistance mode where the input resistance is above 10Mohm, the led will blink a pattern (blink, blink, off) to indicate a broken wire alarm.
Ethernet Link/Act: On when connected to a hub or switch, off when not connected. Blinks when LAN traffic is being sent or received.
RS485 RX/TX. The 485TX led should blink slowly once per second during normal operation. The RX led will blink when external Modbus devices communicate with the Energy Monitoring Hub.
RF TX / RF RX: If the A8812 has a built-in ModHopper option with an on-board radio, the RF LEDs will blink showing transmit and receive packets.
Step 6 - Verify connected devices: To verify that the Modbus devices are installed and reporting correctly, use the Modbus status utility on the Energy Monitoring Hub server. To do this test, follow these steps:
A. Press and release the menu (top) button on the Energy Monitoring Hub. The following will appear on the LCD display:
[Main Menu]
TCP/IP Config
B. Press the menu (top) button several more times until the LCD display shows the following message:
[Main Menu]
Modbus Status
C. Press the select (bottom) button on the server and the unit will begin the diagnosis of the Modbus loop. After the check is completed, the unit will display the following message:
X devices OK
X fail, X new
D. Verify that the number of devices located by the server (the total of OK, fail and new) matches the number of devices actually installed and connected. For a first time installation, all devices should appear as “new”. The Energy Monitoring Hub A8812 Internal IO (pulse and analog inputs) appear as one device in this list.

(Note: A “device” is the Modbus connected device, not necessarily the sensor. For example, an A8923-4 I/O module with 4 sensors connected is only one Modbus device, not four.) For further information on the LCD console, please review the console section of this manual.
E. The Energy Monitoring Hub completes a background scan for new Modbus devices every 2-5 minutes. Increasing the RS485 Modbus timeout may increase the time required to detect new devices. If the Modbus devices are connected after the server is booted up, the devices may not appear on the screen for several minutes. In the worst case, allow up to 5 minutes for the Energy Monitoring Hub to locate all the connected devices.
F. If all devices are reporting properly, it is now time to connect the server to the network or phone line for remote reporting and configuration.
Basic Network Configuration Step 1 - Determine the IP addressing needs: The IP address of the Energy Monitoring Hub server can be implemented using one of three methods. Check with the network administrator to determine which method applies. For phone installations, use "direct connection to laptop" to allow initial configuration.
Static IP address - this is a fixed IP address which is assigned by a network administrator and “hard-coded” into the Energy Monitoring Hub; or
Dynamic Host Configuration Protocol (DHCP) address - this process assigns an IP address dynamically to the Energy Monitoring Hub when it is connected to the network from a host DHCP server; or
Direct connection between the Energy Monitoring Hub and a single temporary computer such as a laptop. (primary connection will be dial in or dialout by modem)
You will need the following information from your network administrator: The addresses will be in the form of “###.###.###.###”), where “#” refers to the numbers 0 to 9.
Static IP Address DHCP Direct Connection to Laptop
IP address: ___.___.___.___ Netmask: ___.___.___.___ Gateway: ___.___.___.___ DNS server: ___.___.___.___ DNS server: ___.___.___.___ HTTP Proxy _____________ proxy server port: ______
IP address: (dhcp assigned) Netmask: (dhcp assigned) Gateway: (dhcp assigned) DNS server: (dhcp assigned) HTTP Proxy _____________ proxy server port: ______
IP Address: 192.168.40.50 Netmask: 255.255.255.0 Gatway: 192.168.40.1 DNS: 70.99.203.62 HTTP Proxy: [blank]
(factory default settings)
Network Address Worksheet
Step 2 - Configure the IP address as selected from the table above. For Direct Connection to Laptop, the address settings above are set as the factory default, and you may be able to skip to the "Laptop/Computer Setup" section if the factory default settings are present.
To begin configuration, make sure that the server displays the start screen:
AcquiSuite Ready
192.168.40.50
If this screen does not appear on the LCD display, press and hold the menu (top) button on the server for several seconds and the message should appear. To change the IP address to the static address assigned by the network administrator, do the following:
A. Press the menu (top) button once to get the TCP/IP configuration menu
[Main Menu]
TCP/IP Config
B. Press the select (bottom) button twice to get the IP config menu:
[TCP/IP Config]
IP Address

C. Press the select button again to see the IP address menu:
[IP Address]
192.168.40.50
D. At this point, the cursor on the display will be blinking on the first number in the IP address on the second line.
E. To change the number, press the menu (top) button and the display will cycle through the digits 0-9 as well as “.”. Once the correct digit is displayed, press the select (lower) button to advance to the next digit and repeat the process until all the digits are correct.
F. Once the IP address on the Energy Monitoring Hub matches the assigned IP address; press the select (bottom) button once more to return to the main TCP/IP menu.
Step 3 - Set the netmask, gateway, and DNS server(s) addresses as noted in the chart "Network Address Worksheet" using the same technique as shown above. The only change is that after Step B; press the menu (top) button multiple times to see the netmask, gateway, and dns setup menu, then push the select button to set the option.
Note: If DHCP configuration is selected, the IP, netmask, gateway, and dns server addresses will be obtained automatically. Simply select the “Enable DHCP” from the first TCP/IP configuration menu.
Step 4 - After the address information has been set, you must reboot the Energy Monitoring Hub. Select the "(Previous Menu)" option after step B above. The menu will then state that the Energy Monitoring Hub must be rebooted to take effect. Press 'select' to allow the Energy Monitoring Hub to reboot.
Once the Energy Monitoring Hub has rebooted, the new IP address will be displayed on the console. If DHCP addressing was specified, the server assigned address will be displayed.
Note: if DHCP is unable to obtain an IP address, the Energy Monitoring Hub will use the fallback address of 192.168.0.100.
Laptop/Computer Setup
Step 1 - You must have a computer to access and configure the Energy Monitoring Hub. This computer must have an Ethernet connection (on the LAN or by direct connection) and must have a web browser installed such as Internet Explorer or Netscape.
Note: If your building already has an existing LAN that the Energy Monitoring Hub is attached to, you can use an existing computer on that LAN. Check with your network administrator for details. If this option is available, use a LAN connected computer and skip to the “Energy Monitoring Hub administration overview” section below.
LAN connected EMH Direct Connect EMH
EMHEMH
The remainder of this section will assume the installer has brought a laptop to the site, and will connect the laptop to the building LAN, or directly to the Energy Monitoring Hub. Attach the laptop to the Energy Monitoring Hub or LAN as shown in figure 6, Ethernet hookup.
Step 2 - Attach the Laptop to the Energy Monitoring Hub or to the LAN. The A8812 will automatically detect whether a direct or crossover cable is required, and will reverse polarity accordingly. This feature will allow you to use either a straight Ethernet cable or a crossover Ethernet cable interchangeably.
If the Laptop is to be attached to an existing LAN, obtain a static IP address (or use DHCP addressing) from the network administrator.
Static IP Address for the laptop DHCP Direct Connection to Laptop
Specify an IP address IP address: ___.___.___.___ Netmask: ___.___.___.___
Obtain an IP address automatically. (All other required settings are assigned by the DHCP server)
IP Address: 192.168.40.1 Netmask: 255.255.255.0
(Energy Monitoring Hub factory default settings)
Laptop Address Worksheet
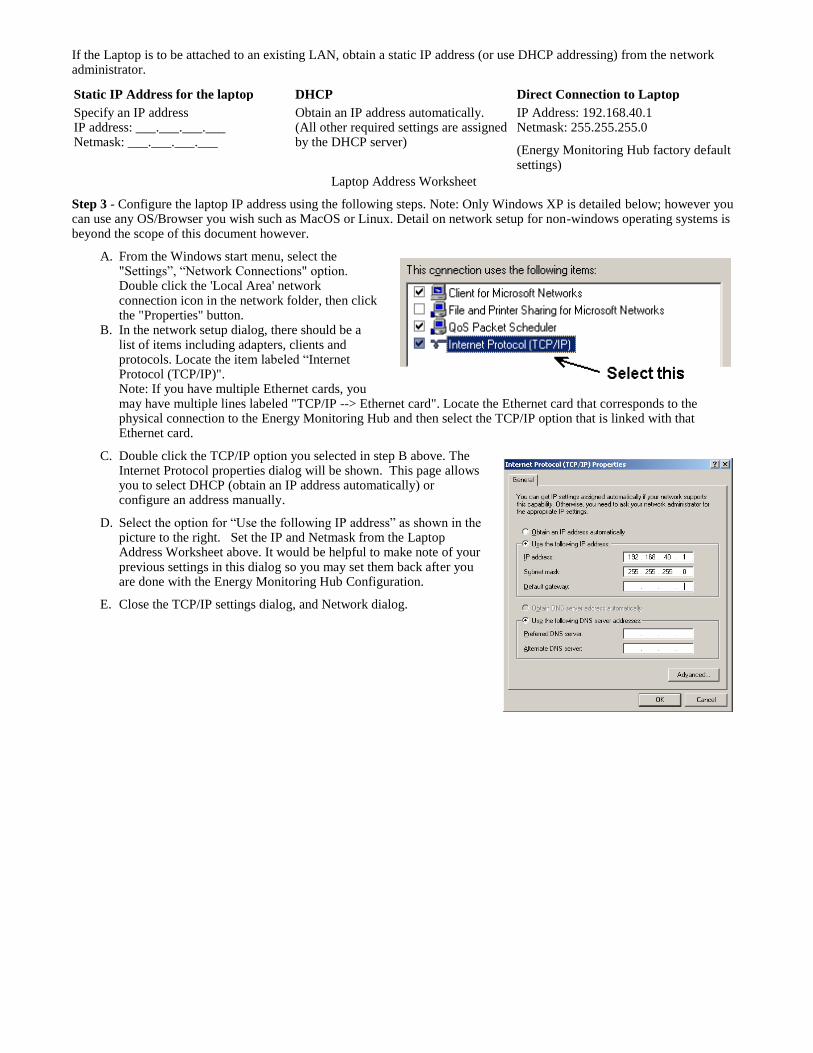
Step 3 - Configure the laptop IP address using the following steps. Note: Only Windows XP is detailed below; however you can use any OS/Browser you wish such as MacOS or Linux. Detail on network setup for non-windows operating systems is beyond the scope of this document however.
A. From the Windows start menu, select the "Settings”, “Network Connections" option. Double click the 'Local Area' network connection icon in the network folder, then click the "Properties" button.
B. In the network setup dialog, there should be a list of items including adapters, clients and protocols. Locate the item labeled “Internet Protocol (TCP/IP)". Note: If you have multiple Ethernet cards, you may have multiple lines labeled "TCP/IP --> Ethernet card". Locate the Ethernet card that corresponds to the physical connection to the Energy Monitoring Hub and then select the TCP/IP option that is linked with that Ethernet card.
C. Double click the TCP/IP option you selected in step B above. The Internet Protocol properties dialog will be shown. This page allows you to select DHCP (obtain an IP address automatically) or configure an address manually.
D. Select the option for “Use the following IP address” as shown in the picture to the right. Set the IP and Netmask from the Laptop Address Worksheet above. It would be helpful to make note of your previous settings in this dialog so you may set them back after you are done with the Energy Monitoring Hub Configuration.
E. Close the TCP/IP settings dialog, and Network dialog.

Energy Monitoring Hub Administration Overview The Energy Monitoring Hub should now be available on the local area network for you to access using a web browser such as Internet Explorer or Netscape.
Step 1 - Use your web browser to connect to the Energy Monitoring Hub by entering
http://192.168.40.50/setup/ Where 192.168.40.50 is the IP address displayed on the on the Energy Monitoring Hub LCD display.
Step 2 - When prompted, use the following default login information
Login: admin Password: admin
Step 3 - Your web browser should now display the Energy Monitoring Hub configuration menu. To the left, a list of configuration options is available. On the right, a specific configuration page will be shown. The first page is a welcome message with some system status information. Proceed with the configuration of the Energy Monitoring Hub using your web browser.
Step 4 - Click on the + mark next to the Accounts menu. Select the Admin account, and click 'Change Password'. All units are shipped with the same factory default password, and it should be changed to prevent unwanted access.
Step 5 - Expand the Networking option, and select setup. Verify the addresses are consistent with those in the "Network Address Worksheet."
Step 6 - Expand the Modbus option, and select "Device List." You should see a list of each Modbus device attached to the Energy Monitoring Hub. Before the Energy Monitoring Hub can begin logging data, each Modbus device must be assigned a unique name.
A. Click the device number to the left of the unconfigured Modbus device. B. A page with the current device status and readings will be displayed. Click on the 'configure' button at the bottom
of the page. C. Enter a name for the device in the supplied field. D. Change any low and high range alarm settings you may need. (optional) E. Click the 'Save' button at the bottom of the page to save your changes. F. Repeat these steps for each Modbus device.
Some devices may require additional information. For example, the Veris H8238 Multi circuit power meter allows the CT size to be specified. The Leviton A8332 Module and the A8812 Energy Monitoring Hub internal IO module have additional configuration options on each data point line to specify the details of the analog or pulse input. These include the 4-20mA device scale, multipliers and engineering units. Each 4-20mA or 0-10Vsensor should be supplied with technical information including the low and high range values that can be used to configure the Energy Monitoring Hub. Also, the Energy Monitoring Hub has many common sensor types pre-programmed that can be selected from a drop down list. Review the Modbus Advanced Configuration Options section of this manual for further configuration details.
Step 7 - Select the Modbus/Setup menu option. Specify the Modbus Loop Name. This will become the name of the Energy Monitoring Hub. This is the name that will appear on the LEM website service (if subscribed). Specify the data logging period. The default is 15 minutes.
Step 8 – Decide upon a method of data transfer. (see section later in this document) . If you select the HTTP/Post method to send data to the LEM website, you can configure this by selecting the “LogFileData, Setup/Upload” page.
A. Make note of the Energy Monitoring Hub serial number. B. Select upload options as needed for time of day to upload the data and retry control. C. Check the checkbox to allow remote configuration. This will allow you to reconfigure the Energy Monitoring Hub
from the LEM web site without having to connect directly to the Energy Monitoring Hub. D. Specify the "Target address to upload data." This is the website address where the Energy Monitoring Hub will
send the collected data. If you have an in-house data collection service, you should enter the address of your data server in this field. Leviton also provides a service called Building Manager Online that can collect and report data for you. If you are using the LEM service, the target address to upload data should be set to http://www.buildingmanageronline.com/upload.php
E. When configuring the Energy Monitoring Hub to send data to the LEM site or your own data collection server, the Energy Monitoring Hub will authenticate itself with the server by using the serial number and a password. This password must be supplied here, and can be obtained when you subscribe for the LEM service, or by your database administrator.

F. Click "Apply" to save your changes.
If you select a manual transfer method, remove (blank out) the target address in the Modbus/Upload Data page.
Security The Energy Monitoring Hub has three levels of security. These are “operator”, “user” and “admin”. When using a browser to access the Energy Monitoring Hub, basic http authentication is used to prompt your browser for a username and password. The admin account uses “admin” as the default password. To change the password, select the Accounts menu from the left side tree display. Next, select the account name. Click the “Change Password” button to set a new password for the selected account.
admin: This account has full access to modify any of the system settings. The default password is “admin”.
operator: This account may view settings, however may only change Modbus alarm ranges and device names.
user: This account can view some system settings including the Modbus device status pages and can change nothing.
When using FTP to access the Energy Monitoring Hub, you may use the admin account username/password for read-only access. Log information is stored in /var/log/Modbus. For read-write-delete access, use the login name “root” and the admin password.
The three usernames specified are not able to be changed or renamed, nor can arbitrary usernames be added to the Energy Monitoring Hub. Access is only controlled by setting the password for the three existing usernames noted above.
The “operator” and “user” accounts are disabled by default. These accounts are activated when you first set a password for each.
Modbus
Modbus Device List
The Energy Monitoring Hub automatically searches for Modbus devices on the RS485 serial loop. The Modbus Device List page will show a listing of all the currently detected or configured devices the Energy Monitoring Hub has found. The device list will show the Modbus address number, status (Ok, Error, Alarm, Unconfigured), the device name (user specified) and the device identification string.
Click on the Modbus address number for any of the devices for specific device details
Note: not all Modbus devices have built in driver support in the Energy Monitoring Hub. If a device appears in the list with “Unknown” in the status column, you may need to upgrade the firmware on the Energy Monitoring Hub to access the device. At the bottom of the device list page under the Type column, a link is shown that will show all the Modbus devices with built in driver support provided in the firmware. Use the System/Firmware update page to check for newer versions of

the firmware. The Leviton .com website FAQ also has a list of supported Modbus devices. Modbus devices that are not supported by built in drivers may be configured using the Modbus Framework feature in the Energy Monitoring Hub.
At the bottom of the device list, there is an option to allow you to rename all the devices listed. This is useful for initial deployments. There is also a troubleshooting link that will look for common configuration problems and alert you to the appropriate solution.
Device List Options
At the top of the Modbus device list page, there are several display options that control the sorting of the device list.
Tree display: Click this icon to organize the list by showing each ModHopper, and the devices attached to each one.
List display: (default) Show the list of Modbus devices sorted by the Modbus address number.
At the bottom of the Modbus device list, there are several options that may be selected to view or configure all the Modbus devices at the same time. These options are as follows:
Add: Manually add a Modbus device to the device list. This option can be used to configure a Modbus device that is not presently connected to the system, add a framework configured device, or add a Modbus/TCP connected device. See the section on manually adding a device below.
Troubleshoot: The Energy Monitoring Hub will review the devices connected and offer suggestions about any problems found.
Rename all devices: This option allows you to edit all the device names in one configuration page. This is useful when initially configuring a large number of new devices. A name must be assigned to a device before the Energy Monitoring Hub will log data for it.
List all supported devices: This option will show a list of all Modbus devices with built in drivers in the installed firmware.
Show [setup]: Display links for Device configuration and Advanced configuration for each device.
Show [devinfo]: Display the communications options including baud rate, serial number and firmware version (when available) for all devices in the Modbus device list.
Show [stats]: Show packet counters for all devices in the device list. These include
Sent: Total number of packets sent to this Modbus address. Received: Total number of valid packets received from this Modbus address. Error: Total number of packets received that fail CRC for this device. (does not include non-response queries) RTT: The average round trip time for the last 7-10 packets that received a valid response. This value is useful in configuring the Modbus timeout in the Modbus Setup/RS485 page. Note: if the timeout is set too short, you will not see an accurate value because packets dropped for timeout are not counted for RTT.
XML: Display the device list data in XML format.
Notes on RTT and Timeout configuration:
To best measure the true RTT, set the Modbus Setup/RS485 timeout to the maximum period and allow the Energy Monitoring Hub to run for 5 or 10 minutes. Next, review the RTT values seen in the device list page and make note of the longest RTT time shown for any device. Last, configure the Modbus Setup/RS485 timeout to the option that is the next largest than the longest time seen for any device. For example; if the worst RTT is 600ms, set the timeout to 1second.
Typical RTT values for direct connected devices should range between 40ms and 200ms. Systems that have wireless links such as ModHoppers should expect an additional delay of 500ms per hop. A complex system with multiple ModHoppers may have RTT values upwards of 3 seconds.
Device Details
The device detail page will show a list of all the meter data points, alarm settings and console options. The data point names for most devices are automatically entered. Some devices such as the A8332 io module have generic inputs, and will be labeled as “pulse input #1”. At the top of the page, the status of the device is shown. This usually reports “ok” however it can include error information if the device is not responding properly. A list of device errors is available in the log file details section of this manual. At the bottom of the page, several buttons are present.
Done: Returns you to the device list page.
Log File: This icon will display a table view of the most recent data in the current log file. Use the log file export page for complete log data access.
XML: This icon will show the current data from the Modbus device in an XML format. The URL from this icon can be copied and used to gather xml data for client side Javascript or Java applications.
Configure: This button will allow you to change the device parameters such as the name, alarm and console settings.
Device Configuration
When the “configure” button is clicked from the device details page, the screen will be refreshed, with the same information, however the device name, alarm settings and console checkbox will be available.
Device Name: This field allows you to specify a name for the device such as “main building power” or other useful name to indicate the location or function of the device. A name must be assigned to a device before the Energy Monitoring Hub will log data for it.
Low Alarm, High Alarm: Specify a threshold for the alarm. If the data point is recorded below the Low Alarm or above the High Alarm levels at the time a log entry is taken, the point will be considered in an alarm state.
Console: Checking this checkbox will cause the Energy Monitoring Hub to display this data point on the LCD console. Multiple data points are rotated about every 10 seconds. The values on the LCD console are updated when the next log interval occurs.
Point Config: Some devices have configurable point features. The A8332 IO module has 4 pulse and 4 analog inputs that require additional configuration as detailed in the next section. The H663/704 BCM product only requires the circuit breaker name in this menu. Most data points are automatically configured and this option may not be displayed.
Advanced: At the lower right corner of the page, an advanced configuration button may be present depending on the Modbus device features.
Advanced Configuration Options
The advanced configuration page contains special options specific to the device you are configuring. For the A8332 io module, you may specify the pulse rate speed that the pulse inputs will work at, as well as review the 4-20mA/0-10v input status. On power meters, the CT size and orientation options may be present. The device serial number and other specific parameters will be displayed if available.
Specific options available in the Advanced Configuration page vary depending on the features available in the Modbus Device, as well as the features implemented in the built in Energy Monitoring Hub driver.
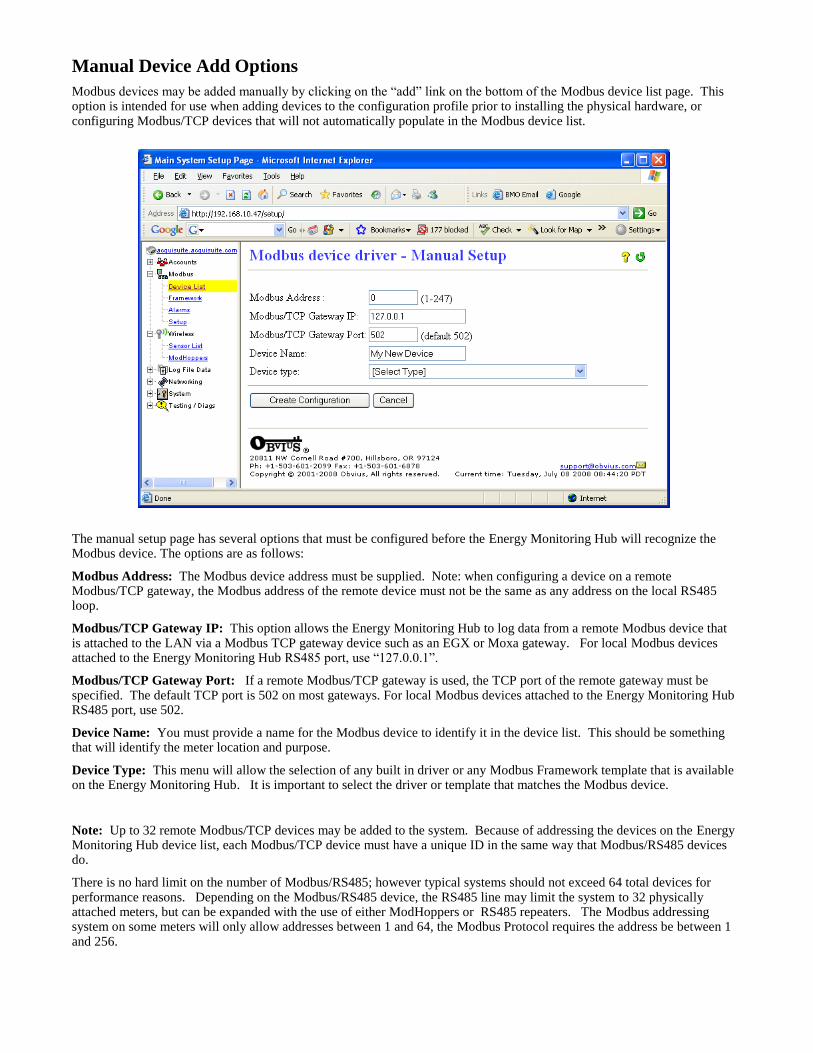
Manual Device Add Options
Modbus devices may be added manually by clicking on the “add” link on the bottom of the Modbus device list page. This option is intended for use when adding devices to the configuration profile prior to installing the physical hardware, or configuring Modbus/TCP devices that will not automatically populate in the Modbus device list.
The manual setup page has several options that must be configured before the Energy Monitoring Hub will recognize the Modbus device. The options are as follows:
Modbus Address: The Modbus device address must be supplied. Note: when configuring a device on a remote Modbus/TCP gateway, the Modbus address of the remote device must not be the same as any address on the local RS485 loop.
Modbus/TCP Gateway IP: This option allows the Energy Monitoring Hub to log data from a remote Modbus device that is attached to the LAN via a Modbus TCP gateway device such as an EGX or Moxa gateway. For local Modbus devices attached to the Energy Monitoring Hub RS485 port, use “127.0.0.1”.
Modbus/TCP Gateway Port: If a remote Modbus/TCP gateway is used, the TCP port of the remote gateway must be specified. The default TCP port is 502 on most gateways. For local Modbus devices attached to the Energy Monitoring Hub RS485 port, use 502.
Device Name: You must provide a name for the Modbus device to identify it in the device list. This should be something that will identify the meter location and purpose.
Device Type: This menu will allow the selection of any built in driver or any Modbus Framework template that is available on the Energy Monitoring Hub. It is important to select the driver or template that matches the Modbus device.
Note: Up to 32 remote Modbus/TCP devices may be added to the system. Because of addressing the devices on the Energy Monitoring Hub device list, each Modbus/TCP device must have a unique ID in the same way that Modbus/RS485 devices do.
There is no hard limit on the number of Modbus/RS485; however typical systems should not exceed 64 total devices for performance reasons. Depending on the Modbus/RS485 device, the RS485 line may limit the system to 32 physically attached meters, but can be expanded with the use of either ModHoppers or RS485 repeaters. The Modbus addressing system on some meters will only allow addresses between 1 and 64, the Modbus Protocol requires the address be between 1 and 256.

Internal IO Configuration
The A8812 Energy Monitoring Hub provides 8 multipurpose flex inputs on board. The onboard io inputs will always be device 250 in the device list.
1. Click on the device number 250 in the device list. A page showing the device inputs will be presented. Each input has 5 lines on this page. Analog inputs have one line each for an instantaneous, min, max and average value. Pulse inputs have a line for the accumulated value, rate, runtime and status.
2. Click the Configure button at the bottom of the page. The page will be displayed again; however the device name and alarm level fields will allow editing. Type in a name for the device in the space provided at the top of the page. The name should describe the purpose or location of the IO module. For device 250, you may want to use the name “Internal IO”
3. For each input that you wish to use, click the “Config Point” button to the right of the input.
4. The input configuration requires several options. The input mode will control how the input functions. This includes measuring voltage, current, resistance, pulse, or runtime. Use the dropdown menu to select the mode that is appropriate

for your sensor. The input configuration must be completed for each input that is in use. Sensor Name: change this to describe the input. This can be anything you wish, such as “Indoor Temperature” Input Mode: Select from one of the following: Voltage 0-10v, Current 4-20mA, Resistance, Pulse, Pulse-KYZ, status or Unconfigured. Sensor Make and Model: This entry is a space for the model number of the sensor. It is only used for reference. Sensor Minimum Range: All Analog Sensors have min/max range values. For example, a temp sensor may have a range of 50 to 95 degrees F. Enter the low range number here. Sensor Maximum Range: Enter the high range value of the analog sensor here. Pulse Multiplier: For pulse mode inputs, this option specifies the multiplier for the input. Curve Scaling: Some sensors such as thermistors have a non-linear output. This option allows a lookup table to be specified to convert from the input reading to an engineering unit data output. Several conversion tables (Curve Scale Templates) are provided with the Energy Monitoring Hub. For more information refer to the Curve Scale Documentation supplement provided on the Leviton .com website. Pulse Rate: For most units, this feature is an automatic rate field. For KWH points, the rate is KW. Engineering Units: Enter the units of measure. ie, Degrees F, %RH, etc.
5. After saving the sensor profile, the device configuration page will be displayed again. The input values should now be scaled correctly and the names will be updated to your new configuration. You may wish to set any alarm thresholds required, or check the “console” check box for any data points that should be displayed on the LCD console.
6. Click the “Advanced” button in the lower right corner of the page. For the A8812 onboard IO, there are several options. Input types: This list shows the status of the 8 analog inputs, either 0-10V, 4-20mA, resistance, pulse, status, etc.
The Contact Closure Threshold allows you to set a maximum resistance to be counted as a “closed” contact. This is helpful when using intrinsic barrier devices.
The Contact Open Threshold can be used in conjunction with a 20K resistor in parallel with the contact closure. When the contact is open, the Energy Monitoring Hub will read 20K, when closed, it will read <100ohms. If the wire is broken, the reading will go above 20k ohms, and will cause an alarm condition.
The Pulse count for instantaneous rate value specifies the number of pulses to use to calculate the instantaneous rate, min, and max fields in pulse mode.
7. After returning to the device configuration page, click “Save” at the bottom of the page to return to the device display page.
The internal I/O device 250 is also available to the Modbus TCP gateway feature. External systems such as computer software or PLC may send a Modbus TCP query to the Energy Monitoring Hub using Modbus address 250. The internal I/O device will respond with Modbus registers that represent all of the features seen in the Energy Monitoring Hub configuration pages. Complete documentation of the Internal IO device 250 Modbus registers is available online on the website Leviton .com in the A8812 overview section.

Troubleshooting Modbus Devices
If the device you have attached does not appear in the Modbus device list, check the following:
Verify the + (red), - (black), and Shield connections are correct on all connections. Look for any connection in the middle of the loop that may have the wires reversed, or shorted together. Check the Modbus FAQ on the Leviton.com website for further details on wiring a Modbus serial connection.
Verify the address settings of every Modbus device. No two devices may have the same address. Note: the Energy Monitoring Hub A8812 uses the address 250 for the internal IO module. Do not assign this address to any other Modbus device.
If only one device is not working, try disconnecting all the other devices on the Modbus loop to isolate the problem. If possible, bring the failed device adjacent to the Energy Monitoring Hub and attach it with a short stub of wire to eliminate possible wiring problems. If the Energy Monitoring Hub can find a device on the short stub, the problem is probably a wiring related issue on the RS485 loop.
Check to verify the Modbus device is supported by the Energy Monitoring Hub. Usually, the Energy Monitoring Hub will locate the device and print “Unknown” in the device status column if the device is not recognized by the Energy Monitoring Hub firmware drivers. In the lower right corner of this screen, there is a link that will show a list of supported devices. Use this to verify the Modbus device in question is supported by the Energy Monitoring Hub firmware version. If not, check for firmware upgrades online with the Firmware Update configuration page.
Remember, the Energy Monitoring Hub may take between 2 and 5 minutes to detect a new device that has been attached to the Modbus rs485 loop. Rebooting the Energy Monitoring Hub, refreshing the device list page, or using the console „Modbus status' menu will not speed up the recognition process.
Click the “Troubleshooting” link at the bottom of the Modbus device list page for further diagnostics.
Modbus Setup
The Modbus setup page provides several options related to the Modbus RS485 serial port.
Energy Monitoring Hub Name: This is the name of the Energy Monitoring Hub. This name will be present on all log file descriptors when uploaded to a central database website such as LEM. It is helpful to name the Energy Monitoring Hub based on the physical location of the system, or building. Note: this feature was labeled “Loop Name” in older firmware versions.
Data logging period: This option sets the log interval for the Energy Monitoring Hub. Options range from once per minute to once per hour. All of the selections are even divisions of one hour. The Energy Monitoring Hub calculates the next log time by finding the next multiple of the log period past the start of the hour. For example, if the log period is 15 minutes, log readings will be taken at 0, 15, 30 and 45 minutes past the hour. The log period is not calculated based on “15 minutes after the last reading”
When the Energy Monitoring Hub is first started, it will take an initial reading of all the Modbus devices immediately. Following that, the next log reading will be calculated as a multiple of the log period after the hour. The initial reading is taken to allow the Energy Monitoring Hub to gather information for meters that require demand calculations, as well as provide accurate information starting when the Energy Monitoring Hub is booted.
Modbus/TCP access: The Energy Monitoring Hub has a Modbus TCP gateway feature that allows other systems to send queries to all attached Modbus RS485 devices. This feature allows control of what systems have access to the Modbus TCP gateway feature. The settings include “no access”, “local subnet only” and “allow any”. This basic security feature only allows control based on the IP address of the system making the request. The Modbus TCP protocol does not have provisions for any authentication password or other methods of security. By default, the gateway feature is disabled, and set to “No Access.”
The Modbus TCP gateway is a feature that allows the Energy Monitoring Hub to share the attached Modbus RS485 devices with other systems such as PCs with software and building control systems. The gateway receives incoming TCP requests, verifies the length of the packet does not exceed 255 bytes, and forwards the packet to the Modbus RS485 loop. The gateway does not verify the contents of the packet, nor the target address specified in the request. If the Modbus RS485 device sends a valid response back, the gateway will return this information to the system requesting it via TCP. If no response is received, a timeout failure will be sent to the requester. Because the gateway does not process the contents of the request or reply, it is possible to query devices on the Modbus RS485 loop that are not specifically supported by the Energy Monitoring Hub. A Modbus/TCP technical guide may be available soon at www.Leviton.com.
Modbus RS/485 baud rate: This feature allows the configuration of the RS485 serial port speed which the Energy Monitoring Hub uses to communicate with Modbus devices. Options include 9600, 19200, 38400, 57600, and 115200. The

default is 9600, most Modbus devices communicate at this speed as well. Multiple baud rates may be selected in this menu. If multiple rates are selected, the Energy Monitoring Hub will automatically detect the baud rate of each Modbus device from the chosen options. Once the baud rate has been detected for a specific Modbus device address, and will continue to communicate with that specific device address at the detected speed. This feature will allow you to mix multiple devices on the same RS485 loop with different baud rates. Modbus devices default to a baud rate of 9600. Note: Modbus device manufacturers usually do not 'officially' support this configuration; however we have not seen any problems with this in any of the Modbus devices we provide drivers for. Most Modbus devices simply ignore packets received at the wrong baud rate. If you are experiencing Modbus communications problems, you should set the baud rate to a fixed 9600 before troubleshooting.
Modbus RS/485 Parity: This feature allows alternate parity options to be set. Default is no parity.
Modbus RS/485 Stopbit: This feature allows alternate stop bit options to be set. Default is one stop bit.
Modbus RS/485 Timeout: This feature sets the period of time the Energy Monitoring Hub will wait for a response from any device on the Modbus RS485 serial loop. The default of 200ms is long enough for most Modbus devices. Longer timeouts may be required if you have a very slow device, or if you have a Modbus repeater device in the serial loop. Devices such as the ModHopper, the Veris H8936 Local Display, or any RS485 wireless link repeaters add a substantial delay. Setting the delay longer than the default will increase the time required to auto-detect new Modbus devices when attached to the Energy Monitoring Hub. For ModHopper connections, use a minimum setting of 1.5 seconds. The allowed range is 100ms to 5 seconds.
Tip: Set the timeout to the longest available setting, and use the “stats” option on the bottom right of the device list page to monitor the actual RTT (response time) for each device. Next, decrease the RS485 Timeout that is close to (but longer than) the slowest device in the device list.
Modbus RS/485 Debug: This feature records Modbus RS485 transaction data in the system debug log file. You must click the “start log” button on the system/log files page to record this information. Debug options are as follows:
None: No RS485 information is logged.
Errors: Only Modbus errors are logged.
Transaction: One line is logged describing every RS485 query, and the result of that query.
Full Debug: Complete listing of all queries including hex dumps of all data sent/received.
Search for Modbus/RS485 Devices: This option allows the Energy Monitoring Hub to search for Modbus devices attached on the RS/485 port. This feature may be disabled to reduce queries on the RS/485 port. Default is enabled.
Search for Sensor Network Devices: This option will allow the Energy Monitoring Hub to search for sensor network enabled ModHoppers (R9120-3SN) , and log data from attached devices. Note: this is for sensor network devices such as PointSix and Badger receivers, and not Modbus or Pulse devices. Default is disabled.
Alarm Setup
The Modbus Alarms section provides the ability to send messages when alarm levels are exceeded. Messages can be sent by email, snmp or displayed on the LCD console. Alarms are processed at the end of the data logging period. For more frequent alarms, shorten the data log interval. Log readings and alarm processing can be set to as often as once per minute.
Display all alarms on LCD console: When checked, all alarm messages are shown on the LCD display of the Energy Monitoring Hub.
SNMP Trap Send Enabled: When checked, SNMP Trap messages are sent after every log period for each data point that is in an alarm state. The trap includes information about the Energy Monitoring Hub system data point, and alarm state. A full MIB is located on the Energy Monitoring Hub; click the MIB link to the right of this option.
SNMP Trap Host 1 (2, 3): When SNMP traps are enabled, a trap message is sent to each of the trap host addresses. Specify the trap host by IP address, not DNS name.
Direct email on alarm: When checked, the Energy Monitoring Hub will send an email message when any data point changes its alarm state.
SMTP Mail Server Address: The IP address of the email server on the LAN that will process and forward the email message to the recipient.
Sender Address: The address that will be used in the “From:” line of the email. This is helpful in identifying the source of the alarm email message. If your SMTP mail server has junk filtering, you may be required to use a sender address that matches a mailbox address on the SMTP mail server; check with your mail server administrator for specific details on this issue.
Recipient address 1 (2, 3): The Energy Monitoring Hub can send a copy of the alarm notice to multiple email addresses. Specify one, two or three email addresses in the fields provided for the recipient addresses.
Modbus Framework
The Modbus Framework feature is a tool to allow the Energy Monitoring Hub to read data from any Modbus device by creating a template in the Modbus Framework editor. The template describes the Modbus register read commands, and the conversion required for each data point that is to be read. The Framework feature is an advanced feature of the Energy Monitoring Hub that requires the user to be familiar with the Modbus protocol and with the Modbus register point list for the specific Modbus device that will be used. For more information on the Modbus Framework feature, download the Modbus Framework documentation from www.Leviton.com.
Wireless
Sensor List
The sensor list feature works in conjunction with a number of non-Modbus sensors. Sensor devices such as PointSix, BAPI, and Badger/Orion typically transmit data on a pre-set interval and are not polled by the Energy Monitoring Hub. Data is received and uniquely identified by the sensor's serial number. Each sensor may be given a name, and some have additional options to configure such as input value scaling.
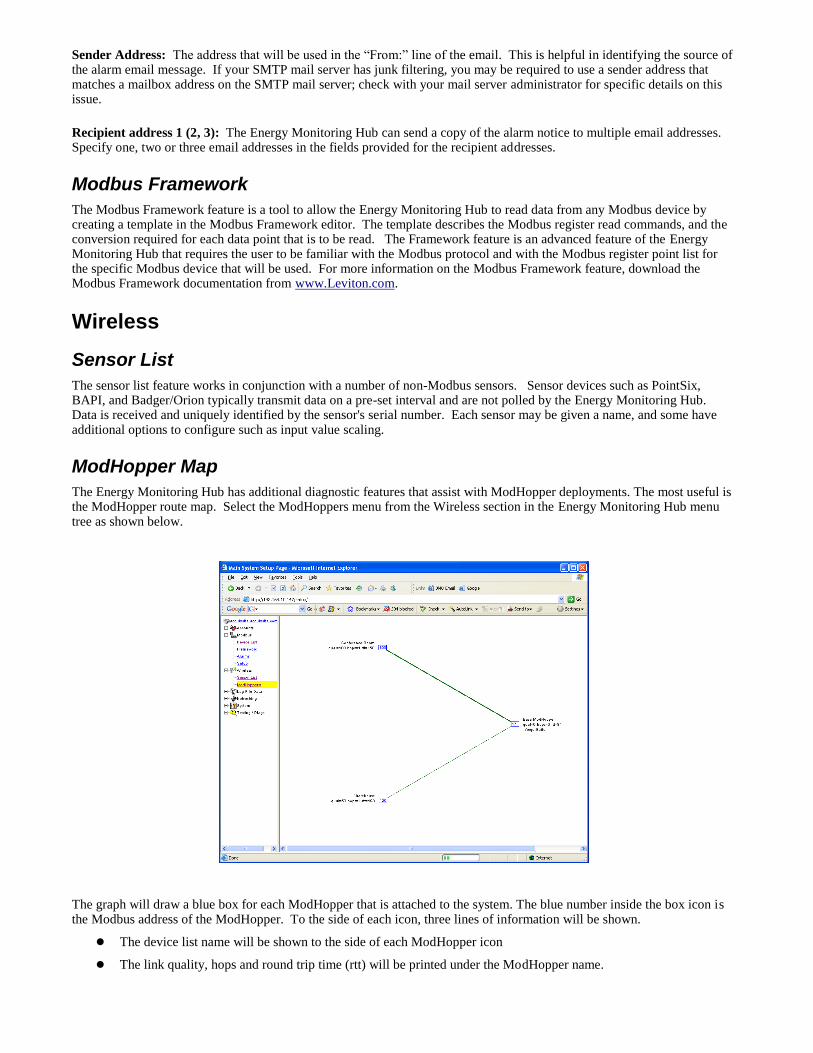
ModHopper Map
The Energy Monitoring Hub has additional diagnostic features that assist with ModHopper deployments. The most useful is the ModHopper route map. Select the ModHoppers menu from the Wireless section in the Energy Monitoring Hub menu tree as shown below.
The graph will draw a blue box for each ModHopper that is attached to the system. The blue number inside the box icon is the Modbus address of the ModHopper. To the side of each icon, three lines of information will be shown.
The device list name will be shown to the side of each ModHopper icon
The link quality, hops and round trip time (rtt) will be printed under the ModHopper name.

A list of attached Modbus device addresses will be shown on the third line. This is a list of addresses that the ModHopper has automatically detected on the local RS485 port.
The graph will print strong links in thick green lines. Lines progress from green, to yellow, to red to indicate weak links.
Networking
Network Status
This page displays the current status of the Energy Monitoring Hub network connections. Several interfaces may be shown if both Ethernet and ppp dialin/dialout are active at the same time. Each interface will report the IP address, number of packets sent and received, and other details specific to the interface. For the Ethernet interface, the MAC address (HWaddr) will be shown as well as a network collision count. Ethernet network
eth0 Link encap: Ethernet HWaddr 00:99:99:0E:C1:CA
inet addr:192.168.10.50 Bcast:192.168.10.255 Mask:255.255.255.0
UP BROADCAST RUNNING MULTICAST MTU:1500 Metric:1
RX packets:2624171 errors:6 dropped:0 overruns:0 frame:0
TX packets:220342 errors:0 dropped:0 overruns:0 carrier:0
collisions:1 txqueuelen:100
RX bytes:174674347 (166.5 Mb) TX bytes:50607122 (48.2 Mb)
Interrupt:5 Base address:0x320
Note: the “lo” or Loopback interface is the internal network and is always present, “eth0” is the Ethernet segment, and “ppp0” is the dialout or dial in connection. In addition, the current gateway and DNS server information will be shown. These items will provide information about DHCP assigned configuration information.
Ethernet setup
The Ethernet setup page has the following options:
IP Address: The IP address of the Ethernet interface: Default 192.168.40.50
Netmask: The netmask of the Ethernet network. Default 255.255.255.0
Gateway Address: The gateway is the routing device that moves traffic from the LAN to the internet. The default is 192.168.40.1. If you do not have an internet connection for your LAN, or you are using a crossover Ethernet cable, leave this field blank.
DNS 1, DNS2: These are the primary and secondary DNS servers. If you are using a dialout connection, these must be set to the DNS server provided by your dialup ISP. If you only use the Energy Monitoring Hub on a crossover cable and/or dialin mode, you should leave these blank.
DHCP (enable/disable): If your LAN has a DHCP server, you may enable this option and remove the previous options for IP, netmask, gateway, and DNS. Check with your LAN administrator first.
HTTP Proxy: If your LAN is connected to the internet using a sophisticated firewall, you may need to use the HTTP proxy feature. Check with your LAN administrator first, however if you don't have a proxy set on your computer (MSIE/Tools/Connections-tab/LAN-Settings) then you most likely don't need to configure the Energy Monitoring Hub to use a proxy. If in doubt, leave this blank first, and try the connection test. If it fails, ask your LAN administrator about proxy servers, if any.
After changing any of the settings on this page, you will be required to reboot the Energy Monitoring Hub. Use the system/status web configuration page, or the LCD console to reboot the Energy Monitoring Hub.
Troubleshooting Ethernet Problems
After reconfiguring the Ethernet settings you experience problems accessing the Energy Monitoring Hub with your web browser, check the following items.
Verify that you rebooted the Energy Monitoring Hub after making the changes to the network settings.
Use the Energy Monitoring Hub LCD console. Check the IP address and Netmask. Verify these are correct.
Verify the Ethernet link/act light next to the Ethernet port is on. It should blink with activity.

Verify the network connection in your computer has the proper IP address, on the same subnet, to access the Energy Monitoring Hub. NOTE: one common mistake is configuring the Laptop IP to the same address as the IP address of the Energy Monitoring Hub. In order for the laptop and Energy Monitoring Hub to communicate, the IP addresses should not be identical. (see the basic network config for suggested IP addresses.)
Use the LCD console to run the Network Status test. This will attempt a number of things including a ping query to the gateway address. If the Energy Monitoring Hub can ping an external machine such as a gateway, the Ethernet port is most likely connected properly. If the Energy Monitoring Hub does not use a gateway, try adding a gateway address, and make it the address of your computer.
System Options
Status
The system status page shows the current memory and flash disk utilization values, system up-time, and load average. Also included on this page are two buttons for Reboot and Shutdown. It is important to use the shutdown option prior to removing power from the Energy Monitoring Hub. The LCD console will report the reboot or shutdown status.
Processes
The system process table is shown in both tree and tabular formats. The process list is useful when contacting Leviton technical support.
Date and Time
The Energy Monitoring Hub keeps time using UTC or Universal time. All log files are recorded in UTC time as well. Timestamps shown on the Energy Monitoring Hub local configuration pages are converted to local time for the convenience of the installer. The date/time configuration page provides the following options
Date/time: In UTC and Local time.
Date/time: Dropdown menus to select the current (Local) time manually.
Timezone: A drop down list of the supported time zones.
Time sync protocol: Select NTP or Rdate. Most Linux/Unix systems provide Rdate, however many provide NTP as well. Windows domain servers can also provide NTP. If possible use NTP as it is a more robust protocol.
Time Server: Specify the DNS name or IP address of your time server. The default “time.Leviton.com” can be used if the Energy Monitoring Hub has a connection to the Internet. The Energy Monitoring Hub will attempt to synchronize time with the time server every time an upload session. This will ensure that the clock is checked and adjusted at a minimum of once per day. Typically, the synchronization will align the clock to within +-1 second of the internet time source or atomic clock. You may need to verify if your firewall will allow NTP or Rdate packets to pass through. Generally, it is better to use a local time server if possible. The time server time.Leviton.com supports both NTP and Rdate time protocols. If you use a GSM connected system, you will probably need to use Rdate. NTP is blocked by many cellular service carriers.
Universal Time Is Your Friend
Log data is stored in UTC time. This allows data collection services such as LEM to collect data from multiple sites in different time zones. If you are operating your own database system to store log data from the Energy Monitoring Hub, it is best to store the data in UTC time in the database as well, and only convert it to local time when generating the final report or graph for the user.
If you store data in Local time, you will have the following issues.
1) Local time is relative. Is Local the time where the Energy Monitoring Hub exists or Local to where the data is stored? If local to the Energy Monitoring Hub, you must shift each Energy Monitoring Hub data set depending on its location.
2) There are about 11 time zones in the US. Some observe DST, others do not. These include Alaska, Aleutian, Arizona, Central, Eastern, Hawaii, Indiana, Michigan, Mountain, Pacific, and Samoa.
3) When converting to local time, there will be one hour of overlapping data in the fall when the time is adjusted for Daylight Savings time. ie, log entries run 12:45, 1:00, 1:15, 1:30, 1:45, 1:00, 1:15, 1:30, 1:45, 2:00am. This will prevent you from sorting your data by time in your database.
4) In the spring, you will have a gap in the data from 1:59 to 3:00am. This can cause problems if you are calculating demand values based on consumption.

5) Converting Local time to any other time zone usually involves converting it to UTC first.
Using UTC time solves these problems elegantly. The best practice is to store data in the database in UTC format and then convert the information when generating a report for the user.
For example, if you wish to draw a graph of KW over Time, prompt the user for a date range, say Jan 1 midnight to Jan 2 midnight. Take the user specified end points and convert these times from Local time to UTC. Next, create an SQL query using the new UTC formatted data as your select statement. ie:
SELECT * from TABLE where time > '2003-01-01 08:00:00' and time < '2003-01-02 08:00:00'
Note the time is 8 hours ahead of local time. This example is for Pacific which is 8 hours off from UTC. This will return a list of data points between the two specified time ranges. Next, plot the data on a graph, using the UTC times for start and end points. Lastly, when drawing the 'time' legend on the graph, convert the values back to Local time before displaying. Ie, 2003-01-01 00:00:00 to 2003-01-02 00:00:00. Any division lines on the time axis can be handled the same way. The advantage of using this technique is that it will properly draw a graph across DST change boundaries. The graph axis is based on UTC time with no DST, and will not show a gap or overlap in a time of the change. The axis labeling will be correct as well, matching the UTC times precisely.
Another way to handle the conversion is to query and convert all the returned timestamps to local time before drawing the graph. This is useful if you do not have detailed control over the graph legend drawing process. This technique will not properly graph across DST changes as the graph is based on local time including DST changes.
System logs
The Energy Monitoring Hub can keep several log files that report the general operation of the system, not related to the normal data logs. These include the following:
Debug Messages: The Energy Monitoring Hub can run a “syslog” process to record more detailed information about its operations; however this log consumes vast quantities of memory quickly, and is disabled by default. Click the “start log” button to enable the feature. Click the “end log” button to disable. Note: when the Energy Monitoring Hub is rebooted, the debug log will be disabled on startup.
Kernel Boot log: Startup messages about the Linux operating system startup. This log shows what hardware items were detected and initialized.
Ftp Connection log: This log shows a list of files transferred by FTP on the Energy Monitoring Hub.
Last Data Upload log: This log file contains a report from the last data upload attempt to remote database/webservers such as LEM. This log will show if any log files are being rejected by the dabase/webserver, or if the network is not allowing a connection.
Time Change Log: This log contains a list of time change events. When the Energy Monitoring Hub system clock is changed either manually or by automated time sync, and the change is more than a few seconds, the event is recorded here.
System boot log: This log shows when the Energy Monitoring Hub was started, and lists process events such as remote logins, or logger process restarts. This log is most useful for detecting when the Energy Monitoring Hub was restarted, and whether there was a proper shutdown event prior to rebooting (if not, possibly a power outage).
Start/End logging: This button allows the user to start detailed logging or disable it if it is running.
Purge Log Files: This button will clear all the system log files listed on this page, but not the meter data log files. (deletes kernel, boot, ftp, messages, upload log files) This does not clear the interval log data from attached meter devices.
Firmware Update
The Energy Monitoring Hub can upgrade its own firmware using the firmware update page. The Energy Monitoring Hub must have an Internet connection to communicate with the Leviton.com website for firmware updates. If a LAN connection is present and configured, it will be used by default. If the Energy Monitoring Hub uses a dialout connection, you must first enable the dialout by clicking the “dialout now” button on the Networking/Modem-ppp/Status page. After clicking the “Check for updates” button, the Energy Monitoring Hub will contact the Leviton .com webserver and attempt to download a list of firmware files. The list is compared to the firmware versions installed, and a listing of the files will be displayed. If any firmware updates are available, a button to the right will be shown labeled “Upgrade”. The firmware files are as follows: asarm.cramfs The main Energy Monitoring Hub firmware file including the Modbus and data logging software usrarm.cramfs High level system support files such as FTP, and time zone information

ramdisk.gz Low level system files and system libraries zImage The Linux operating system. a8812io.hex The analog/pulse io co-processor firmware. When clicking on the Upgrade button, the Energy Monitoring Hub will again contact the Leviton .com website and download the requested firmware image file. The Energy Monitoring Hub will take a few seconds to verify the file checksum and prompt you with an “Install” button. Click the install button and the Energy Monitoring Hub will install the firmware update and reboot itself to make the changes take effect. Do not power down the Energy Monitoring Hub during any step of the Energy Monitoring Hub firmware update process. Doing so may corrupt the system and render the Energy Monitoring Hub unusable.
Diagnostics
Host Lookup
The Host Lookup page provides the ability to do some basic network tests. These are as follows:
Ping: Send an echo request to the specified host.
Traceroute: Send an echo request to the target address and attempt to locate every router in between the Energy Monitoring Hub and that address.
Nslookup: Convert the DNS name to an IP address, useful for testing the functionality of the DNS server configured in the Network/Setup webpage.
To run a network test, enter the IP address or DNS name in the field provided; check the checkbox next to the test you wish to use, and click the OK button. Multiple tests can be specified.
Connection Test
The connection test page will attempt to establish an HTTP session with the specified upload server. Click the “begin test” to start this process. Information will be printed in black. Success responses will be printed in Green, failure messages will be printed in Red. A sample upload test follows:
Ping localhost [127.0.0.1]: Success
Ethernet IP address [192.168.10.50], mask [255.255.255.0]
Local subnet [192.168.10.0] to [192.168.10.255]
Ping Ethernet ip address [192.168.10.50]: Success
Starting system debug logger
Dialout not enabled, using Ethernet LAN connection.
Ping Ethernet gateway [192.168.10.1]: Success
Ping DNS #1 [192.168.10.1]: Success
The DNS #2 server address is not configured.
Resolving time server [time.Leviton .com] to an IP address: Success. Got [70.99.203.62]
Ping time server [time.Leviton .com]: Success
Testing time server
SyncTime: Sync system time with time.Leviton .com.
16 Dec 19:49:36 ntpdate[3165]: adjust time server 70.99.203.62 offset 0.009985 sec
new time: Tuesday, December 16 2003 19:49:36 PST, drift 1 seconds.
Processing upload url.
No proxy specified, using direct connect method.
Upload URL looks ok: http://www.buildingmanageronline.com/upload.php
Resolving webserver [www.buildingmanageronline.com] to an IP address: Success. Got
[70.99.203.62.56.37]
Ping webserver [www.buildingmanageronline.com]: Success
Connecting to server at [70.99.203.62:80]: Success
Sending HTTP request: Success
Reading response:
Upload test completed. Got:
HTTP/1.1 200 OK
Date: Wed, 17 Dec 2003 03:49:38 GMT
Server: Apache/1.3.23 (Unix) PHP/4.1.2 AuthMySQL/2.20
X-Powered-By: PHP/4.1.2
Connection: close
Content-Type: text/html
SUCCESS - Test Successful

Closing TCP connection
Shutting down system debug logger
Test complete
Note in the last section where SUCCESS is indicated. The failure is due to the password not being correct.
LCD Console The Energy Monitoring Hub has an LCD console and two push buttons labeled “menu” and “select”. These can be used to configure some of the basic features of the Energy Monitoring Hub. The intended purpose of the console is to configure the Energy Monitoring Hub to a point where a computer can communicate with it for further detailed configuration.
When the Energy Monitoring Hub is running, it will show “AcquiSuite Ready” and the current time alternated with the Ethernet IP address. If you choose to enable the console display of data points, the LCD will also show the selected point names and current reading values. The display will change to the next listed item about once every 10 seconds. If a data point name is longer than will fit on the 16 character wide display, it will be scrolled. Pressing the select button will cause the display to change to the next configured item. Pressing the select button quickly will skip through multiple display points.
Pressing the Menu button will cause the main menu to appear. Once [Main Menu] is shown on the console, the menu button will change the menu option, and the select button will take action on the currently displayed option. Some options provide sub menus; others allow you to edit the option value. The following is a tree display of the main menu and sub menus.
[Main Menu]
TCP/IP Config
[TCP/IP Config]
IP Address
Netmask
Gateway
DNS Server #1
DNS Server #2
(previous menu)
Network Status
Dialin
Modbus Status
Upload Data Now
Shutdown
Reboot
(previous menu)
The TCP/IP sub menu will allow you to configure the Ethernet settings for the Energy Monitoring Hub. To edit the IP settings, use the menu button to change options, and press the select button to edit the option. Once selected, you will see the current value displayed and a blinking square cursor on the first character. Press the menu button to change the character or digit. Press the select button to use the digit and move the cursor to the right one space. If you press the select button multiple times, the cursor will move right a similar number of spaces, allowing you to skip over characters that may be correct based on the previous settings. When you are finished entering the IP address, select a blank space with the menu button, and press select. Any characters still remaining to the right of the cursor will be eliminated. (ie, if changing 128.193.100.200 to 10.0.0.1, the new IP address will be several digits shorter than the old one.
Network Status: This option will test the Ethernet connection by attempting to ping the following addresses: localhost, Ethernet IP address, gateway, dns1, dns2. The localhost ping will verify the kernel IP stack is properly initialized. The Ethernet ping will verify the Ethernet card's IP address is set and communicating with the kernel. The Ethernet ping test does not send any packets over the Ethernet cable however. The gateway ping test will verify that the gateway address responds to queries. This test is the first one that actually sends packets over the Ethernet wire. The gateway test does not verify the IP address of the gateway is correct, or that the gateway is working correctly, it only tests that the address specified as a gateway responds to a ping request. The DNS1 and DNS2 ping tests verify the IP addresses listed for DNS servers respond to ping requests. This test does not verify if the DNS servers can actually resolve DNS names to IP addresses.
For a more complete test, use the connection test web page in the Energy Monitoring Hub diagnostics menu.
Modbus Status: This option will report the number of devices currently detected by the Energy Monitoring Hub. The

display will show a device count for “Devices OK”, “New”, and “Failed”. These are as follows:
Devices OK: The number of Modbus devices that are presently working, and have been configured.
New: Devices that the Energy Monitoring Hub supports, and are working, but have not yet been given a name.
Failed: The number of Modbus devices that either stopped responding, or are not supported by the Energy Monitoring Hub.
Note: selecting the Modbus status option from the Energy Monitoring Hub console does not cause the Energy Monitoring Hub to search for new devices. The Energy Monitoring Hub checks for new devices in the background all the time, taking about 2.5 minutes to complete each pass through all 255 possible addresses. The Modbus test console option simply displays the number of devices the Energy Monitoring Hub presently knows about.
The Energy Monitoring Hub has a built in io module with 8 flex-I/O inputs. This module shows up in the Modbus listing as device 250, and is counted in the number of devices OK or New. I.e., if you have 1 Energy Monitoring Hub A8812 with a single Modbus power meter, the device count will be 2. (One for the meter, and one for the Energy Monitoring Hub on board IO)
Upload Data Now: If the Energy Monitoring Hub is configured to upload data using HTTP/POST to a webserver/database such as LEM, this option will cause the Energy Monitoring Hub to upload all stored data immediately. If the dialout option is enabled, an outbound phone call will be initiated, and disconnected after the transfer is complete.
Reboot: This option will reboot the Energy Monitoring Hub.
Shutdown: This option will stop the data logging processes and secure the flash memory. When secured, the console will state that the power may be disconnected. It is important to shut down the Energy Monitoring Hub cleanly prior to disconnecting the power from the device.
The Energy Monitoring Hub has an advanced menu that can be used to perform system checks and clear all configuration options to the default settings. To access the advanced menu, wait until the LCD shows “Energy Monitoring Hub Ready” and press both the Menu and Select buttons at the same time. Hold both down together for about 10 seconds. When the advanced menu is displayed, you may release the two buttons. The following is a tree display of the advanced menu.
[Advanced Menu]
Console on COM1 (RS485 port)
Check flash disk
Erase Log/Config
(previous menu)
The Check Flash Disk option will force the Energy Monitoring Hub to check the entire flash disk for file system integrity. This will require you to reboot the Energy Monitoring Hub.
The Enable Console feature will provide a shell prompt on the serial port for remote diagnostics. This is intended to be used by Leviton technical support only.
The Reset Configuration option will remove all the user settings, data, and passwords that have been configured and will return the Energy Monitoring Hub to the factory default settings. This is mainly useful when reconfiguring an Energy Monitoring Hub that has been used previously on a different job or project.
Log File Data The Energy Monitoring Hub stores data from the Modbus devices in text (csv) log files. One log file is created for each Modbus device on the system. On a daily basis, the log files are "rotated", that is the current log file is renamed and compressed with gzip compression, and a new log file is started. This allows the Energy Monitoring Hub to make efficient use of the flash memory. When the storage capacity is beyond 95% full, the oldest log file will be removed from the system.
Log File Status
The Energy Monitoring Hub can display a list of log files in the "log file data/status" web configuration page. A bar graph

will show the amount of storage capacity that is used by the existing log data. Below, a list of Modbus device log file will be displayed along with the file size and timestamp when the file was last modified.
Each Modbus device may have multiple log files. The log file name starts with “mb-xxx.” where xxx is the Modbus device id number. One file, with the .log extension is the file where the most recent data is being stored. Other log files have a .gz extension. These are older log data files that have been compressed to save space.
The file name will be a link that will open up a browser window to view the contents of the single log file. Clicking on the single log file will only show the contents of that log file, and not all historical data for the device. Use the log export feature if all log data is required.
Log File Format
Once you have downloaded the data from the Energy Monitoring Hub, you will need to process it. The file is an ASCII text file with comma delimited data. One line is recorded for each log cycle. The file will look something like the following example from a 4A4P-M IO Module.
'2002-01-31 18:30:00',0,0,0,-0.00,89.29,39.05,49.11,0,0,0,0 '2002-01-31 18:35:00',0,0,0x02,-0.01,104.24,39.05,49.11,0,0,0,0 '2002-01-31 18:40:00',0,0,0,,87.82,39.05,49.11,0,0,0,0 '2002-01-31 18:45:00',139,,,,,,,,,,
In this example, the first line shows a regular log entry. The second line shows a high range alarm for data point 2. The third column shows point 1 as invalid, and the fourth line shows the Modbus device is not responding.
Notice the following columns are shown.
1. Date/Time in UTC (GMT) time. This field is quoted to handle the space in the middle. The format is YYYY-MM-DD HH-MM-SS
2. Modbus error (if any). 0=no-error, see table below. 3. Low Range alarm bitmap (hex notation). 4. High Range alarm bitmap (hex notation) 5. Data point 1 6. Data point 2 7. - - - 8. Data point N
Comments:
Date/Time: The date/time column reports the time at which data was logged from the Modbus device. Note: this is not necessarily the time at the start of the log cycle. Users with large number of devices may notice some of the Modbus devices at higher address numbers report 1 or 2 seconds after the first Modbus devices. This is because the 9600baud speed of the Modbus loop is not fast enough to log all Modbus devices in less than 1 second. If a device does not respond during a log cycle, the Energy Monitoring Hub will attempt to query the device several more times. If a subsequent query is successful, the time of the successful query will be used in the log file but may be several seconds after the initial log cycle.
The log date/time is in Universal time. (UTC) This means that the data is logged with no shift for daylight savings time, and must be converted to local time for reporting purposes. When importing into a database, data should be kept in UTC time for ease of use. When reporting the final data, you should adjust the time to reflect the local time zone for which you are reporting. The data export option on the LEM website will prompt you for a time zone when you export the data, and will adjust the log date/time accordingly. Note: UTC is sometimes referred to as GMT. (Greenwich Mean Time)
Modbus Error: If the error value is not 0, the remainder of the columns for this line will be reported as NULL.
1 Operation not permitted 2 No such file or directory 3 No such process 4 Interrupted system call 5 Input/output error 6 No such device or address 9 Bad file descriptor 11 Resource temporarily unavailable 12 Cannot allocate memory 13 Permission denied 16 Device or resource busy

19 No such device 23 Too many open files in system 24 Too many open files 26 Text file busy 28 No space left on device 32 Broken pipe 101 Network is unreachable 110 Connection timed out 111 Connection refused 113 No route to host 129 Illegal Function (function was not allowed by the slave device) 130 Illegal Data Address (the data address is not allowed by the slave device) 131 Illegal Data Value 132 Illegal Response Length 139 Device Failed to Respond (the Modbus device may be off or disconnected) 140 Received invalid Modbus data checksum 160 Start log (Entry in log file after Energy Monitoring Hub starts up) 161 Stop log (Entry in log file if Energy Monitoring Hub is shut down properly) 162 System time changed, caused logger to restart logging for intervals. 163 System auto-restart 164 Log entry corrupt. 165 Modbus device restart detected. 192 Modbus device does not match the device type in the configuration file. 193 Modbus device's serial number changed. (could be two devices with the same Modbus address)
Low/High Range Alarms: This number is a hex representation showing which data points are out of range. 0x01 shows data point 1 in alarm state. 0x04 shows data point 3 in alarm state.
Data Points: Data points are shown in the same order as the Modbus device configuration display in the Modbus/device list page. Data is displayed in floating point form. When a specific point is unavailable (4A4P-M broken wire alarm) or the point is not supported as part of the configuration (phase B current on a single phase H8163 meter hookup) the point will be logged as blank. This preserves the column structure of the file, and allows notation of invalid data. SQL databases often accept blank or NULL as a valid entry in a data table to represent invalid data.
For data exported from the LEM website, the columns that are invalid (NULL) are reported as blank fields. This makes it easier to import into MS Excel as blank cells. With the current firmware, the Energy Monitoring Hub will report blank fields rather than "NULL" to make direct import of data from the Energy Monitoring Hub easier, as well as reduce the file size. Developers intending to use data files from the Energy Monitoring Hub should handle both the word "NULL" as well as a blank column as indications of an invalid data point.
Log Storage Capacity
The Energy Monitoring Hub uses approximately 8 Mbytes of flash disk for log file storage. As data from the Modbus meters is collected, it is appended to log files on this flash chip. Once a day (at the first call-out period for uploading data) the log files are "rotated". This action renames each log file and compresses the old file using gzip. The net result is a smaller file for storage or modem/Ethernet transfer.
Because the files are compressed, the actual size of the data on the flash chip will vary depending on the data itself. For example, if a device is reporting 25KWh, it will use fewer bytes than a log entry that has 9,999,999KWh.
We have measured a typical installation with 5 H8036 power meters and 5 A8923 IO modules, and determined the system will run for well over a hundred days with a 15 minute log cycle. Changing the number of meters, the type of log data, or the log cycle period will affect your results accordingly. Please read Technote “TN-03” at Leviton .com for more information about log file storage capacity.
When the Energy Monitoring Hub storage area on the flash starts to run out of space, the following action is taken:
When the 8 Mbyte log file storage area is 75% full, the Energy Monitoring Hub will immediately compress the log files and attempt to upload the data to the LEM website or user specified site. This action will not wait until the next scheduled upload time.
When the storage area is 95% full, the Energy Monitoring Hub will immediately attempt to upload the data, and if unsuccessful, will purge the oldest (rotated) log data file.

Log files are deleted automatically if the Energy Monitoring Hub has successfully uploaded the log file to a database server using the HTTP/Post protocol. If you do not configure the Energy Monitoring Hub to automatically push the log files to your server, you must manually delete them. To delete log files, refer to the FTP method of downloading log files. One step detailed in the FTP section is how to delete a log file from the Energy Monitoring Hub.
Uploading data to the Leviton Energy Manager website.
After the Energy Monitoring Hub has been configured and has logged some data, you will want to collect the data for analysis. There are several ways of collecting the data from the Energy Monitoring Hub including the Leviton Energy Manager hosted online service. Other methods are noted in the data collection FAQ. This section details configuring the Energy Monitoring Hub for use with the Leviton Energy Manager website (*Note: model # A8812-001 is pre configured with these settings).
Step 1: First, use your browser to connect to the Energy Monitoring Hub. Select the Modbus/Setup section from the menu on the left. In the field titled "Modbus Loop Name" enter a name for this Energy Monitoring Hub to uniquely identify it on the LEM website. Because the LEM site can show multiple Energy Monitoring Hub devices, it is important to have a descriptive name in this field.
Step 2: Select the “Log File Data”, “Setup/Upload” menu option. The following features are available:
Energy Monitoring Hub Serial Number: This is the serial number that uniquely identifies this Energy Monitoring Hub. This number cannot be changed. When uploading data to the LEM website, this serial number is used to identify the Energy Monitoring Hub to the LEM server.
Scheduled upload time: This option allows you to control when the Energy Monitoring Hub will initiate the upload process. You can select any hour of the day, and the Energy Monitoring Hub will select some time at random within that hour to start the upload. The random feature allows multiple Energy Monitoring Hub devices to share a single dialup account or phone line by not starting the dialout at the same time for all devices. If the Energy Monitoring Hub is on a LAN connection (DSL, Cable Modem, T1, etc) an upload time of "hourly" may be selected.
Upload data on alarm status change: This will cause the Energy Monitoring Hub to initiate the upload process if any point on any Modbus device enters or leaves an alarm state. This allows the Energy Monitoring Hub to send data when an alarm is detected, and will upload that information to the LEM website in a timely manner. The LEM website will then send email notifications if necessary. If this option is disabled, the LEM website may not be able to send notifications until the end of the day when the Energy Monitoring Hub calls in at its specified upload time.
Upload data on low disk alarm: This feature will cause the Energy Monitoring Hub to attempt a data upload immediately if the log file storage area is more than 75% full.
Allow remote Modbus device configuration: If enabled, users may remotely configure alarms and other Modbus device features on the LEM website. When the Energy Monitoring Hub uploads data to the LEM website, it will also download any new configuration information as needed. Note: if configuration changes are made to the Energy Monitoring Hub, those changes will be uploaded to the LEM site. If configuration changes are made at both the Energy Monitoring Hub and the LEM website, the most recent changes will be used.
Target Address to upload data: This is the website URL to upload data to. This should always be set to "http://www.buildingmanageronline.com/upload.php" unless you are configuring the Energy Monitoring Hub to send data to your own internal database server. (see the Data Collection FAQ at Leviton .com )
Password to upload data: This password is used by the LEM webserver to verify the Energy Monitoring Hub device authentication before accepting the uploaded data. You should select a password other than the default, and make note of it for future reference.
Number of times to retry: In the event of a failure (often due to dialup problems, busy signals, etc) this option specifies the number of retries to attempt the upload again. If all retries fail, the Energy Monitoring Hub will wait until the next scheduled upload time before trying again.
Time to wait before retry: In the event of a failure, the Energy Monitoring Hub can be configured to wait for a specified period of time before attempting another connection. This option specifies how long to wait before retrying.
Step 3: Contact the Leviton Technical Support department. Please have the Energy Monitoring Hub serial number and password to upload data handy. Your tech support representative will confirm your LEM account and will add the Energy Monitoring Hub to one of your client databases.
Step 4: Click the "Upload Data Now" button. Your data should be sent to the LEM webserver.
Step 5: For more detailed information about the transfer process, use the Connection Test page in the Testing/Diags menu on the Energy Monitoring Hub for a full report of the data upload progress.

Retrieving Data from the Energy Monitoring Hub Overview of how the system was designed to work.
Now that you have installed your Energy Monitoring Hub and configured it to collect data from your meters and sensors, you will want to collect the data from your Energy Monitoring Hub. This document will provide an overview for collecting data from the Energy Monitoring Hub. Processing the data for billing reports, summaries, and other data processing are beyond the scope of this document.
Three basic ways to collect data from the Energy Monitoring Hub:
HTTP download from the Energy Monitoring Hub with a browser (pull) FTP download from the Energy Monitoring Hub (pull) Enertrax DL download from the Energy Monitoring Hub. (pull) HTTP Post: The Energy Monitoring Hub uploads data to a database/webserver. (push)
HTTP Direct from the Energy Monitoring Hub
The Energy Monitoring Hub has the ability to export log file data to a web browser directly from the setup web pages. To use this feature, access the Energy Monitoring Hub setup menu with your web browser. Select the "Log File Export" page from the Log File Data menu on the left side of the page.
For each device, a separate log file will be saved. Select the device from the dropdown list provided. Specify Comma or Tab delimited data, and indicate if column headers are required. Click the download button to download the data.
The log file format is the same as is provided by FTP and by the LEM web site. Note: All timestamps are in UTC.
When importing log files into Microsoft Excel, be sure to specify the log data is comma separated, and use a single quote mark as the text delimiter.
FTP Direct from the Energy Monitoring Hub
The Energy Monitoring Hub will allow inbound connections for transfer of log data files using the FTP protocol. Ftp to the Energy Monitoring Hub and log in using the system admin password. Files are located in /var/log/Modbus. For further information on FTP log file transfer, please review the technote and FAQ section of the Leviton website.
Enertrax download direct from the Energy Monitoring Hub
Leviton provides a free tool called Enertrax DL that can automate the process of downloading log data from the Energy Monitoring Hub to your Windows PC hard drive. Enertrax DL can merge new log data into existing log files on your computer as well as provide configuration information about the Energy Monitoring Hub. Enertrax DL can also be configured to make LAN or Dilaup calls to one or more Energy Monitoring Hub or AcquiLite data acquisition servers. Enertrax DL can be obtained from the Leviton.com website in the Products section.
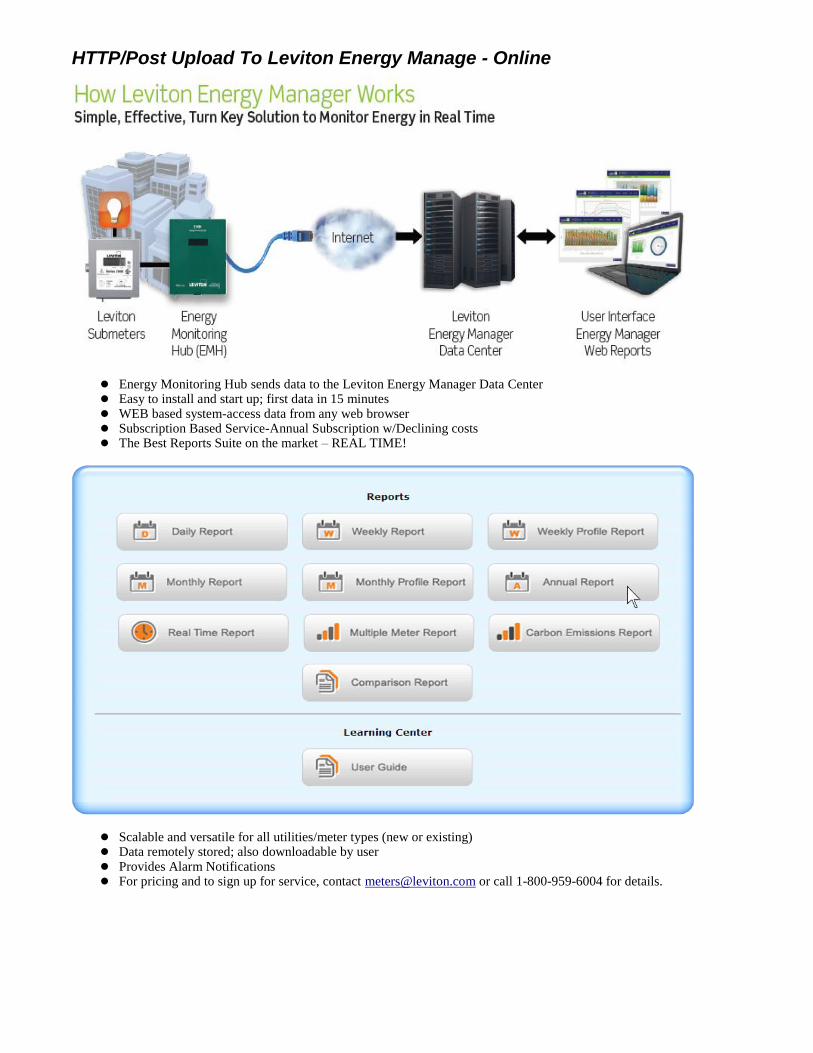
HTTP/Post Upload To Leviton Energy Manage - Online
Energy Monitoring Hub sends data to the Leviton Energy Manager Data Center Easy to install and start up; first data in 15 minutes WEB based system-access data from any web browser Subscription Based Service-Annual Subscription w/Declining costs The Best Reports Suite on the market – REAL TIME!
Scalable and versatile for all utilities/meter types (new or existing) Data remotely stored; also downloadable by user Provides Alarm Notifications For pricing and to sign up for service, contact [email protected] or call 1-800-959-6004 for details.

HTTP/Post Upload To Your Database Server
Energy Monitoring Hub uploads data directly to your webserver or database server. You must supply a script to process the incoming data. Sample script for ASP and PHP are available upon request. Requires Webserver, CGI Scripting and, database (SQL) knowledge Alarm processing available by processing data on your server when data is uploaded Designed for integration with existing energy reporting systems. Contact Leviton technical support for further details and sample scripts.
Removing Data from the Energy Monitoring Hub
When using an HTTP/Post method to allow the Energy Monitoring Hub to push data to a database server, the Energy Monitoring Hub will automatically remove log files from its' flash memory once the Energy Monitoring Hub has confirmed that the file was received by the database server. If you are using the Energy Monitoring Hub with a standalone mode, you can use FTP or Enertrax DL to delete log files from the flash memory. With EnertraxDL, simply check the setup checkbox to delete log data after download. For FTP, the process is essentially the same process as the manual FTP data download. For more information on FTP access to the Energy Monitoring Hub, please view the FAQ and Technotes section of the Leviton .com website. Steps for Microsoft Windows command prompt ftp.
Use the following commands.
ftp 192.168.40.50 Use the IP address of your Energy Monitoring Hub
username: root
password: admin The same as the admin password
cd /var/log/Modbus
dir view a list of log files.
mdel *.gz remove the log file to free up flash space
bye
The mdel command will tell the FTP software to delete all files ending in .gz in the current directory. Some FTP clients will allow you to specify a command “prompt” prior to using mdel that will prevent the FTP client software from asking if you are sure you wish to delete each file.
Linking to Energy Monitoring Hub Device Status Pages
It may be helpful to create a shortcut or a hyperlink on another web page that will direct the browser to bring up a specific device status page in your browser. To do this, right click on the page and select properties. The URL for the page will be shown on that dialog. Simply copy/paste this URL into your link.
The Energy Monitoring Hub can provide Modbus device data in XML format. This feature, coupled with browser based AJAX (Javascript) can provide a very powerful tool to allow the creation of custom web pages. Further examples of XML and its uses are available on the Leviton website in the Documentation/Technotes section.

Mechanical Drawings The Energy Monitoring Hub uses a metal enclosure that is approximately 9.25” x 8” x 2” deep. The Enclosure has a tab on the bottom that requires 2.5” clearance. Two 1.2” holes are provided in the bottom of the Energy Monitoring Hub for wiring purposes.
The Energy Monitoring Hub has 4 mounting holes for use with a #6 or #8 screw. The drawing above shows the relative position of the mounting holes.

Copyright © 2011 Leviton Manufacturing Company Incorporated. All Rights Reserved.
Information contained herein is subject to change without notice.
Document Release June 2011 Part # DI-000-XXXXXX
Leviton Lighting & Energy Solutions Division
20497 SW Teton, Tualatin OR 97062
Mailing Address: PO BOX 2210
Tualatin, OR 97062
Customer Service: (800) 736-6682 Technical Support: (800) 959-6004 Fax: (503) 404-5601
Email: [email protected] Internet: www.leviton.com