energy modelling for south africa, latest approaches...
TRANSCRIPT

Dr Tobias Bischof-NiemzChief Engineer
Energy Modelling for South Africa, Latest Approaches & Results in a Rapidly Changing Energy EnvironmentKeynote Address at STERG Symposium 2017
Dr Tobias Bischof-Niemz, Head of the CSIR Energy Centre
Stellenbosch, 13 July 2017
Cell: +27 83 403 1108Email: [email protected]

4
Research Groups overview: Value-chain logic, driven by end-user demand and system view
Energy Efficiency
Technologies
Demand Shaping
Technologies
Technology-focussed Research GroupsEnd user-focussed
Research Groups
System-focussed
Research Group
Energy
Meteorology
Renewable
Energy
Technologies
Battery
Technologies
Hydrogen
Technologies
Heat Storage
Technologies
Energy System
Design
Energy System
Operation
Industry demand / pull
System view on
technologies user requirements
Technology
performance and cost
(today and future)
Products (hardware), solutions (software)
Energy
Demand
ED
Energy
Supply
ESu
Energy
Storage
ESt
Energy
Systems
ESy
E. Market Design
(DoE/NERSA)EM
Energy
Industry (DTI)
EI
Energy-Autonomous Campus
EACReal-world implementation of research programme

5
CSIR’s Energy Centre currently has ~40 highly qualified staff members
EC Leadership
Energy Demand
Demand Assessment in
End-use Sectors
Demand-side Technologies
(energy efficiency & demand shaping)
Demand Forecasting
(short-term, long-term, spatially)
Energy Supply
Resource Assessment
(solar & wind)
Renewable Energy Technologies(solar, wind, biogas, small hydro, HPs)
Supply Forecasting
(short-term, spatially)
Energy Storage
Batteries
(design and integration)
Hydrogen(production and
storage)
Heat Storage
Storage System Integration
(P2eMobility, P2pumping)
Energy Systems
Energy Planning
Grid Planning
(incl. smart grids)
Island Grids
Energy-System Operations
Energy Markets and Policy
Energy Economics
Energy Markets(local, regional,
global)
Energy Regulation
Energy Trading
Energy Statistics
Energy Industry
Local Content
Energy Industry Development
???
Energy-Autonomous
Campus
EAC Energy Demand
EAC Energy Supply
EAC Energy Storage
EAC Grid Design
EAC Operations(control and visualisation)
Administrative Support Functions
Research Support Functions
1) Technical (labs, GIS)2) Project Management3) Specialist
1) Head2) Technical Lead3) Commercial Lead4) Operational Lead5) HCD Lead
38 33 41 29 14 18 194
112
1
0
21
7
11
0
0
2
9
2
4
0
1
1
6
13
31
11
4
10
0
Interns Bursars
21
4
Emp
loye
es
Inte
rns/
Stu
de
nts
~20
2
5
Emp
loye
es
ED ESu ESt ESy EM EI EAC
RSFASF
ECL
In recruitment
process
Position
filled
Long-term
plan

6
HCD Highlights: Quick ramp up, very strong and diverse team
Very fast, yet very high-profile ramp-up achieved sofar (from 0 in July 2014 to 40 in July 2017)
Entire leadership team (Research Group Leaders and Programme Managers) is South African and black
4 black female engineers (South African)
Examples of internationally recognised experts
• Former head of systems operations at Eskom, was in charge to operate entire national grid
• Energy Commissioner in the National Planning Commission led by Minister in the Presidency
• Former CEO/MD of Swaziland Electricity Company, well connected in the region
• Chief Engineer transmission grid planning for Eskom and the region

7
Context

8
World:In 2016, 124 GW of new wind and solar PV capacity installed globally
124
54
70
2015
120
63
57
2014
91
51
40
2013
73
35
38
2012
76
45
31
2011
7
2008
33
27
7
2007
22
20
3
2006
17
152
2005
13
121
2004
9
81
2003
9
81
2002
71
70
2001
77 0
2000
44 0
841
30
2010
56
39
17
2009
46
39
2016
Total South Africanpower system(approx. 45 GW)
Wind
Solar PV
Sources: GWEC; EPIA; BNEF; CSIR analysis
Global annual new capacity in GW/yr
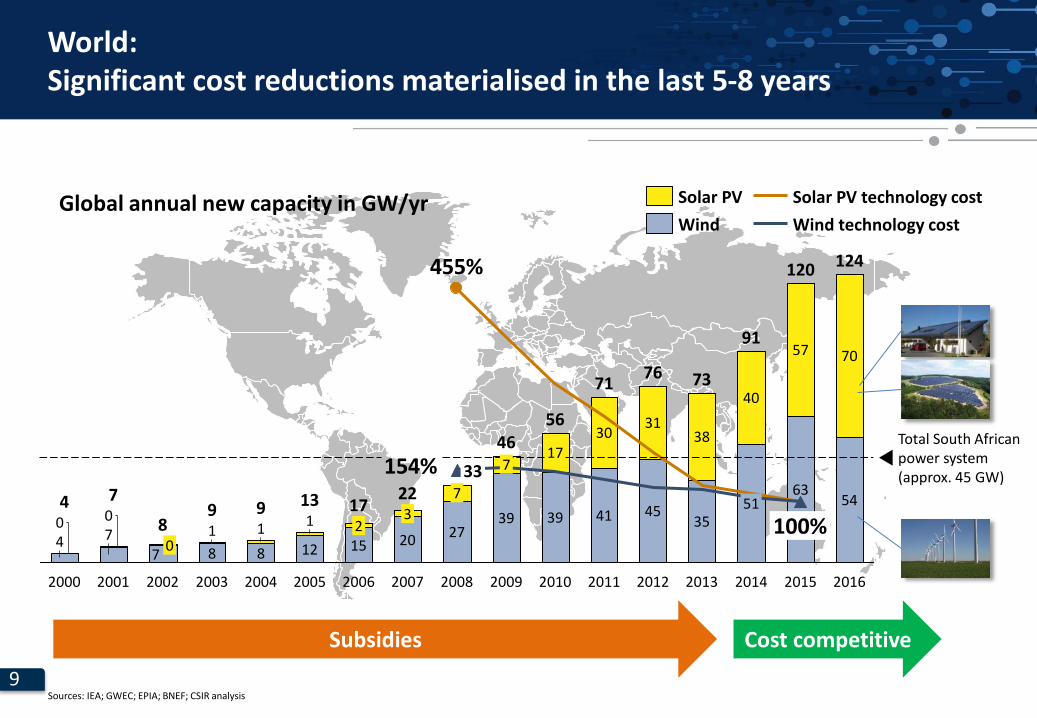
This is all very new: Roughly 80% of the globally existing solar PV capacity was installed during the last five years
9
World:Significant cost reductions materialised in the last 5-8 years
455%
154%7
70
2000
4
40
33
27
7
2007
22
20
3
2006
152
2005
13
12
1
2004
9
8
1
17100%
9
8
1
2002
8
70
2001 2003
124
54
70
2015
120
63
57
2014
91
51
40
2016
Total South Africanpower system(approx. 45 GW)
2013
73
35
38
2012
76
45
31
2011
71
41
30
2010
56
39
17
2009
46
39
7
2008
Wind technology cost
Solar PV
Wind
Solar PV technology cost
Sources: IEA; GWEC; EPIA; BNEF; CSIR analysis
Subsidies Cost competitive
Global annual new capacity in GW/yr

10
Renewables until today mainly driven by US, Europe, China and JapanGlobally installed capacities for three major renewables wind, solar PV and CSP end of 2015
40
82
1.9
USA
Sources: GWEC; EPIA; CSPToday; CSIR analysis
Europe
77
0.3
169
China
0.52.53.9
Middle Eastand Africa
7 04
Rest of Asia Pacific02
19
Americasw/o USA/Canada
Total RSA power
system (45 GW)
CSP
5.1
Solar PV
302
Wind
487
Total World
50
03
Japan9
29
0.2
India
064
Australia
Operational capacities in GW
end of 2016
2.3
111
161
2 012
Canada
South Africa has 1.5/1.5/0.2 GW installed capacity of wind, solar PV
and CSP end of 2016

16
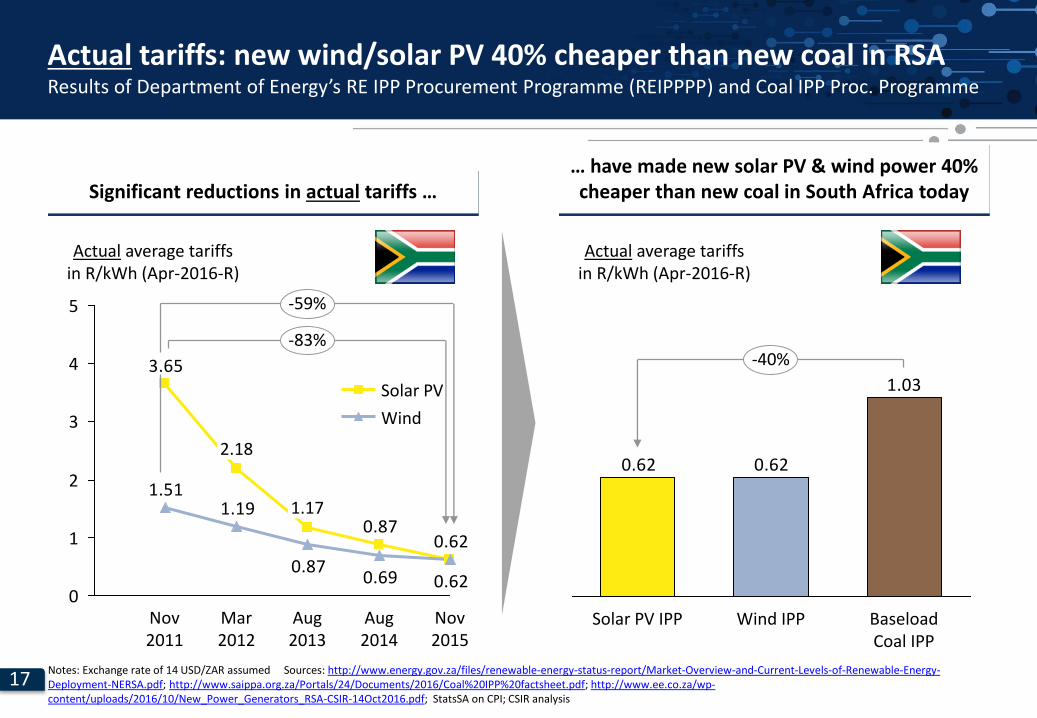
Significant reductions in actual tariffs …
REIPPPP results: new wind/solar PV 60-80% cheaper than first projectsResults of Department of Energy’s RE IPP Procurement Programme (REIPPPP) and Coal IPP Proc. Programme
0.620.87
3.65
0.620.690.87
1.191.51
0
1
2
3
4
5
-83%
-59%
Nov 2015
Aug 2014
Aug 2013
1.17
Mar 2012
2.18
Nov 2011
Wind
Solar PV
Notes: Exchange rate of 14 USD/ZAR assumed Sources: http://www.energy.gov.za/files/renewable-energy-status-report/Market-Overview-and-Current-Levels-of-Renewable-Energy-Deployment-NERSA.pdf; http://www.saippa.org.za/Portals/24/Documents/2016/Coal%20IPP%20factsheet.pdf; http://www.ee.co.za/wp-content/uploads/2016/10/New_Power_Generators_RSA-CSIR-14Oct2016.pdf; StatsSA on CPI; CSIR analysis
Actual average tariffsin R/kWh (Apr-2016-R)
17
Significant reductions in actual tariffs …
Actual tariffs: new wind/solar PV 40% cheaper than new coal in RSAResults of Department of Energy’s RE IPP Procurement Programme (REIPPPP) and Coal IPP Proc. Programme
0.620.87
3.65
0.620.690.87
1.191.51
0
1
2
3
4
5
-83%
-59%
Nov 2015
Aug 2014
Aug 2013
1.17
Mar 2012
2.18
Nov 2011
Wind
Solar PV
Notes: Exchange rate of 14 USD/ZAR assumed Sources: http://www.energy.gov.za/files/renewable-energy-status-report/Market-Overview-and-Current-Levels-of-Renewable-Energy-Deployment-NERSA.pdf; http://www.saippa.org.za/Portals/24/Documents/2016/Coal%20IPP%20factsheet.pdf; http://www.ee.co.za/wp-content/uploads/2016/10/New_Power_Generators_RSA-CSIR-14Oct2016.pdf; StatsSA on CPI; CSIR analysis
1.03
0.620.62
-40%
Baseload Coal IPP
Wind IPPSolar PV IPP
… have made new solar PV & wind power 40% cheaper than new coal in South Africa today
Actual average tariffsin R/kWh (Apr-2016-R)
Actual average tariffsin R/kWh (Apr-2016-R)

18
Approach to Power-System Planning
19
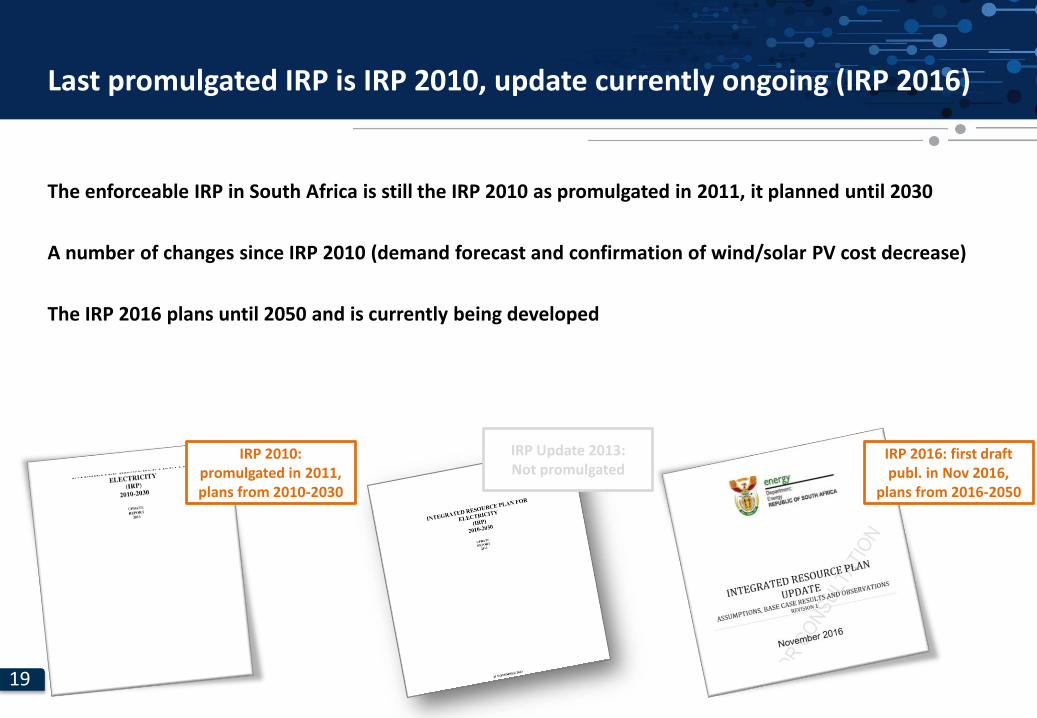
Last promulgated IRP is IRP 2010, update currently ongoing (IRP 2016)
The enforceable IRP in South Africa is still the IRP 2010 as promulgated in 2011, it planned until 2030
A number of changes since IRP 2010 (demand forecast and confirmation of wind/solar PV cost decrease)
The IRP 2016 plans until 2050 and is currently being developed
IRP 2010: promulgated in 2011, plans from 2010-2030
IRP 2016: first draft publ. in Nov 2016,
plans from 2016-2050
IRP Update 2013: Not promulgated

21
IRP process as described in the Department of Energy’s Draft IRP 2016 document: least-cost Base Case is derived from technical planning facts
Least CostBase Case
Scenario 2Scenario 1
Scenario 3
Case Cost
Base Case Base
Scenario 1 Base + Rxx bn/yr
Scenario 2 Base + Ryy bn/yr
Scenario 3 Base + Rzz bn/yr
… …
Constraint: RE limits
Constraint: e.g. forcing in of nuclear, CSP, biogas, hydro, others
Constraint: Advanced CO2
cap decline
1. Public consultationon costed scenarios
2. Policy adjustment of Base Case
3. Final IRP for approval and gazetting
PlanningFacts
Sources: based on Department of Energy’s Draft IRP 2016, page 7; http://www.energy.gov.za/IRP/2016/Draft-IRP-2016-Assumptions-Base-Case-and-Observations-Revision1.pdf
22
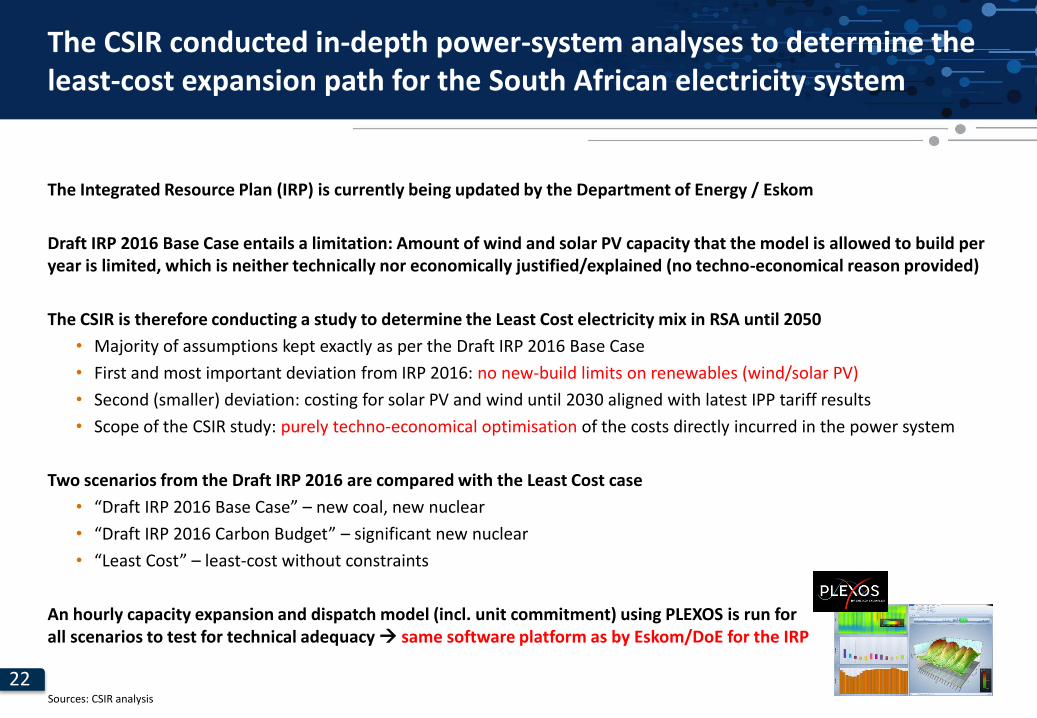
The CSIR conducted in-depth power-system analyses to determine the least-cost expansion path for the South African electricity system
The Integrated Resource Plan (IRP) is currently being updated by the Department of Energy / Eskom
Draft IRP 2016 Base Case entails a limitation: Amount of wind and solar PV capacity that the model is allowed to build per year is limited, which is neither technically nor economically justified/explained (no techno-economical reason provided)
The CSIR is therefore conducting a study to determine the Least Cost electricity mix in RSA until 2050
• Majority of assumptions kept exactly as per the Draft IRP 2016 Base Case
• First and most important deviation from IRP 2016: no new-build limits on renewables (wind/solar PV)
• Second (smaller) deviation: costing for solar PV and wind until 2030 aligned with latest IPP tariff results
• Scope of the CSIR study: purely techno-economical optimisation of the costs directly incurred in the power system
Two scenarios from the Draft IRP 2016 are compared with the Least Cost case
• “Draft IRP 2016 Base Case” – new coal, new nuclear
• “Draft IRP 2016 Carbon Budget” – significant new nuclear
• “Least Cost” – least-cost without constraints
An hourly capacity expansion and dispatch model (incl. unit commitment) using PLEXOS is run for all scenarios to test for technical adequacy same software platform as by Eskom/DoE for the IRP
Sources: CSIR analysis

23
[bR/yr]
Generation (Gx)
Total system
cost
Other(metering, billing, customer services,
overheads)
System services3
Distribution network
(Dx)
Transmission network
(Tx)
The IRP currently only optimises for the generation cost component of total system cost (this is the dominant component)
Optimised in PLEXOS model
Costs included in Gxoptimisation model:• CAPEX (plant level)• FOM1
• VOM2
• Fuel
Costs excluded in Gxoptimisation model:• Externalities e.g. CO2
emissions costs• Decommissioning
costs• Waste management
and/or rehabilitation• Major mid-life
overhaul• Shallow grid
connection costs
1 FOM = Fixed Operations and Maintenence costs; 2 VOM = Variable Operations and Maintenence costs; 3 Typically referred to as Ancillary Services includes services to ensure frequency stability, transient stability, provide reactive power/voltage control, ensure black start capability and system operator costs.
Not optimised in PLEXOS modelling framework(CSIR assumption for all scenarios = 0.30 R/kWh)
High-level costing applied to PLEXOS
outcomes
Not considered
Qualitatively discussed (quantified for system inertia)
Not considered
24
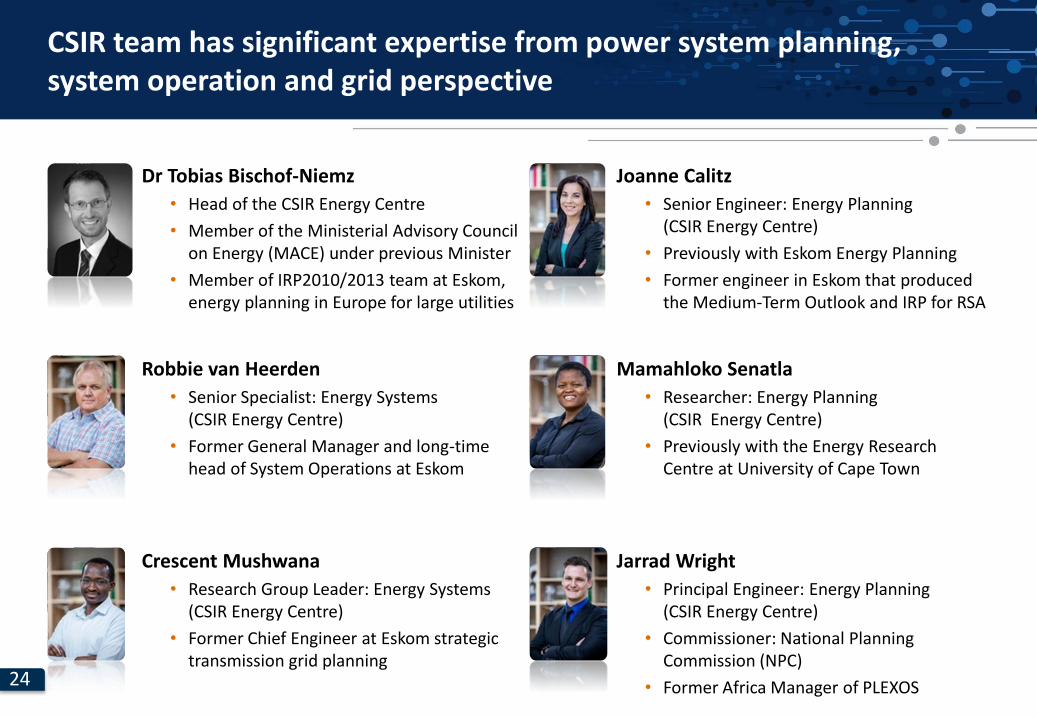
CSIR team has significant expertise from power system planning, system operation and grid perspective
Dr Tobias Bischof-Niemz
• Head of the CSIR Energy Centre
• Member of the Ministerial Advisory Council on Energy (MACE) under previous Minister
• Member of IRP2010/2013 team at Eskom, energy planning in Europe for large utilities
Jarrad Wright
• Principal Engineer: Energy Planning (CSIR Energy Centre)
• Commissioner: National Planning Commission (NPC)
• Former Africa Manager of PLEXOS
Robbie van Heerden
• Senior Specialist: Energy Systems (CSIR Energy Centre)
• Former General Manager and long-time head of System Operations at Eskom
Crescent Mushwana
• Research Group Leader: Energy Systems (CSIR Energy Centre)
• Former Chief Engineer at Eskom strategic transmission grid planning
Mamahloko Senatla
• Researcher: Energy Planning (CSIR Energy Centre)
• Previously with the Energy Research Centre at University of Cape Town
Joanne Calitz
• Senior Engineer: Energy Planning (CSIR Energy Centre)
• Previously with Eskom Energy Planning
• Former engineer in Eskom that produced the Medium-Term Outlook and IRP for RSA
25
Key Input Assumptions

26
450
400
300
350
500
550
250
200
150
100
50
0
428
2040
268
356
454
2050
522
344
Electricity Demand
in TWh/yr
203020202016
Input as per IRP 2016: Demand is forecasted to double by 2050Forecasted demand for the South African electricity system from 2016 to 2050
Sources: DoE (IRP 2016); Eskom MTSAO 2016-2021; StatsSA; World Bank; CSIR analysis
Note: by 2050 the electricity demand per capita would still be less than that of Australia today
IRP 2016
IRP 2010

27
400
350
300
550
500
450
0
50
100
200
150
250
82
2040
260
20202016
174
20502030
Electricity
in TWh/yr
Input as per IRP 2016: Decommissioning schedule for existing plantsEnergy supplied to the South African electricity system from existing plants between 2016 and 2050
Wind
CSP
Solar PV
Other
Peaking
Hydro+PS
Gas (CCGT)
Nuclear
Coal
Decommissioning of Eskom’s coal fleet
All power plants considered for “existing fleet” that are either:1) Existing in 20162) Under construction3) Procured (preferred bidder)
Demand
Sources: DoE (IRP 2016); Eskom MTSAO 2016-2021; StatsSA; World Bank; CSIR analysis
Existing supply

28
0
50
100
150
200
300
400
500
250
350
550
450
Electricity
in TWh/yr
20302020 2040 20502016
42084 254 439
428
344
522
Demand grows, existing fleet phases out – gap needs to be filledForecasted supply and demand balance for the South African electricity system from 2016 to 2050
Supply gap
Other
Peaking
Gas (CCGT)
Hydro+PS
Nuclear
Coal
Solar PV
CSP
Wind
The IRP model fills the supply gap in the least-cost manner, subject to any constraints imposed on the model
Demand
Note: All power plants considered for “existing fleet” that are either Existing in 2016, Under construction, or Procured (preferred bidder)Sources: DoE (IRP 2016); Eskom MTSAO 2016-2021; StatsSA; World Bank; CSIR analysis
Decommissioning of Eskom’s coal fleet

29
PLEXOS actual inputs are individual cost items that together with the utilisation of the plant (a model output) allow to calculate LCOE
Overnight Cost (plant level)
Construction Cash Schedule
Discount Rate
Economic Lifetime
Fixed O&M (FOM)
Variable O&M (VOM)
Fuel Price
Heat Rate (1/efficiency)
FIXED COST
VARIABLE COST
LCOE
Utilisation (capacity factor)
R/kW
%/a
%
a
h/a
R/kW/a
R/kWh
R/GJ
kJ/kWh
CAPEX(plant level)
R/kW
Annualised CAPEX
R/kW/a
Fuel Cost
R/kWh
R/kW/a
R/kWh
f
f
+
x
+
./. +R/kWh
PLEXOS inputs
PLEXOS output

30
0.620.62
Variable(Fuel)
Fixed(Capital, O&M)
Diesel (OCGT)
3.69
Gas (OCGT)
2.89
Mid-merit Coal
1.41
Gas (CCGT)
1.41
Nuclear
1.09
Baseload Coal (PF)
1.00
Wind
2011
Solar PV
2011
Inputs as per IRP 2016:Key resulting LCOE from cost assumptions for new supply technologies
50%90% 50% 10%Assumed capacity factor2 10%
Today’s new-build lifetime cost per energy unit1
(LCOE) in R/kWh (April-2016-Rand)
1 Lifetime cost per energy unit is only presented for brevity. The model inherently includes the specific cost structures of each technology i.e. capex, Fixed O&M, variable O&M, fuel costs etc.2 Changing full-load hours for new-build options drastically changes the fixed cost components per kWh (lower full-load hours higher capital costs and fixed O&M costs per kWh); Assumptions: Average efficiency for CCGT = 55%, OCGT = 35%; nuclear = 33%; IRP costs from Jan-2012 escalated to May-2016 with CPI; assumed EPC CAPEX inflated by 10% to convert EPC/LCOE into tariff; Sources: IRP 2013 Update; Doe IPP Office; StatsSA for CPI; Eskom financial reports for coal/diesel fuel cost; EE Publishers for Medupi/Kusile; Rosatom for nuclear capex; CSIR analysis
82%
As per South African IRP 2016
0 0 1 000 0 1 000400 600 600
CO2 in kg/MWh

31
Supply technologies (technical characteristics)
Sources: CSIR Wind and solar Aggregation Study
Similar to the IRP 2016 - wind and solar PV profiles for 27 supply areas (with exclusion masks) were used
NOTE: These profiles were then aggregated into one profile that defines expected new wind and solar PV profiles

32
0.0
0.1
0.2
0.3
0.4
0.5
0.6
0.7
0.8
0.9
1.0
Hour of the year
Normalised power output
Wind: supply profile assumptions
UtilisationAnnual capacity factor = 36%

33
Solar PV: supply profile assumptions
0.0
0.1
0.2
0.3
0.4
0.5
0.6
0.7
0.8
0.9
1.0
Hour of the year
Normalised power output Utilisation
Annual capacity factor = 20.4%
34
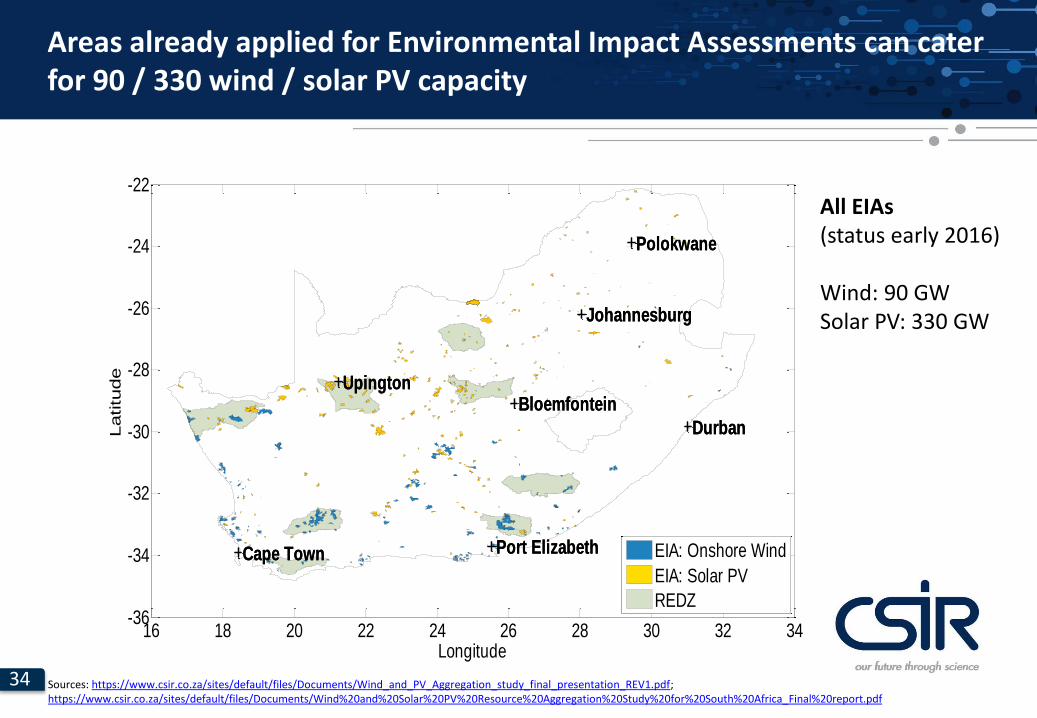
Areas already applied for Environmental Impact Assessments can cater for 90 / 330 wind / solar PV capacity
16 18 20 22 24 26 28 30 32 34-36
-34
-32
-30
-28
-26
-24
-22
Johannesburg
Cape Town
Durban
Upington
Port Elizabeth
Bloemfontein
Polokwane
Johannesburg
Cape Town
Durban
Upington
Port Elizabeth
Bloemfontein
Polokwane
Longitude
Latitu
de
EIA: Onshore Wind
EIA: Solar PV
REDZ
All EIAs(status early 2016)
Wind: 90 GWSolar PV: 330 GW
Sources: https://www.csir.co.za/sites/default/files/Documents/Wind_and_PV_Aggregation_study_final_presentation_REV1.pdf; https://www.csir.co.za/sites/default/files/Documents/Wind%20and%20Solar%20PV%20Resource%20Aggregation%20Study%20for%20South%20Africa_Final%20report.pdf

35
Results

36
Draft IRP 2016 Base Case is a mix of roughly 1/3 coal, nuclear, RE each
Draft IRP 2016 Base Case
100
550
400
450
500
350
300
250
200
150
50
0
13
2016
243
202
28(5%)
15
33(6%)
47(9%)
93(18%)
2040
15
434
Total electricity produced in TWh/yr
223
35
33
43
66
22
2030
350
238
2215
36
2050
528
173(33%)
148(28%)
Nuclear
Peaking Hydro+PS Coal
Gas (CCGT)Solar PV Wind
CSPSources: DoE Draft IRP 2016; CSIR analysis
As per Draft IRP 2016
More stringentcarbon limits

37
Draft IRP 2016 Carbon Budget case: 40% nuclear energy share by 2050
Draft IRP 2016 Base Case Draft IRP 2016 Carbon Budget
400
250
200
150
100
50
550
500
450
0
350
300
Total electricity produced in TWh/yr
15
2050
528
22 148(28%)
33(6%)
47(9%)
93(18%)
28(5%)
2040
434
223
35
33
4336
22
2030
350
238
15
173(33%)
13
2016
243
202
15
66
Coal
Nuclear
Hydro+PS
Gas (CCGT)
Peaking
Wind
CSP
Solar PV
0
550
450
500
400
350
300
250
200
150
100
50
54
25
63
23 74(14%)
243
202
1515
2050
Total electricity produced in TWh/yr
528
78(15%)
185(35%)
32(6%)
110(21%)
44(8%)
2040
435
103
121
26
2016
33
103
39
2030
350
170
As per Draft IRP 2016
More stringentcarbon limits
Sources: DoE Draft IRP 2016; CSIR analysis
No RE limits, reduced wind/solar PV costing, warm water demand flexibility

38
Least Cost case is largely based on wind and solar PV
Draft IRP 2016 Base Case Least CostDraft IRP 2016 Carbon Budget
300
550
500
450
400
350
150
100
50
250
200
0
Total electricity produced in TWh/yr
2050
529
60(11%)
33(6%)
55(10%)
257(49%)
109(21%)
2040
436
97
14
18
80
27
2016
250
27
1516
12(2%)
10
176
18
86
2030
351
190
15
207
As per Draft IRP 2016
More stringentcarbon limits
No RE limits, reduced wind/solar PV costing, warm water demand flexibility
Sources: DoE Draft IRP 2016; CSIR analysis
400
550
500
450
350
300
250
200
150
100
50
0
33(6%)
47(9%)
93(18%)
28(5%)
350
434
223
35
33
43
2040
66
22
2030
238
1522
3613
2016
243
202 173(33%)
1515
2050
528
148(28%)
Total electricity produced in TWh/yr
Coal
Nuclear
Hydro+PS
Gas (CCGT)
Peaking
Wind
CSP
Solar PV
500
550
350
450
400
300
250
200
150
100
50
0
Total electricity produced in TWh/yr
2050
528
78(15%)
185(35%)
32(6%)
74(14%)
110(21%)
44(8%)
2040
435
103
121
26
33
103
39
2030
350
170
54
25
63
23
2016
243
202
1515

39
Least Cost means no new coal and no new nuclear until 2050, instead 85 GW of wind and 74 GW of solar PV plus flexible capacities
Draft IRP 2016 Base Case Least CostDraft IRP 2016 Carbon Budget
150
0
300
250
200
100
50
Total installed net capacity in GW
2050
135
25
208
2213
30
16
2040
111
335 8
1712
2112
2030
85
39
2 68
117
2016
51
37
5 3
Coal
Nuclear
Hydro+PS
Gas (CCGT)
Peaking
Wind
CSP
Solar PV
0
300
250
200
150
100
50
10268
33
10
36
25
2040
129
1917
819
8
34
22
2030
98
34
7 8
Total installed net capacity in GW
2013
2016
51 105 3
2050
149
37
100
50
250
0
200
150
37
4 350
2050
234
108
19
37
85
74
2040
173
17 2510
27
58
Total installed net capacity in GW
2030
98
33
2
52
13
25
15
2016
5
As per Draft IRP 2016
More stringentcarbon limits
Plus 3 GW demand response from residential
warm water provision
Note: REDZ = Renewable Energy Development ZonesCurrent REDZ cover 7% of South Africa‘s land massSources: DoE Draft IRP 2016; CSIR analysis
No RE limits, reduced wind/solar PV costing, warm water demand flexibility

40
Conservative renewables and battery costing:Least Cost is R60-75 billion/yr cheaper than Draft IRP 2016 by 2050
IRP 2016 Base Case
688 627700
5%
18%
1%0%9%
6%28%
19%
14%
0%
Solar PV
CSP
Wind
Other storage
Biomass/-gas
Peaking
Gas
Hydro + PS
Nuclear (new)
Nuclear
Coal (new)
Coal
IRP 2016 Carbon Budget Least Cost
8%
21%
0%0%
16%
6%
35%
13%
0%
21%
49%
1% 2%
10%
6%11%
18
99 86
41
187
15
Energy Mix
in 2050
Costin 2050
Environ-mentin 2050
Jobs2
in 2050
Total system cost1 (R-billion/yr)
Average tariff (R/kWh) 1.34
CO2 emissions (Mt/yr)
Water usage (billion-litres/yr)
Direct & supplier(‘000)
1.32 1.20
310-325
Demand: 522 TWh
As per Draft IRP 2016
2050
235-253252-295
1 Only power generation (Gx) is optimised while cost of transmission (Tx), distribution (Dx) and customer services is assumed as ≈0.30 R/kWh (today‘s average cost for these items) 2 Lower value based on McKinsey study (appendix of IEP), higher value based on CSIR assumption with more jobs in the coal industry; Sources: Eskom on Tx, Dx cost; CSIR analysis; flaticon.com
Because of lack of data, zero jobs for
biomass/-gas assumed (affects Decarbonised)
10% cheaper
Cleaner
10-20%more jobs

41
Operational Aspects
42
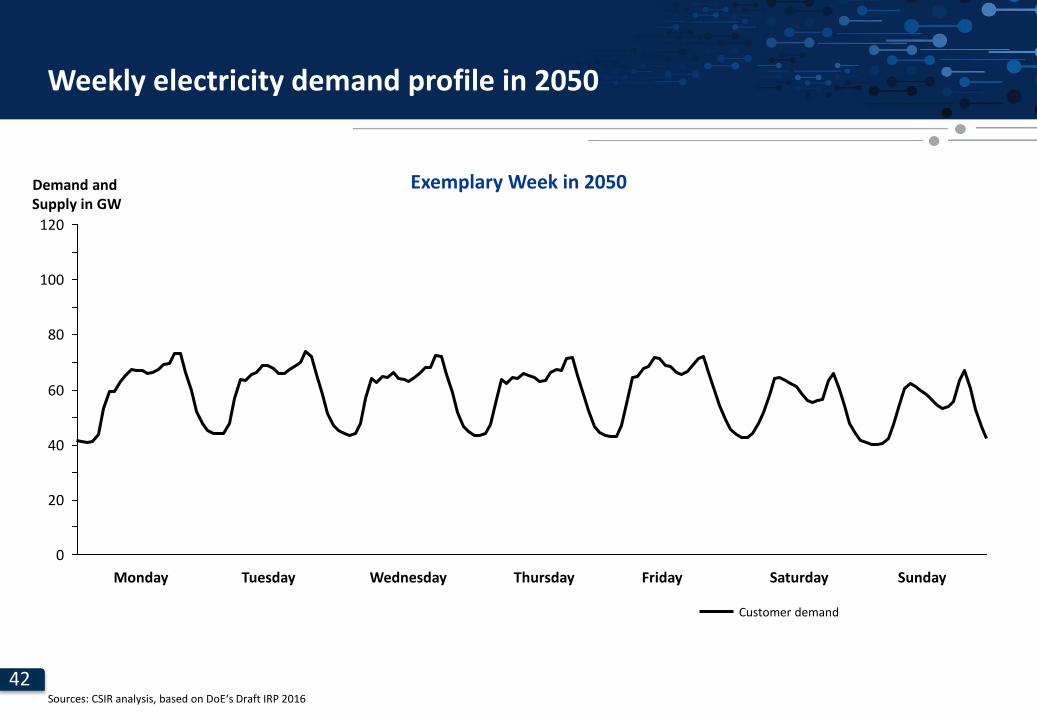
Demand and Supply in GW
120
0
20
80
40
60
100
Weekly electricity demand profile in 2050
Monday Tuesday Wednesday Thursday Friday Saturday Sunday
Sources: CSIR analysis, based on DoE‘s Draft IRP 2016
Customer demand
Exemplary Week in 2050

43
Demand and Supply in GW
120
0
20
80
40
60
100
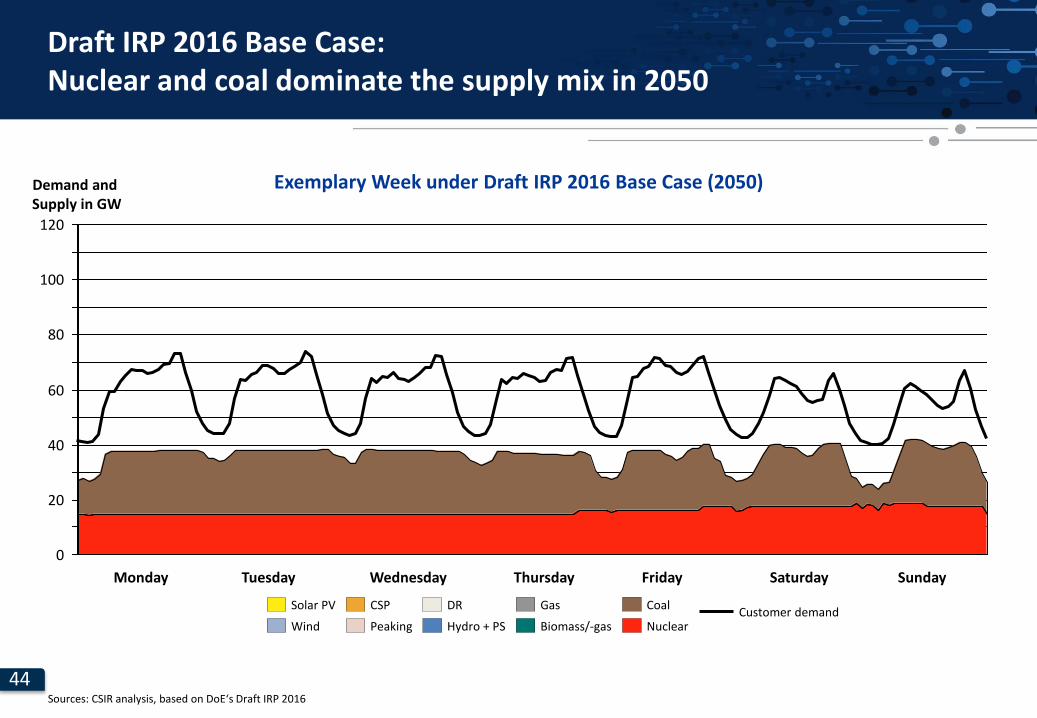
Draft IRP 2016 Base Case: Nuclear and coal dominate the supply mix in 2050
Monday Tuesday Wednesday Thursday Friday Saturday Sunday
Sources: CSIR analysis, based on DoE‘s Draft IRP 2016
Customer demand
Exemplary Week under Draft IRP 2016 Base Case (2050)
Coal
Hydro + PS Biomass/-gas
GasDRCSP
Wind
Solar PV
Peaking Nuclear
44
Demand and Supply in GW
120
0
20
80
40
60
100
Draft IRP 2016 Base Case: Nuclear and coal dominate the supply mix in 2050
Monday Tuesday Wednesday Thursday Friday Saturday Sunday
Sources: CSIR analysis, based on DoE‘s Draft IRP 2016
Customer demand
Exemplary Week under Draft IRP 2016 Base Case (2050)
Coal
Hydro + PS Biomass/-gas
GasDRCSP
Wind
Solar PV
Peaking Nuclear

45
Demand and Supply in GW
120
0
20
80
40
60
100
Draft IRP 2016 Base Case: Nuclear and coal dominate the supply mix in 2050
Monday Tuesday Wednesday Thursday Friday Saturday Sunday
Sources: CSIR analysis, based on DoE‘s Draft IRP 2016
Customer demand
Exemplary Week under Draft IRP 2016 Base Case (2050)
Coal
Hydro + PS Biomass/-gas
GasDRCSP
Wind
Solar PV
Peaking Nuclear
46
Demand and Supply in GW
120
110
100
90
80
70
60
50
40
30
20
10
0
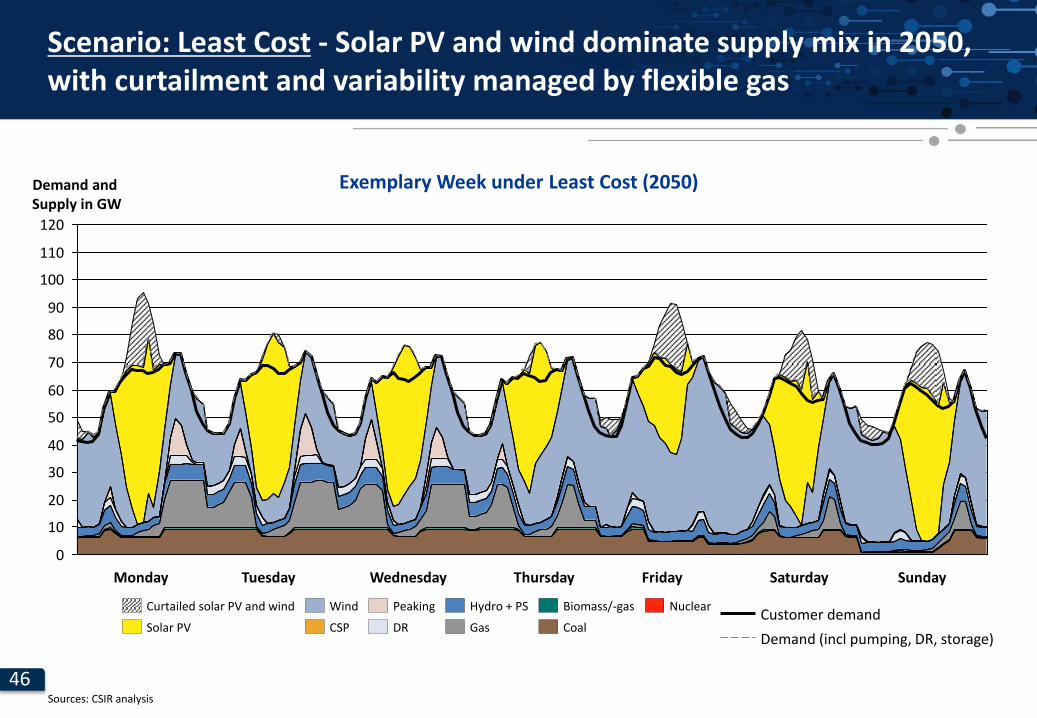
Scenario: Least Cost - Solar PV and wind dominate supply mix in 2050, with curtailment and variability managed by flexible gas
Monday Tuesday Wednesday Thursday Friday Saturday Sunday
Sources: CSIR analysis
Demand (incl pumping, DR, storage)
Customer demand
Exemplary Week under Least Cost (2050)
CoalGas
NuclearHydro + PS Biomass/-gas
DR
Peaking
CSP
Wind
Solar PV
Curtailed solar PV and wind

47
IRP PLEXOS model only optimises for cost of power generation (Gx) –two additional key aspects considered: system stability and grid cost
System Stability (inertia): worst case below 1% of Gx cost
• Connecting nuclear/coal via HVDC and/or solar PV/wind to the grid reduces the “system inertia”
• This reduces the inherent stabilising effect of synchronous inertia during contingency events
• Technical solutions to operate low-inertia system exist
• In this study the “worst case” was costed
‒ State-of-the-art technology (very high costs assumed, no further tech/cost advancements)
‒ Assumption: No further increase in engineering of how to deal with low-inertia systems by 2050
• In all scenarios, the worst-case-cost are well below 1% of the total cost of power generation (Gx) by 2050, cost differences between scenarios are much lower than 1%
Transmission grid cost: Gx Least Cost also cheapest for Tx
• High-level cost estimate for shallow and deep grid connection cost for all scenarios was developed
• Least Cost (Gx) case is additionally R20-30 billion/yrcheaper compared to Draft IRP 2016 Base Case and Carbon Budget case on transmission grid side

48
Next Steps and Summary

49
What has not been considered yet that makes Least Cost even cheaper?
Further cost reductions in solar PV, wind and battery technologies
• Solar PV cost were assumed to only decrease 20% by 2050
• Wind and battery cost were assumed to stay constant until 2050
• CSP cost were assumed to decrease to only 1.2 R/kWh until 2030 (for mid-merit operations)
With realistic cost reductions assumed, Least Cost is 25-30% cheaper than the IRP Base Case
Increasing penetration of Electric Vehicles (EV)
• No EV uptake assumed at all
With 5 million EVs by 2050, a large source of flexible demand is introduced into the system
Demand side flexibilisation only marginally considered
• Only source of flexibility considered: domestic electric warm water provision
With all heat/cool & pumping load made flexible, large source of flexible demand can be introduced
Transmission grid expansion for distributed power generators less costly
• Transmission grid costs assumed to be equal for all scenarios
Preliminary costing: transmission for Least Cost additionally R20-30 billion per year cheaper

50
Summary: A mix of solar PV, wind and flexible power generators is least cost
It is cost-optimal to aim for >70% renewable energy share by 2050
• Solar PV, wind and flexible power generators (e.g. gas, CSP, hydro, biogas, demand response) are the cheapest new-build mix for the South African power system
• There is no technical limitation to solar PV and wind penetration over the planning horizon until 2050
“Clean” and “least-cost” is not a trade-off anymore: South Africa can de-carbonise its electricity sector at negative carbon-avoidance cost
• The “Least Cost” mix is >R70 billion per year cheaper by 2050 than the current Draft IRP 2016 Base Case
• Additionally, Least Cost mix reduces CO2 emissions by 55% (-100 Mt/yr) over Draft IRP 2016 Base Case
Note: Wind and solar PV would have to be 50% more expensive than assumed before the IRP Base Case and the Least Cost case break evenSources: CSIR analysis

51
Outlook for Energy Planning beyond Electricity
52
0
5
10
15
20
25
30
35
40
45
50
55
60
65
70
GW
Monday Saturday SundayWednesdayTuesday FridayThursday
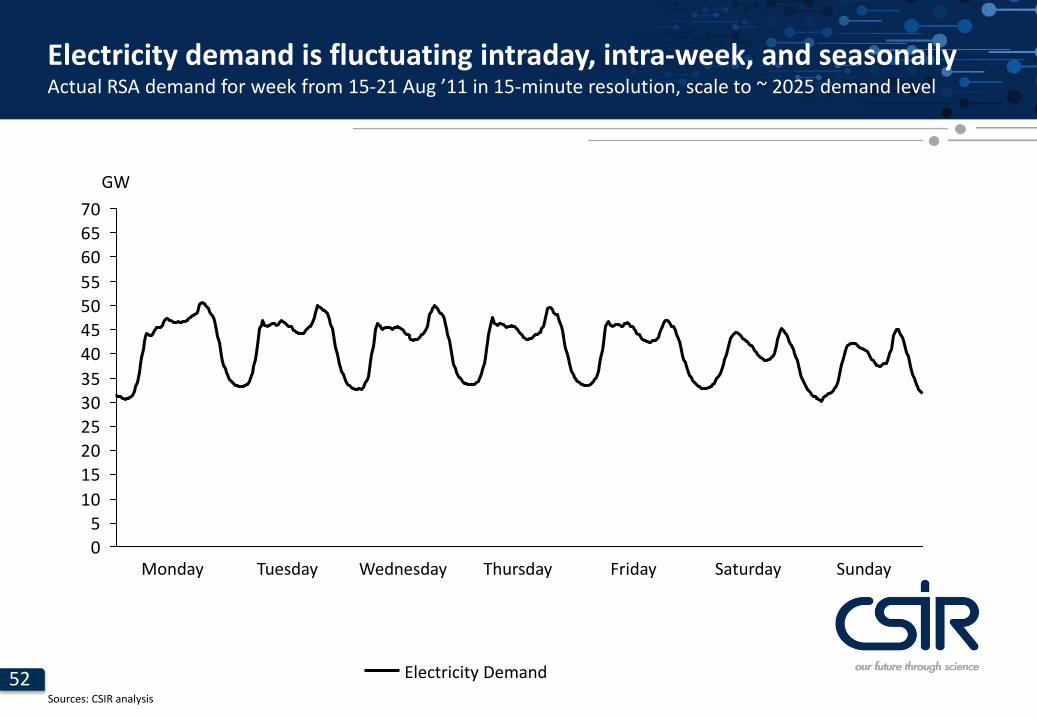
Electricity demand is fluctuating intraday, intra-week, and seasonallyActual RSA demand for week from 15-21 Aug ’11 in 15-minute resolution, scale to ~ 2025 demand level
Sources: CSIR analysis
Electricity Demand
53
0
5
10
15
20
25
30
35
40
45
50
55
60
65
70
Day of the week
SaturdayWednesday Thursday FridayMonday Tuesday Sunday
GW
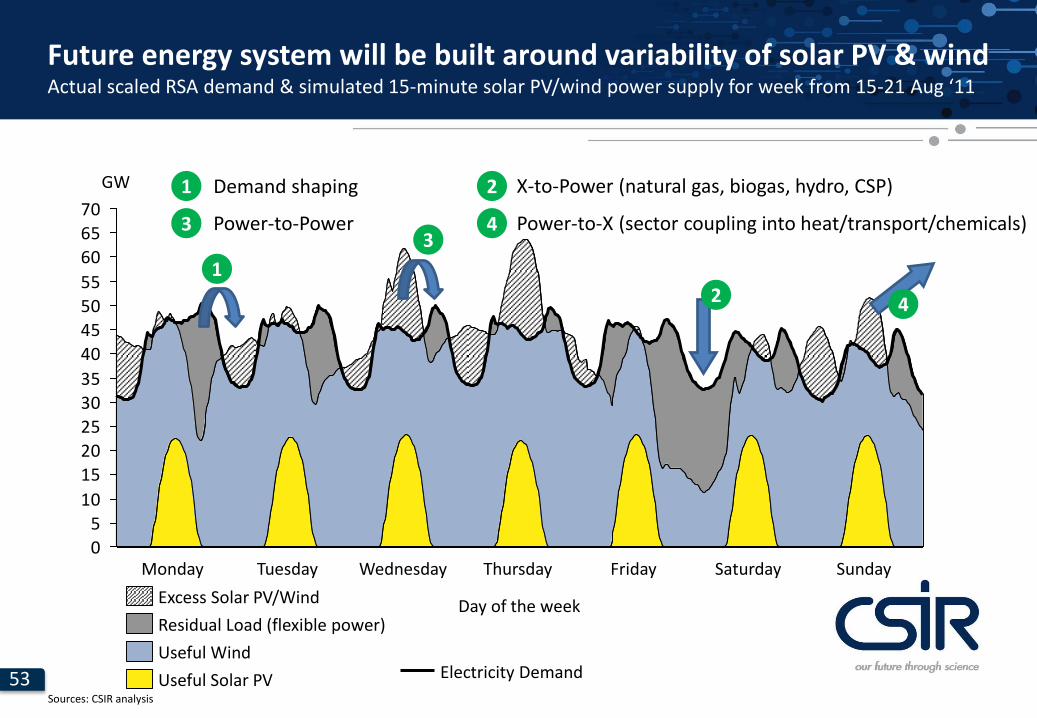
Future energy system will be built around variability of solar PV & windActual scaled RSA demand & simulated 15-minute solar PV/wind power supply for week from 15-21 Aug ‘11
Excess Solar PV/Wind
Residual Load (flexible power)
Useful Wind
Useful Solar PVSources: CSIR analysis
3
1
42
1
3
2
4
Demand shaping
Power-to-Power
X-to-Power (natural gas, biogas, hydro, CSP)
Power-to-X (sector coupling into heat/transport/chemicals)
Electricity Demand

54
0
5
10
15
20
25
30
35
40
45
50
55
60
65
70
GW
0
5
10
15
20
25
30
35
40
45
50
55
60
65
70
GW
SundaySaturdayFridayThursdayWednesdayTuesdayMonday
Nuclear can add carbon-free electricity: cost, not a technical questionActual scaled RSA demand & simulated 15-minute solar PV/wind power supply for week from 15-21 Aug ‘11
Useful Wind
Residual Load (flexible power)
Excess Solar PV/Wind Nuclear
Useful Solar PVSources: CSIR analysis
Electricity Demand
3
1
42
1
3
2
4
Demand shaping
Power-to-Power
X-to-Power (natural gas, biogas, hydro, CSP)
Power-to-X (sector coupling into heat/transport/chemicals)
55
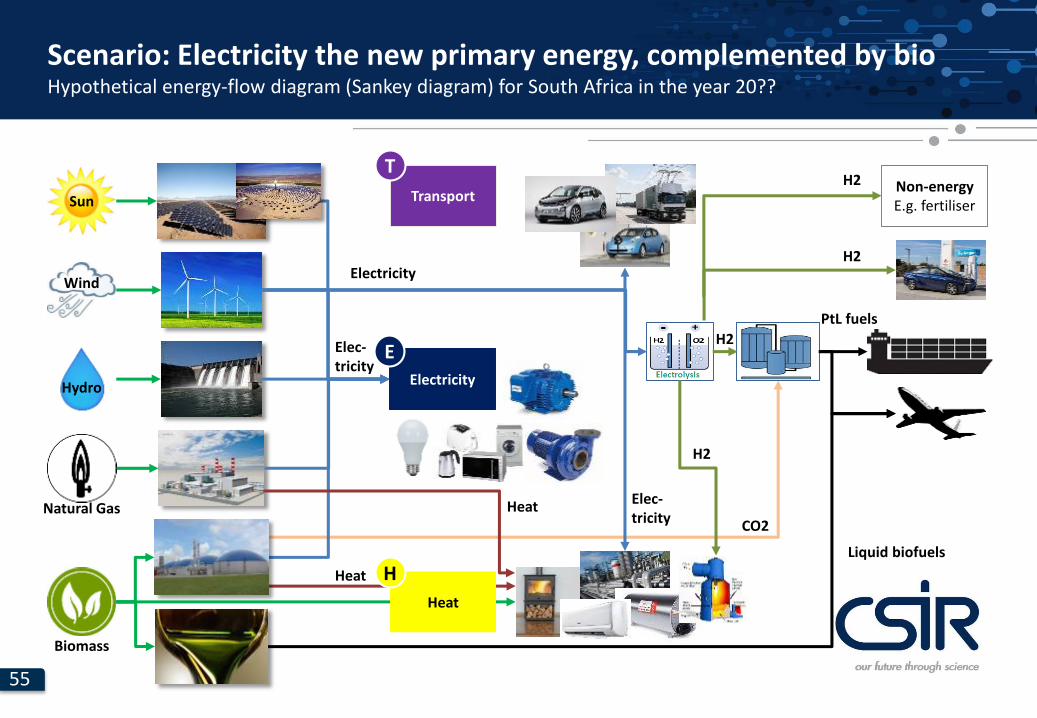
Scenario: Electricity the new primary energy, complemented by bioHypothetical energy-flow diagram (Sankey diagram) for South Africa in the year 20??
Transport
T
CO2
H2
PtL fuels
H2
Liquid biofuels
Electricity
E
Heat
H
Sun
Wind
Hydro
Biomass
Natural Gas
Heat
Heat
Electricity
Elec-tricity
Non-energyE.g. fertiliser
H2
H2
Elec-tricity
56
Thank you
Re a leboga
SiyathokozaEnkosi
Siyabonga
Re a leboha
Ro livhuha
Ha Khensa
Dankie
Note: „Thank you“ in all official languages of the Republic of South Africa