energy management in buildings - diva-portal.org952035/fulltext01.pdf · este fin se ha trabajado...
TRANSCRIPT
1
Energy Management in Buildings
Victor Liang
Paulo Monsalve
Bachelor of Science Thesis in Sustainable Energy Engineering
MJ146X
KTH – Department of Energy Technology


Bachelor of Science Thesis EGI-2016
Energy Management in Buildings
Victor Liang
Paulo Monsalve
Approved
2016-06-01
Examiner
Catharina Erlich
Supervisor
Jaime Arias
Commissioner
Department of Energy Technology, KTH
Contact person

Abstract
This report is the result of a minor field study (MFS) performed in the Dominican Republic. The
country strongly relies on energy sources from adjacent countries, currently the nation depends on
fossil fuel for 86 % of its electricity generation and in 2011, 8.6 % of its GDP was spent on fossil
fuel imports. Since the country has a growing middle-class the demand for energy is increasing
intensively and makes the necessity of a transition to a more sustainable energy system crucial for
future growth. This project mainly focuses on the energy use in buildings and to analyze the
situation, Emilio Rodríguez Demorizi library at Instituto Tecnológico de Santo Domingo was taken
as case study.
In order to evaluate the current situation an energy audit was performed, for simulations
RETScreen was used, an energy management tool that enables modeling of a buildings energy use.
The program allows the user to inspect the current consumption and demands and later propose
a solution in order to make the investigated object more efficient. Components such as, lighting,
electric equipment, ventilation and climate system are taken into account. Also the behavioral needs
of the occupants in the building have been analyzed. However, no technical solution will actually
be implemented and the study will be restricted to the area of Santo Domingo.
The result of the study showed that more electricity was used in the afternoon compared to
mornings and evenings. The biggest factor for this increase is due to the use of climate systems
which accounts for 71% of the yearly electricity consumption. An improved case was suggested,
where upgrades were made in climate systems and electrical equipment and simulations in
RETScreen show that electricity use can be decreased by 56 % if the proposed case was to be
implemented. An investigation has been made on a proposed solar project, it would only cover 4%
of the buildings annual electricity need in the current state and 10 % of the annual need in the
proposed case, a conclusion has been made that at the moment the solar project would not be
financially viable, considering the size of the investments that would be needed. However, in the
future when more advanced technology is affordable and available it might be worth bearing in
mind. Furthermore, the behavioral needs of the occupants in the building substantially contribute
to the energy utilization in the building, major reductions can be made if cooling which is the main
factor for electricity consumption, was used only when and where needed.
Keywords: Dominican Republic, INTEC library, RETScreen, Energy management, Climate
control systems

Sammanfattning
Detta kandidatexamensarbete är resultatet av en MFS-studie utförd i Dominikanska Republiken.
Landet är starkt beroende av energikällor från angränsande länder, för närvarande är 86 % av
elektricitet producerad från fossila bränslen, 2011 spenderade landet 8,6 % av dess BNP på bränsle
import. Då landet har en växande medelklass ökar efterfrågan på energi och gör behovet av en
övergång till hållbar energiteknik avgörande för framtida tillväxt. Denna rapport fokuserar
huvudsakligen på energianvändning i byggnader. Som fallstudie har biblioteket Emilio Rodríguez
Demorizi på Instituto Tecnológico de Santo Domingo använts.
För att utvärdera situationen har en energikartläggning genomförts på byggnaden, för att analysera
resultatet har energihanteringsverktyget RETScreen använts, ett verktyg som möjliggör
modellering av byggnaders energianvändning. Programmet ger användaren möjligheten att
inspektera nuvarande användning och krav och senare även föreslå förbättringar inom
energieffektivisering, minskningar av växthusgaser och även finansiella förbättringar.
Komponenter såsom belysning, elektrisk utrustning, ventilation och klimatsystem beaktas. Även
beteendet hos de som använder byggnaden är en viktig faktor att ta hänsyn till. Ingen faktiskt
lösning kommer att föreslås och studien kommer att begränsas till Santo Domingo-området.
Resultatet visar att elanvändningen är högre på eftermiddagen jämfört med på kvällen. Den största
faktorn till denna ökning är klimatsystemet som står för 71 % av den årliga
elektricitetsförbrukningen. Ett förbättrat fall har föreslagits där uppgraderingar i klimatsystem och
elektronisk utrustning införts. Simuleringar i RETScreen visar att förbrukningen kan minskas med
56 % om det förbättrade fallet implementeras. En utredning har genomförts på ett förslaget
solpanelsprojekt, i byggnadens nuvarande tillstånd så skulle det täcka 4 % av den årliga
elanvändningen, för det föreslagna fallet skulle det täcka ca 10 %. Slutsatsen har dragits att projektet
inte är ekonomiskt hållbart, med tanke på de enorma investeringar som krävs. Däremot så är det
något man bör se över när mer effektiv utrustning finns tillgänglig. Vidare så är beteendet av de
som använder byggnaden en stor orsak till den höga energianvändningen. Betydande besparingar
kan göras om klimatanläggningen, vilket är det största bidraget till den höga elanvändning, används
endast var och när det är i behov.

Resumen
Esta tesis de licenciatura es el resultado de un estudio MFS realizado en la República Dominicana.
Este país es extremadamente dependiente de fuentes de energía de países cercanos, en este
momento el 86 % de la electricidad es producida por medio de combustibles fósiles y en el año
2011 el país gastó el 8,6 % de su GDP en el importe de combustible. El país está conformado por
una creciente clase media, lo que hace que la demanda de energía haya aumentado y la necesidad
de cambiar a energías sostenibles es crucial para el futuro crecimiento. Se ha hecho un estudio de
campo en la República Dominicana, en donde la situación energética actual se ha analizado. Con
este fin se ha trabajado como punto de referencia en la biblioteca Emilio Rodríguez Demorizi en
el Instituto Tecnológico de Santo Domingo.
Para analizar la situación, se efectuó una auditoría energética del edificio y por medio de la
herramienta de manejo de energía RETscreen se evaluaron los resultados. Esta herramienta
posibilita hacer un modelo del uso de energía del edificio y dar la posibilidad al usuario de
inspeccionar el uso y la demanda actual, así como la posibilidad de proponer mejoras.
Componentes como iluminación, equipos eléctricos, ventilación, y equipos de climatización son
tomados en cuenta. Pero también el comportamiento de los ocupantes del edificio es un factor
importante. En este trabajo no se presentará ninguna solución específica y el estudio se limitará a
la zona de Santo Domingo.
Los Resultados muestran que el uso de electricidad es más alto en horas de la tarde comparado con
las noches. El factor más importante que afecta este aumento son los sistemas de climatización,
que suponen el 71 % del consumo anual de electricidad. De acuerdo a simulaciones hechas en
RETScreen, el alto consumo puede ser disminuido de una forma significante, aproximadamente
54 %, por medio de inversiones en mejores tecnologías, y debido al alto precio de la electricidad,
el estudio muestra que las inversiones serían económicamente viables a corto y a largo plazo.
Además, el comportamiento de los ocupantes puede contribuir a una disminución importante en
el consumo, por ejemplo, en el mejor manejo de los sistemas de climatización. Se probó también
una propuesta de paneles solares en el techo de la edificación, en el estado actual del edificio los
paneles generarían el 4 % del consumo total, y el 10 % en el caso propuesto. Por motivo de los
altos consumos de energía en el edificio, el proyecto no es económicamente viable en este
momento. Sin embargo, este tipo de proyectos puede ser evaluado otra vez en el futuro cuando
sea posible adquirir tecnologías más eficientes o en caso de una reducción drástica del consumo de
la edificación.

This study has been carried out within the framework of the Minor Field Studies Scholarship
Programme, MFS, which is funded by the Swedish International Development Cooperation Agency,
Sida.
The MFS Scholarship Programme offers Swedish university students an opportunity to carry out two months’ field work, usually the student’s final degree project, in a country in Africa, Asia or Latin America. The results of the work are presented in an MFS report which is also the student’s Bachelor or Master of Science Thesis. Minor Field Studies are primarily conducted within subject areas of importance from a development perspective and in a country where Swedish international cooperation is ongoing.
The main purpose of the MFS Programme is to enhance Swedish university students’ knowledge and understanding of these countries and their problems and opportunities. MFS should provide the student with initial experience of conditions in such a country. The overall goals are to widen the Swedish human resources cadre for engagement in international development cooperation as well as to promote scientific exchange between unversities, research institutes and similar authorities as well as NGOs in developing countries and in Sweden.
The International Relations Office at KTH the Royal Institute of Technology, Stockholm, Sweden,
administers the MFS Programme within engineering and applied natural sciences.
Erika Svensson
Programme Officer
MFS Programme, KTH International Relations Office
KTH, SE-100 44 Stockholm. Phone: +46 8 790 6561. Fax: +46 8 790 8192. E-mail: [email protected]
www.kth.se/student/utlandsstudier/examensarbete/mfs

Acknowledgement
We would like to express our greatest gratitude towards one and all of whom directly and indirectly
have guided us and supported us throughout the project.
Special recognitions to Catharina Erlich and Idalberto Herrera whom enabled the chance to
perform this field study, without you we would not have met all the wonderful people and visited
all the beautiful places in the Dominican Republic.
Evelyn, words cannot describe how much you have helped us, you have been like a mother to us.
Without you there would not be any project.
We would also like to thank Sergio Jauregi, not only were you our supervisor and roommate, but
you have also been a great friend and the memories we have shared will always be cherished.
Jaime even though we’ve been on different sides of the planet, you have been able to help us and
give us advices.
Maximo, you have not always been hands on helping us, but without you we would not have been
able to come to INTEC, for that we are grateful.
Lastly we would like to thank SIDA and the Åforsk foundation for helping with the financing of
the project.
Victor and Paulo from a sunny Santo Domingo. 2016-05-23
Table of Content
Abstract ............................................................................................................................................................
Sammanfattning ..............................................................................................................................................
Resumen ..........................................................................................................................................................
Acknowledgement ..........................................................................................................................................
List of Figures .................................................................................................................................................
List of Tables ..................................................................................................................................................
Acronyms and abbreviations ........................................................................................................................
1 Introduction .......................................................................................................................................... 1
1.1 Country overview ........................................................................................................................ 1
1.2 Climate in the Dominican Republic .......................................................................................... 1
1.3 Energy use .................................................................................................................................... 3
1.4 Millennium Development goals ................................................................................................ 4
2 Problem Description ........................................................................................................................... 6
2.1 Objectives ..................................................................................................................................... 6
2.2 Delimitations ................................................................................................................................ 6
3 Method .................................................................................................................................................. 7
3.1 Process of study ........................................................................................................................... 7
3.2 Modelling ...................................................................................................................................... 7
3.3 Energy Audit ................................................................................................................................ 8
3.4 Energy Management ................................................................................................................... 8
4 Literature study ..................................................................................................................................... 9
4.1 Heat Balance in building and rooms ......................................................................................... 9
4.2 Thermal Comfort ....................................................................................................................... 10
4.3 Ventilation .................................................................................................................................. 11
4.4 Heating ........................................................................................................................................ 13
4.5 Cooling ........................................................................................................................................ 13
4.5.1 The Vapour Compression Refrigeration cycle .............................................................. 13
4.5.2 Central vs. split system ..................................................................................................... 14
4.6 Lighting ....................................................................................................................................... 14
4.7 Equipment .................................................................................................................................. 15
4.8 Possibilities for Self-Sufficiency............................................................................................... 15
5 Field Study ........................................................................................................................................... 16
5.1 INTEC Library .......................................................................................................................... 16
5.2 Temperature measurements in the INTEC library............................................................... 16

5.3 Energy Use at INTEC Library ................................................................................................ 17
5.3.1 Cooling ................................................................................................................................ 18
5.3.2 Lighting ............................................................................................................................... 19
5.3.3 Equipment .......................................................................................................................... 20
5.3.4 Generators .......................................................................................................................... 20
5.4 Photovoltaic project proposal .................................................................................................. 20
6 Results from simulations in RETScreen ......................................................................................... 22
6.1 Assumptions and Uncertainties ............................................................................................... 22
6.2 Total Energy Use ....................................................................................................................... 23
6.3 Electricity for lighting ............................................................................................................... 24
7 Improvements simulated in RETScreen ........................................................................................ 25
7.1 Improved Climate systems ....................................................................................................... 25
7.2 Decrease infiltration in windows and doors .......................................................................... 26
7.3 Improved electrical equipment ................................................................................................ 26
7.4 Conclusion of improvements .................................................................................................. 26
7.5 Financial results .......................................................................................................................... 28
7.6 Sensitivity analysis ...................................................................................................................... 29
8 Discussion ........................................................................................................................................... 31
9 Conclusion and Future work ............................................................................................................ 33
Bibliography ................................................................................................................................................ 34
Appendix I. Heat gain values for electrical equipment ......................................................................... 37
Appendix II. Specifications AC-units...................................................................................................... 39
Appendix III. Financial Payback Periods ............................................................................................... 41
Appendix IV. Building envelope .............................................................................................................. 42
Appendix V. Specifications for solar panels ........................................................................................... 48
Appendix VI. Installed climate systems. ................................................................................................. 49
Appendix VII Observations from the library ........................................................................................ 50

List of Figures
Figure 1.1 Map over the Dominican Republic and other Caribbean countries. (WorldAtlas, 2015)
......................................................................................................................................................................... 1
Figure 1.2 Monthly precipitation average between 2000 – 2012 (WorldBank, 2016a). ..................... 2
Figure 1.3 Monthly temperature average between 2000 – 2012 (WorldBank, 2016a). ...................... 2
Figure 1.4 Annual electricity generation in the Dominican Republic, by fuel type 2013 (Worldwatch,
2015). .............................................................................................................................................................. 3
Figure 1.5 Electricity Power Consumption increase per capita. The Dominican Republic compared
to Haiti (Worldbank, 2016b). ...................................................................................................................... 4
Figure 3.1 Methodology of project, step by step. .................................................................................... 7
Figure 4.1 Possible pollutants in a building (Havtun et al, 2015). ....................................................... 12
Figure 4.2 Illustration of an ERV systems function during summer. (Cleanaire, n.d.) .................... 12
Figure 4.3 The vapour compression refrigeration cycle. ...................................................................... 13
Figure 5.1 Measured temperature and humidity indoors and outdoors on May 2nd 2016. ............ 17
Figure 5.2 Average energy Consumption by hour for a section of the INTEC Campus for a five
day interval. Measurement apply to the dates of 19-26th April 2013. ................................................ 17
Figure 5.3 Electricity Consumption by month for several buildings at the INTEC. Month of April
excluded. Measurements apply to the dates of 21st March 2015 to 19th March 2016. ................... 18
Figure 6.1 Breakdown of total electricity distribution. ......................................................................... 24
Figure 6.2 Comparison of electricity use before and after changing to LED-lights. ....................... 24
Figure 7.1 Electricity use for current and proposed climate system. .................................................. 25
Figure 7.2 Reductions in electricity consumption if investments were made in new technology. . 26
Figure 7.3 Electricity breakdown after proposed case is implemented. ............................................. 27
Figure 7.4 Illustration over electricity reductions that can be with the proposed case, compared to
the current situation. .................................................................................................................................. 27
Figure 7.5 Proportion of what solar electricity would cover if solar project would be realized. .... 28
Figure 7.6 Current greenhouse gas emissions and for proposed case. ............................................... 28
Figure 7.7 Sensitivity analysis of the buildings yearly electricity cost, when altering the electricity
price. ............................................................................................................................................................. 29
Figure 7.8 Sensitivity analysis of buildings electricity use when altering the duty cycle. .................. 30
Figure II.1 COP value for ac-unit Amico. (Unflair, 2010) ................................................................... 40
Figure III.1 Payback Period For An Hypothetical Investment Of One Million Dollar .................. 41
Figure III.2 Payback Period If Windows And Doors Were Insulated ............................................... 41
Figure IV.1 West and East side of INTEC library. ............................................................................... 42
Figure IV.2 North side of INTEC library. ............................................................................................. 43
Figure IV.3 South side of INTEC library ............................................................................................... 44
Figure IV.4 First floor of the INTEC Library. ...................................................................................... 45
Figure IV.5 Second floor of the INTEC Library. ................................................................................. 46
Figure IV.6 Third floor of the INTEC Library. .................................................................................... 47
Figure VI.1 AC-units on rooftop, top photos show the 15 ton units, bottom photo are the 5 ton
units. ............................................................................................................................................................. 49
Figure VII.1 Ventilation and AC-duct in the library. ............................................................................ 50
Figure VII.2 Single paned doors at the front entrance. ........................................................................ 50
Figure VI.3 Single panel windows at the library .................................................................................... 51
Figure VII.4 Window that cannot be fully closed. ................................................................................ 51

List of Tables
Table 4.1 Monthly Average GHI over Santo Domingo (NASA, 2016)) ........................................... 15
Table 5.1 AC-units currently used in the INTEC library. .................................................................... 19
Table 5.2 Inventory list and operating hours of electrical equipment in the library. ....................... 20
Table 6.1 Assumptions made for duty cycle regarding the electrical equipment in the INTEC
library............................................................................................................................................................ 22
Table 6.2 Assumed duty cycle for AC-units in the library ................................................................... 23
Table I.1 Recommended Heat Gain from Typical Computer Equipment (2013 ASHRAE
Handbook-Fundamentals (SI)) ................................................................................................................. 37
Table I.2 Recommended Heat Gain from Typical Laser Printers and Copiers (2013 ASHRAE
Handbook-Fundamentals (SI)) ................................................................................................................. 38
Table III.1 Financial Parameters .............................................................................................................. 41
Table V.1 Physical characteristics of the module SI-ESFM-M200W ................................................. 48
Table V.2 Electrical Characteristics Module SI-ESFM-M200W ......................................................... 48
Table V.3 Inverter Specifications ............................................................................................................. 48

Acronyms and abbreviations
AC Air Conditioning
ASHRAE The American Society of Heating, Refrigerating and Air-Conditioning Engineers
CFL Compact florescent light bulbs
CNE National Energy Commission
COP Coefficient of performance
CPU Central Processing Unit
DR Dominican Republic
ERV Energy Recovery System
GDP Gross domestic product
GHG Green house gases
GHI Global Horizontal Irradiance
ICT Information and Communication Technology
INTEC Instituto Tecnológico de Santo Domingo
ISO The International Organization for Standardization
kWh Kilowatt Hour
MWh Megawatt Hour
HFO Heavy fuel oils
HVAC Heating, ventilation, and air conditioning
LED Light-emitting diodes
MDG Millennium Development Goals
PV Photovoltaic
Qc Heat Gains or Heat Losses by Conduction
Qe Evaporation Heat Losses
Qi Internal Heat Gains
Qm Heat Gains and Heat Losses Due to Mechanical Climate Systems
Qs Solar Heat Gains
Qv Heat Gains or Heat Losses by Ventilation - Convection
RETScreen Renewable Energy Project Analysis Software
SEER Seasonal Energy Efficiency Ratio
SIDA The Swedish International Development Cooperation Agency
tCO2 Tonnes of Carbon Dioxide Equivalents

UN United Nations
USD U.S. Dollars

1
1 Introduction
One main issue in many developing countries is the lack of energy resources, this could be due to
the slow developing infrastructure and the nonexistence of development policies.
The area that has been addressed in this project is the accelerated energy use in commercial
buildings. Emilio Rodríguez Demorizi library at Instituto Tecnológico de Santo Domingo
(INTEC), has been taken as case study.
1.1 Country overview
The Dominican Republic (DR) is located in the Caribbean, West Indies (Figure 1.1). Christopher
Columbus explored and claimed the island on his first voyage in 1492 and it became a springboard
for Spanish conquest of the Caribbean and the American mainland. The country has a total area of
48 422 km2 and covers two thirds of the island of Hispaniola; the other part belongs to Haiti. The
official language is Spanish. The country has a population of 10,2 million (2013) and the capital is
Santo Domingo. (World Atlas, 2015)
Figure 1.1 Map over the Dominican Republic and other Caribbean countries. (WorldAtlas, 2015)
Over the last two decades, the Dominican Republic has been standing out as one of the fastest
growing economies in the Caribbean with an average real Gross domestic product (GDP) growth
of 5.4 % between 1992 and 2014 (World Bank, 2016). This can be explained by the growing
tourism, between 2003 and 2013 the amount of tourists per year increased by 30 % compared to
the previous decade (Knoema, 2016a).
1.2 Climate in the Dominican Republic
The Caribbean climate is tropical throughout the year and individual climate conditions are strongly
dependent on elevation. In the Dominican Republic the average temperature hovers around 25ºC
and some call the country’s climate ‘the endless summer’ (Ariza, 2016). Even though the

2
temperature average is the same all year round the humidity and precipitation affects the feeling of
the actual heat. Figure 1.2 shows the average yearly precipitation, the winter season is from
November to April and those are the driest months of the year, rain season is from May until late
October. In Figure 1.3 the temperature average from January to December is shown, the
temperature increases between the months of April and September, the average high is
approximately 26 C (Worldbank, 2016a).
Figure 1.2 Monthly precipitation average between 2000 – 2012 (WorldBank, 2016a).
Figure 1.3 Monthly temperature average between 2000 – 2012 (WorldBank, 2016a).
Caribbean countries are extremely vulnerable to climate change. Hotter temperature, sea-level rise
and increased hurricane intensity threaten property and livelihood throughout the Caribbean. The
devastating impacts will occur regardless of the fact that Caribbean nations have contributed little
to the release of the greenhouse gases that drive climate change. (Bueno et al, 2008)

3
1.3 Energy use
Most Caribbean countries are faced with several challenges associated with the generation,
distribution and use of energy. Economic-, market- and policy-research is needed to advance the
adaption to new energy technology. The Dominican Republic is the third largest energy consumer
in the Caribbean, after Cuba and Puerto Rico. Approximately 92 % of the country’s towns and
villages are connected to the grid and 96 % of the population has access to electricity. Fossil fuels
dominate the electricity generation in all Caribbean countries. In the Dominican Republic 85 % of
all electricity generation comes from fossil fuels, approximately 36 % is heavy fuel oil (HFO), 25%
natural gas and 14 % coal (see Figure 1.4). The reliance on fossil fuels has great impact on the levels
of harmful emissions and since the country is dependent on imported fuels it is also extremely
vulnerable to geostrategic and geopolitical change. (Worldwatch, 2015)
Figure 1.4 Annual electricity generation in the Dominican Republic, by fuel type 2013 (Worldwatch, 2015).
Like many other Caribbean countries, the Dominican Republic relies on the Petrocaribe
preferential oil import agreement with Venezuela. In 2003 the DR bought almost 110,000 barrels
of crude oil per day from Venezuela and when the country could not pay for all the oil they financed
it by trading black beans and selling bonds. At some points the country has been forced to import
and then export beans to pay back the debt to Venezuela (Fiezer, 2013). Not only does the country
lack sources for energy, the Dominican electricity grid also experiences high levels of transmission
and distribution loss, in 2014 the losses were as high as 32 %, this could be compared to the United
States whom had an average loss of only 7 % annually. 12 % of the electricity loss is due to technical
inefficiencies at generation plants, substations and transmission lines. The remaining 20 % of
system loss is mainly attributed by electricity theft, which is considered to be the largest obstacle
that electricity sectors must overcome (Worldwatch, 2015). The growing tourism in the Dominican
Republic has also resulted in increased energy use and data shows that the country has the quickest
growing energy demand of all Caribbean countries. (Edwards et al, 2011) In Figure 1.5 the
electricity consumption between 2007 and 2013 is shown, in 2013 the consumption per capita was
36%
25%
14%
13%
2%10%
Electricity Generation (%)
HFO Natural Gas Coal Hydro Wind Other

4
estimated to be 1517 kWh/person/year. This can be compared to the neighboring country Haiti
whom had a consumption per capita at thirty times less the amount (WorldBank, 2016b).
Figure 1.5 Electricity Power Consumption increase per capita. The Dominican Republic compared to Haiti (Worldbank, 2016b).
1.4 Millennium Development goals
The Millennium Development Goals (MDG) were established during the Millennium Summit of
the United Nations (UN) in 2000. All 189 member states (among these the Dominican Republic)
committed to help achieve the goals. During the event an explicit link between access to energy
and poverty reduction was found and the UN confirmed that the available energy services
worldwide fail to meet the needs of the poor. For the energy sector in the Dominican Republic,
five key recommendations need to be prioritized in order to achieve the goals (UN-Development,
2015). They should:
1. Adopt legal and regulatory frameworks that will provide incentives for effective partnerships among
government institutions (including local governments), private-sector utilities and other operators, and
community organizations.
2. Adopt strategic, institutional, and financial measures to ensure wider access for households and small
businesses in urban and peri-urban settings to services such as illumination and power, information and
communication technology (ICT), refrigeration, and other beneficial uses.
3. Adopt measures to ensure reliable electricity supply to households, businesses, public institutions,
commercial establishments, and industry.
4. Provide access to mechanical power (for water lifting/delivery systems and agro processing) and electricity
for public facilities (health clinics/centers, schools, government offices, and community centers) in all rural
communities.

5
5. Take a flexible approach to selecting from a wide range of technologies as well as a wide range of
institutional structures for the delivery of energy services.
(UN-Development, 2005)
As of today the country has no regulations or policies in the energy sectors. All buildings and
households are constructed within the framework of what the constructor or investor consider to
be “appropriate’’. This approach has slowed down the development of the infrastructure and
measures at this front have to be taken in order to reach the MDGs. (Jauregi, pers.comm.,2016)
With lacking resources of fossil fuel, the country has been forced to look for alternative ways for
improvement. There are several energy projects underway, but the one that sticks out might be the
solar power plant in the region of Monte Plata. The plant is the largest of its kind in Latin America
and the project is set to be used as an alternative to fossil fuel. The plant will be connected directly
to the public electricity grid and it is expected that it will provide up to 45 GWh of electricity per
year. It will also lead to CO2 emission reductions up to 232,000 tons. (MyClimate, n.d.) This can
be seen as a big step forward, since the country has as a goal to reduce greenhouse gas emissions
with 25 % by 2030. (Worldwatch, 2013)

6
2 Problem Description
To maintain an efficient and sustainable energy supply is a crucial matter in all nations. The welfare
and development of infrastructure and living standards is dependent on the availability of energy.
High electricity price in the country pose a big burden for Dominican households and as of today
electricity costs are roughly 0.19 U.S. cents per kWh (NREL, 2015).
Most of the buildings in the Dominican Republic are old and have outdated equipment, and with
the increasing living standard in the country the demand on buildings are higher than ever. The
countries commercial sector is currently one of the biggest utilizers of energy, and at the moment
there are no measures taken for energy management and energy savings. One of the main factors
for high energy use in the commercial sector is the increased use of air-conditioning, occupants’
unawareness of the impact of overconsumption is leading to technical and financial instability in
the country. Also many buildings are old and in need of renovation, high infiltration in the envelope
lead to high energy loss that in many cases can be avoided with minor investments in reparations.
2.1 Objectives
The primary objective for the project is to investigate the energy use in a building and to focus on
potential improvements. This includes the possibility of making buildings self-sufficient, mapping
data over current energy use and also revenue of investments in new technology. A case study will
be conducted at the library at Instituto Tecnológico de Santo Domingo.
Specific objectives that have been set to simplify the process:
Map data over energy use in the building and look into areas such as Heating, Ventilation
and Air-Conditioning systems (HVAC), lighting, electrical equipment and climate, also find
ways to reduce current energy use.
Identify areas with high-energy consumption and locate spaces with overconsumption in
order to minimize usage.
Access the possibilities of making the building self-sufficient and make a cost analysis to
see if an investment is profitable.
Investigate the behavioral needs of students at INTEC.
2.2 Delimitations
To be able to approach the problem without going to vast, several limitations are set to concentrate
the study. These can be shown below:
The study focuses on energy management restricted to the library at the INTEC campus
in Santo Domingo.
No examples of systems will be constructed on site, only an analysis over possible technical,
economic and environmental improvements will be suggested.
Only available data will be taken into account and if assumptions are made they will be
based on facilities or technology with similar character.

7
STAGE 1
INITIATION
Establish a vision
Purpose
Schedule
STAGE 2
IDEAS
Literature study
Local advisory
Field study
STAGE 3
RESULTS
Technical
Environmental
Financial
STAGE 4
REVIEW
Discussions
Conclusions
Sensitivity analysis
3 Method
The thesis will be planned according to prevalent standards for case studies which includes the
following stages (Gustavsson, 2003):
Planning and structuring
Collection of data
Analysis and interpretation
Securing and evaluation of the quality
Writing of report
3.1 Process of study
To achieve an energy management analysis on the INTEC Library in Santo Domingo a study was
made through the perspective of energy minimization and sustainable development. The current
energy situation as well as the projected long term progress had to be taken into account.
The steps of the study are shown in Figure 3.1. During the field study information was gathered
through observations, measurements and advisory with responsible personal. Specific information
of the energy use in the building was gathered through an energy audit conducted on the building.
Among the information collected includes the exact amount of equipment such as computers and
TVs etc., type of lighting used, specifications about the cooling and ventilation system and also the
total amount of electricity used within a year. The data was later processed through Microsoft Excel
and the energy management tool RETScreen. With the tools three types of simulations were made:
1. Technical – to conclude which solution is most efficient in regards of energy usage.
2. Environmental – to conclude which solution has the least impact on the environment.
3. Financial – to conclude which solution is the most profitable.
Figure 3.1 Methodology of project, step by step.
3.2 Modelling
RETScreen Energy Management is a clean energy software package developed by the Government
of Canada. The software can help reduce energy costs by identifying and assessing potential energy
improvements. First the software makes an analysis over the current energy use according to
gathered data and later it allows users to determine whether or not a proposed improved case in
terms of renewable energy, energy efficiency, makes financial sense. If a project is viable – or not.
(NRCAN, 2016)

8
3.3 Energy Audit
The purpose of an energy audit is to determine where, why and how energy is used in a facility and
to identify opportunities for improvement. The audit usually begins with a review of historical and
current energy data.
Energy systems as a whole are often complex, involving many different components, flows,
temperatures, etc. Large buildings are not an exception and almost all feature unique installations
designed for specific purposes (Pacific Northwest, 2011).
The American Society of Heating, Refrigerating and Air-Conditioning Engineers (ASHRAE)
defines three levels of audits. Each audit level builds on the previous level. As audit complexity
increases, so does thoroughness of the site assessment. (ASHRAE, 2011)
Level 1: Site Assessment or Preliminary Audits is alternatively called a “simple audit’’ and
is the starting point for a buildings energy optimization. It involves brief interviews with
personnel and reviews of the facility’s utility bills and operating hours. The ASHRAE level
1 can be defined as understanding the general building configuration and defining the type
of activity the specific building is intended for. (Microgrid, 2010)
Level 2: Energy Survey and Engineering Analysis Audits starts with the findings of the
Level 1 audit and evaluates the building energy system in detail to define a variety of
potential energy improvements. This includes the buildings lighting, heating, ventilation
and cooling. The audit should result in a clear and concise report of modifications that can
be made and also general costs. (Microgrid, 2010)
Level 3: Detailed Analysis of Capital-Intensive Modification Audits focuses on a ”whole-
building computer simulation’’, where a computer program is used to accurately model the
way the building would respond to changes in the energy system. It can be architectural
modifications to walls, windows and roofs, but also financial aspects such as changes in
electricity price. (Microgrid, 2010)
3.4 Energy Management
Energy efficiency means using less energy while fulfilling the requirements and needs of in this case
a building, an energy management program is a strategy used to accomplish this. It is recognized
as one of the most important and cost-effective solutions for reducing greenhouse gas emissions
(GHG). Importantly, energy efficiency not only reduces GHG emissions, but it can also improve
a sectors economic situation and productivity (OECD, 2015).
The methods to accomplish energy savings are:
Examine the acceptance of the program at considered sector.
Establish a checklist and a methodology for the implementation.
Analyze the costs of the energy conservation method.

9
4 Literature study
To justify the needs for the building an extended literature review has been performed, this serves
several purposes. First it enables the reader to understand more fully the underlying theory and
research that has been made within the subject. Secondly, it enables the opportunity to identify
needs for improvements. Thirdly, the review allows the reader to have a contextual background, to
later understand the results in a bigger context.
4.1 Heat Balance in building and rooms
Thermal conditions in buildings depend on the magnitude of heat gains and losses. In warmer
countries like the Dominican Republic temperature differences indoors versus outdoors usually
differ. Buildings will tend to heat up when heat gains outweigh the losses, and to cool off in the
opposite situation. Conditions of discomfort can easily be sensed when indoors, which, in extreme
situations, require artificial cooling systems (cooling and/or heating). (Havtun et al, 2015)
Thermal balance in a building occurs when the sum of the heat losses and heat gains is zero,
reaching a neutral point. (Havtun et al, 2015)
The main sources of gains and/or heat losses of a building are divided into six categories (Havtun
et al, 2015):
Internal gains (Qi): Internal gains represent heat sources inside the building, including
people, heaters, lights, and practically all energy consuming devices. A person performing
light activities can add 180W of heat energy, a TV can add more than 300W, depending on
its size. (Havtun et al, 2015)
To estimate the internal heat gains it is recommendable to calculate the contributions at a
given time. This means that it should not be assumed that all devices are turned on at the
same time, it is necessary to establish a reasonable average. Some electronic manuals
provide standard rates of internal heat gains in watts per square meter of floor space (W /
m2). In this case the rate will be multiplied by the total floor area to estimate total gains.
(ASHRAE, 2013).
Solar gains (Qs): Solar radiation striking the building can generate significant heat gains.
When it occurs through opaque surfaces (walls and roofs) it is called indirect gains, and
when it occurs through transparent surfaces such as glass, it is called direct gains.
(Designing buildings, 2016).
Gains or losses by Conduction (Qc): Gains and losses by conduction occur when there
are heat flows through the building envelope (walls, roofs, windows and floors). The
amount of heat gained or lost depends on the thermal characteristics of the materials, the
difference between the indoor and outdoor temperature and the total area exposed. (Sol-
arq, 2016). A great deal of the heat gains is emitted from windows. The U-value which is
the overall heat transfer coefficient determines the thermal qualities of a material, and in
windows, walls and doors, it is a crucial factor to have in mind since it measures the rate of
heat loss through a material (Mayo Energy Agency, 2007).

10
Gains or losses on ventilation - convection (Qv): Gains and losses by ventilation occur
when the outside air enters and circulates through the building, which also means that
indoor air is expelled out. Ventilation can happen intentionally, through vents, windows
and doors, or involuntarily, by infiltration through the building envelope. When the outside
air temperature is higher than indoors, there will be heat gains and vice versa when the
temperature outside is cooler than indoors. (Sol-arq, 2016).
Evaporation losses (Qe): Heat losses by evaporation occur when water evaporates and
enters the air of the interior space. (CLEAR, 2016).
Heat and cooling requirement (Qm): This factor is generally considered as an
independent variable that can be adjusted according to the other factors in the balance.
This means that this factor can be controlled in order to achieve a balance. (Sol-arq, 2016).
The heat balance in a building is defined by equation 1 below (Sol-arq, 2016):
𝑄𝑚 = 𝑄𝑖 + 𝑄𝑠 ± 𝑄𝑐 ± 𝑄𝑣 − 𝑄𝑒 [1]
If the Qm value is greater than zero, cooling will be needed. On the other hand, if the Qm
value is less than zero, there will be the need for heating.
HVAC systems are expensive and lead to additional energy consumption in buildings, which can
reach excessive levels. In that sense the designer should always try to reduce cooling requirements
to a minimum by applying passive strategies, using better materials and construction systems, and
taking advantage of available natural resources. (Havtun et al, 2015)
4.2 Thermal Comfort
In a building comfortable thermal environment is important. According to ASHRAE and ISO
7730 standards thermal comfort is defined as “that condition of mind that expresses satisfaction
with the thermal environment” (ASHRAE, 2013).
Thermal comfort is then a subjective concept that expresses the physical and psychological
wellbeing of a person when the conditions of temperature, humidity and air movement are
favorable to our activities.
Based on experience in designing air conditioning systems, it has been determined that most people
feel comfortable when the temperature is between 21 ° C and 26 ° C and relative humidity between
30% and 70% (Randall, 2005). These values apply when people are dressed in light clothing, shaded
and fairly inactive. ASHRAE has conducted research over many years involving hundreds of
people in an attempt to relate the factors of temperature, humidity and air movement to human
comfort. The results of these tests show that different people react in different ways to atmospheric
conditions that surround them (ASHRAE, 2013).
Evaluating the thermal comfort is a complex task, since sensation always involves an important
subjective burden; however, there are some variables that influence the thermal exchanges between
the individual and the environment and contribute to the feeling of comfort. Below is a summary
of these factors. (Havtun et al, 2015)

11
Atmospheric Conditions:
Temperature: The difference between the indoors temperature and the skin temperature
determines the heat exchange between the body and the air, this exchange is called
“convective heat exchange”. There is also the radiative heat exchange between some
environmental surfaces (skin, machinery, glass, walls, ceilings, etc.), which means that, for
example, it can be comfortable to be in a house where the air temperature is 15 ° C, but its
walls are 22 °C. If the skin temperature is greater than the mean radiant temperature, the
body loses heat by radiation to the environment; if reversed, the body absorbs heat from
the surrounding. (Havtun et al, 2015)
Humidity: Humidity is the moisture content of water vapour in the air. The mechanism
by which heat is removed from the body is transpiration. The more moisture there is, the
lower the transpiration; that is why it is more pleasant to have dry heat than humid heat.
An important value connected with the humidity is the relative humidity, which is the
percentage of moisture in the air with respect to the maximum admitted. (Havtun et al,
2015)
Air Velocity: The air velocity is directly involved in the thermal balance and thermal
sensation, since, depending on the speed, the air layer that isolates the body varies and leads
to an increase in the evaporation of sweat. (Havtun et al, 2015)
Labor Activity:
Regardless of environmental conditions, intense activities give us a greater sense of warmth. Our
body converts less than 10 % of energy consumed into useful work; the rest is transformed into
heat which must be removed to prevent the body temperature to rise to dangerous levels. (Sahta
et al, 2014)
Clothing:
The type of clothing is an important variable that influences the sense of comfort; the greater the
thermal resistance of the clothes, the more difficult it is for the body to transfer the heat generated
to the surrounding. Thermal comfort is achieved when there is a balance between the heat
generated by the body, and the capability of transmitting or absorbing heat. (Sahta et al, 2014)
4.3 Ventilation
Ventilation is crucial to maintain optimum air quality and thermal comfort in buildings. It is needed
to dilute and remove pollutants emitted from the surrounding such as metabolism and activity
from occupants (Havtun et al, 2015). Figure 4.1 shows common pollutants that can penetrate in
and out of a building. Improving ventilation effectiveness allows the indoor air quality to be
significantly enhanced without the need for higher air changes in the building.

12
Figure 4.1 Possible pollutants in a building (Havtun et al, 2015).
The requirement of visitors and employees comfort is critical to consider when constructing a
building and an important thing to have in mind is that every type of room has to be designed
according to its intended activity. In most situations, air needs to be supplied and distributed
mechanically using fans and ducts. Supply air provides a replacement for the air exhausted by the
fans and helps to create a steady flow throughout the building. If the building consists of big spaces
and few rooms it is often sufficient enough with one inflow and exhaust, but if the building consists
of many smaller rooms it may require multiple ventilation units. Recirculation is also a good tool
for ventilation, in this case filters remove pollutants and odors and then reintroduces the air back
into the building (Maheshwari, 2012). Especially in commercial buildings with high cooling or
heating load it is often beneficial to install an energy recovery system (ERV), these types of systems
are used to reduce the exhaust of indoor heat in cool climates. However, they can be used for the
same purpose in air-conditioned spaces. The ERV system will cool the incoming fresh air, by
recycling the already refrigerated air from the climate systems (Cleanaire, n.d.). The system will not
only cool the incoming air, it will also enhance the indoor air quality by regulating the humidity
(HPR, 2015). Figure 4.2 illustrates how the ERV system functions during summer.
Figure 4.2 Illustration of an ERV systems function during summer. (Cleanaire, n.d.)

13
4.4 Heating
The average monthly temperature in Santo Domingo is almost never less than 25 C (Worldbank,
2016). Certain days and night during the months of December to February the temperature can be
lower but given the relatively short time heating might be needed, it is hard to justify the investment
of a heating system.
4.5 Cooling
The purpose of cooling is to reduce and maintain the temperature of a body or substance below
the outdoor temperature. (ASHRAE, 2013).
Air conditioning systems are used to monitor temperature, moisture content, flow and purity of air
within a space and regulate the conditions in order to achieve desired thermal comfort for the
occupants. During the last decades, the relative deficiency of conventional energy sources and costs
have resulted in an evaluation of the design and application of air conditioning systems. The
development of new technologies and processes to achieve comfort in buildings by natural means
is prioritized, since globally, buildings are responsible for approximately 40% of annual energy
consumption (C2ES, 2006).
Most rooms and areas do not need cooling 24 hours a day since they are not occupied during for
example night and weekends. Although there are exceptions, for example server halls. These spaces
need 24 hours a day cooling, since computers and screens in some cases cannot be completely
switched off which leads to heat gains that have to be reduced.
4.5.1 The Vapour Compression Refrigeration cycle
The vapour compression refrigeration cycle has five essential components to cool and the cycle is
illustrated in Figure 4.3 below (Refrigerating Engineering, 2015):
Figure 4.3 The vapour compression refrigeration cycle.
The refrigerant: The refrigerant is a substance or mixture which circulate through the
cycle, it undergoes state changes which allow heat transfer to happen between the
surrounding and the refrigerant.
The compressor: The function of the compressor in the refrigeration cycle is to compress
the refrigerant from the evaporator in gaseous state to the condenser. This work is achieved
by providing electricity.

14
The condenser: The condenser is a heat exchanger, it removes heat from the high pressure
refrigerant and reject it to the environment. This heat, in principle, is the sum of the heat
absorbed by the evaporator and produced by the compression work.
The expansion valve: The central function of the expansion valve in the refrigeration
cycle is to provide the pressure difference established between the sides of high and low
pressure of the refrigeration circuit.
The evaporator: The evaporator is a heat exchanger, where the refrigerant absorbs heat
from the environment in which it is located and evaporates. In the cycle heat is absorbed
from indoors and transferred outdoors, resulting in the refrigeration of a space.
4.5.2 Central vs. split system
Central, “all air” conditioning systems (or package systems) are used in large buildings, hotels,
theaters, airports, shopping centers, etc. Large compressors, condensers, expansion valves and
evaporators are placed outdoors or in a machine room. The cold air from the system passes through
ducts to all rooms, the amount of cold air needed for each room can be controlled by the vent
openings depending on the total heat load in the room (Havtun et al, 2015).
An alternative to central systems is the use of splits systems, which are more suitable for individual
or small office spaces. These systems use separate indoor and outdoor coils where the refrigerant
travels throw a pipe instead of the cold air from the outdoor unit. The benefit of these units is the
possibility of cooling spaces only when occupied (Mitsubishi, n.d.).
4.6 Lighting
One of the contributions to the load in a refrigerated space is lighting. It is especially important to
have efficient lighting, since the cost of the operating energy must be paid for twice; first the user
must pay for the electricity for the lights, and secondly for the operation of the refrigerating
machinery to remove the heat from the lights.
There are several types of light bulbs with varying levels of efficiency, however this project will
primarily look into Incandescent light bulbs and Light-emitting diodes.
Incandescent light bulbs: Incandescent lights produce light by heating filament wire until it starts
to glow. These types of light bulbs are widely used, but are increasingly replaced in favor of more
energy-efficient equivalents. They can be considered to be extremely inefficient since 90 % of the
energy consumed is lost through waste heat and only small amounts is actually harnessed to
produce light. (U.S Energy, n.d.)
Light-emitting diodes (LEDs): LEDs are gaining in popularity and availability; they work by
moving electrons in order to release energy in the form of photons. It is proved that LEDs use at
least 75 % less energy than incandescent bulbs, emit basically no heat, and lasts 25 times longer.
However, they are significantly more expensive. (U.S Energy, n.d.)
In the Dominican Republic one of the largest consumers of electricity is lighting. CNE conducted
a study and robust energy efficiency measures for lighting could save the country an estimated 848
MWh of electricity and 540 000 tons of CO2 emissions per year (CNE, n.d.). Using natural daylight
as a source of lighting is another good way to increase lighting efficiency, however increasing direct

15
sunshine can lead to heat gains. By installing louvers, blinds or light shelves, direct sunlight can be
avoided and in the meantime distribute daylight evenly across a surface (Erwine et al, 2001).
4.7 Equipment
In order to estimate the cooling load in a building, the heat gains from all appliances (electrical, gas,
or steam) need to be taken in account. This can be very subjective for the reason that there is a
large diversity of appliances, applications, schedules, uses, installations and that usually the only
information available about the heat gain is on its specifications, which rarely reflect the actual
power consumption. The real power consumption is assumed to be equal to the total heat gains
(radiant plus convective).
Not only does electric equipment lead to heat gains, older models of computers and screens etc.
are often more electricity consuming. Investments in more efficient units can reduce energy use.
For instance laptops typically use 85 % less over a year compared to a CPU, and tablets can use up
to 70 % less than a laptop (EST, n.d.).
4.8 Possibilities for Self-Sufficiency
Self-sufficient buildings generate energy by renewable energy sources, these kind of buildings as
the name suggests do not need external energy, water supplies, waste management services
and wastewater drainage and simultaneously offer the same quality as a non-self-sufficient building.
The environmental aspect is also beneficial since the climate impact from a self-sufficient building
is zero. However, in this project, self-sufficiency in the manner of electricity from photovoltaic
solar panels will only be evaluated. (Self-Sustaining Building, 2016).
In order to accomplish self-sufficient buildings in terms of electricity from the sun, major
investments have to be made in technology, however the average global horizontal irradiance
(GHI), which evaluates solar energy potential in a region shows that investments can be profitable
in the Santo Domingo area (Solargis, 2016). Table 4.1 shows the average monthly GHI for Santo
Domingo, it ranges from five to seven kilowatt-hours per square meter per day (NASA, 2016).
Table 4.1 Monthly Average GHI over Santo Domingo (NASA, 2016))
The power and the size of a PV system is determined by the available area and the investment
capacity. In order to produce electricity for own use, it is very important to take in account the
consumption of the building.
Monthly Averages Insolation Incident On A Horizontal Surface
Santo
Domingo Jan Feb Mar Apr May Jun Jul Aug Sep Oct Nov Dec
Annual
Average
22-year
Average
(kWh/m2/day)
5.43 6.39 7.18 7.47 7.43 5.77 5.17 5.29 5.86 5.99 5.47 5.11 6.04
16
5 Field Study
An analysis of Energy Efficiency involves an extended energy audit, in order to quantify in which
way buildings consumes energy resources.
This activity was performed in cooperation with INTEC, which have made qualified personnel
available to facilitate the knowledge of the particular activities practiced and the equipment used in
the library.
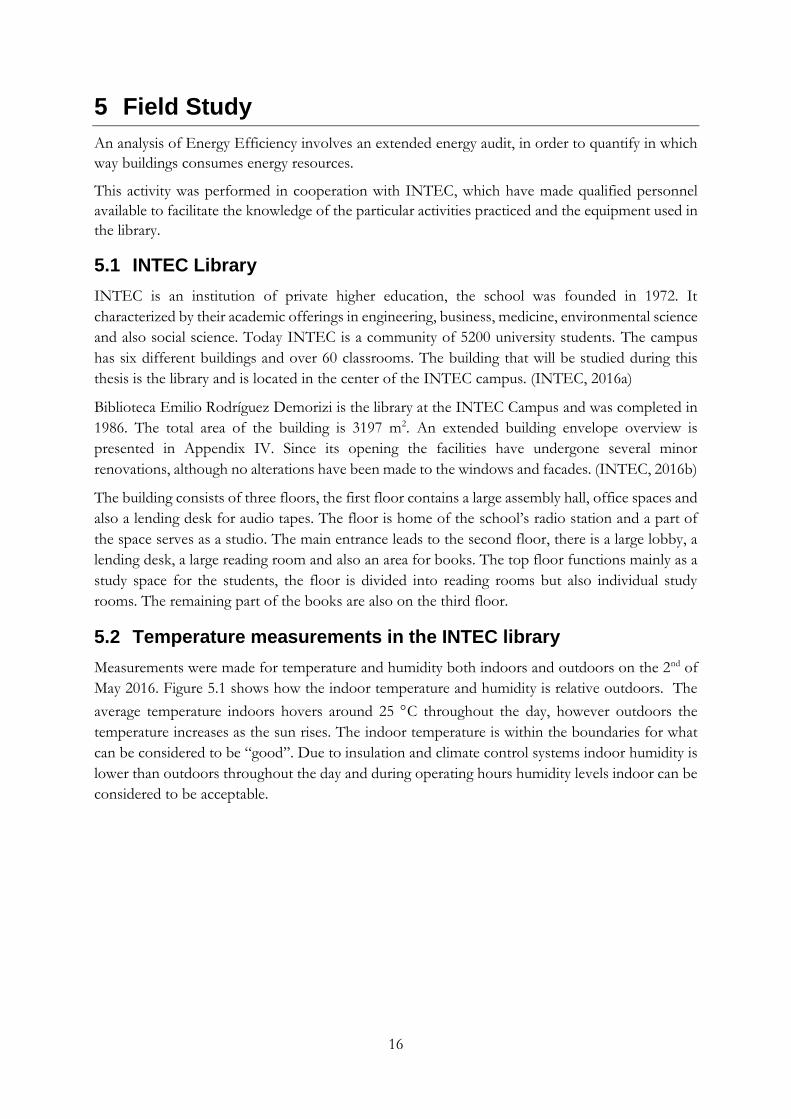
5.1 INTEC Library
INTEC is an institution of private higher education, the school was founded in 1972. It
characterized by their academic offerings in engineering, business, medicine, environmental science
and also social science. Today INTEC is a community of 5200 university students. The campus
has six different buildings and over 60 classrooms. The building that will be studied during this
thesis is the library and is located in the center of the INTEC campus. (INTEC, 2016a)
Biblioteca Emilio Rodríguez Demorizi is the library at the INTEC Campus and was completed in
1986. The total area of the building is 3197 m2. An extended building envelope overview is
presented in Appendix IV. Since its opening the facilities have undergone several minor
renovations, although no alterations have been made to the windows and facades. (INTEC, 2016b)
The building consists of three floors, the first floor contains a large assembly hall, office spaces and
also a lending desk for audio tapes. The floor is home of the school’s radio station and a part of
the space serves as a studio. The main entrance leads to the second floor, there is a large lobby, a
lending desk, a large reading room and also an area for books. The top floor functions mainly as a
study space for the students, the floor is divided into reading rooms but also individual study
rooms. The remaining part of the books are also on the third floor.
5.2 Temperature measurements in the INTEC library
Measurements were made for temperature and humidity both indoors and outdoors on the 2nd of
May 2016. Figure 5.1 shows how the indoor temperature and humidity is relative outdoors. The
average temperature indoors hovers around 25 C throughout the day, however outdoors the
temperature increases as the sun rises. The indoor temperature is within the boundaries for what
can be considered to be “good’’. Due to insulation and climate control systems indoor humidity is
lower than outdoors throughout the day and during operating hours humidity levels indoor can be
considered to be acceptable.

17
Figure 5.1 Measured temperature and humidity indoors and outdoors on May 2nd 2016.
5.3 Energy Use at INTEC Library
The INTEC library is constantly in use, computers, lighting, climate systems are operated 7.00 –
21.00. Although some units like servers and lights in the lobby are continuously powered on. The
electricity was measured for a section of the INTEC library in April 2013. Figure 5.2 shows the
hourly electricity use for a section of the INTEC Campus that includes the library, most electricity
is consumed during the hours 9.00 – 17.00. These times are the office hours for employees but
also the school hours. The monthly energy consumptions for the same section can be seen in
Figure 5.3, the electricity use follows the pattern of the outdoor temperature; the hottest months
between June and August are also the months when most electricity is consumed. This is due to
the climate systems that are running on a higher load.
Figure 5.2 Average energy Consumption by hour for a section of the INTEC Campus for a five day interval. Measurement apply to the dates of 19-26th April 2013.
40
50
60
70
80
90
100
20
22
24
26
28
30
32
00:00 03:00 06:00 09:00 12:00 15:00 18:00 21:00 00:00
Rel
ativ
e H
um
idit
y (%
)
Tem
per
ature
(°C
)
Time
Temperature and Humidity in the INTEC Library
Indoor Temp Outdoor Temp Indoor Rel. Hum Outdoor Rel. Hum
0
50
100
150
200
250
00:0
0
01:0
0
02:0
0
03:0
0
04:0
0
05:0
0
06:0
0
07:0
0
08:0
0
09:0
0
10:0
0
11:0
0
12:0
0
13:0
0
14:0
0
15:0
0
16:0
0
17:0
0
18:0
0
19:0
0
20:0
0
21:0
0
22:0
0
23:0
0
kW
h
Electricity Consumption Per Hour

18
Figure 5.3 Electricity Consumption by month for several buildings at the INTEC. Month of April excluded. Measurements apply to the dates of 21st March 2015 to 19th March 2016.
5.3.1 Cooling
Centralized climate systems, or a standalone air conditioner are used in nearly all areas of the
INTEC library and are crucial for the thermal comfort of the students and personnel occupying
the facilities. ASHRAE defines comfort air conditioning as “the process of treating air to control
simultaneously its temperature, humidity, cleanliness and distribution to meet comfort
requirements”. The climate systems in the library works according to the vapour compression
refrigeration cycle where heat is removed from indoors trough radiation, convection or conduction.
The Air conditioning in the INTEC library is accomplished by the use of a central system with 7
outdoor units and 10 smaller split systems. The Table 5.1 below shows the amount of air
conditioning units, the cooling capacity in tons of refrigeration and the year when the units were
installed. The energy audit revealed that an area of 1054 m2 is climate controlled, the rest is
ventilated and cooled by natural means. In the INTEC library the ventilation system is integrated
into the central climate system, areas that are not climate controlled are ventilated with windows
and ducts.
20
21
22
23
24
25
26
27
0
50
100
150
200
250
300
350
400
maj jun jul aug sep okt nov dec jan feb mar
2015 2016
Tem
pera
ture
(C
)
MW
h
Intec's Library electricity consumption and the monthly temperature average in Santo Domingo
Average monthly electricityconsumption
Monthly temperature average

19
Model Quantity Cooling
Capacity (RT)
Cooling
Capacity (kW)
Year of
purchase
Carrier, direct expansion 7 15 53 1986
TGM and Comfort
Master, direct expansion 5 5 18 2006
Comfort Master 3 4 14 2010
Comfort Master 2 1 3,5 2010
AMICO AC Server Room 1 2 7 2000-2016
Total 18 27 95,5 -
Table 5.1 AC-units currently used in the INTEC library.
5.3.2 Lighting
The INTEC library changed all their CFLs to LEDs in 2014. The initial investment cost was 50 470
USD and the project is projected to be profitable within 2,5 years. It has also lead to an annual
GHG emission reduction of 107 tons CO2. (Airis, 2013)
Since the country is situated near the equator, the suns path over Santo Domingo is directly from
west to east (Figure 5.4), and because most of the windows at the INTEC library are not exposed
to direct sunlight. Also since the lighting in the library is recently upgraded, there is no need to use
the sun as effective lighting.
Figure 5.4 Sun's path over the library. North and south side of the building is not exposed to direct sunlight (Appendix IV).

20
In the book halls in the INTEC library, infrared sensors are used as an accessible tool to improve
the energy savings of lighting. The system turns off the lights when the building space is
unoccupied. However, there are still several areas like stairwells and corridors where the use of
infrared sensors could be beneficial. Not only does the avoided lighting save electricity, it also
reduces the need for cooling, for every 3W of lighting there is an increased cooling need of 1W.
(Worldwatch, 2015).
5.3.3 Equipment
To meet the demands of student and employees the library has an extended amount of electrical
equipment. An inventory is listed in Table 5.2. Operating hours of electric equipment are estimated
from the opening hours of the library. Servers and radio station equipment need uninterruptable
power supply.
Description Quantity Operating
hours
CPU 51 13
Monitors 81 13
NAS 30 13
Printers 10 13
Copy Machines 1 13
Servers 1 24
Radio station 1 24
Television
screens 2 13
Table 5.2 Inventory list and operating hours of electrical equipment in the library.
5.3.4 Generators
Electricity loss is a major problem, aging grid and electricity theft contribute greatly to grid
inefficiencies. Because of the inefficiencies power shutdowns occur every day and the need for
backup generators is essential.
There are two generators with a total capacity of 608 kW installed at the INTEC library, however
there are no output meters installed at any generator at the whole campus. This makes it impossible
to know how often they are in use and how much they consume. Lack of measurement points is a
consistent problem at INTEC, and the only data the school has for the generators is the diesel bill
that includes the fuel consumption from all the generators of the campus. However, since power
outages occur every day, it can be concluded that the generators are frequently in use.
5.4 Photovoltaic project proposal
In 2009 a preliminary PV investigation was presented for the INTEC library, an installation with a
nominal output of 28 kW was proposed. Six PV panels that would cover 201,2 m2 were to be
placed on the roof of the library. Specifications for the equipment is listed in Appendix V. Annually

21
the project was estimated to generate 45,5 MWh, the initial investment cost was calculated to be
174 274 USD. (Guillermo, 2009) At the moment the proposal has not yet been realized and it is
not known if it is to be.

22
6 Results from simulations in RETScreen
Following chapters shows the results from simulations in RETScreen, and the assumptions and
the uncertainties that had to be evaluated.
6.1 Assumptions and Uncertainties
All simulations and models have been made in RETScreen, the program is used for energy
modeling in different types of buildings. However, since the program is a freeware, meaning
available free of charge some functions are slightly simplified compared to other energy
management programs. What could be questioned is that the program does not take all heat gains
into consideration, there is for instance no way of simulating the occupancy flow or additional wear
on the building. These factors affect the cooling load on the building.
There is no way of acquiring accurate statistics for electricity use since several buildings are linked
to the same measurement point, hence it is impossible to assure that the calculated total electricity
use is truthful. Due to lack of data for electrical components and HVAC systems, assumptions had
to be drawn, data for similar equipment has been used. Assumptions were also made for the average
daily usage of computers, printers and lights etc. The assumed values for the duty cycles for
electrical components and coefficient of performance (COP) for cooling systems are listen in Table
6.1 and Table 6.2. Typical heat gain values for office appliances are taken from Appendix I.
Description Electricity load
(kW)
Duty Cycle
(%)
CPU 0,69 50
Monitors 0,24 50
NAS (Network-attached
storage) 0,04 100
Printers 0,48 17
Copy Machines 1,75 17
Servers 14,4 100
Radio station 1,5 100
Television screens 0,2 100
Table 6.1 Assumptions made for duty cycle regarding the electrical equipment in the INTEC library.
All electrical devices are used regularly, though components like printers, copy machines and
monitors are only used occasionally. Devices like laptops and phone chargers are excluded from
the modelling since there is no way of calculating when they are in use.

23
Unit COP (Reference)
Duty
Cycle
(%)
Air Conditioning 15 ton 2,5 (CTW, 2016) 50
Air Conditioning 5 ton 2,7 (Appendix II) 50
Air Conditioning 4 ton 2,7 (Estimated) 50
Air Conditioning 1 ton 2,7 (Estimated) 50
AMICO AC Server Room 4,2 (Appendix II) 50
Table 6.2 Assumed duty cycle for AC-units in the library
Since there was no way of calculating the power input or output for the climate control systems no
exact COP was retrieved, however for the 5 ton unit and the AMICO unit in the server room,
specifications were found and are listed in Appendix II. An estimation was made that the 1 and 4
ton unit had similar COP as the 5 ton since they were of similar model. No specifications for the
15 ton units purchased in 1986 was found, when comparing to similar systems a conclusion was
made that an appropriate approximation of COP is somewhere from 2,2-3,8 (CTW, 2016).
To prevent AC from icing it is preferable to run the units at less than half the time, therefore a rule
of thumb for the duty cycle is approximately 50 % (Carlyle, 2012).
U-values and infiltration losses are impossible to accurately determine without having advanced
measurement instruments. Hence, the U-values and infiltration losses are estimated only from
observations. Windows and doors are made of single paned glass and most walls are of solid
concrete. There are also infiltration losses in the ventilation system since there is no recirculation
installed. Appendix VII shows the windows and doors in the INTEC library. U-values for windows
and doors are estimated to 6,63, for the concrete walls 0,87 is chosen (Yunus et al, 2015). It can
also be seen in the Appendix VII that all windows cannot be completely closed which lead to
infiltration losses.
Since there is no way of knowing the exact usage, the electricity production from the generators
are excluded from all simulation.
6.2 Total Energy Use
All gathered data has been simulated in RETScreen Figure 6.1 shows how the electricity use is
distributed in the INTEC library. The total annual electricity use is 1250 MWh. The majority of the
electricity is consumed by the climate system, the second largest consumer is equipment which
stands for 22 %. After changing to LEDs the lighting accounts 7 % of the total electricity
consumption.

24
Figure 6.1 Breakdown of total electricity distribution.
6.3 Electricity for lighting
Figure 6.2 shows the amount of electricity saved after all lights were changed. According to
simulations in RETScreen and quotation from the installation company, changing from lightbulbs
to LEDs has led to annual electricity savings of 60 % it has also decreased the cooling load on the
building (Airis, 2013). Furthermore, after simulating the change in RETScreen, it is shown that the
savings in electricity for lighting will lead to annual GHG reductions of 107 tons CO2.
Figure 6.2 Comparison of electricity use before and after changing to LED-lights.
71%
22%
7%
Electricity Distribution in the INTEC ibrary
Climate Control System
Equipment
Lighting
0
50
100
150
200
250
LED Incadescent
MW
h
Type
Annual Electricity Use of Lighting

25
7 Improvements simulated in RETScreen
In this chapter improvements for the INTEC library are suggested, among these is the transition
to a more efficient climate system and also improvements on the electrical equipment.
7.1 Improved Climate systems
Since seven of the central air-conditioners are thirty years old there are more efficient alternatives
on the market, an investment in newer units can reduce energy usage substantially. Another easy
solution for reducing energy use is to install thermostats in areas that are infrequently occupied,
this allows occupants to turn on and off cooling. Changing or cleaning filters regularly will improve
the airflow and decrease the load on the system, clean filters will also prevent dust and dirt from
building up in the system (EPA, 2009). To better evaluate the energy consumed for cooling it is
important to install temperature, flow and energy meters. At the moment there is no way of
knowing how much energy is consumed for cooling, and if no record is kept it is difficult to evaluate
when there is need for improvement.
In the proposed case the air-conditioning system Carrier 30HXC-271 is chosen (3 units), the units
have a COP of 4,9 and a cooling capacity of 15 RT (Carrier, 2016). When the design temperature
for the proposed case is set as 30° C which is the highest expected outdoor temperature
(Worldbank, 2009), simulations show that the building needs 265 MWh electricity annually for
cooling. When simulating the current energy use in RETScreen, the building has an electricity
consumption of 881 MWh for cooling, see Figure 7.1. If the suggested installation was installed,
annual electricity use for cooling would be reduced by 70 %. In this case, RETScreen makes an
energy balance calculation and take into account all the heat gains (electrical equipment, infiltration,
radiation and convection) in order give a result of the total cooling used in the building
(RETScreen, 2016).
Figure 7.1 Electricity use for current and proposed climate system.
0
100
200
300
400
500
600
700
800
900
1000
Current Climate System Proposed case
MW
h
Energy use of current climate system compared to more efficient system

26
7.2 Decrease infiltration in windows and doors
Infiltration loss is a big issue in the INTEC library. Windows and doors are not insulated properly.
Often doors between cooled and uncooled areas are kept open and that leads to major energy
losses. To ventilate study rooms windows are often opened which lead to losses in cooling but also
heat gains from outdoors. Another option could be to install revolving doors to the main entrance
that would reduce infiltration when doors are opened.
RETScreen also show that if infiltration in the library was reduced by 50 %, the cooling load could
be decreased by 9 %. This could be achieved by repairing cracks, insulating frames or simply by
closing doors and windows.
7.3 Improved electrical equipment
There are improvements that can be made for the electrical equipment in the library. Since the
computers are not used for high performance work, it is not necessary to use separate CPU units.
CPU units do not only have a higher electricity load they also emit more heat, by connecting all 81
monitors to the servers lead to reductions in electricity use for equipment, furthermore it reduces
the cooling load on the building were savings also can be made. Copy machines and television
screens are only used partially during the day and it is not seen feasible to change these units. Figure
7.2 shows how the electricity use would decrease from more effective equipment and how the
cooling load would reduce by avoided heat gains.
Figure 7.2 Reductions in electricity consumption if investments were made in new technology.
7.4 Conclusion of improvements
After applying the proposed case the electricity use will be distributed as can be seen in Figure 7.3.
Instead of 74 % the electricity distribution for climate systems will land at 47 %.
-200
0
200
400
600
800
1000
1200
1400
Current situation Proposed case
MW
h
Equipment's electricity use, current situation compared to proposed case
Reduction inelectricity use forcooling
Reduction inelectrcity use forequipment
Total electricityuse

27
Figure 7.3 Electricity breakdown after proposed case is implemented.
Figure 7.4 shows the amount of electricity that can be saved with the proposed case that includes,
improved HVAC system and equipment. By installing a new climate system as much as 616
MWh annually can be saved on cooling, by improving electrical equipment 74 MWh can be
saved. In total 690 MWh in electricity per year can be avoided by implementing the proposed
case. Which is a 56% decrease compared to the current situation.
Figure 7.4 Illustration over electricity reductions that can be with the proposed case, compared to the current situation.
By realizing the proposed solar panel project, the library will partially become self-sufficient. It will
reduce electricity costs but it will also lead to reductions of greenhouse gases. According to
simulations in RETScreen, it is estimated that the solar project can produce up to 55 MWh
electricity per year, and a decrease of GHG by 32 tons CO2. This calculation was for 201,2 m2 of
47%
37%
16%
Electricity Distribution in the INTEC library after the proposed improvements
Climate System
Equipment
Lighting
-1000
-500
0
500
1000
1500
Current situation Proposed case
MW
h
Buildings annual electricity use, current situation compared to proposed case
Reduction inelectricity use forequipment
Reduction inelectrcity use forequipment
Total electricityuse

28
solar panels. In the current situation the solar-project would only cover 4 % of the total electricity
use, for the proposed case it would cover 10 % (Figure 7.5).
Figure 7.5 Proportion of what solar electricity would cover if solar project would be realized.
Figure 7.6 shows greenhouse gas emissions for the current situation and for the proposed case.
Not only could electricity use be decreased, but GHG emissions annually could be reduced by 53
%.
Figure 7.6 Current greenhouse gas emissions and for proposed case.
7.5 Financial results
The results show that the costs for the electricity is massive in the current situation, INTEC pays
$212 554 annually to power up the library. However, the improvements implemented in the
proposed case lead to savings of $117 238 annually. For instance, RETScreen simulations show
that a hypothetical investment in improved climate systems and electrical equipment of
$1 000 000 could have a payback period of 8,5 years, when factors such as inflation rate, project
0
200
400
600
800
1000
1200
1400
Current situation Proposed case
MW
hSolar-projects impact on the energy use
Solar power Electricity from the grid
0
200
400
600
800
1000
1200
Current Climate System Proposed case
tCO
2
GHG emissions in tons CO2 equivalent

29
life, debt ratio, debt interest rate and debt term are taken in account (Appendix III). Another
simulation was made for an investment to improve the building envelope and is also included in
Appendix III.
7.6 Sensitivity analysis
Depending on the countries development in the energy sector, electricity prices will most certainly
change over time. A sensitivity analysis for the scenario where electricity price increases and
decreases with 50 % has been performed. The changes for the annual electricity spent is practically
linear with the change in electricity price for both the current and proposed case, see Figure 7.7.
However, the current case has a steeper incline than the proposed case. This once again proves
that the proposed case will long term be more profitable.
Figure 7.7 Sensitivity analysis of the buildings yearly electricity cost, when altering the electricity price.
One of the parameters estimated are the duty cycles for the air-conditioners, since the duty cycle
varies with the outdoor temperature the electricity use will change with it. In Figure 7.8, it can be
seen that the increase-rate in electricity is higher for the current system compared to the proposed.
This could be explained by the fact that the proposed system consists of more efficient AC-units,
the current installation has several units with varied efficiency.
0
50000
100000
150000
200000
250000
300000
350000
Ele
ctri
city
co
sts
($)
Change in electricity price
Electricity costs when altering conventional electricity grid price
Current
Proposed Case

30
Figure 7.8 Sensitivity analysis of buildings electricity use when altering the duty cycle.
0
200
400
600
800
1000
1200
1400
1600
-50%-40%-30%-20%-10% 0% 10% 20% 30% 40% 50%
MW
h
Change in duty cycle
Electricity use when altering duty cycle
Current
Proposed Case

31
8 Discussion
For a building of such size the electricity use can be considered to be extremely high. This can
mostly be blamed on the inefficient AC-units that are in use and the fact that the building has an
installed cooling load of 509 kW which is 340 kW more than what is actually needed. Another
explanation for high electricity use for cooling is that infiltration losses are high, windows and doors
are not energy efficient and are often left open. An option could be to replace them, however in
many cases it is sufficient enough to properly insulate and seal openings. The LED project shows
that the school is taking measurements to reduce electricity use and significant results has been
achieved, although it is not enough to improve the overall energy use. The electronic equipment
that is being used, could be improved, but is in line with what can be considered normal for a
building of such purpose. Savings can be made by investing in electrical equipment and improving
insulation, however if an investment was made in new climate systems major energy reductions
could be accomplished.
Changing climate systems will lead to savings, but if overall attitude from occupants towards
electricity use and sustainability is kept the same, no investments will lead to long term
improvement. Policies and rules has to be introduced for the future development of the building
sector. Since there are no agencies regulating and forcing the sector towards sustainability there is
no motivation or obligation to further develop. In commercial buildings air-conditioning is often
overconsumed, in areas that are unoccupied AC-units are often left running. Another major issue
is that many buildings like the INTEC library have no way of measuring the electricity use, often
several buildings are connected to the same electricity meter, hence makes it impossible to make
accurate energy audits. Inventory lists are in many cases not updated, equipment like compressors
and filters can be replaced without being recorded and all these factors makes it more difficult to
monitor the actual electricity consumption.
The proposed solar panel is a good intention, and PV systems offer environmental superiority over
electricity generation from conventional resources, but taken in account the current electricity
consumption it will not lead to a considerable change and investment in the project is not financially
viable. However, since the proposed project is from 2009 it might be time to look over the
possibilities for partial self-sufficiency since more efficient technology is available.
Not only do improvements lead to energy savings, but it will also lead to reductions in greenhouse
gases. On the whole, if energy management projects would be conducted and fulfilled it will help
the country to achieve the MDGs that have been set.
The reliance on imported fuels has led to high cost of generation and significant increase in foreign
debt, and it is clear that a transition to a sustainable electricity sector based on the use of renewables
is technically feasible in the Dominican Republic. However, rising energy demand will require
further capacity additions. Significant investments have to be made, but since the country has high
potential for renewables, long term it will prove to be profitable.
Not all factors are taken in account in RETScreen, which may have affected the results. For
instance, there is no way to measure the exact amount of infiltration in the building, no way of
knowing the circulation of people at every moment and if occupants use laptops or change phones.
Also the simulation is made for 365 days, holidays and weekends which have slightly different

32
conditions are not taken into consideration. However, on the whole, the results do reflect the actual
energy breakdown.

33
9 Conclusion and Future work
What can be concluded from the discussion and overall from this report, is that there are
possibilities for reductions in energy use. HVAC systems are inefficient and consume more
electricity than what is considered to be reasonable, improved building envelope could help reduce
energy for climatization and help save significant amounts of money. However, since there is no
way of measuring the electricity consumption it is hard to conduct an energy management project.
If the current energy use is not known, there is no way of knowing how much energy is saved when
applying an improvement. Computer simulations will give an overall overview but there are many
factors that cannot be replicated, this makes it hard to say if results are completely accurate.
Therefore, for future projects it is suggested that proper measurements of exact energy use are
taken.
What also can be concluded is that policies and regulations within the building sector has to be
implemented if change is going to take place. At the moment the majority of the population are
not environmental aware, and as a social project it may be appropriate to educate the population
in energy management and how the current situation effect on global level. This could be achieved
by handing out surveys to students and employees and investigate their perception of the situation.
What can be said is that if other buildings on the INTEC Campus have the same conditions as the
library, the reductions in energy use that can be made are immense.

34
Bibliography
Airis. (2013, November 21). Proyecto de Iluminación LED INTEC Biblioteca. Airis
Soluciones Iluminación, 2013
Ariza G, (2016). A Legal Guide to Investing in the Dominican Republic, Retrieved April 5,
2016, from http://www.drlawyer.com/wp-content/uploads/2016/04/InvestorsGuide2.pdf
ASHRAE. (2011). Procedures for Commercial Building Energy Audits. American Society of
Heating, Refrigeration, and Air-Conditioning Engineers. 2011.
ASHRAE. (2013). Handbook – Fundamentals, SI edition. American Society of Heating,
Refrigeration, and Air-Conditioning Engineers. 2013.
Bueno et al. (2008). The Caribbean and Climate Change. Stockholm Environment Institute –
US Center, Global Development and Environmental Institute, Tufts University, 2008
C2ES, (2006). Center for Climate and Energy Solutions, Buildings Overview, Retrieved May
20, 2016, from http://www.c2es.org/technology/overview/buildings
Carlyle R, (2012). How can I save electricity from my air conditioner, Quora Energy
Efficiency, Retrieved May 9, 2016, from https://www.quora.com/How-can-I-save-electricity-
from-my-air-conditioner
Carrier, (2016). Aquaforce 30HX, Carrier Corporation ©, Retrieved May 25, 2016, from
http://www.carrier.com/commercial/en/us/products/chillers/chillers/30hx/
Cleanaire, (n.d.). What does HRV do?, Cleanaire™ Heat Recovery Ventilator, Retrieved May
21, 2016, from http://www.cleanaire.co.nz/IAQ++Health.html
CLEAR, (2016). Comfortable Low Energy Architecture, Heat Loss or Heat Gain, Retrieved
May 20, 2016, from
http://www.newlearn.info/packages/clear/thermal/buildings/building_fabric/heat_transfer/heat
_loss.html
CNE. (n.d.). Plan Energético Nacional. National Energy Commission, from
http://www.cne.gov.do/app/do/pen.aspx
Designing buildings, (2016). Solar Gain in Buildings, Retrieved May 20, 2016, from
http://www.designingbuildings.co.uk/wiki/Solar_gain_in_buildings
EPA, (2009, August), A Guide to Energy-Efficient Heating and Cooling, United States
Environmental Protection Agency. (2009)
Erwine. B et al, (2001), Advanced Lighting Guidelines 2001 Edition, New Buildings Institute,
2015: 4.9-4.11
EST, (n.d.). Home Appliances. Energy Savings Trust, Retrieved March 30, 2016, from
http://www.energysavingtrust.org.uk/domestic/home-appliances
Fiezer E. (2013, March 27), Paying beans for Venezuelan oil. CS-monitor, Retrieved
February 28, 2016, from http://www.csmonitor.com/World/Americas/2013/0327/Petrocaribe-
Paying-beans-for-Venezuelan-oil

35
Gustavsson B, (2004). Kunskapande metoder inom samhällsvetenskapen, Studentlitteratur
AB.
Guillermo L, (2009, April). Propuesta Energética de 25 KW de Capacidad, Labaoratoria de
Eficiencia Energética.
Havtun, H & Bohdanowicz, P, (2015), Sustainable Energy Utilization, KTH Energy
Technology
HPR, (2015). Heat Recovery Ventilation Guide for Houses, Homeowner Protection Office,
2015
HW, (2016). Cost to Insulate Windows, Homewise, Retrieved May 9, 2016, from
http://www.homewyse.com/services/cost_to_insulate_windows.html
INTEC. (2016a). Instituto Tecnologico de Santo Domingo, Retrieved March 28, 2016, from
https://www.intec.edu.do/acerca-de-intec
INTEC. (2016b). Instituto Tecnologico de Santo Domingo, Retrieved March 28, 2016, from
https://www.intec.edu.do/biblioteca
Knoema. (2016). Dominican Republic – International tourism, number of arrivals. Retrieved
March 18, 2016, from http://knoema.com/atlas/Dominican-Republic/Number-of-arrivals
Maheshwari K, (2012). Room Ventilation Systems, Cleveland Clinic Foundation, (2012)
Mayo Energy Agency, (2007, February), What is a U-value? , Save Agency (2007)
Microgrid, (2010). The Difference Between ASHRAE level 1,2 & 3 Energy Audit, Microgrid
Solar, Retrieved April 18, 2016, from http://microgrid-solar.com/the-difference-between-
ashrae-level-1-2-3-energy-audits/
Mitigation Partnership, (n.d.). Dominican Republic Commits to a 25% Reduction in
Greenhouse Gas Emissions by 2030, International Partnership on Mitigation and MRV,
Retrieved April 26, 2016, from http://mitigationpartnership.net/dominican-republic-commits-
25-reduction-greenhouse-gas-emissions-2030
Mitsubishi, (n.d.). 5 Advantages of Ductless Cooling and Heating Systems, Mitsubishi
Electric US ©, Retrieved May 27, 2016 from
http://www.mitsubishicomfort.com/articles/ductless/5-advantages-of-ductless-cooling-and-
heating-systems
MyClimate. (n.d.). Solar Power Plant Replaces Fossil Energy. Foundation MyClimate, The
Climate Protection Partnership, Retrieved March 16, 2016, from
http://www.myclimate.org/carbon-offset-projects/projekt/dominican-republic-solar-7171/
NASA, (2016). NASA Surface meteorology and Solar Energy – Location, National
Aeronautics and Space Administration, Retrieved May 5, 2016, from
https://eosweb.larc.nasa.gov/cgi-bin/sse/[email protected]
NRCAN. (2016, April 18). RETScreen Clean Energy Management Software. Government of
Canada Retrieved March 29, 2016 from http://www.nrcan.gc.ca/energy/software-tools/7465
NREL. (2015, September). Energy Snapshot Dominican Republic. Energy Transition
Initiative, National Renewable Energy Laboratory, 2015

36
OECD. (2015, February 17). An Introduction to Energy Management Systems. Organisation
for Economic Co-Operation and Development, 2015
Pacific Northwest. (2001, September). A Guide to Energy Audits. U.S Department of Energy,
2011
Randall, (2005). Environment Design and Introduction for architects and engineers. (2005),
110-129
Refrigerating Engineering, (2015), The vapour Compression Cycle, (2015). Chapter 3
Sahta et al, (2014). The control of human thermal comfort by smart clothing. Riga Technical
University, Latvia, 2014
Sol-arq, (2016). Soluciones Arquitectónicas Sustentables, Metodo de Balance Térmico,
Retrieved May 20, 2016, from http://www.sol-arq.com/index.php/edificios/balance-termico
Self-Sustaining Building, (2016). What is self-sustaining building. Retrieve may 20, 2016,
from http://www.self-sustaining-building.org/self-sustaining-building/what-is-self-sustaining-
building.html
U.S. Energy. (n.d.). Lighting Choices to Save you Money. U.S. Department of Energy, from
http://energy.gov/energysaver/lighting-choices-save-you-money
UN – Development. (2005), Energy Services for the Millennium Development Goals. United
Nations Development Programme, 2005
World Atlas. (2015, September 29). Dominican Republic. Retrieved April 4, 2016, from
http://www.worldatlas.com/webimage/countrys/namerica/caribb/do.htm
WorldBank. (2016a). Average Monthly Temperature and Rainfall for Dominican Republic
from 1900 – 2012. Retrieved March 10, 2016, from
http://sdwebx.worldbank.org/climateportal/index.cfm?page=country_historical_climate&This
Region=Latin%20America&ThisCCode=DOM
WorldBank. (2016b). Electric power consumption. Retrieved March 10, 2016, from
http://data.worldbank.org/indicator/EG.USE.ELEC.KH.PC
Worldwatch. (2015, July). Harnessing the Dominican Republic’s Sustainable Energy
Resources. Worldwatch Institute, Washington D.C., 2015
Yunus, A. et al, Heat and Mass Transfer Fundamentals & Applications, McGraw Hill
Education, 2015

37
Appendix I. Heat gain values for electrical equipment
Equipment Description
Nameplate
Power,
W
Average
Power,
W
Radiant
Fraction
Desktop computer
Manufacturer A (model A); 2.8 GHz processor, 1 GB RAM 480 73 0,10
Manufacturer A (model B); 2.6 GHz processor, 2 GB RAM 480 49 0,10
Manufacturer B (model A); 3.0 GHz processor, 2 GB RAM 690 77 0,10
Manufacturer B (model B); 3.0 GHz processor, 2 GB RAM 690 48 0,10
Manufacturer A (model C); 2.3 GHz processor, 3 GB RAM 1200 97 0,10
Laptop computer
Manufacturer 1; 2.0 GHz processor, 2 GB RAM, 430 mm screen 130 36 0,25
Manufacturer 1; 1.8 GHz processor, 1 GB RAM, 430 mm screen 90 23 0,25
Manufacturer 1; 2.0 GHz processor, 2 GB RAM, 355 mm screen 90 31 0,25
Manufacturer 2; 2.13 GHz processor, 1 GB RAM, 355 mm screen, tablet PC 90 29 0,25
Manufacturer 2; 366 MHz processor, 130 MB RAM (355 mm screen) 70 22 0,25
Manufacturer 3; 900 MHz processor, 256 MB RAM (265 mm screen) 50 12 0,25
Flat-panel monitor
Manufacturer X (model A); 760 mm screen 383 90 0,40
Manufacturer X (model B); 560 mm screen 360 36 0,40
Manufacturer Y (model A); 480 mm screen 288 28 0,40
Manufacturer Y (model B); 430 mm screen 240 27 0,40
Manufacturer Z (model A); 30 mm screen 240 29 0,40
Manufacturer Z (model C); 380 mm screen 240 19 0,40
Table I.1 Recommended Heat Gain from Typical Computer Equipment (2013 ASHRAE Handbook-Fundamentals (SI))

38
Equipment Description
Nameplate
Power,
W
Average
Power,
W
Radiant
Fraction
Laser printer,
typical desktop,
small-office type
Printing speed up to 10 pages per minute 430 137 0,30
Printing speed up to 35 pages per minute 890 74 0,30
Printing speed up to 19 pages per minute 508 88 0,30
Printing speed up to 17 pages per minute 508 98 0,30
Printing speed up to 19 pages per minute 635 110 0,30
Printing speed up to 24 page per minute 1344 13 0,30
Multifunction
(copy, print, scan)
Small, desktop type 600 30
40 15
Medium, desktop type 700 135
Scanner Small, desktop type 19 16
Copy machine Large, multiuser, office type
1750 800 (idle 260 W)
1440 550 (idle 135 W)
1850 1060 (idle 305 W)
Fax machine Medium 936 90
Small 40 20
Plotter Manufacturer A 400 250
Manufacturer B 456 140
Table I.2 Recommended Heat Gain from Typical Laser Printers and Copiers (2013 ASHRAE Handbook-Fundamentals (SI))

39
Appendix II. Specifications AC-units
Specifications for 5 ton AC-unit.

40
Specifications for COP value when design temperature is set as 30C. From graph it can be
estimated to 3,7.
Figure II.1 COP value for ac-unit Amico. (Unflair, 2010)
When Seasonal Energy Efficiency Ratio (SEER) is given the following equation is used to
convert into COP (Power Calculations, 2015).
𝐶𝑂𝑃 =1,12×𝑆𝐸𝐸𝑅−0,02×𝑆𝐸𝐸𝑅2
3,41 [2]

41
Appendix III. Financial Payback Periods
A hypothetical investment $1 000 000 to make improvements in the library would have a payback
period of 8,5 years. This calculation includes the following factors:
Inflation rate 4,7%
Project life 20 years
Debt ratio 50%
Debt interest rate 16,00%
Debt term 20 years
Table III.1 Financial Parameters
Figure III.1 Payback Period For An Hypothetical Investment Of One Million Dollar
To insulate a window by adding fasteners, vent flow baffles and sealing tapes has an average cost
of $35 (HW, 2016). The INTEC library has approximately 120 windows, and if investments of
$10 000 were made, electricity for cooling would annually be reduced by 31 MWh which
corresponds to $ 5268. The simple payback for the project would be 1,9 years.
Figure III.2 Payback Period If Windows And Doors Were Insulated
-1 000 000
-500 000
0
500 000
1 000 000
1 500 000
2 000 000
0 1 2 3 4 5 6 7 8 9 10 11 12 13 14 15 16 17 18 19 20
CU
MM
UL
AT
IVE
CA
SH
FL
OW
($)
YEAR
Payback Period For An Hypothetical Investment Of One Million Dollar
-15 000
-10 000
-5 000
0
5 000
10 000
15 000
20 000
25 000
0 1 2 3 4 5
CU
MM
UL
AT
IVE
CA
SH
FL
OW
($)
YEAR
Payback Period If Windows And Doors Were Insulated

42
Appendix IV. Building envelope
Figure IV.1 West and East side of INTEC library.

43
Figure IV.2 North side of INTEC library.

44
Figure IV.3 South side of INTEC library

45
Figure IV.4 First floor of the INTEC Library.

46
Figure IV.5 Second floor of the INTEC Library.
47
Figure IV.6 Third floor of the INTEC Library.

48
Appendix V. Specifications for solar panels
Physical characteristics of the module SI-ESFM-M200W
Width (mm) 1069
Height (mm) 1580
Thickness (mm) 45
Weight (Lbs) 55
Table V.1 Physical characteristics of the module SI-ESFM-M200W
Electrical Characteristics Module SI-ESFM-M200W
Maximum Power (Wp) 200 (± 3%)
Short Circuit Current Isc (A) 4.80
Maximum Power Current Imp (A) 4.21
Open Circuit Voltage Voc (V) 57.8
Voltage Maximum Power Vmp (V) 47.5
Maximum System Voltage (VDC) 1000
Table V.2 Electrical Characteristics Module SI-ESFM-M200W
Inverter Model SMA Sunny Boy 7000US
Maximum Power 7.45 kW
Nominal Power 7.0 kW
Nominal/Range Voltage 183 – 229 V @208 V
Maximum Input Voltage 600 V DC
Power Factor 0.99 @ nominal power
Peak Efficiency 97.1%
Work Temperature -25 a 45°C
Consumption Standby/Night < 7 W / 0.1 W
Dimensions W x H x T in cm 46.74 x 61.21 x 24.13
Weight 141 lbs
Protection NEMA 3R / IP65
Warranty 10 Years
Table V.3 Inverter Specifications

49
Appendix VI. Installed climate systems
Figure VI.1 AC-units on rooftop, top photos show the 15 ton units, bottom photo are the 5 ton units.

50
Appendix VII Observations from the library
Figure VII.1 Ventilation and AC-duct in the library.
Figure VII.2 Single paned doors at the front entrance.

51
Figure VI.3 Single panel windows at the library
Figure VII.4 Window that cannot be fully closed.