energy management :: 2007/2008 - ulisboa management :: 2007/2008 class # 3t life cycle assessment,...
TRANSCRIPT
Energy Management :: 2007/2008
Class # 3T
Life Cycle Assessment,Energy and Environment
Prof. Paulo Ferrã[email protected]

Energy Management
Class # 3T :: Life Cycle Assessment, Energy and Environment Slide 2 of 53
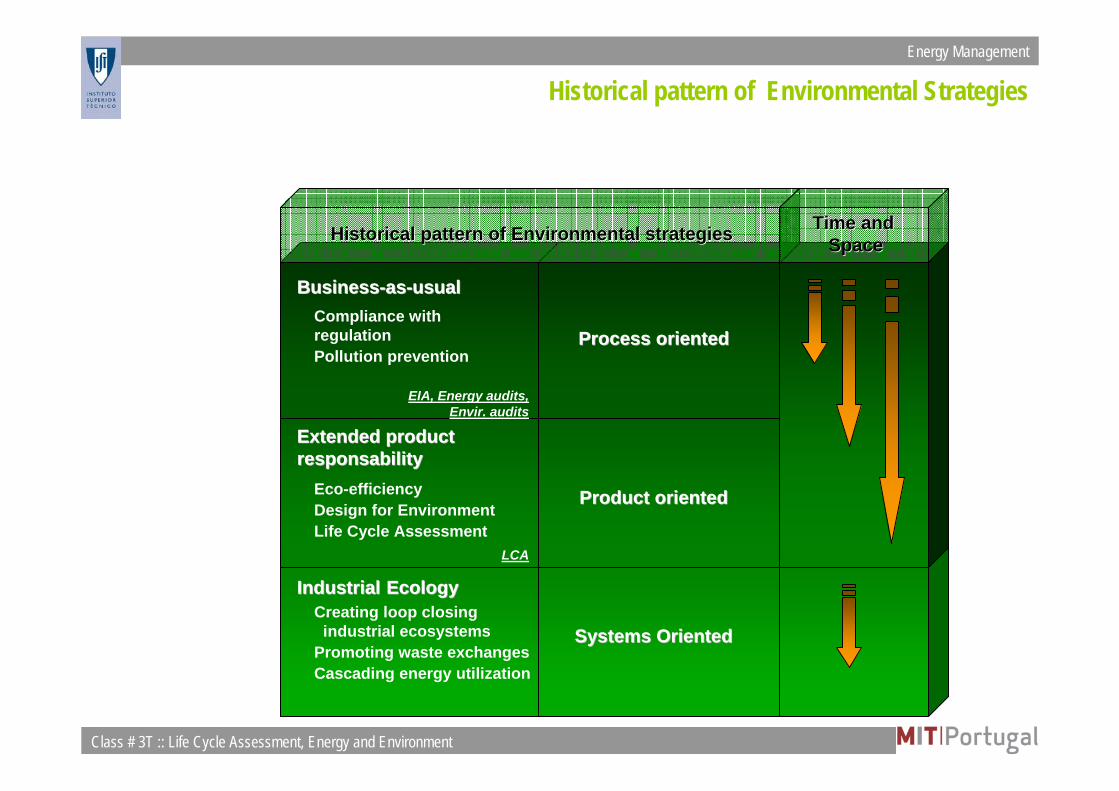
ExtendedExtended productproductresponsabilityresponsability
Eco-efficiencyDesign for EnvironmentLife Cycle Assessment
LCA
ProductProduct orientedoriented
BusinessBusiness--asas--usualusualCompliance withregulationPollution prevention
EIA, Energy audits, Envir. audits
ProcessProcess orientedoriented
HistoricalHistorical patternpattern ofof EnvironmentalEnvironmental strategiesstrategies TimeTime andandSpaceSpace
Historical pattern of Environmental Strategies
Energy Management
Class # 3T :: Life Cycle Assessment, Energy and Environment Slide 3 of 53
MSW
EEE
Car
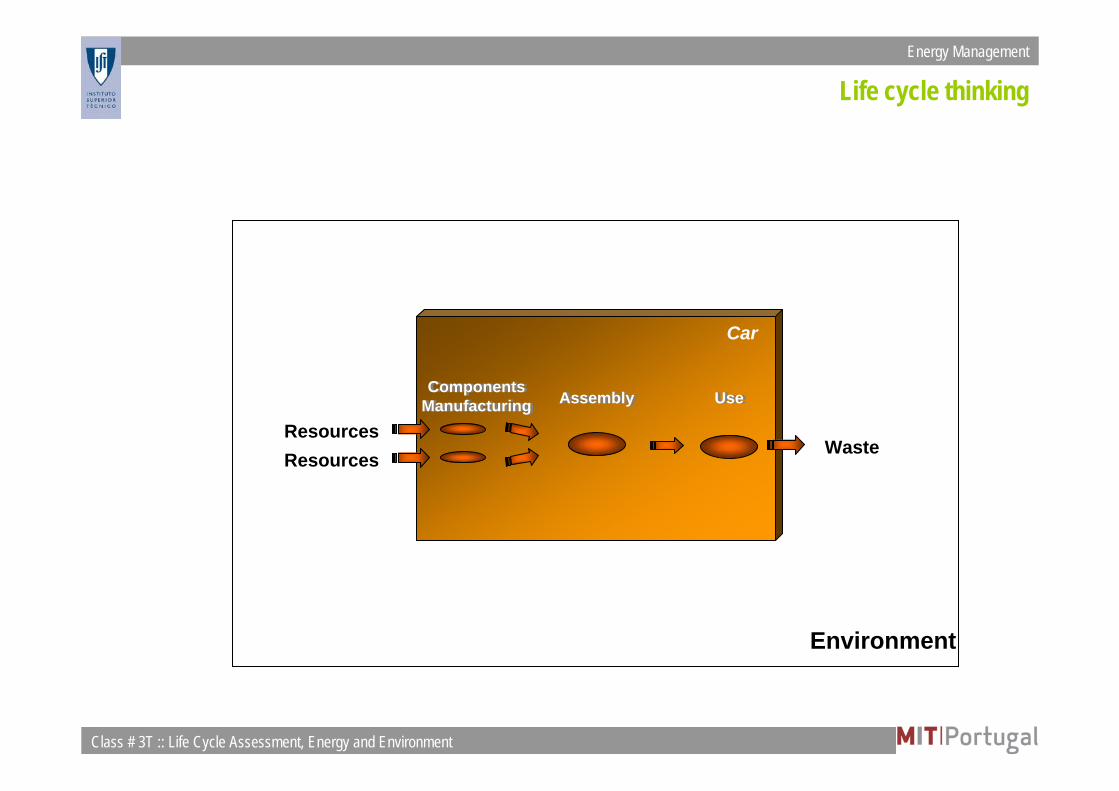
Components ManufacturingComponents
Manufacturing AssemblyAssembly UseUse
Waste
Environment
ResourcesResources
Life cycle thinking

Energy Management
Class # 3T :: Life Cycle Assessment, Energy and Environment Slide 4 of 53
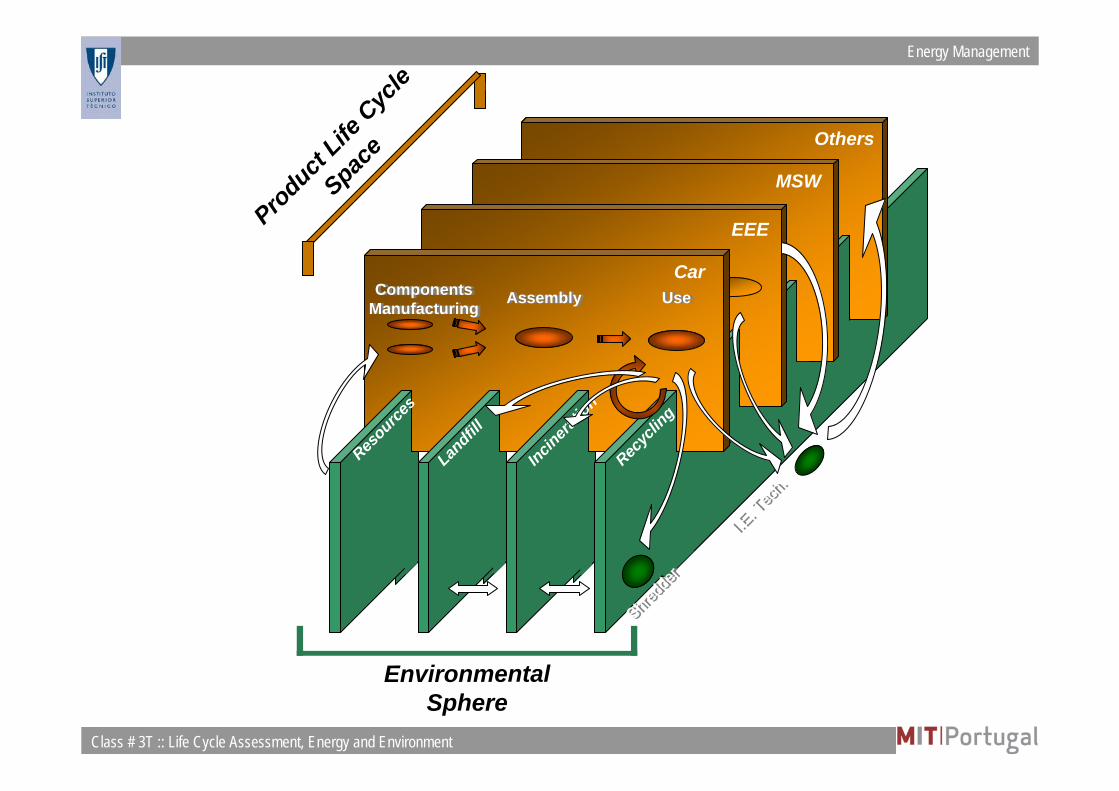
MSW
Others
EEEProduct
LifeCyc
le
Space
Environment
Car
Components ManufacturingComponents
Manufacturing AssemblyAssembly UseUse
Resources Waste
Life cycle thinking
Energy Management
Class # 3T :: Life Cycle Assessment, Energy and Environment Slide 5 of 53
IndustrialIndustrial EcologyEcologyCreating loop closing
industrial ecosystemsPromoting waste exchangesCascading energy utilization
SystemsSystems OrientedOriented
ExtendedExtended productproductresponsabilityresponsability
Eco-efficiencyDesign for EnvironmentLife Cycle Assessment
LCA
ProductProduct orientedoriented
BusinessBusiness--asas--usualusualCompliance withregulationPollution prevention
EIA, Energy audits, Envir. audits
ProcessProcess orientedoriented
HistoricalHistorical patternpattern ofof EnvironmentalEnvironmental strategiesstrategies TimeTime andandSpaceSpace
Historical pattern of Environmental Strategies
Energy Management
Class # 3T :: Life Cycle Assessment, Energy and Environment Slide 6 of 53
Others
MSW
EEE
CarComponents
ManufacturingComponents
Manufacturing AssemblyAssembly UseUse
Incinera
tion
Landfill
Resource
s
Recyc
lingEnvironmental
SphereI.E
. Tec
h.
I.E. T
ech.
Shredd
er
Shredd
er
Product
LifeCyc
le
Space
Energy Management
Class # 3T :: Life Cycle Assessment, Energy and Environment Slide 7 of 53
Others
MSW
EEE
CarComponents
ManufacturingComponents
Manufacturing AssemblyAssembly UseUse
Incinera
tion
Landfill
Resource
s
Recyc
ling
I.E. T
ech.
I.E. T
ech.
Shredd
er
Shredd
er
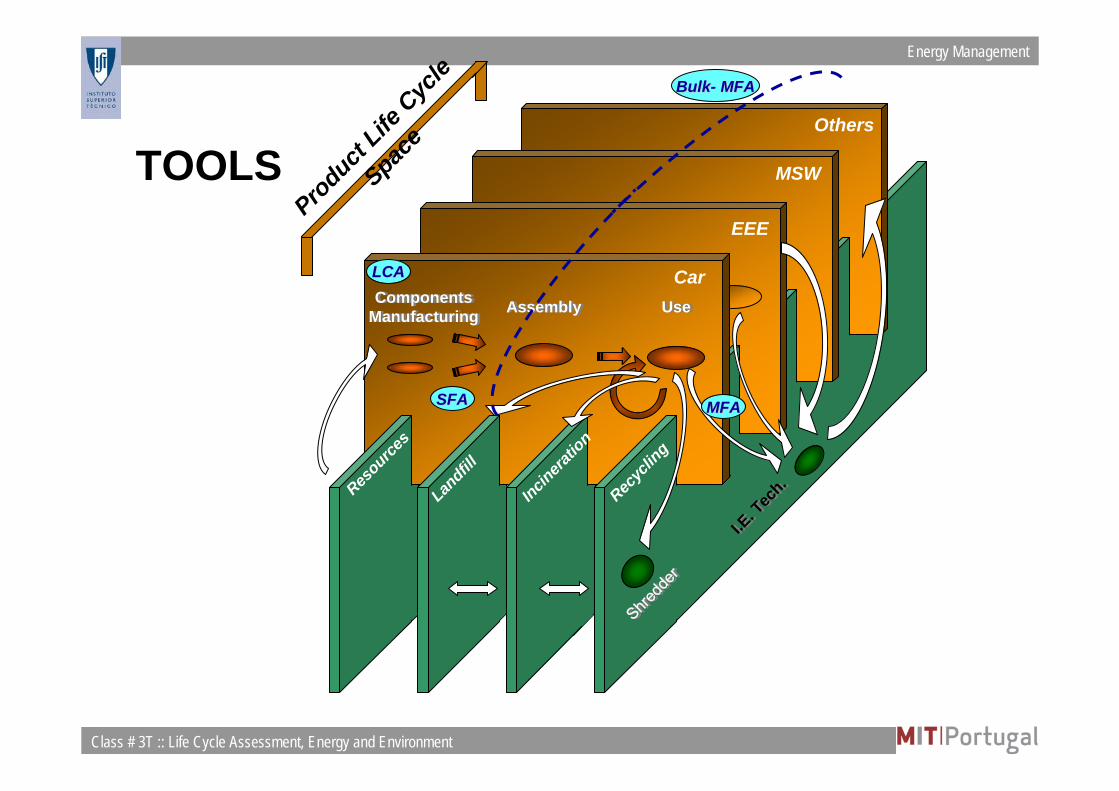
Product
LifeCyc
le
Space
BulkBulk-- MFAMFA
LCALCA
SFASFA MFAMFA
TOOLS
Energy Management
Class # 3T :: Life Cycle Assessment, Energy and Environment Slide 8 of 53
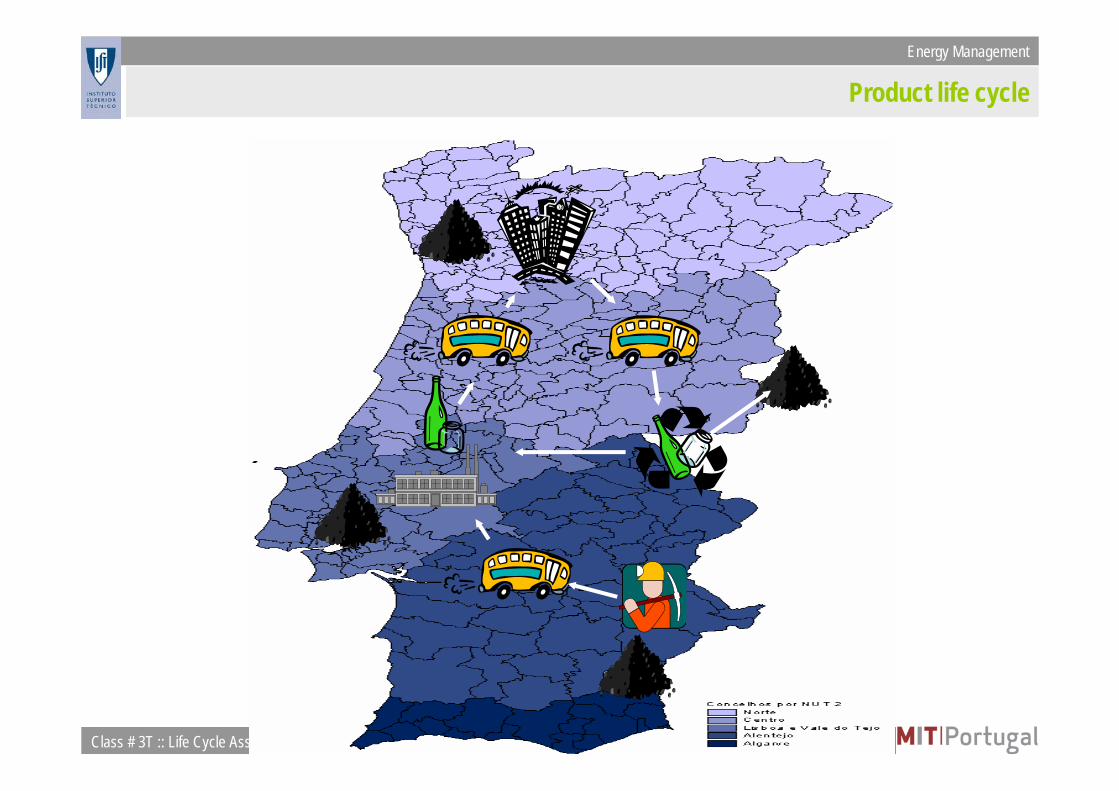
Historical pattern of Environmental StrategiesProduct life cycle

Energy Management
Class # 3T :: Life Cycle Assessment, Energy and Environment Slide 9 of 53
PRODUCTION
RECYCLING
DISTRIBUTION USE
RE-USE
INCINERATION
LANDFILLMATERIAL A
OTHER
MATERIAL B
ENERGY
Life Cycle Assessment

Energy Management
Class # 3T :: Life Cycle Assessment, Energy and Environment Slide 10 of 53
Definition of LCA
Definition of LCA Definition of LCA according to ISO 14040:
LCA is a technique […] compiling an inventoryof relevant inputs and outputs of a product system;evaluating the potential environmental impactsassociated with those inputs and outputs;and interpreting the results of the inventory and impact phases in relation to the objectives of the study.
Energy Management
Class # 3T :: Life Cycle Assessment, Energy and Environment Slide 11 of 53
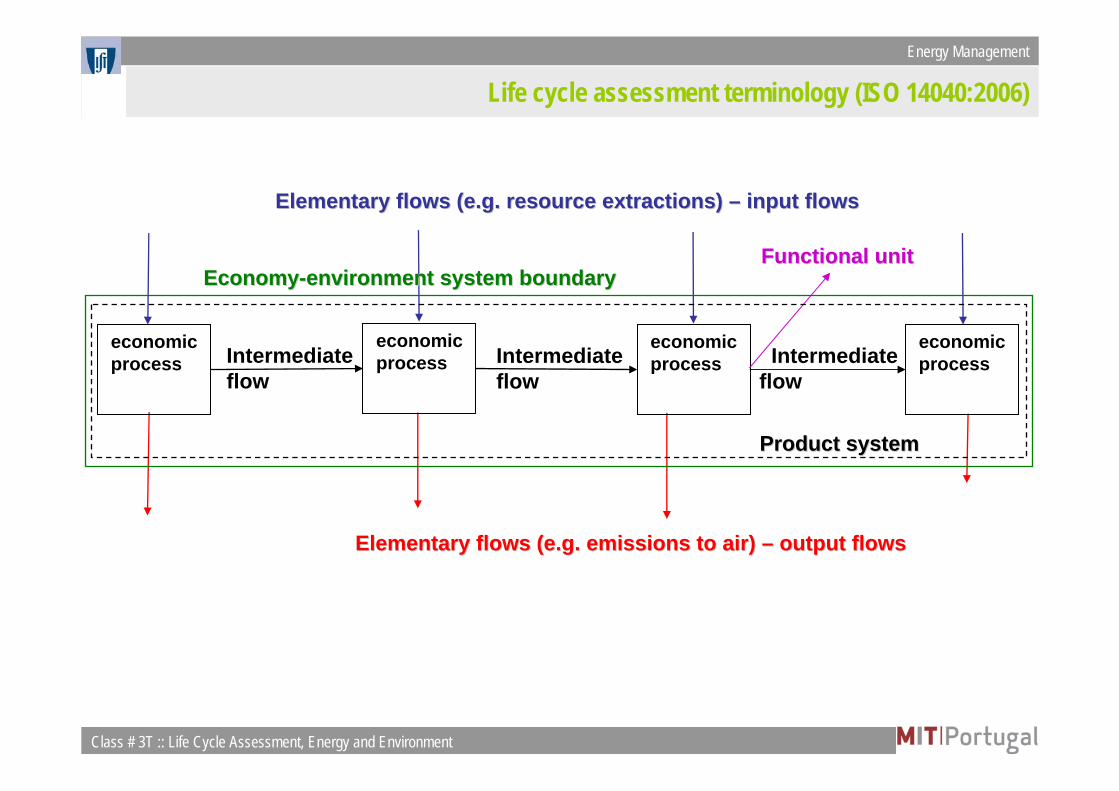
Life cycle assessment terminology (ISO 14040:2006)Life cycle assessment terminology (ISO 14040:2006)
economicprocess
economicprocess
economicprocess
economicprocess
Functional unitFunctional unit
Elementary flows (e.g. resource extractions) Elementary flows (e.g. resource extractions) –– input flowsinput flows
Elementary flows (e.g. emissions to air) Elementary flows (e.g. emissions to air) –– output flowsoutput flows
EconomyEconomy--environment system boundaryenvironment system boundary
Intermediateflow
Intermediateflow
Intermediateflow
Product systemProduct system
Life cycle assessment terminology (ISO 14040:2006)
Energy Management
Class # 3T :: Life Cycle Assessment, Energy and Environment Slide 12 of 53
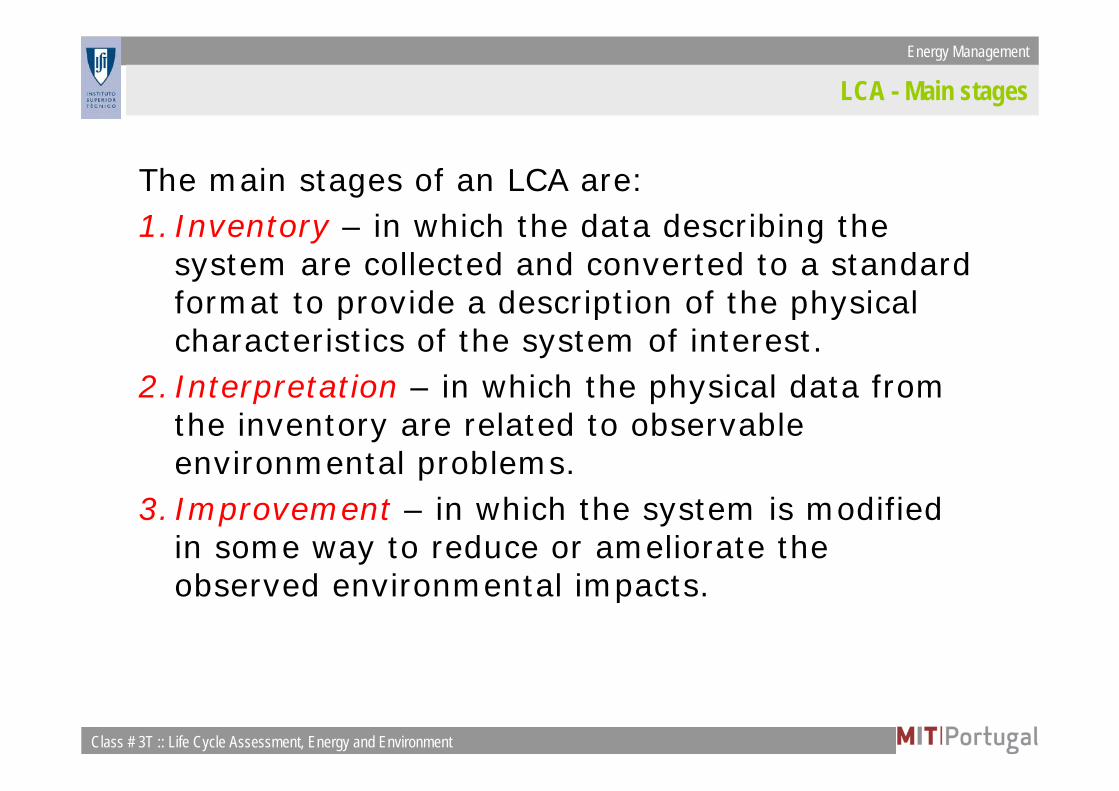
LCA - Main stages
The main stages of an LCA are:1.Inventory – in which the data describing the
system are collected and converted to a standard format to provide a description of the physical characteristics of the system of interest.
2.Interpretation – in which the physical data from the inventory are related to observable environmental problems.
3.Improvement – in which the system is modified in some way to reduce or ameliorate the observed environmental impacts.

Energy Management
Class # 3T :: Life Cycle Assessment, Energy and Environment Slide 13 of 53
Product - SERVICEFunctional Unit
ISO 14040ISO 14040…
Energy Management
Class # 3T :: Life Cycle Assessment, Energy and Environment Slide 14 of 53
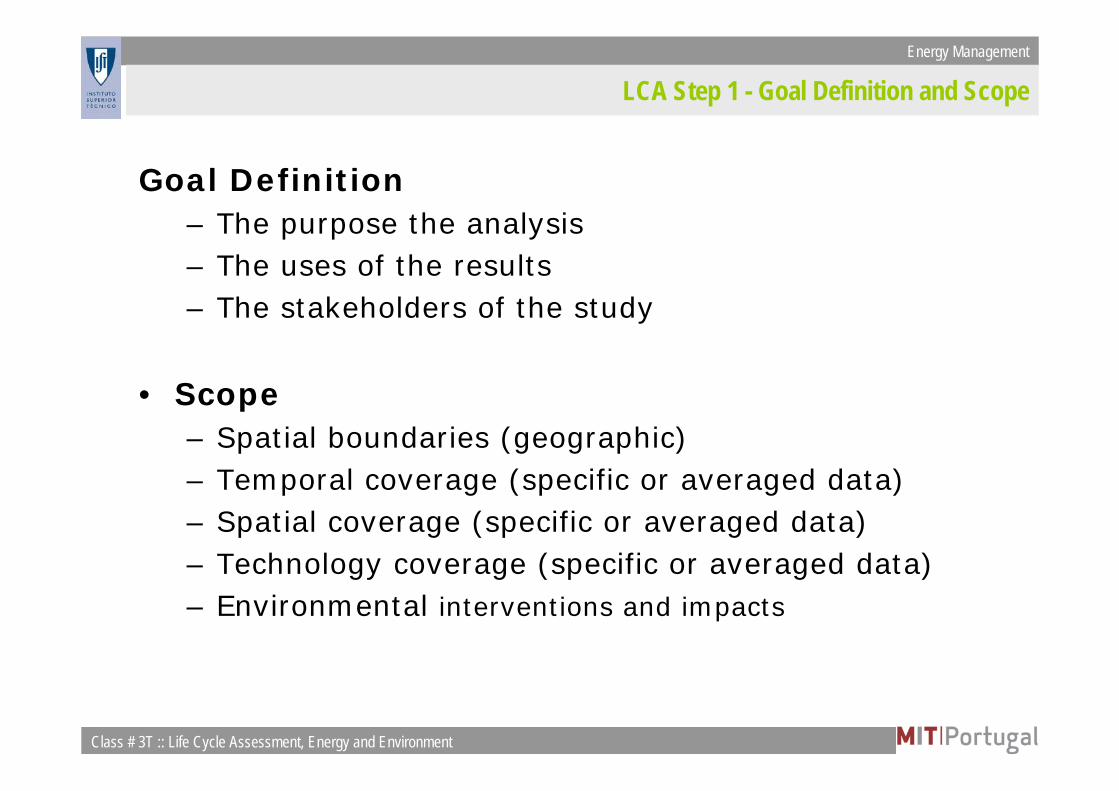
LCA Step 1 - Goal Definition and Scope
Goal Definition – The purpose the analysis– The uses of the results– The stakeholders of the study
• Scope– Spatial boundaries (geographic) – Temporal coverage (specific or averaged data)– Spatial coverage (specific or averaged data)– Technology coverage (specific or averaged data)– Environmental interventions and impacts

Energy Management
Class # 3T :: Life Cycle Assessment, Energy and Environment Slide 15 of 53
LCA Step 2 - Inventory Analysis
• Step 2 - Inventory Analysis– Determine inputs and outputs of all life-cycle
(material and energy)– Process tree or flow-chart classifying the
events in a product’s life-cycle– Collect relevant data for each event (emissions
produced and resources used)– Material and energy balance(s) for each
process stage

Energy Management
Class # 3T :: Life Cycle Assessment, Energy and Environment Slide 16 of 53
• The inputs and outputs of all life-cycle processes have to be determined in terms of material and energy.
• Produce a process tree or a flow-chart classifying the events in a product’s life-cycle which are to be considered in the LCA, plus their interrelations.
• Next, start collecting the relevant data for each event: the emissions from each process and the resources (back to raw materials) used.
• Establish (correct) material and energy balance(s) for each process stage and event.
Inventory analysis stages

Energy Management
Class # 3T :: Life Cycle Assessment, Energy and Environment Slide 17 of 53
Functional Unit
• The functional unitfunctional unit describes the primary function(s) fulfilled by a (product) system, and indicates how much of this function is to be considered in the intended LCA study.
• It will be used as a basis for selecting one or more alternative (product) systems that can provide these function(s). The functional unit enables different systems to be treated as functionally equivalent and allows reference flows to be determined for each of them.
• Having defined the functional unit, the amount of product which is necessary to fulfill the function shall be quantified. The result of this quantification is the reference flowreference flow.

Energy Management
Class # 2 :: Life Cycle Assessment, Energy and Environment Slide 18 of 53
Internet resources for LCA:Internet resources for LCA:
http://www.lcacenter.org/ (American Center for LCA)http://www.epa.gov/nrmrl/lcaccess/index.html (EPA website on LCA)http://www.nrel.gov/lci/ (US LCI Database)http://www.uneptie.org/pc/sustain/lcinitiative/ (UNEP/SETAC life cycle initiative)http://lca.jrc.ec.europa.eu/lcainfohub/index.vm EU website on LCA & LCI database)http://www.ecoinvent.ch (Swiss centre for LCI data)http://www.netzwerk-lebenszyklusdaten.de (German LCA network)http://www.pre.nl/ (Pre: SimaPro, downloads available)
Eco-indicator 95 reportsEco-Indicator 99 reports

Energy Management
Class # 2 :: Life Cycle Assessment, Energy and Environment Slide 19 of 53
Eco-Indicator 95
• The evaluation method for calculating the Eco-Indicator 95 strongly focuses on the effects of emissions on the ecosystem.
• For the valuation, the distance to target principle is used, but the targets are based on scientific data on environmental damage andnot on policy statements.
• The targets values are related to three types of environmental damage:– deterioration of ecosystems (a target level has been chosen at
which “only” 5% ecosystem degradation will still occur over several decades)
– deterioration of human health (this refers in particular to winter and summer smog and the acceptable level set is that smog periods should hardly ever occur again)
– human deaths (the level chosen as acceptable is 1 fatality per million inhabitants per year)

Energy Management
Class # 2 :: Life Cycle Assessment, Energy and Environment Slide 20 of 53
Eco-Indicator 95
Effect
COSO
Pb
Greenhouse effect
Ozone layer depl.
Eutrophication
Winter smog
CFC
Health
Fatalities
Ecosystem
Impact
Heavy metals
Pesticides
Carcinogenics
Summer smog
impairment
impairment
Acidification
Valuation
Subjective
assessment
Damage
damage
PAH
DDTVOC
NO
Dust
Cd
P
Eco-indicatorvalue
Result
2
2
x
Energy Management
Class # 2 :: Life Cycle Assessment, Energy and Environment Slide 21 of 53
Eco-Indicator 95
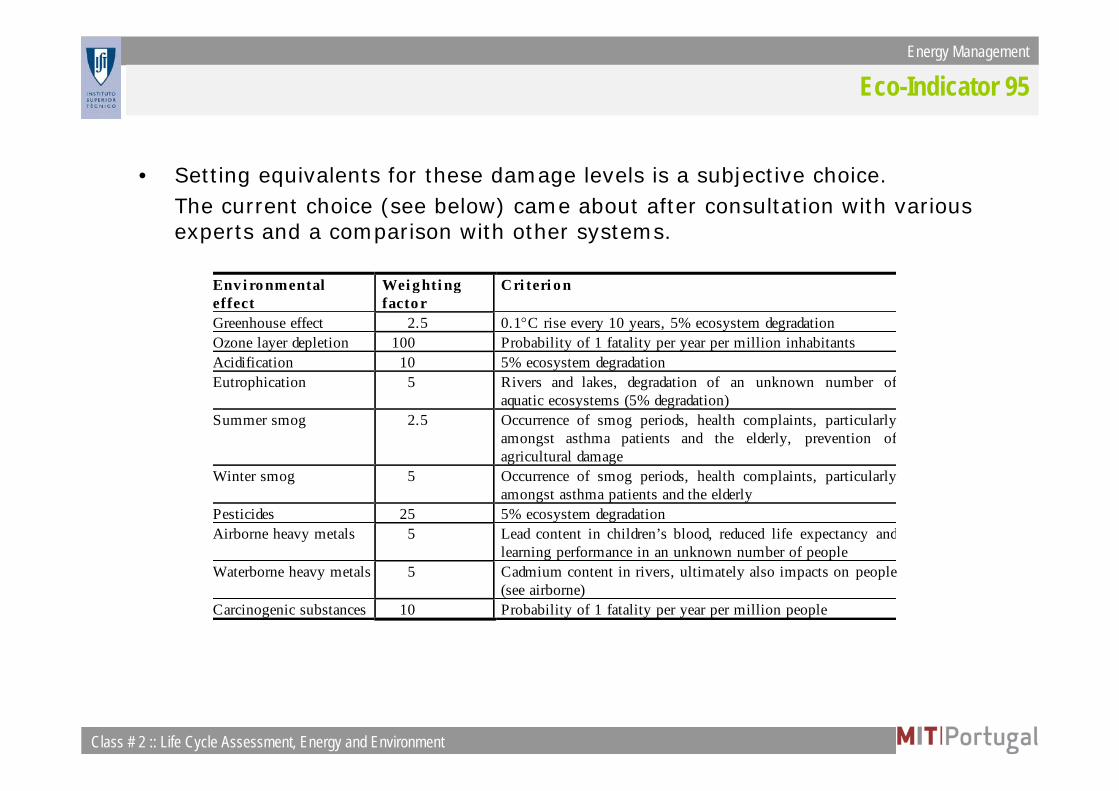
• Setting equivalents for these damage levels is a subjective choice. The current choice (see below) came about after consultation with various experts and a comparison with other systems.
Env i ro nmentaleffect
Wei g hti ngfacto r
Cri teri o n
Greenhouse effect 2.5 0.1°C rise every 10 years, 5% ecosystem degradationOzone layer depletion 100 Probability of 1 fatality per year per million inhabitantsAcidification 10 5% ecosystem degradationEutrophication 5 Rivers and lakes, degradation of an unknown number of
aquatic ecosystems (5% degradation)Summer smog 2.5 Occurrence of smog periods, health complaints, particularly
amongst asthma patients and the elderly, prevention ofagricultural damage
Winter smog 5 Occurrence of smog periods, health complaints, particularlyamongst asthma patients and the elderly
Pesticides 25 5% ecosystem degradationAirborne heavy metals 5 Lead content in children’s blood, reduced life expectancy and
learning performance in an unknown number of peopleWaterborne heavy metals 5 Cadmium content in rivers, ultimately also impacts on people
(see airborne)Carcinogenic substances 10 Probability of 1 fatality per year per million people

Energy Management
Class # 3T :: Life Cycle Assessment, Energy and Environment Slide 22 of 53
Efeito de estufa kg CO2 equivalente Camada de ozono KgCFC11 equivalenteCFC-13 13000 HALON-1301 16CFC (hard) 7100 HALON-2402 7CFC-12 7100 HALON-1211 4CFC-114 7000 HALON-1201 1,4CFC-115 7000 HALON-1202 1,25CFC-116 6200 Tetraclorometano 1,08HALON-1211 4900 CFC-113 1,07HALON-1301 4900 CFC (hard) 1CFC-113 4500 CFC-11 1CFC-14 4500 CFC-12 1HFC-143a 3800 CFC-13 1CFC-11 3400 CFC-114 0,8HFC-125 3400 methyl bromide 0,6HCFC-142b 1800 CFC-115 0,5CFC (soft) 1600 HALON-2401 0,25HCFC-22 1600 HALON-2311 0,14Tetraclorometano 1300 Tricloroetano 0,12HFC-134a 1200 HCFC-141b 0,11HCFC-141b 580 HCFC-142b 0,065HCFC-124 440 CFC (soft) 0,055N2O 270 HCFC-22 0,055HFC-152a 150 HCFC-225cb 0,0331,1,1-trichloroethane 100 HCFC-225ca 0,025HCFC-123 90 HCFC-124 0,022Triclorometano 25 HCFC-123 0,02Diclorometano 15Metano 11CO2 1
LCA- Characterization

Energy Management
Class # 3T :: Life Cycle Assessment, Energy and Environment Slide 23 of 53
Problem vs. Damage oriented approaches
• In the problem-oriented approaches, flows are classified into environmental themes to which they contribute. Themes covered in most Life Cycle Assessment (LCA) studies are: Greenhouse effect (or climate change), Natural resource depletion, Stratospheric ozone depletion, Acidification , Photochemical ozone creation, Eutrophication , Human toxicity and Aquatic toxicity. These methods aim at simplifying the complexity of hundreds of flows into a few environmental areas of interest. The EDIP or CML 2000 methods are examples of problem-oriented methods.
• The damage-oriented methods also start by classifying a system's flows into various environmental themes, but model each environmental theme's damage to human health, ecosystem health or damage to resources. For example, acidification - often related to acid rain - may cause damage to ecosystems, but also to buildings or monuments. In essence, this method aims to answer the question: Why should we worry about climate change or ozone depletion? EcoIndicator 99 is an example of a damage-oriented method.
Energy Management
Class # 3T :: Life Cycle Assessment, Energy and Environment Slide 24 of 53
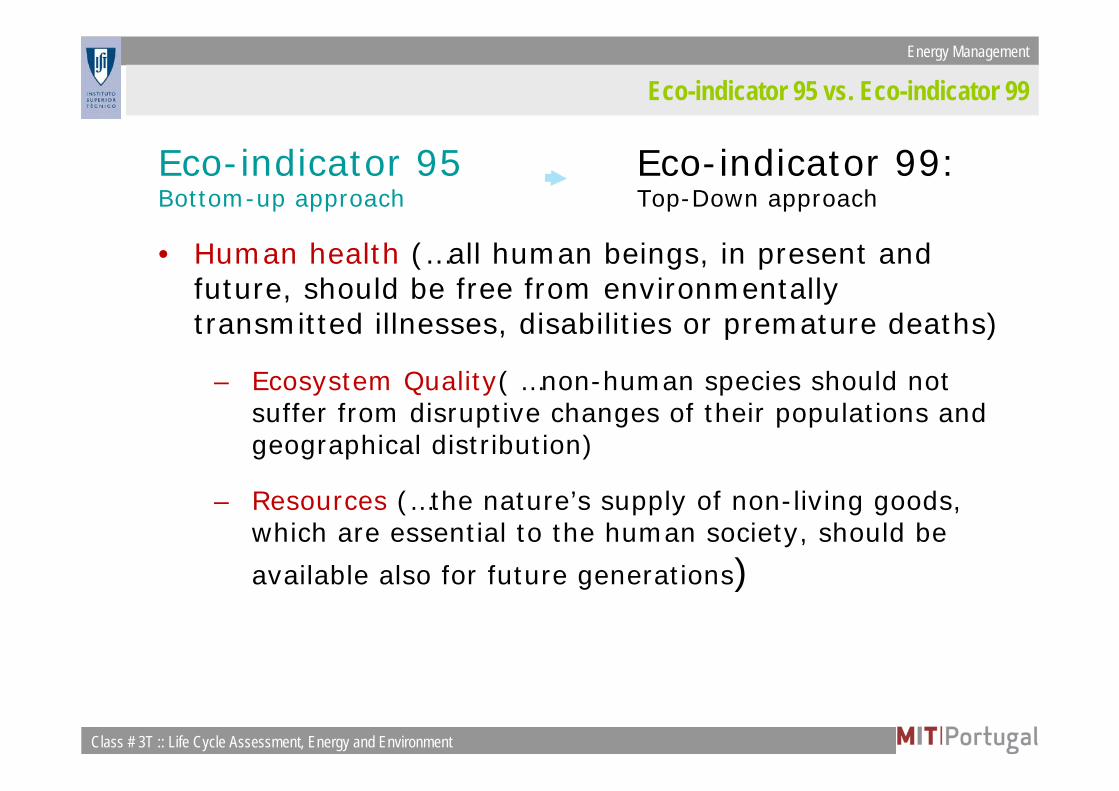
Eco-indicator 95 Eco-indicator 99: Bottom-up approach Top-Down approach
• Human health (…all human beings, in present and future, should be free from environmentally transmitted illnesses, disabilities or premature deaths)
– Ecosystem Quality( …non-human species should not suffer from disruptive changes of their populations and geographical distribution)
– Resources (…the nature’s supply of non-living goods, which are essential to the human society, should be
available also for future generations)
Eco-indicator 95 vs. Eco-indicator 99
Energy Management
Class # 3T :: Life Cycle Assessment, Energy and Environment Slide 25 of 53
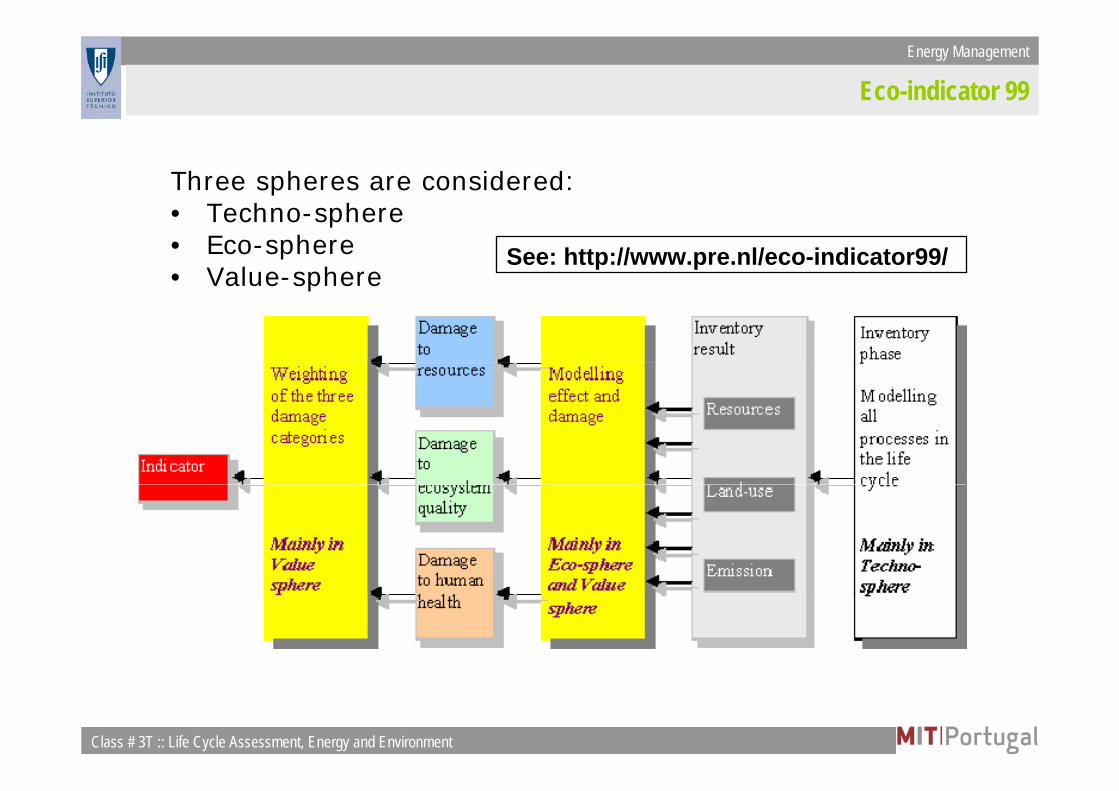
Eco-indicator 99
Three spheres are considered:• Techno-sphere• Eco-sphere• Value-sphere
See: http://www.pre.nl/eco-indicator99/

Energy Management
Class # 3T :: Life Cycle Assessment, Energy and Environment Slide 26 of 53
In the model for Human Health four sub-steps are used:
a) Fate analysis, linking an emission (expressed as mass) to a
temporary change in concentration.
b) Exposure analysis, linking this temporary concentration to a
dose.
c) Effect analysis, linking the dose to a number of health effects,
like the number and types of cancers, and respiratory effects.
d) Damage analysis, links health effects to the number of years
lived disabled (YLD) and Years of Life Lost (YLL).
Human HealthDALY (Disability Adjusted Life Years)
Energy Management
Class # 3T :: Life Cycle Assessment, Energy and Environment Slide 27 of 53
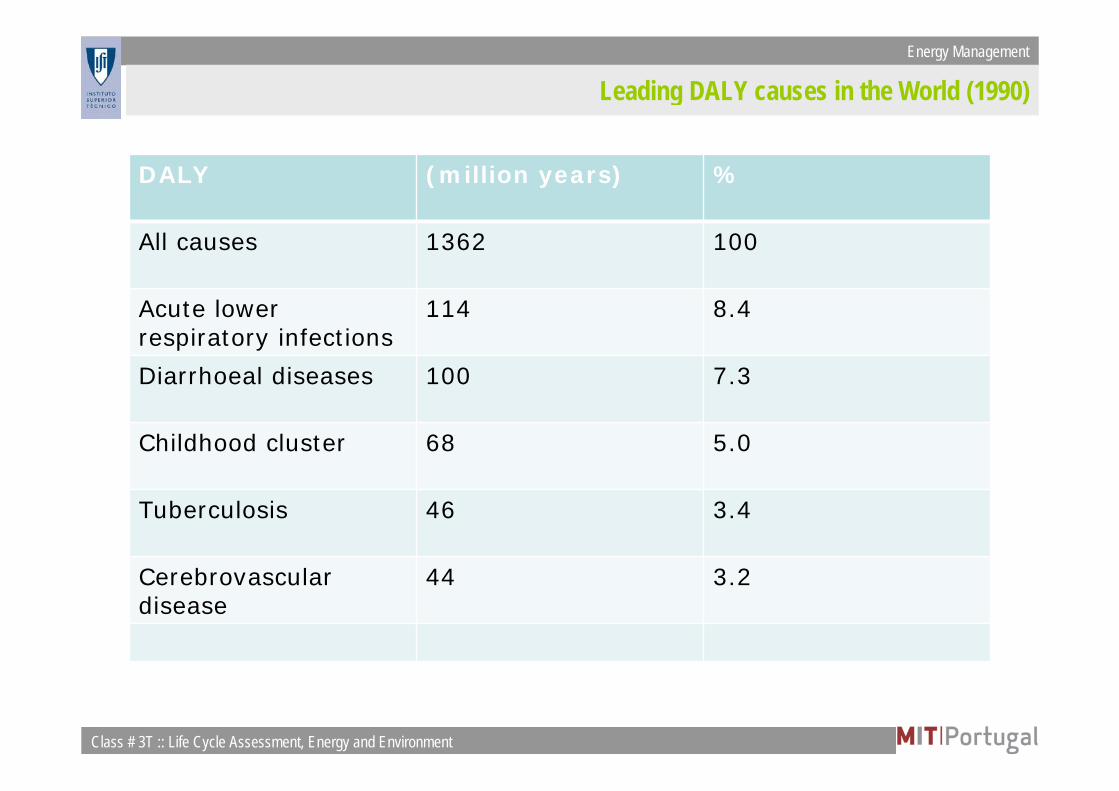
Leading DALY causes in the World (1990)
DALY (million years) %
All causes 1362 100
Acute lower respiratory infections
114 8.4
Diarrhoeal diseases 100 7.3
Childhood cluster 68 5.0
Tuberculosis 46 3.4
Cerebrovasculardisease
44 3.2
Energy Management
Class # 3T :: Life Cycle Assessment, Energy and Environment Slide 28 of 53
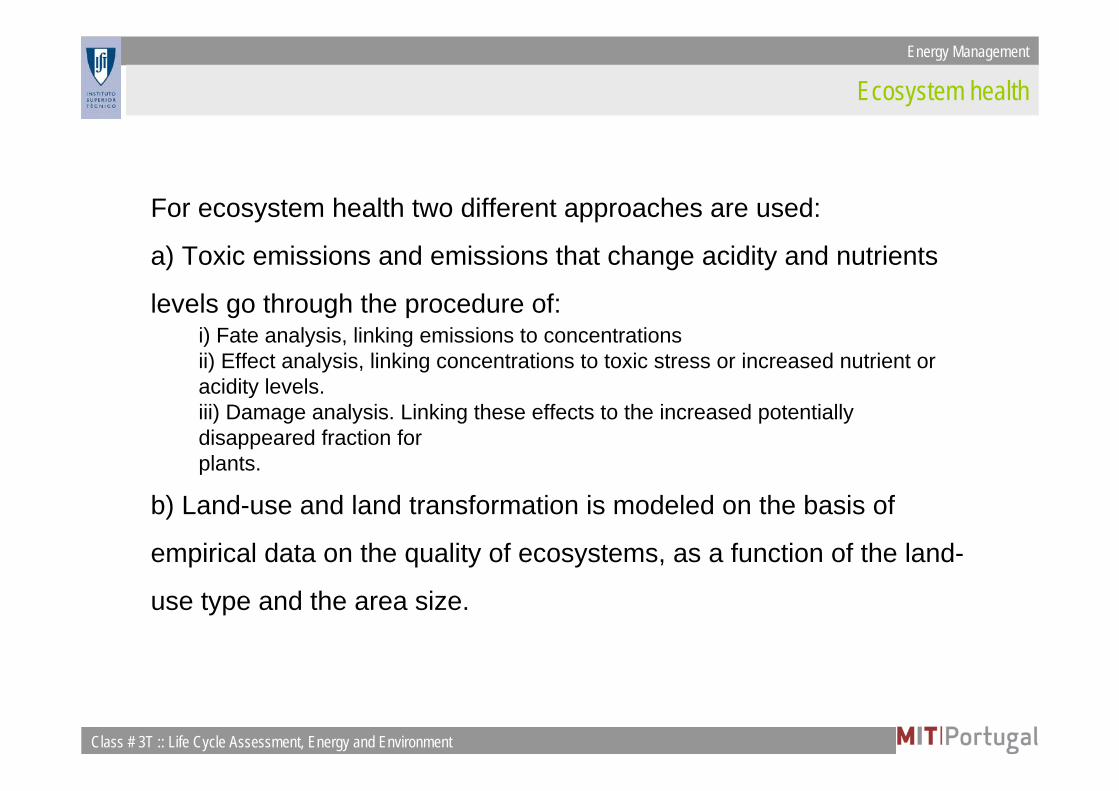
For ecosystem health two different approaches are used:
a) Toxic emissions and emissions that change acidity and nutrients
levels go through the procedure of:i) Fate analysis, linking emissions to concentrationsii) Effect analysis, linking concentrations to toxic stress or increased nutrient or acidity levels.iii) Damage analysis. Linking these effects to the increased potentially disappeared fraction forplants.
b) Land-use and land transformation is modeled on the basis of
empirical data on the quality of ecosystems, as a function of the land-
use type and the area size.
Ecosystem health

Energy Management
Class # 3T :: Life Cycle Assessment, Energy and Environment Slide 29 of 53
PDF*area*time [m2.yr] – Percentage of species that disappeared from a certain location for a given time
• Main contributions by:– Toxic stress, PAF – Potentially Affected Fraction, % of
species exposed to damaging concentrations )– Acidification and Eutrofication)(POO – Probability of
Occurrence, of a plant in a given place, PDF = 1-POO)
– Soil Use (PDF – Potentially Disappeared Fraction)
Ecosystems health
Energy Management
Class # 3T :: Life Cycle Assessment, Energy and Environment Slide 30 of 53
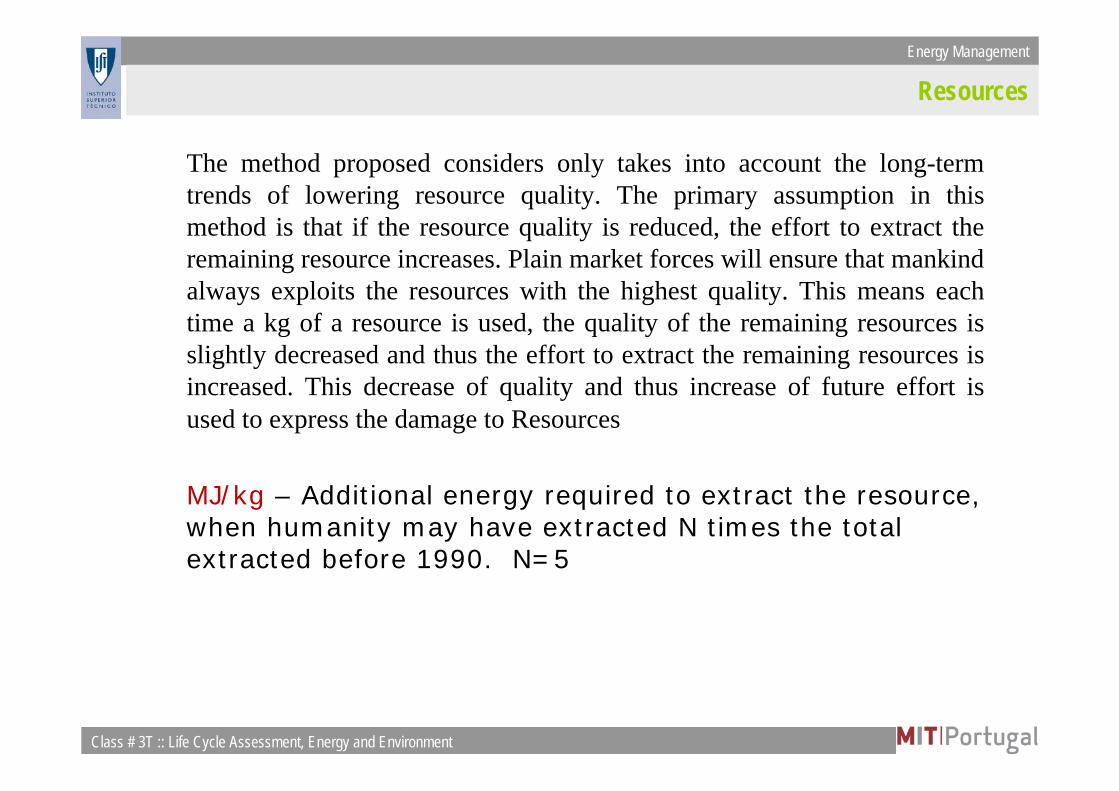
The method proposed considers only takes into account the long-term trends of lowering resource quality. The primary assumption in this method is that if the resource quality is reduced, the effort to extract the remaining resource increases. Plain market forces will ensure that mankind always exploits the resources with the highest quality. This means each time a kg of a resource is used, the quality of the remaining resources is slightly decreased and thus the effort to extract the remaining resources is increased. This decrease of quality and thus increase of future effort is used to express the damage to Resources
MJ/kg – Additional energy required to extract the resource, when humanity may have extracted N times the total extracted before 1990. N=5
Resources

Energy Management
Class # 3T :: Life Cycle Assessment, Energy and Environment Slide 31 of 5331
Environmental indicators framework
• Enhance the capability of the decision making process• Integrating physical and economical indicators, environmental impacts and policies
with causality-effect relations
Requires appropriate Indicators Framework

Energy Management
Class # 2 :: Life Cycle Assessment, Energy and Environment Slide 32 of 5332
Responses
Impact
StatePressures
Drivers
Eco-efficiency indicators andemissions factors
Pathways and dispersion models
Dose response indicators and relationships
Risk assessment costs and benefits of action/in action
Effectiveness of responses
Effectiveness of responses
Effectiveness of responses
Effectiveness of responses
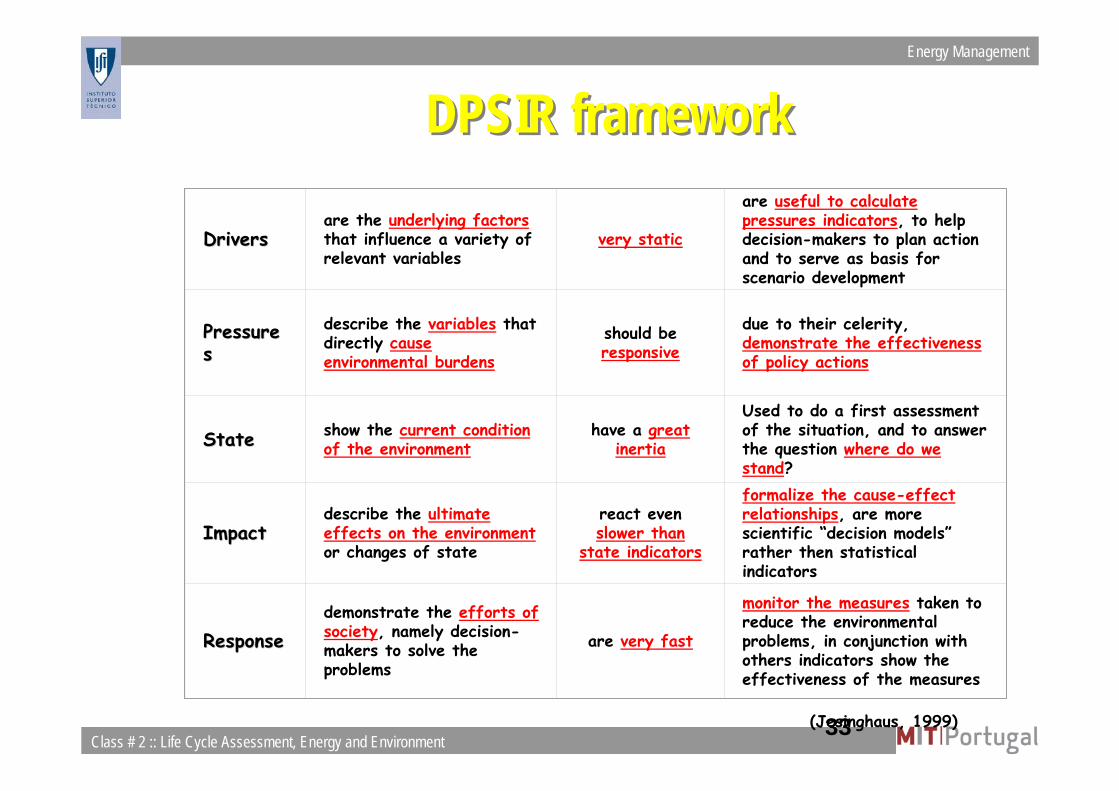
DPSIR frameworkDPSIR framework
Energy Management
Class # 2 :: Life Cycle Assessment, Energy and Environment Slide 33 of 5333
DriversDriversare the underlying factorsthat influence a variety of relevant variables
very static
are useful to calculate pressures indicators, to help decision-makers to plan action and to serve as basis for scenario development
PressurePressuress
describe the variables that directly cause environmental burdens
should be responsive
due to their celerity, demonstrate the effectiveness of policy actions
StateState show the current condition of the environment
have a great inertia
Used to do a first assessment of the situation, and to answer the question where do we stand?
ImpactImpactdescribe the ultimate effects on the environmentor changes of state
react even slower than
state indicators
formalize the cause-effect relationships, are more scientific “decision models”rather then statistical indicators
ResponseResponsedemonstrate the efforts of society, namely decision-makers to solve the problems
are very fast
monitor the measures taken to reduce the environmental problems, in conjunction with others indicators show the effectiveness of the measures
DPSIR frameworkDPSIR framework
(Jesinghaus, 1999)
Energy Management
Class # 2 :: Life Cycle Assessment, Energy and Environment Slide 34 of 5334
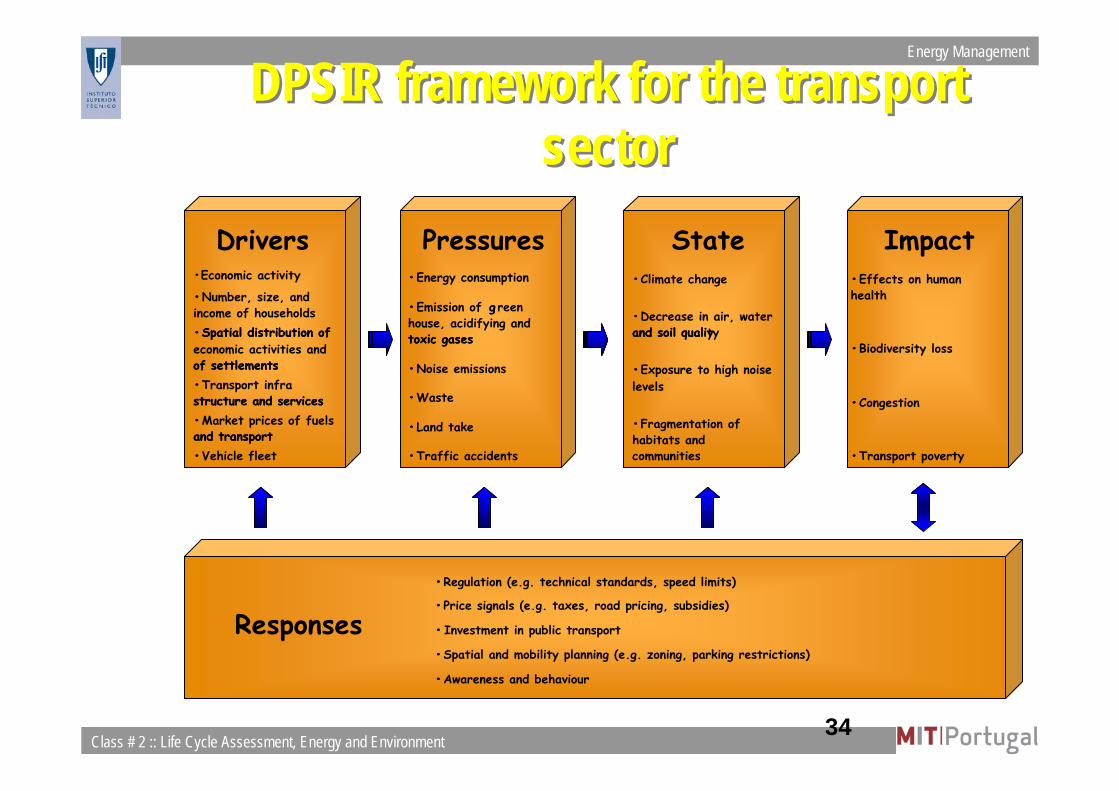
DPSIR framework for the transport sector
DPSIR framework for the transport sector
Drivers Pressures State Impact•Energy consumption
•Emission of g reenhouse, acidifying and toxic gases
•Noise emissions
•Waste
•Land take
•Traffic accidents
•Climate change
•Decrease in air, water and soil quality
•Exposure to high noise levels
•Fragmentation of habitats and communities
•Effects on human health
•Biodiversity loss
•Congestion
•Transport poverty
Responses
•Regulation (e.g. technical standards, speed limits)
•Price signals (e.g. taxes, road pricing, subsidies)
• Investment in public transport
•Spatial and mobility planning (e.g. zoning, parking restrictions)
•Awareness and behaviour
•
•Number, size, and income of households•Spatial distribution of economic activities and of settlements•Transport infrastructure and services•Market prices of fuels and transport•Vehicle fleet
•
• g
toxic gases
•
•
•
•
•
•and soil qualiy
•
•
•
•
•
•
•
•
•
•
•
•
•Spatial distribution of
of settlements•structure and services•and transport•
Economic activity