energy intakes of female collegiate athletes by gena suela
TRANSCRIPT
ENERGY INTAKES OF FEMALE COLLEGIATE
ATHLETES
By
GENA SUELA CRENSHAW
Bachelor of Science
Oklahoma State University
Stillwater, Oklahoma
2008
Submitted to the Faculty of the Graduate College of the
Oklahoma State University in partial fulfillment of the requirements for
the Degree of MASTER OF SCIENCE
May 2009
ii
ENERGY INTAKES AMONG FEMALE COLLEGIATE
ATHLETES
Thesis Approved:
Dr. Lenka Shriver
Thesis Adviser
Dr. Nancy Betts
Dr. Doug Smith
Dr. A. Gordon Emslie
Dean of the Graduate College
iii
TABLE OF CONTENTS
Chapter Page I. INTRODUCTION ......................................................................................................1 Hypothesis of the Study ...........................................................................................4 Limitations ...............................................................................................................4 Definitions of Terms and Equations Used ...............................................................5 Abbreviations ...........................................................................................................7 II. REVIEW OF LITERATURE Definition of Energy Balance and Athlete’s Energy Intake……………………….1 Energy Intake, Macronutrients, Micronutrients and Optimal Intake .......................3 Energy Availability ..................................................................................................9 Female Athlete Triad, Eating Disorders, and Eating Attitudes .............................10 Association Between Body Composition and Energy Intakes ..............................15 Assessment of Energy Consumption .....................................................................19 Estimating Overall Energy Requirements for Athletes .........................................21 Resting Metabolic Rate ..........................................................................................21 Comparison of Harris and Benedict and Cunningham ..........................................25 Physical Activity Factors Used to Estimate Energy Requirements .......................26 Summary ................................................................................................................28 III. METHODOLOGY Research Design and Subject Selection .................................................................30 Study Procedures ...................................................................................................31 Anthropometric Data .............................................................................................31 Resting Metabolic Rate ..........................................................................................32 Physical Activity Level ..........................................................................................33 24-Hour Recall & 3-Day Food Records ................................................................34 Eating Attitude Test ...............................................................................................35 Statistical Analysis .................................................................................................36 IV. FINDINGS .............................................................................................................38 Demographics ........................................................................................................38 Body Composition .................................................................................................39 Resting Metabolic Rate, Energy Requirements, & Energy Intakes .......................40 Subjects That Met Their Energy Requirements Versus Subjects That Did Not ....43 Eating Attitude Test ...............................................................................................47 V. DISCUSSION ........................................................................................................50 Limitations .............................................................................................................56 Conclusions ............................................................................................................58 Implications for Practice ........................................................................................59 Implications for Future Research ...........................................................................60
iv
REFERENCES ............................................................................................................62 APPENDIX ..................................................................................................................70 APPENDIX A: Informed Consent for Participants ...............................................70 APPENDIX B: Approval Letter from OSU...........................................................74 APPENDIX C: Eating Attitudes Test ....................................................................75 APPENDIX D: Nutrition Questionnaire ................................................................76 VITA… ………………………………………………………………………………81

v
LIST OF TABLES
Table Page 3.1 Equations Used to Estimate RMR of Female Athletes ........................................33 4.1 Descriptive Characteristics of Female Athletes ...................................................38 4.2 Body Composition of the Female Athletes Participating in the Study ................39 4.3 Comparison of BMI and Percent Body Fat..........................................................40 4.4 Basal Metabolic Rate of Female Athletes ............................................................41 4.5 Resting Metabolic Rate of Female Athletes with Added Activity Factor ...........42 4.6 Questions with the Highest Frequency ................................................................48
vi
LIST OF FIGURES
Figure Page 4.1 Recommended Energy Requirements Compared to Reported Energy Intakes ...43 4.2 Comparison of Subjects who Met and Did Not Meet Energy Requirements ......44 4.3 Comparison of Body Composition ......................................................................45 4.4 Comparison of Body Fat .....................................................................................45 4.5 Comparison of RMR Between Subjects That Met Their Energy Requirements and Subjects that Did Not Meet Their Energy Requirements ..............................47 4.6 Eating Attitudes Test............................................................................................48
1
CHAPTER I
INTRODUCTION
Research interest in the female athlete has increased over the last decade due to
the increased number of competitive events available to females. Female participation is
becoming equal to their male counterparts; therefore the desire to understand the
dynamics behind what factors improve performance of female athletes is increasing.
It is not uncommon to trace the deterioration of an athlete’s performance to poor
nutrition (Economos, Bortz, & Nelson, 1993). Adequate energy intakes of athletes are
important and may significantly influence athletic performance both physically and
mentally (Economos, Bortz, & Nelson, 1993). Previous research has suggested that
female athletes often restrict their energy intake despite having high energy demands
during both training and competition (Manore, Kam, & Loucks, 2007; Ziegler &
Jonnalagadda, 2006; Manore, 2002; Edwards, Lindeman, Mikesky, & Stager, 1993).
Female athletes are vulnerable to low energy intakes for numerous reasons, including
unrealistic body image, social pressure to look thinner, and a drive to increase
performance by losing weight (Kerr, Berman, & Jane De Souza, 2006; Kirk, Singh, &
Getz, 2001; Krane, Stiles-Shipley, Waldron, & Michalenok, 2001). The health and
nutritional status of female athletes may suffer as a consequence of inadequate energy
consumption over an extended period of time because low energy intakes are associated
with serious health problems such as low bone mineral density, amenorrhea, nutrient
2
deficiencies, and disordered eating (Manore, Kam, & Loucks, 2007; Deutz, Benardot,
Martin, & Cody, 1999). To date, only a few studies have evaluated energy intakes and
determined the prevalence of inadequate energy consumption among female collegiate
athletes. Given the importance of adequate energy intakes for health and optimum
performance, it is essential to determine whether female athletes consume a sufficient
amount of energy to support their training regimen and competition schedule.
In regards to assessing energy requirements, one of the challenges of
dietitians/nutritionists is to accurately determine an individual athletes’ overall daily
energy expenditure. Currently, nutrition professionals use a variety of prediction
equations to estimate the resting metabolic rate (RMR) of athletes, coupled with physical
activity factors to account for energy expenditure during exercise. Some of the most
commonly used tools for estimating the RMR are equations such as the Harris-Benedict
and Cunningham (Frankenfield, Muth, & Row, 1998; Thompson & Manore, 1996;
Cunningham, 1980). While these equations provide a quick estimate of an individual’s
daily RMR, the appropriateness and accuracy of their use is questionable, especially with
female athletes because equations were mostly derived using males and/or non-athletic
populations (Thompson & Manore, 1996).
The main purpose of this study was to evaluate energy intakes of a sample
of female collegiate athletes. Reported energy consumption of each athlete was compared
to their calculated energy requirements determined using measured RMR plus an
appropriate physical activity factor. The second purpose of the study was to determine
3
whether differences between actual RMR and estimated RMR, using the Harris-Benedict
and Cunningham equations, exist in this target population. The third purpose of the study
was to identify the relationship between an athletes’ energy intake and their body
composition, including lean body mass (LBM) and fat mass (FM). Finally, the
relationship between individual’s reported energy intake and score on the EAT-26 test
was explored.
4
Hypotheses of the Study:
Research hypothesis #1: Majority of the female athletes will consume significantly less
amount of calories compared to their estimated overall daily energy expenditure.
Research hypothesis #2: The RMR of the female athletes as measured by indirect
calorimetry will be significantly higher than the resting metabolic rate estimated by
Harris-Benedict and Cunningham equations.
Research hypothesis #3: There will be a significant positive relationship between energy
intake and lean body mass and a positive relationship between energy intakes and body
fat.
Research hypothesis #4: There will be a significant negative relationship between EAT-
26 score and reported energy intake.
Limitations
1. The sample size in this study was relatively small, with a total of 45 subjects. In
addition, only 23 subjects completed all the measurements, including RMR, 24-h
recall, and 3-day food record. This limits the degree to which the results can be
generalized to other female athlete populations.
5
2. RMR was not measured for some subjects due to the length of time it takes to
measure RMR in individuals. The RMR assessment takes approximately 20
minutes per subject and some of the subjects could not devote that much time due
to other training and academic obligations.
3. The sample used in the study was a convenience sample and thus the findings of
this study may not be generalized to other groups or populations of female
athletes. In addition, the sample consisted of female athletes from only three
sports.
Definitions of Terms and Equations Used
Basal Metabolic Rate- The lowest need of energy at rest in a postprandial state
under thermoneutral conditions. It is the energy used to run basic cell functions in
a large variety of organs and maintenance functions such as body temperature
(Weibel & Hoppeler, 2005).
Dual X-ray Absorptiometry- Technique that has become the clinical standard to
measure bone density which is based on the absorption of low-energy x-rays.
Also used to measure lean body mass (Visser et al, 1999 &; Brunton, Bayley, &
Atkinson, 1993).
Energy Balance- Dietary energy intake minus total energy expenditure (Loucks
2007).
6
Estimated Energy Requirements -Amount of dietary energy estimated to
maintain life and engage in physical activity (Nieman, 2007).
Food Record- (Also known as a food diary) is an example of a prospective,
quantitative method. The subject is required to record the daily amounts of all
individual foods and beverages. The recording of dietary intake is usually
conducted over a period of 3–14 days (Trabulsi & Schoeller, 2001).
Kilocalories- A unit of heat equal to 1000 calories–the heat required to raise the
temperature of 1 kg of H2O 1ºC (Taber’s Cyclopedic Medical Dictionary, 2005,
P.319).
Lean Body Mass– Primarily consists of protein, water, and includes smaller
amounts of minerals and glycogen. Skeletal muscles are the main component of
lean body mass. LBM is also known as the weight of the body minus the weight
of fat mass (Nieman, 2007; Sawyer, Hypes, & Brown, 2003).
Multiple Pass 24-Hour Recall - A dietary recall that consists of different stages.
First step, the interviewer asks the subject to recall all foods and beverages
consumed during the past 24 hours. Second step, the interviewer asks the subject
to explain details regarding responses in step one. This also helps the subjects
remember anything they left out in step one. Final step, the interviewer asks about
cooking methods used for food preparation. This helps the subjects recall any
other added ingredients (United States Department of Agriculture (USDA), 1998).
7
Resting Metabolic Rate- The energy expended by the body to maintain life and
normal body function, such as respiration and circulation (Nieman, 2007). In
other words, the calories burned at rest.
Abbreviations
ADA- American Dietetic Association
DEXA- Dual X-ray Absorptiometry
EAT-26- Eating Attitude Test
FAO/WHO/UNU – Food and Agriculture Organization of the United Nations, World Health Organization, and the United Nations University Kcals- Kilocalories LBM- Lean Body Mass
RMR- Resting Metabolic Rate
BMR- Basal Metabolic Rate
TEF- Thermic Effect of Food
1
CHAPTER II
REVIEW OF LITERATURE
Definition of Energy Balance and Athletes’ Energy Intake
The key to achieving energy balance is to obtain adequate energy intakes that
meet the needs of an individual’s resting metabolic rate (RMR), thermic effect of food
(TEF), and physical activity level (Jeukendrup & Gleeson, 2004). Energy intakes will
vary between individual athletes, types of sport, and between different seasons (Haskell,
2007). Thus, energy balance in athletes is achieved when the energy consumed meets the
energy cost of daily living including, exercise training and competition, building and
restoration of muscle tissue, menstrual function, additional energy related to illness or
psychological stress, or the amount of energy required to achieve weight maintenance
(Manore, 2002). Attaining energy balance is important for athletes in order to achieve
good nutritional status, maintain lean body mass (LBM), and optimize overall athletic
performance (Ziegler, 2001; Manore, Barr, & Butterfield, 2000). Energy intake is also a
major determinant of weight management, including weight loss, weight gain, and weight
maintenance (Westerterp-Plantenga, 2004). Thus, meeting daily energy expenditure
represents a major key to optimal weight and physical performance among athletes
(Manore, Barr, & Butterfield, 2000).
2
While some athletes are able to achieve energy balance on a regular basis, many
athletes fail to consume adequate energy to support the extra physiological and mental
cost of their training and competition schedules. It has been found that athletes (13.5%)
are more likely than non athletes (4.6%) to show signs of subclinical or clinical eating
disorders (Sundgot-Borgen, 2004). Although energy restricted diets are relatively
common among both women and men engaged in weight-restricted and aesthetic sports,
such as gymnastics, running, diving, and rowing (Ziegler, Nelson, Barrat-Fornell,
Fiveash, & Drewnowski, 2001; Bishop, Blannin, Walsh, Robson, & Gleeson, 1999),
female athletes have a higher tendency to restrict energy intake compared to male athletes
in the same sports (Ziegler & Jonnalagadda, 2006; Sundgot-Borgen & Torstveit, 2004
Manore, 2002; Mullinix, Jonnalagadda, Rosenbloom, Thompson, & Kickligher, 2003;
Ziegler, Nelson, Barratt-Fornell, Fiveash,& Drewnowski, 2001). Manore (2002) states
that female athletes are preoccupied with their body weight and shape, thus it is not
unusual for them to want to lose 5 to 10 pounds although they are often at a normal
weight or even under weight by all assessment standards. Mullinix and colleagues (2003)
indicate that female athletes from diverse sports can be sustaining high energy-
demanding training schedules with energy intakes as low as 45 kcal/kg of body
weight/day. Sundgot-Borgen (2004) conducted a study on the prevalence of eating
disorders in elite athletes and found that elite athletes, both male and female, had a higher
incidence of eating disorders compared to the general population. While both male and
female athletes make up a population with a high prevalence of eating disorders, female
3
athletes have a higher tendency to restrict energy intakes than their male counterparts
(Sundgot-Borgen & Torstveit, 2004).
Energy Intakes, Macronutrients, Micronutrients and Optimal Performance
Athletes should view their energy intakes as an important aspect of a training
program for adaption, performance improvements, and recovery (Burke, Kiens, Ivy,
2004). Adequate energy intake is essential for achieving good nutritional status and for
optimizing athletic performance (Ziegler, Nelson, Barrat-Fornell, Fiveash, &
Drewnowski, 2001; Economos, Bortz, & Nelson, 1993). Female athletes that practice
restrictive energy intake and do not maintain energy balance may lack adequate amounts
of macronutrients, as well as micronutrients, which can significantly influence
performance, recovery, and life-long health (Burke, Kiens, & Ivy, 2004). The two
macronutrients most important for providing the working muscle with fuel are
carbohydrates and fat. Protein, the third macronutrient, is more important in recovery and
repair of muscle tissue especially, after strenuous exercise. It is important to note that
benefits of these three macronutrients are interrelated. There have been many studies
done on specific macronutrients’ role in improved performance and increased energy;
however it is thought that the improvements are due to an overall increase in total daily
energy, not an increase in a specific macronutrient (Loucks, 2007; Horvath, Eagen, &
Ryer-Calvin, 2000; Pendergast, Leddy, & Venkatraman, 2000).
4
Current research suggests that carbohydrates become the main substrate for
energy as exercise intensity increases (Burke, Cox, Cummings, & Desbrow, 2001; Burke,
Kiens, & Ivy, 2004; Jeukendrup & Gleeson, 2004; Economos et al, 1999). This is
relevant to most athletes given the intensity, duration, and frequency of their training.
Current carbohydrate recommendations for athletes range from 5-10
grams/kilogram/body weight/day (Burke, Kiens, & Ivy, 2004; Burke, Cox, Cummings, &
Desbrow, 2001). The recommendations increase with energy expenditure and may
exceed 10 grams/kilogram/day for some athletes. Total daily carbohydrate intake may be
lower when athletes are not involved in training programs, such as during the off-season
(Burke, Kiens, & Ivy, 2004). In the Burke, Kiens, and Ivy (2004) study, total energy
intake increased when energy from carbohydrates increased; suggesting that the increases
in carbohydrates may not be the only contributing factor to increased performance and
decreased recovery time. Findings from Pitsiladis and Maughan (1999) also suggest that
moderate changes in diet composition during training do not affect the performance of
high intensity exercise in trained individuals when the total energy intake is adequate.
Once again supporting the idea that total energy intake may be the key to optimal
performance and recovery.
A recent study of the link between fat and injuries in female runners found that
females with lower fat diets had a higher rate of injuries (Gerlach, Burton, Dorn, Leddy,
& Horvath, 2008). The study concluded that the females with low fat diets also consumed
less energy overall and thus were at a higher risk for injuries. While conclusions about
5
the role of fat in exercise needs further research (Horvath, Eagen, Ryer-Calvin, &
Pendergast, 2000; Pendergast, Leddy, & Venkatraman, 2000; Horvath, Eagen, Fisher,
Leddy, & Pendergast, 2000), it is known that fat is the preferred substrate for muscles
during longer-lasting exercise because it provides 9 kilocalories/gram compared to only 4
kilocalories/gram that come from carbohydrates. Another advantage of fat as a substrate
during exercise is that this macronutrient can be stored without the presence of water,
unlike carbohydrates, which makes it a more efficient and lighter source of energy for the
muscle cells (Berning & Steen, 1998). Because of the characteristics of fat mentioned
above, the human body has a large fat storage capacity. An 80 kilogram-male can store
approximately 414, 976 kilojoules (KJ) of fat compared to 8,320 KJ of carbohydrate
(Berning & Steen, 1998). Research of low fat, medium fat, and high fat diets by athletes
has shown that athletes on the high fat diet (increased to 44% of fat from total energy
intake) had lower lactate levels after an endurance run, which may be interpreted as an
increase in performance (Horvath, Eagen, & Ryer-Calvin, 2000). However, as fat intake
of the athletes increased, so did their overall kilocalories and carbohydrate intake thus,
the increased performance in this and other studies is likely to be attributed to an overall
increase in energy intake rather than an increased intake of a specific macronutrient
(Horvath, Eagen, Fisher, Leddy, & Pendergast, 2000).
Adequate energy intakes of athletes are also essential in order to consume a
sufficient amount of protein, especially essential amino acids (Waterlow, 1986). Proteins
are important to many metabolic processes such as red blood cell synthesis, aerobic
6
enzyme synthesis, and myoglobin synthesis, all of which may be helpful in the recovery
process (Coleman, 2003). Recently, studies have focused on the effects of protein
consumption during exercise and for recovery purposes (Phillips, 2006; Burke, Kiens, &
Ivy, 2004). Common proteins that are broken down in exercise are the branched chain
amino acids (BCAA), specifically leucine, isoleucine, and valine. It is estimated that
when muscle glycogen stores are low, approximately 15% of energy used is provided by
protein (Coleman, 2003). Protein recommendations for athletes vary due to a variety of
factors such as intensity, duration, season, total energy consumed, and gender. Current
recommendations for protein include a variance between
1.2-1.8 grams/kg/day (Jeukendrup & Gleeson, 2004). Protein recommendations for
endurance athletes range from 1.2-1.4 grams/kg/day (American Dietetics Association,
2009; Fink, Burgoon, & Mikesky, 2009; Jeukendrup & Gleeson, 2004; Berning & Steen,
1998). Protein recommendations for strength athletes range from 1.6-1.7 grams/kg/day
(Jeukendrup & Gleeson, 2004). The Position of the American Dietetics Association,
Dietitians of Canada, and the American College of Sports Medicine (2009) also state
current protein recommendations for athletes ranging from 1.2-1.7 grams/kg/day.
Research shows that excess protein intake greater than 2 g/kg/day does not lead to
enhanced performance but can be harmful to health by increasing calcium loss,
increasing the risk of cardiovascular disease, and increasing dehydration (Fink, Burgoon,
& Mikesky, 2009; Berning & Steen, 1998). Because research studies often do not control
for confounding variables, the current recommendations for dietary protein are not
7
unified and often vary from one source to another. However, there is a clear link between
total energy intake and adequate protein intake that ultimately leads to optimal athletic
performance (Deutz, Benardot, Martin, & Cody, 1999).
Adequate energy intakes are also important for sufficient micronutrient consumption
that indirectly contributes to energy production by playing a crucial role in energy
metabolism as cofactors and coenzymes. Female athletes restricting energy may be
deficient in micronutrients which can be detrimental to their performance and long-term
health. Examples of these nutrients are niacin, riboflavin, vitamin B6, calcium, and iron
(Holschen, 2004; Mullinix, Jonnalagadda, Rosenbloom, Thompson, & Kickligher, 2003).
Riboflavin, niacin, and vitamin B6, in their coenzyme forms, play a vital role in the
metabolism of the macronutrients. Recommendations for these vitamins are based on
total energy requirement (riboflavin and niacin) and protein requirement for vitamin B6
(Manore, 2000). Riboflavin is essential for the production of the coenzymes flavin
mononucleotide (FMN) and flavin adenine dinucleotide (FAD). These coenzymes are
important in the metabolism of glucose, fatty acids, glycerol, and amino acids for energy
(Manore, 2000). Riboflavin is also important in converting vitamin B6 into its functional
coenzyme (Manore, 2000). The major function of vitamin B6 is the metabolism of
proteins and amino acids (Manore, 2000). The coenzyme forms of niacin serve as carriers
of reducing equivalents in glycolysis, pentose shunt, TCA cycle, and electron transport
chain (Lewis, 1997). The two active coenzymes are adenine dinucleotide (NAD) and
NAD phosphate (NADP) which are required for approximately 200 enzymes in
8
metabolic reactions following the formation of fatty acids and glycogen (Fink, Burgoon,
& Mikesky, 2009; Lewis, 1997). Physical training may increase the need for vitamins but
it is important to remember vitamins do not provide energy and the B vitamins are
required in proportion to calories or protein consumed and active people require more
calories and protein. Therefore, if a balanced diet is consumed there should not be a need
for an athlete to consume a vitamin supplement (Fink, Burgoon, & Mikesky, 2009;
Jeukendrup & Gleeson, 2004; Sawyer, Hypes, Brown, 2003; Coleman & Steen, 2000).
However athletes that are restricting energy intake (distance runners, gymnasts, female
athletes) are at risk for vitamin deficiencies (Coleman & Steen, 2000). Calcium and iron
are two other micronutrients (minerals) that athletes are at risk for developing a
deficiency, especially if following an energy restricted diet (Rodriguez, DiMarco, &
Langley, 2009; Fink, Burgoon, & Mikesky, 2009; Coleman & Steen, 2000; Jeukendrup &
Gleeson, 2004).
Mullinix and colleagues (2003) state that female athletes with diets low in energy
intake only obtain about 30% of their recommended amounts of calcium and iron.
Quintas and colleagues (2003) also found that calcium intakes are inadequate among
female athletes and that consumption of meat and drinks providing phosphorus contribute
to low calcium by disrupting the calcium/phosphorus ratio in the body. Calcium is
important for female athletes’ health because, in conjunction with weight bearing
exercise, it can decrease the risk of osteoporosis development (Ziegler & Jonnalagadda,
2006). Similarly, low iron stores are associated with a decrease in aerobic capacity and
9
approximately 80% of female athletes may be iron deficient (Holschen, 2004), which is a
major limitation to training and performance.
Energy Availability
Energy availability is defined as the amount of dietary energy remaining for all
other metabolic processes after exercise (Loucks, 2007). Low energy availability may
compromise normal physical and metabolic processes in the body, including oxygen
uptake (VO2), lactate metabolism, thermoregulation, and recovery (Burke, Kiens, & Ivy,
2004; Burrows & Bird, 2000). Female athletes, endurance runners, gymnasts, and
athletes in other weight-focused sports are especially at an increased risk for low energy
availability (Loucks, 2004; Hassapidou & Manstrantoni, 2001). A review of the
metabolic adaptations suggests that individuals’ resting metabolic rate (RMR) can
decrease during periods of low energy intakes (Sjodin et al, 1995; Waterlow, 1986).
Thus, female athletes that do not match energy intake with energy expenditure may
experience signs of adaptive thermogenesis, where the body can maintain core
temperature without adequate energy intake (Benardot, 2007; Dulloo & Samec, 2001).
Inadequate energy availability can also lead to low bone mass (ADA reports, 2005;
Quintas, Ortega, Lopez-Sobaler, Garrido, & Requejo, 2003) because low energy levels
are unable to support appropriate bone turnover. Furthermore, female athletes may
experience not only a decrease in performance but also a disrupted menstrual cycle and a
10
decrease in LBM (Thompson 2007, Nichols, Sanbourn, & Essery, 2007; Punpilai,
Sriareporn, Ouyporn, Teraporn, & Sombut, 2005; Estok & Rudy, 1996).
Female Athlete Triad, Eating Disorders, and Eating Attitudes
Low energy intakes, and corresponding low energy availability, among female
athletes may often indicate a potential threat for eating disorders which, along with
osteoporosis and amenorrhea, represent the three components of Female Athlete Triad
(FAT) (Thompson, 2007). The FAT is commonly associated with female athletes that
restrict energy intakes and do not maintain energy balance on a regular basis. The
components of the FAT are closely related (Manore, Kam, & Loucks, 2007). The FAT
was formally defined in the summer of 1992 due to the growing concern for female
athlete’s health status (Morgenthal, 2002). The FAT is not limited to elite athletes and is
prevalent in other physically active women and girls (Morgentahal, 2002). Females that
participate in sports where low body weight or appearance is emphasized are more likely
to experience the FAT and/or symptoms of the triad (Manore, Kam, & Loucks, 2007).
Disordered eating and restricting energy intake is reported more frequently in female
athletes than in non athletes (Morgenthal, 2002). Sundgot-Borgen and Torstveit (2008)
found that 13.5% of athletes compared to 4.6% of non-athlete controls had sub clinical or
clinical eating disorders. Disordered eating can be defined as restrictive dieting, bingeing,
purging, changing eating patterns for personal appearance, or in preparation for athletic
11
competition (Milligan & Pritchard, 2006). In fact, Jeukendrup and Gleeson (2004) state
that female athletes are 10 times more at risk to have or develop an eating disorder
compared to male athletes. Milligan and Pritchard (2006) state that females are more
likely to develop eating disorders than males by a 9:1 ratio. Sundog-Borgen and Torstveit
(2008) also found that the occurrence of disordered eating among female athletes in
aesthetic sports was 42%, endurance sports 24%, and ball game sports 16%. Johnson,
Powers and Dick (1999) found that out of 1,445 college athletes, 9% of female athletes
needed treatment for their eating disorders, and 58% were at high risk for developing
eating disorder behaviors.
The two most common eating disorders in female athletes include anorexia
nervosa and bulimia (Estok & Rudy, 1996). Anorexia nervosa is characterized by
maintaining a body weight less than 15% of normal weight and height for age. Bulimia
nervosa is characterized by binging followed by vomiting, laxative use, or fasting
(Milligan & Pritchard, 2006). Eating disorders such as anorexia among females often lead
to amenorrhea, which is defined as the absence of three to six successive menstrual
cycles (Thompson, 2007). The better known long-term effects of low energy intakes in
female athletes are menstrual irregularities, amenorrhea, and infertility (Estok & Rudy,
1996). Within the FAT context, the loss of menstrual function can also be termed as
athletically induced amenorrhea (Edwards, Lindeman, Mikesky, & Stager, 1993; Manore,
2002). One of the detrimental side effects of amenorrhea, or athletically induced
amenorrhea, is bone loss. Williams and colleagues (2002) found that six to twelve
12
months without menstruation can lead to bone loss. Research suggests that amenorrheic
athletes have 10-25% lower bone mineral density at the lumbar spine versus the
eumenorrheic athlete (Nichols, Sanbourn, & Essery, 2007). The lumbar spine is just one
example showing that amenorrheic athletes are at an increased risk for stress fractures,
especially when compared to eumenorrheic athletes (Manore, Kam, & Loucks, 2007;
Burrows & Bird, 2000; Jeukendrup & Gleeson, 2004; Cook et al, 1987). A long term
effect of amenorrhea and bone loss is osteoporosis. Osteoporosis is a premature loss of
bone quality and quantity and can become a problem if low energy intakes are maintained
for a prolonged period of time. It is important to recognize that one of the benefits of
exercise is increased bone density (Nochols, Sanbourn, & Essery, 2007; Jeukendrup &
Gleeson, 2004). However, disordered eating often does not allow for proper mineral and
bone reabsorption, as would exercise with proper energy balance. While the FAT consists
of three conditions, it is apparent that all three components are influenced by dietary
energy intakes and thus energy balance.
Being an athlete is not the only factor contributing to the increased risk of
disordered eating and FAT among female athletes. The social pressures and ideal body
images that exist in the Western society likely contribute to disordered eating among
females due to the emphasis on thinness and beauty (Kirk et al, 2001). Society
emphasizes a body size ideal to which female bodies are compared to, with thinness
being the main focus (Krane, 2001). Research suggests that 15-62% of college females
practice some kind of weight control behaviors (Kirk et al, 2001). Society as stated above
13
creates and perpetuates these often unobtainable images of how the female body should
appear, resulting in the manifestation of eating disorders much earlier in life than many
may believe. This has been coined as social physique anxiety (SPA), which is a strong
concern about the way others perceive one’s body (Krane, 2001).
Self-presentation and the desire to impress others are strong in sports and
exercise, especially when related to disordered eating. Krane’s (2001) study showed
statistical evidence for a stronger drive for thinness in female athletes compared to female
non athletes. Society may not be the only factor affecting female athlete’s eating habits.
Certainly, personality traits such as low self-esteem and being overly self-critical may
contribute to disordered eating (Jeukendrup & Gleeson, 2004). Despite the prevalence of
obesity in the US (2/3 of the adult population is overweight or obese), the female athlete
strives for the “ideal” body composition and weight (Weight Control Information
Network, accessed 2006).
Research suggests that social pressures, self-presentation, beliefs, and eating
attitudes can all be linked to eating disorders (Jeukendrup & Gleeson, 2004; Krane, 2001;
Kirk et al, 2001). Self esteem and body dissatisfaction are predictors for negative eating
attitudes in both females and males (Milligan & Pritchard, 2006). Smith and Petrie
(2008) state that up to 20% of female athletes experience sub clinical or clinical
disordered eating. There are many different assessment tools for determining disordered
eating which include: eating disorder inventory (EDI), drive for thinness (DT), body
dissatisfaction (BS), Bulimia (BUL) subscales, body shape questionnaire (BSQ),
14
symptom checklist for eating disorders (EDI-SC), and the Diagnostic and Statistical
Manual of Mental Disorders (DSM-IV) (Beals & Manore, 2000). The goal of these tests
is to increase awareness of characteristics associated with subclinical eating disorders. An
eating attitude test (EAT) is another test used to gather information and assess risk for
disordered eating habits in individuals. Lane and colleagues (2004) states that “the EAT-
26 test has been used extensively in clinical psychology and now its use is spreading to
other areas, for example sports nutrition”. EAT-26 was validated against the EAT-40,
restrained eating inventory (EI), and the EDI in 1986 by Berland, Thompson, and Linton.
The original version of the EAT-26 proved reliability (alph =0.90) and validity (r=0.87, p
< 0.001) (Garner & Garfinkel, 1979). Later, the abbreviated version of the EAT-26 which
correlates with the original (r=0.98) was validated by Garner and colleagues (1982). The
EAT-26 questionnaire records participant’s attitudes toward energy intake in three
different areas: dieting behavior, oral control, and bulimia nervosa practices (Garner,
Olmsted, Bohr, & Garfinkel, 1982). Picard (1999) compared EAT-26 scores of athletes to
non athletes and found that athletes had higher scores then the non athletes, especially
high scoring were aesthetic athletes. Another study utilizing the EAT-26 method found
that 26% of their athletic population surveyed scored above the cutoff for being at risk for
a clinical eating disorder. Eighty-four percent of these athletes at risk for an eating
disorder were female (Milligan & Pritchard, 2006).
15
Association between Body Composition and Energy Intakes
Body composition is made up of structural components of the body, including
muscle, bone, and fat (Jeukendrup & Gleeson, 2004). Body composition is one of the best
indicators of physical fitness because unlike total weight it separates fat mass from lean
mass. Fat mass is simply the amount of fat one has, while lean body mass includes
muscle, bone, and all other components excluding fat. Assessment techniques used to
assess body composition include hydrodensitometry, or (underwater weighing), dual-
energy x-ray absorptiometry, air displacement plethysmography, skinfold measurements,
body mass index (BMI), and bioelectrical impedance. Typical assessment facilities are
not equipped to use all of the above methods. The most accessible of those listed are the
skinfold measurement, bioelectrical impedance, and BMI which are less invasive and less
expensive.
Body mass index (BMI) is also a commonly used body composition assessment
tool in large populations due to its easy accessibility; however, BMI does not serve as a
good indicator of body composition in the athletic population because the equation used
does not take LBM into account. The equation used for BMI is as follows:
weight (kg) / [height (m)] 2 (Jeukendrup & Gleeson, 2004). The BMI categories
established in previous research include the following categories: Below 18.5
underweight, 18.5 – 24.9 normal weight, 25-29.0 overweight, and 30 and above obese
16
(Jeukendrup & Gleeson, 2004). Although BMI is not a good indicator of body
composition in athletes due to its accessibility it still used as a general measurement.
Another tool for assessing body composition, dual-energy x-ray absorptiometry
(DEXA), has gained validity and is considered by many experts the gold standard for
measuring body composition (Fields & Goran, 2000; Brunton, Bayley, & Atkinson,
1993; Morrison et al, 1994). DEXA is becoming one of the most frequently used methods
to estimate body fat and lean body mass in the lab setting. The DEXA machine is a useful
tool when assessing LBM in athletes because it can provide estimates of fat per region of
the body (Schoeller, 2005). This is often a useful tool in order to compare LBM and fat
mass between different types of athletes. DEXA houses two x-ray beams working at
different frequencies inside one scanner (Visser et al, 1999; Brunton, Bayley, &
Atkinson, 1993). As this total body scanner travels over the body, it records data on bone
mineral content and soft tissue composition (Morrison et al, 1994). This scanner can pass
over the entire body and provides detailed results in approximately three to four minutes
(Visser et al, 1999). Studies show that DEXA may be a better predictor of FFM because
it does not seem to be affected by hydration status as does hydrodensitometry and
bioelectrical impedance, two other popular methods for measuring body composition
(Kohrt, 1998). Also, many studies are validating DEXA against other methods of
determining body composition, such as hydrodensitometry (Kohrt, 1998; Chen et al,
2007). These studies support the use of DEXA as a noninvasive and efficient method for
17
measuring body composition that is also more accessible for research studies (Visser et
al, 1999).
Body composition is one of the many aspects associated with optimal athletic
performance; therefore it is essential that athletes consume sufficient energy to maintain
appropriate body composition while training at competitive levels (Rodriguez, DiMarco,
& Langley, 2009). Some female athletes assume that lower energy intake will lead to a
lower amount of body fat, however energy imbalance can, in fact, lead to a higher percent
body fat and a decrease in LBM (Zachwieja, 2001; Deutz, Benardot, Martin, & Cody,
1999). Yet many female athletes tend to consume low calorie diets (<1800-
2000kcals/day) not matching energy intakes with energy expenditure in order to decrease
their body fat and maintain a low body weight (Loucks, 2004). An athlete must maintain
enough body fat to fulfill essential fat requirements and fuel the body. Essential fat is
necessary in areas like the brain, nerve tissue, organs, etc (Sawyer, hypes, & Brown,
2003). Essential fat for women is 12-15%. In general, a healthy body fat percentage for
women ranges from 20-30% (Armstrong, et al., 2006; Sawyer, Hypes, & Brown, 2003;
Coleman, 2003). An acceptable range for female athletes is approximately 14-30%
(American Counsel on Exercise, 2009). The ranges given for body fat are not necessarily
ideal. The best body composition will vary between athletes, types of sports, as well as
season. Thus, it is recommended that athletes consider their ideal body composition as a
percentage that falls within the healthy range in order to achieve their best performance
results (American Dietetics Association, 2009; Coleman, 2003).
18
Trying to achieve a lower body weight by restricting energy can lead to a decrease
in LBM, especially in athletes that are not in a weight training program (Bryner et al.,
1999). Zachwieja (2001) showed that on a short-term (2-week) energy restriction diet,
athletes that lost weight tended to lose mostly LBM. The following studies indicated that
energy restriction, especially long-term energy restriction, has many negative
consequences that are harmful to athletic performance. Gerlach and colleagues (2008)
found that diets limiting fat and/or overall energy resulted in more injuries in female
endurance runners than diets that did not restrict fat and/or energy. Loucks (2004) also
found that energy restriction methods place a female athlete’s reproductive and skeletal
health, along with performance, at risk. A study by Deutz (1999) showed that assuming
that energy restriction leads to lower body fat and increased performance is misleading.
His study of 42 female gymnasts and 20 female runners found that daily negative energy
balance can lead to a higher percent body fat. Given the results of previous studies,
female athletes should be encouraged to consume adequate energy and avoid limiting
their energy intakes to achieve ideal body composition (Deutz, 1999).
19
Assessment of Energy Consumption
Energy intake is defined as the energy consumed in a daily diet that is available
for metabolic and physiological processes of the body (Hill & Davies, 2001). Athletes
should regularly match energy expenditure with energy intake. Adequate energy intake is
crucial for maintaining energy balance. There are three popular methods used in
determining energy intake which are: dietary recall, food record, and food frequency
questionnaires (Hill & Davies, 2001). Food recalls gain information on recent energy
intake, usually the last 24 hours. The food recall is normally done in an interview session
and the researcher records the data. Food records are performed in order to gain
information on habitual energy intake. The most accurate food records are collected 7-14
days (Schoeller, 1995). Some studies infer that 3 to 7 days of food records are considered
accurate (Hill & Davies, 2001). This shorter time period is thought to deliver more
compliance by the subjects. The food record differs from a food recall in that the food
record is completed by the participant independently and the food recall is completed
with the researcher. A three to four day dietary record is the most widely used for studies
using the athletic population (Magkos & Yannakoulia, 2003). The food record is
laborious which results in its biggest disadvantage when used for research purposes (Hill
& Davies, 2001). Although laborious, dietary records are often used because they are
inexpensive and noninvasive. Another method used to gain information on dietary intakes
is a food frequency questionnaire. A food frequency questionnaire consists of questions
20
regarding the kinds of foods one has eaten and how often they consume these foods
(McKeown et al., 2001). These questionnaires can vary depending on country, economic
status, etc. Studies show that food frequency questionnaires are an accurate report of
energy intake habits, especially for generalizing a population, but not as accurate for
individual recommendations (Hill & Davies, 2001; Schoeller, 1995).
Underreporting of energy intake poses a problem when gathering dietary data.
Studies show that when self reported energy intake (food records) are compared to
reported energy intake (doubly labeled water technique) evidence of under recording
energy is strong (McKeown et al, 2001; Hill & Davies, 2001; Schoeller, 1995). The most
common reasons for underreporting of dietary data are errors in recording quantities and
descriptions of foods or altering dietary intake during periods of data gathering in order to
improve the perception of what is consumed (Burke, Cox, Cummings, & Desbrow,
2001). Because female athletes tend to engage in weight loss practices, monitor their
energy intake, and strive for the ideal body, it is likely that they underreport their energy
intake when completing food records or dietary recalls (Schoeller, 1995). Underreporting
overall energy intake is not the only limitation when studying dietary habits of athletes.
Other limitations include imprecise recording of portion sizes, fluid intake, supplement
use, weight control actions, and snacking (Magkos & Yannakoulia, 2003). The weight
control practices can include not recording extra workout sessions, especially if the
workout session was not a team scheduled event. Underreporting exercise is just as
detrimental to research as underreporting energy intake.
21
Estimating Overall Energy Requirements for Athletes
Precise energy requirement assessments are essential in determining the
efficiency of planned nutrition interventions for athletes, which are often set in place to
improve performance. Athletes should strive to match energy intake with energy
expenditure and meet their energy requirements on a regular basis (Ismail, Wan Nudri, &
Zawiah, 1997). Because athletes are influenced by a variety of physical, metabolic, and
environmental factors, estimating energy requirements of individual athletes can be
difficult (Broeder, Burrhus, Svanevik, & Wilmore, 1992; Thompson & Manore, 1996).
There are three variables included in overall energy expenditure that must be considered
when estimating overall energy requirements. These variables include RMR, physical
activity, and the thermic effect of food (TEF) (Jeukendrup & Gleeson, 2004; Schulz,
Alger, Harper, Wilmore, & Ravussin, 1992; Owens et al, 1986). There are many
techniques that exist to determine overall energy requirements including estimation
equations, indirect calorimetry, and direct calorimetry (Ainslie, Reilly, & Westerterp,
2003; Liu, Woo, Tang, Ng, Ip, & Yu, 2001).
Resting Metabolic Rate
Resting metabolic rate (RMR) accounts for approximately 65-70% of daily
energy expenditure. Thermic effect of food is the energy required for food to go through
the biochemical processes of digestion and absorption within the body and accounts for
22
approximately 10-15% of total daily energy expenditure (Schulz, Alger, Harper,
Wilmore, & Ravussin, 1992; Crovetti, Porrini, Santangelo, & Testolin, 1997). The
thermic effect of food is a small percentage of total energy expenditure; therefore the
main variables in estimating energy expenditure are RMR and physical activity.
Given that RMR is the most important determinant in estimating daily energy
expenditure; accuracy in predicting RMR is important (Kien & Ugrasbul, 2004). Resting
metabolic rate can be measured by direct and indirect calorimetry as well as estimated by
equations. Metabolic carts (indirect calorimetry) measure the exchange of gases via a
ventilated hood (Lorenzo, Bertini, Puijua, Testolin, & Testolin, 1999). The gas exchange
being measured is the amount of oxygen consumed versus the amount of carbon dioxide
produced (Lorenzo, Bertini, Puijua, Testolin, & Testolin, 1999). Studies show that the
metabolic cart is considered a reliable source for gathering information on resting
metabolic rate and has been used to test the validity of other instruments and equations
used to measure metabolic rate (Pinnington, Wong, Tay, Green, & Dawson, 2001; Peel &
Utsey, 1993). The availability of the metabolic cart can limit its use in many counseling
settings and athletic venues. The gold standard for testing resting metabolic rate is the
doubly labeled water technique (Kien & Ugrasbul, 2004). This technique is an indirect
way of measuring energy expenditure which consists of administering a subject a known
amount of water (Broemeling & Wolfe, 1993). Although precise, these two methods of
determining energy expenditure can be impractical (Schoeller, Colligan, Shriver, Avak,
& Bartok-Olson, 2000).
23
A common method of estimating energy requirements of athletes is based on
equations estimating RMR (Frankenfield, Roth-Yousey, & Compher, 2005; Lawrence &
Ugrasbul, 2004; Thompson & Manore, 1996). Some of the most popular equations for
estimating RMR are Harris- Benedict, Cunningham, Mifflin et al, and Owens et al
equations (Thompson & Manore, 1996). Two of the most common equations used are the
Harris-Benedict and the Cunningham equations. Equations are often used by nutritionists,
registered dietitians, and other specialist because they are cheap, quick, and can be
assessed in any situation.
Harris and Benedict Equation
The Harris-Benedict equation is the oldest equation still used in the clinical
setting (Frankenfield, Roth-Yousey, & Compher, 2005). This equation estimates RMR
and uses a coordinating physical activity factor to estimate total energy required per day.
The Harris-Benedict equation estimates energy requirements based on height, weight,
age, and gender (Harris & Benedict, 1919). The equation was established from a sample
of 239 healthy individuals including males (136) and females (103) (Frankenfield, Roth-
Yousey, & Compher, 2005; Cunningham, 1980). Of this population, 16 males were
classified as athletes (Harris & Benedict, 1919). This equation was developed over a time
frame of approximately 10 years (1907-1917) (Frankenfield, Roth-Yousey, & Compher,
2005; Harris & Benedict, 1919). The Harris and Benedict equation has been found to
underestimate energy requirements of individuals with high LBM and overestimate
energy requirements for those with high body fat or obese individuals (Harris &
24
Benedict, 1919; Thompson & Manore, 1996; Owens et al, 1986). Some studies have
found the Harris-Benedict equation to have a precision rate of (+/- 14%) or (+/- 200
kilocalories) (Roza & Shizgal, 1985; Kien & Ugrasbul, 2004). The Harris-Benedict RMR
is multiplied by an activity factor in order to estimate total daily energy requirements
(Rodriguez, DiMarco, & Langley, 2009). Although the Harris-Benedict equation does not
account for LBM, the original study does mention that LBM could be the determining
factor for estimating RMR (Harris & Benedict, 1919).
Cunningham Equation
John Cunningham (1980) supported Harris and Benedict’s idea that LBM may be
the best predictable variable in estimating RMR. According to Cunningham, LBM can
account for approximately 70% of RMR (1980). RMR differs from BMR because RMR
is not always measured following an overnight fast prior to any of the days’ activities
(Kern, 2005). For the purposes of this study, RMR was measured because subjects
participated in minimal daily activity through the process of arriving at the testing center.
Cunningham’s study used the data from Harris and Benedict’s original study of 223
healthy subjects. Sixteen male subjects were dropped from the study because they were
identified as well trained athletes (1980). The subject’s sex, age, and weight were taken
from the original study and a formula was created that estimated LBM (Lorenzo, Bertini,
Puijia, Testolin, & Testolin, 1999). The estimated LBM was then plugged into what is
now known as the Cunningham formula to estimate RMR. Some studies have concluded
that when compared to measured values, the Cunningham equation is the most accurate
25
equation in estimating RMR because it takes LBM into consideration (Lorenzo, Bertini,
Puijia, Testolin & Testolin, 1999; Thompson & Manore, 1996; Cunningham, 1980).
Comparison of Harris and Benedict and Cunningham
Many studies conclude that LBM is the best predictor of resting metabolic rate
(Thompson & Manore, 1996; Mifflin et al, 1990; Cunningham, 1982; Cunningham,
1980). The main difference in these equations is that the Cunningham equation uses LBM
as a variable in predicting resting metabolic rate, whereas the Harris-Benedict equation
uses height, weight, age, and gender as main variables. Because LBM is considered to be
one of the best predictors of estimating resting metabolic rate, it may be better suited for
estimating daily energy recommendations when compared to equations like Harris-
Benedict which do not use LBM as a variable. Several previous studies have suggested
the use of the Cunningham equation with various athletic populations (Smith, Dollman,
Withers, Brinkman, Keeves, & Clark, 1997; Thompson & Manore, 1996; Broeder,
Burrhus, Svanevik, & Wilmore, 1992; Cunningham, 1980).
Estimating overall energy requirements for athletes is difficult because the above
formulas were not created for the athletic population; however they are the easiest
universal method to use. Although not athletes, the populations used to create these
formulas were considered relatively lean and active (Thompson & Manore, 1996;
Cunningham, 1980). The sample population should be the determining factor for which

26
equation is used to estimate RMR for approximating energy requirements.
Recommendations for athletes based on equations alone require close monitoring of the
athletes’ energy intake and body composition due to the error rate of the equations.
Physical Activity Factors Used to Estimate Energy Requirements
Physical activity is the most variable component of daily energy expenditure,
accounting for approximately 20-30% (Sjodin et al, 1995; Liu, Woo, Tang, Ng, Ip, & Yu,
2001). In fact, Jeukendrup and Gleeson (2004) state that physical activity in athletes can
vary from 30% to 50% of daily energy expenditure. The physical activity factor is an
integer multiplied by RMR to obtain an individual’s total estimated daily energy
requirements. The physical activity factor is based on the duration, frequency, and
intensity of an individual’s physical activity. The physical activity factor accounts for
additional energy required for certain added activities, which is why it is an important
assessment tool when estimating RMR. According to Zalcman (2007) an appropriate
activity factor for an active individual is 1.7. Each individual athlete’s physical activity
factor will vary based on mode, season, and training schedule; thus estimating one’s
physical activity factor can be challenging for nutrition professionals. Alfonzo-Gonza´lez
and colleagues (2004) state that the Food and Agriculture Organization of the United
Nations, World Health Organization, and the United Nations University
(FAO/WHO/UNU 1985) activity factor of low activity (1.55 and 1.56) and high activity
27
(1.82 and 2.1) for female and males, respectively, often overestimate energy
requirements. Physical activity factors vary, for example Rabeneck (1998) uses activity
factors as very light 1.3, light 1.6, moderate 1.7, and heavy 2.1. Studies show variations
between 1.3 and 1.6 for estimating physical activity expenditure, however most support
the lower range of activity factors compared to the higher range of the activity factors
stated by FAO/WHO/UNU 1985 (Bauer, Reeves, & Capra, 2004; Nielsen, Kondrup,
Martinsen, Stilling, & Wikman, 1993). While several factors influence physical activity
level, a reasonable activity factor for healthy athletes in general training is considered to
range from 1.6-1.8 (Zalcman, 2007; Zello, 2006). The position of the American Dietetic
Association, Dietitians of Canada, and American College of Sports Medicine (2009)
states that acceptable activities factors range from 1.8-2.3.
28
Summary
Energy balance is important for athletes in order to maintain a healthy nutritional
status, LBM, and optimize their athletic performance (Manore, Barr, & Butterfield, 2000;
Ziegler, 2001). Energy intake also plays a major role in weight management, including
weight loss, and weight gain (Westerterp-Plantenga, 2004). Thus, meeting daily energy
expenditure represents a major key to optimal weight and performance among athletes
(ADA Reports, 2005).
Although energy restricted diets are relatively common among both women and
men engaged in weight-restricted and aesthetic sports, such as gymnastics, track and
field, diving, and rowing (Ziegler, Nelson, Barrat-Fornell, Fiveash, & Drewnowski, 2001;
Bishop, Blannin, Walsh, Robson, & Gleeson, 1999), research shows that female athletes
are at a particularly high risk for under consuming calories (Ziegler & Jonnalagadda,
2006; Ziegler et al, 2001) compared to male athletes in the same sports (Ziegler &
Jonnalagadda, 2006; Mullinix, Jonnalagadda, Rosenbloom, Thompson, & Kickligher,
2003; Manore, 2002; Ziegler et al, 2001). Under consumption of energy puts female
athletes not only at risk for decreased performance and LBM, but lack of energy may also
have long term health and nutritional consequences, including amenorrhea, bone loss, and
eating disorders (Nichols, Sanbourn, & Essery, 2007). Current research suggests that
amenorrheic athletes have 10-25% lower bone mineral density at the lumbar spine versus
the eumenorrheic athlete (Nichols, Sanbourn, & Essery, 2007).
Estimating energy intakes of athletes currently poses a challenge because existing
methods of estimating energy requirements were not derived using the athletic
population. The gold standard of estimated RMR is a doubly labeled water technique;
29
however this method is not always accessible and practical. This is true for DEXA as
well, which is currently accepted as the gold standard for measuring body composition.
Furthermore, no specific standards for ideal body fat percentage currently exist for
athletes (Jeeukendrup & Gleeson, 2004). The ideal body composition is highly dependant
on the particular sport and should be advised on an individual basis, taking genetics, body
frame, and other factors into consideration. Another challenge in estimating athletes’
energy intakes is the assessment of energy consumption by dietary recalls, food records,
or food frequency questionnaires which all have limitations of underreporting and/or over
reporting (Hill & Davies, 2001).
The main purpose of this study was to evaluate energy intakes of a sample of
female collegiate athletes. Reported energy consumption of each athlete was compared to
their calculated energy requirements determined using measured RMR plus an
appropriate physical activity factor. The second purpose of the study was to determine
whether differences between actual resting metabolic rate and resting metabolic rate
estimated using the Harris-Benedict and Cunningham equations, exist in the target
population. The third purpose of the study was to explore the relationship between
reported energy intakes and body composition of the female athletes, including lean body
mass (LBM) and fat mass (FM). Finally, the relationship between individual’s reported
energy intake and score on the EAT-26 test was explored.
30
CHAPTER III
METHODOLOGY
Research Design and Subject Selection
This exploratory study used a convenience sample of collegiate female athletes
who were recruited from several sports teams at a large mid-western university in the
United States. A written approval was obtained from the Athletic Director prior to the
beginning of the study. Athletes were informed about the purpose, nature and details of
the study using written informed consent forms and they were recruited for the study by
athletic trainers. A written informed consent form was obtained from each athlete prior to
data collection. Data collection days and times were scheduled and coordinated through
each team’s individual athletic trainers. Subjects were recruited from a variety of athletic
teams and consisted of soccer players, cross-country and/or track and field athletes, and
basketball players. The study was approved by the Institutional Review Board at
Oklahoma State University.
31
Study Procedures
Subjects were asked to visit a metabolic lab in the Department of Nutritional
Sciences in the morning hours on a previously scheduled day. Subjects were asked to fast
over night and limit their physical activity on the night before and the morning of their
visit to the lab. They were asked to arrive to the testing laboratory via motorized vehicle
and instructed to take the elevator to the laboratory room. The information was collected
from subjects within a 1.5 hour visit, except for the 3-day food records that were
collected from athletes within 1-2 weeks after the lab visit. Each participant was assigned
an ID number in order to maintain confidentiality of the subjects. The measure obtained
from each subject included height, weight, resting metabolic rate (RMR), body
composition, a nutrition questionnaire (NQ), a 24-hour recall, a 3-day food record, and an
EAT.
Anthropometric Data
Height was measured to the nearest 0.10 cm using a wall mounted stadiometer
(Harpenden, Holtain, Creymmich, Pembrookshire, United Kingdom). Weight was
32
measured (while wearing only minimal clothing) to the nearest 0.10 kg using an
electronic scale (Seca 664, Hamburg Germany). Body composition was measured by the
(DEXA) (QDR 4500A Hologic Inc, Bedford, MA). DEXA is based on photon
attenuation of fat mass, fat-free mass, and bone mineral density (Plank, 2005). DEXA
houses two x-ray beams working at different frequencies inside one scanner (Visser et al,
1999 &; Brunton, Bayley, & Atkinson, 1993). As this total body scanner travels over the
body, it records data on bone mineral content and soft tissue composition (Morrison et al,
1994). The scanner passes over the entire body and provides detailed results in
approximately three to five minutes (Visser et al, 1999). Scrubs were provided for the
subjects and all metal was removed before the DEXA scan. Subjects were positioned on
the machine by a trained technician and informed to close their eyes as the x-ray scanner
passed over their heads. The DEXA scan took approximately three to five minutes per
athlete. Detailed printouts of body composition were obtained from the scan.
Resting Metabolic Rate
RMR was measured by indirect calorimetry using a metabolic cart (Vmax
Encore, Viasys, Yorba Linda, CA). During this test, a clear canopy was placed over the
head and shoulders of each subject to measure carbon dioxide produced and oxygen
consumed for 20 minutes (VCO2/VO2). The metabolic cart was located in a private room
to minimize any distractions. The room was kept at a temperature of approximately 73
33
degrees to ensure a relaxing atmosphere. All subjects were monitored during this time to
ensure their comfort. In addition to using indirect calorimetry to measure metabolic rate,
RMR was also estimated for each subject using the Harris-Benedict and Cunningham
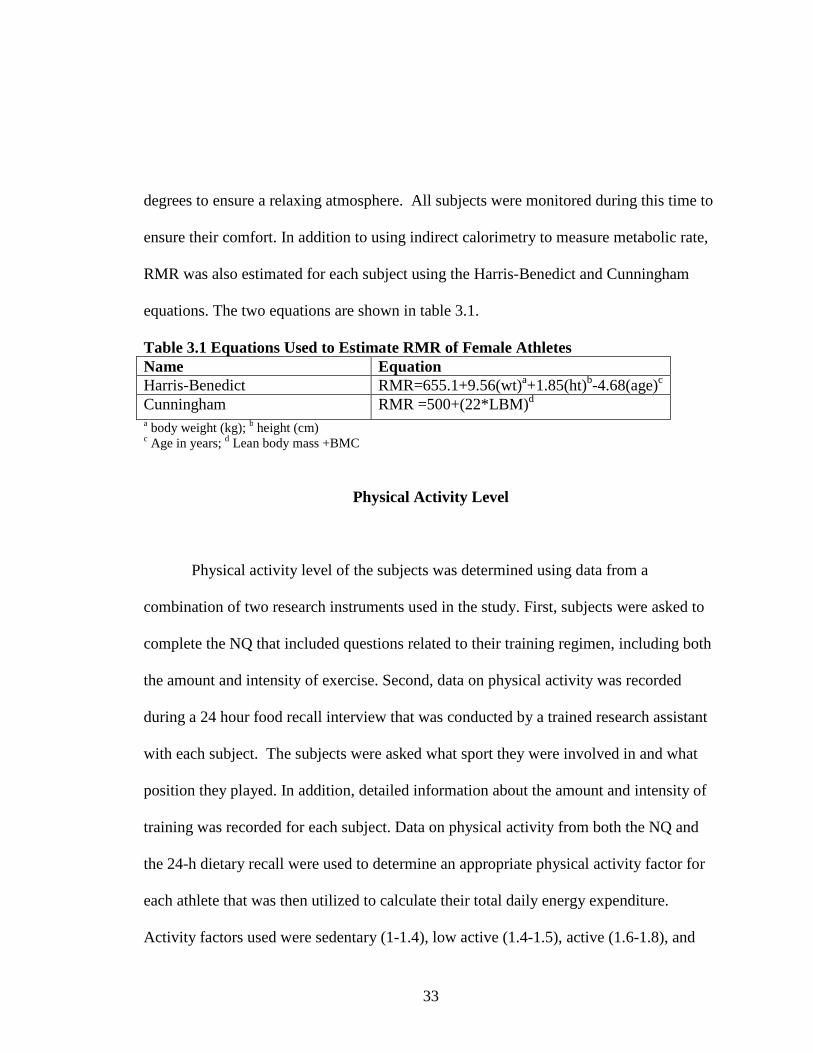
equations. The two equations are shown in table 3.1.
Table 3.1 Equations Used to Estimate RMR of Female Athletes Name Equation Harris-Benedict RMR=655.1+9.56(wt)a+1.85(ht)b-4.68(age)c Cunningham RMR =500+(22*LBM)d a body weight (kg); b height (cm) c Age in years; d Lean body mass +BMC
Physical Activity Level
Physical activity level of the subjects was determined using data from a
combination of two research instruments used in the study. First, subjects were asked to
complete the NQ that included questions related to their training regimen, including both
the amount and intensity of exercise. Second, data on physical activity was recorded
during a 24 hour food recall interview that was conducted by a trained research assistant
with each subject. The subjects were asked what sport they were involved in and what
position they played. In addition, detailed information about the amount and intensity of
training was recorded for each subject. Data on physical activity from both the NQ and
the 24-h dietary recall were used to determine an appropriate physical activity factor for
each athlete that was then utilized to calculate their total daily energy expenditure.
Activity factors used were sedentary (1-1.4), low active (1.4-1.5), active (1.6-1.8), and
34
heavy active (1.9) or greater (Zalcman, 2007; Zello, 2006; & Rabeneck 1998). Given
that all subjects participating in the study reported high levels of physical activity during
the study (1.6-1.8) and none of them were sick or injured, a physical activity factor of 1.7
was used to estimate the RMR of every subject.
24 Hour Recall & 3-day Food Records
Reported dietary energy intakes of the subjects were assessed by a 24-hour recall and a 3-
day food record. A multiple-pass method was used to conduct the 24 hour recalls. First,
subjects were asked to recall all foods and beverages consumed during the previous 24
hours. Then, the subjects were asked to elaborate on and specify some of the reported
foods or beverages while the interviewer helps the subjects recall whether they consumed
any other foods/drinks not previously recorded. Finally, the subjects were asked about
cooking methods used for food preparation and if any condiments or other ingredients
were added (USDA, 1998; Moshfegh, Borud, Perloff, & LaComb, 1999; Lytle et al.,
1993). In order to help stimulate memory of the subjects, plastic food models, real food
examples, and household measuring tools (cups, tablespoons, glasses, bowls, etc.) were
used during the 24-hour recalls. A 3-day food record was also completed by the subjects.
Detailed instructions on how to complete the 3-day food records were provided to the
subjects at the end of the 24-h recall interview. Subjects were asked to record the quantity
of all foods and beverages consumed in 3 days (one weekend day and two week days) in
35
household measurements, as well as to record brand names, methods of food preparation,
and ingredients of recipes where possible. When food was eaten outside the home, a
record of the description of the food, place of purchase, and amount eaten were
requested. When possible, portion sizes and food comparisons were recorded from the
food manufacture’s website or corresponding foods were purchased by the researchers in
order to determine the nutrient composition of the particular food/beverage. The Diet
Analysis 8.0 software program was used to analyze all foods and beverages obtained
from the 24-hour recalls (Thompson learning, Belmont CA). The analyzed food records
included all four days of recorded dietary intakes (one 24 hour recall and one 3-day food
record). Two trained research assistants entered and analyzed the dietary intakes
independently and the correlation coefficient between the two research assistants was
r=0.98 for total energy intake, r=0.96 for total carbohydrate intake, r=0.96 for total fat
intake and r=0.95 for total protein intake. When substantial differences in data entry
were identified between the two research assistants, the dietary records were examined by
the primary investigator and corrections were made in the dataset.
Eating Attitude Test
Subjects also completed EAT-26 which is a 26-item questionnaire designed to
detect potential signs and concerns of eating disorders (Lane, Lane, & Matheson, 2004;
Garner, Olmsted, Bohr, & Garfinkel, 1982). The EAT score is based on responses to the
36
26 items as follows: Never, Rarely, Sometimes, Often, Very Often; and Always. The first
three responses are scored zero, with the last three responses scored 1, 2, and 3
respectively (Lane, Lane, & Matheson, 2004). A score greater than 20 is considered to
be an indicator of a possible disordered eating problem. Individuals who score 20 or
above on the EAT-26 test are encouraged to seek clinical counseling, or in a research
setting the data is reported as suggesting a possible eating disorder in some subjects
(Lane, Lane, & Matheson, 2004).
Statistical Analysis
Descriptive statistics, including means and standard deviations, frequencies and
percentages, were used to describe the sample. The RMR measured by Vmax metabolic
cart was compared to the RMR estimated by the Harris-Benedict and Cunningham
equations (Harris, & Benedict, 1919; Cunningham, 1980). These comparisons were
assessed using Student’s paired t-tests. The energy requirements determined from the
Vmax Metabolic Cart and the appropriate physical activity factors were compared with
the reported dietary energy intakes using Student’s paired t-test. Bivariate correlations
were utilized to explore relationships between energy intakes and body composition,
including lean body mass and fat mass. Lastly, body composition (LBM and body fat)
were compared between the subjects who met and who did not meet their daily energy
37
requirement using the Mann-Whitney nonparametric test. Level of significance for all
statistical tests was set at p<0.05.
38
CHAPTER IV
FINDINGS
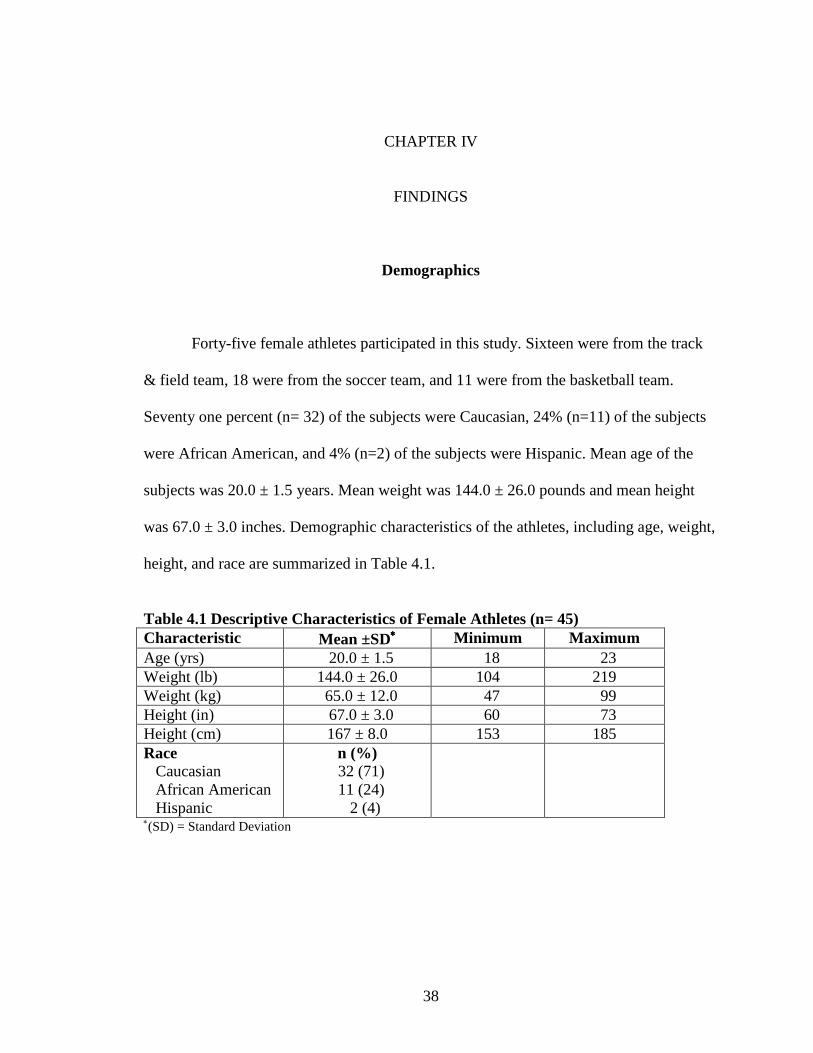
Demographics
Forty-five female athletes participated in this study. Sixteen were from the track
& field team, 18 were from the soccer team, and 11 were from the basketball team.
Seventy one percent (n= 32) of the subjects were Caucasian, 24% (n=11) of the subjects
were African American, and 4% (n=2) of the subjects were Hispanic. Mean age of the
subjects was 20.0 ± 1.5 years. Mean weight was 144.0 ± 26.0 pounds and mean height
was 67.0 ± 3.0 inches. Demographic characteristics of the athletes, including age, weight,
height, and race are summarized in Table 4.1.
Table 4.1 Descriptive Characteristics of Female Athletes (n= 45) Characteristic Mean ±SD∗∗∗∗ Minimum Maximum Age (yrs) 20.0 ± 1.5 18 23 Weight (lb) 144.0 ± 26.0 104 219 Weight (kg) 65.0 ± 12.0 47 99 Height (in) 67.0 ± 3.0 60 73 Height (cm) 167 ± 8.0 153 185 Race Caucasian African American Hispanic
n (%) 32 (71) 11 (24)
2 (4)
∗(SD) = Standard Deviation
39
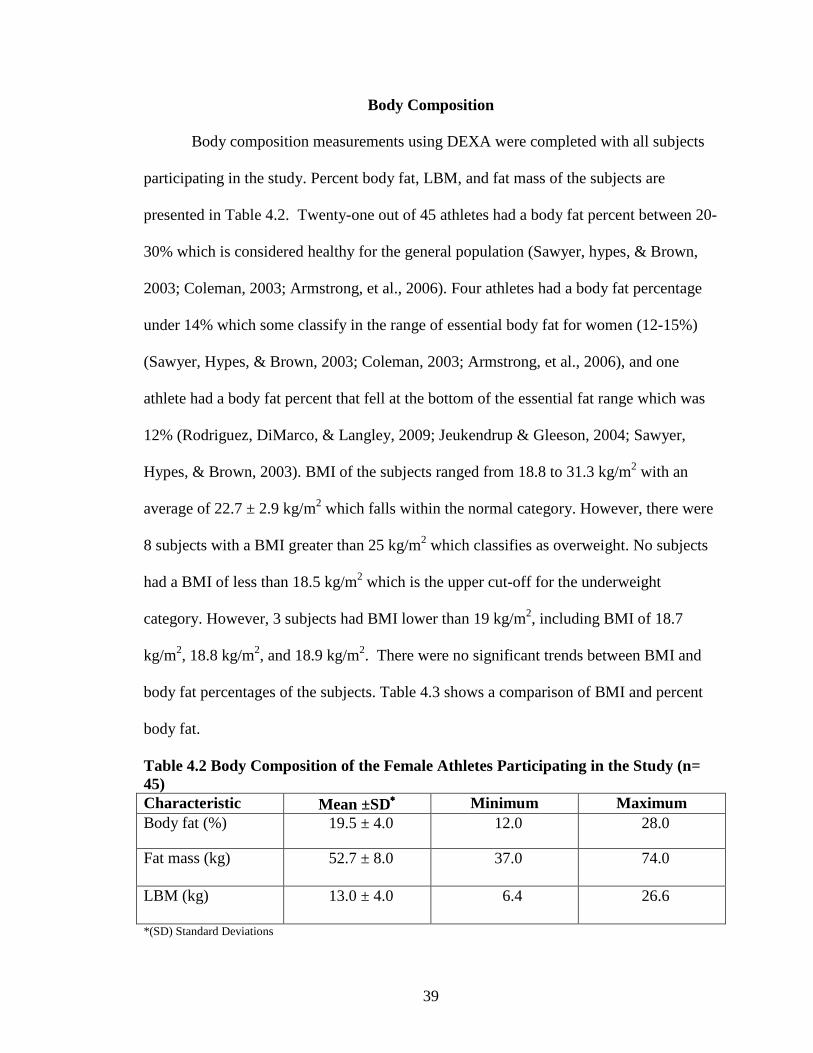
Body Composition
Body composition measurements using DEXA were completed with all subjects
participating in the study. Percent body fat, LBM, and fat mass of the subjects are
presented in Table 4.2. Twenty-one out of 45 athletes had a body fat percent between 20-
30% which is considered healthy for the general population (Sawyer, hypes, & Brown,
2003; Coleman, 2003; Armstrong, et al., 2006). Four athletes had a body fat percentage
under 14% which some classify in the range of essential body fat for women (12-15%)
(Sawyer, Hypes, & Brown, 2003; Coleman, 2003; Armstrong, et al., 2006), and one
athlete had a body fat percent that fell at the bottom of the essential fat range which was
12% (Rodriguez, DiMarco, & Langley, 2009; Jeukendrup & Gleeson, 2004; Sawyer,
Hypes, & Brown, 2003). BMI of the subjects ranged from 18.8 to 31.3 kg/m2 with an
average of 22.7 ± 2.9 kg/m2 which falls within the normal category. However, there were
8 subjects with a BMI greater than 25 kg/m2 which classifies as overweight. No subjects
had a BMI of less than 18.5 kg/m2 which is the upper cut-off for the underweight
category. However, 3 subjects had BMI lower than 19 kg/m2, including BMI of 18.7
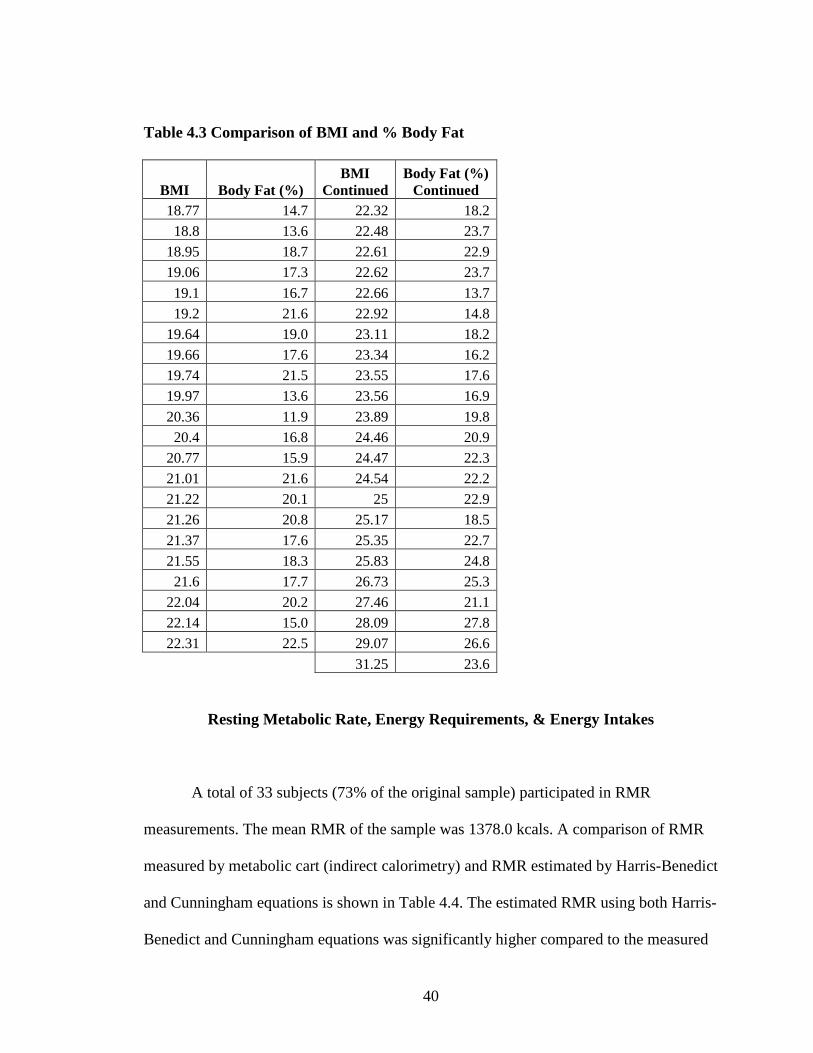
kg/m2, 18.8 kg/m2, and 18.9 kg/m2. There were no significant trends between BMI and
body fat percentages of the subjects. Table 4.3 shows a comparison of BMI and percent
body fat.
Table 4.2 Body Composition of the Female Athletes Participating in the Study (n= 45) Characteristic Mean ±SD∗∗∗∗ Minimum Maximum Body fat (%) 19.5 ± 4.0 12.0 28.0
Fat mass (kg)
52.7 ± 8.0 37.0 74.0
LBM (kg) 13.0 ± 4.0 6.4 26.6
*(SD) Standard Deviations
40
Table 4.3 Comparison of BMI and % Body Fat
BMI Body Fat (%) BMI
Continued Body Fat (%)
Continued 18.77 14.7 22.32 18.2
18.8 13.6 22.48 23.7
18.95 18.7 22.61 22.9
19.06 17.3 22.62 23.7
19.1 16.7 22.66 13.7
19.2 21.6 22.92 14.8
19.64 19.0 23.11 18.2
19.66 17.6 23.34 16.2
19.74 21.5 23.55 17.6
19.97 13.6 23.56 16.9
20.36 11.9 23.89 19.8
20.4 16.8 24.46 20.9
20.77 15.9 24.47 22.3
21.01 21.6 24.54 22.2
21.22 20.1 25 22.9
21.26 20.8 25.17 18.5
21.37 17.6 25.35 22.7
21.55 18.3 25.83 24.8
21.6 17.7 26.73 25.3
22.04 20.2 27.46 21.1
22.14 15.0 28.09 27.8
22.31 22.5 29.07 26.6
31.25 23.6
Resting Metabolic Rate, Energy Requirements, & Energy Intakes
A total of 33 subjects (73% of the original sample) participated in RMR
measurements. The mean RMR of the sample was 1378.0 kcals. A comparison of RMR
measured by metabolic cart (indirect calorimetry) and RMR estimated by Harris-Benedict
and Cunningham equations is shown in Table 4.4. The estimated RMR using both Harris-
Benedict and Cunningham equations was significantly higher compared to the measured
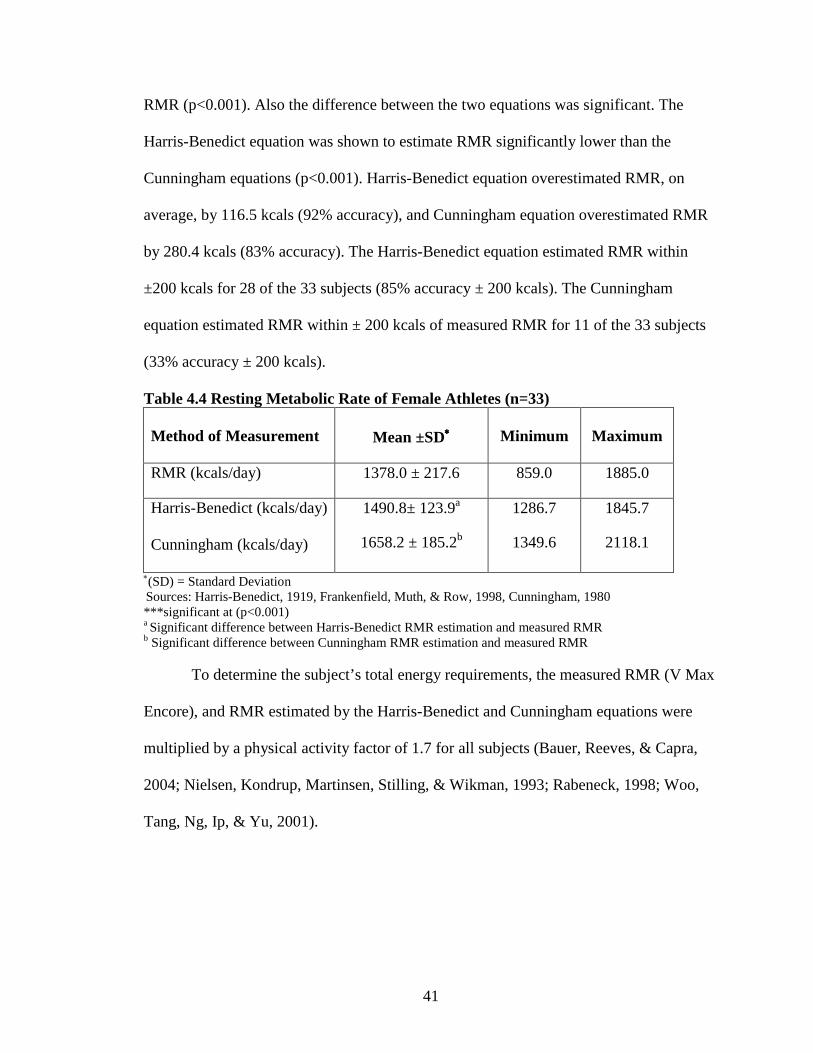
41
RMR (p<0.001). Also the difference between the two equations was significant. The
Harris-Benedict equation was shown to estimate RMR significantly lower than the
Cunningham equations (p<0.001). Harris-Benedict equation overestimated RMR, on
average, by 116.5 kcals (92% accuracy), and Cunningham equation overestimated RMR
by 280.4 kcals (83% accuracy). The Harris-Benedict equation estimated RMR within
±200 kcals for 28 of the 33 subjects (85% accuracy ± 200 kcals). The Cunningham
equation estimated RMR within ± 200 kcals of measured RMR for 11 of the 33 subjects
(33% accuracy ± 200 kcals).
Table 4.4 Resting Metabolic Rate of Female Athletes (n=33) Method of Measurement
Mean ±SD∗∗∗∗
Minimum
Maximum
RMR (kcals/day) 1378.0 ± 217.6 859.0 1885.0
Harris-Benedict (kcals/day) Cunningham (kcals/day)
1490.8± 123.9a
1658.2 ± 185.2b
1286.7
1349.6
1845.7
2118.1
∗(SD) = Standard Deviation Sources: Harris-Benedict, 1919, Frankenfield, Muth, & Row, 1998, Cunningham, 1980 ***significant at (p<0.001) a Significant difference between Harris-Benedict RMR estimation and measured RMR b Significant difference between Cunningham RMR estimation and measured RMR
To determine the subject’s total energy requirements, the measured RMR (V Max
Encore), and RMR estimated by the Harris-Benedict and Cunningham equations were
multiplied by a physical activity factor of 1.7 for all subjects (Bauer, Reeves, & Capra,
2004; Nielsen, Kondrup, Martinsen, Stilling, & Wikman, 1993; Rabeneck, 1998; Woo,
Tang, Ng, Ip, & Yu, 2001).
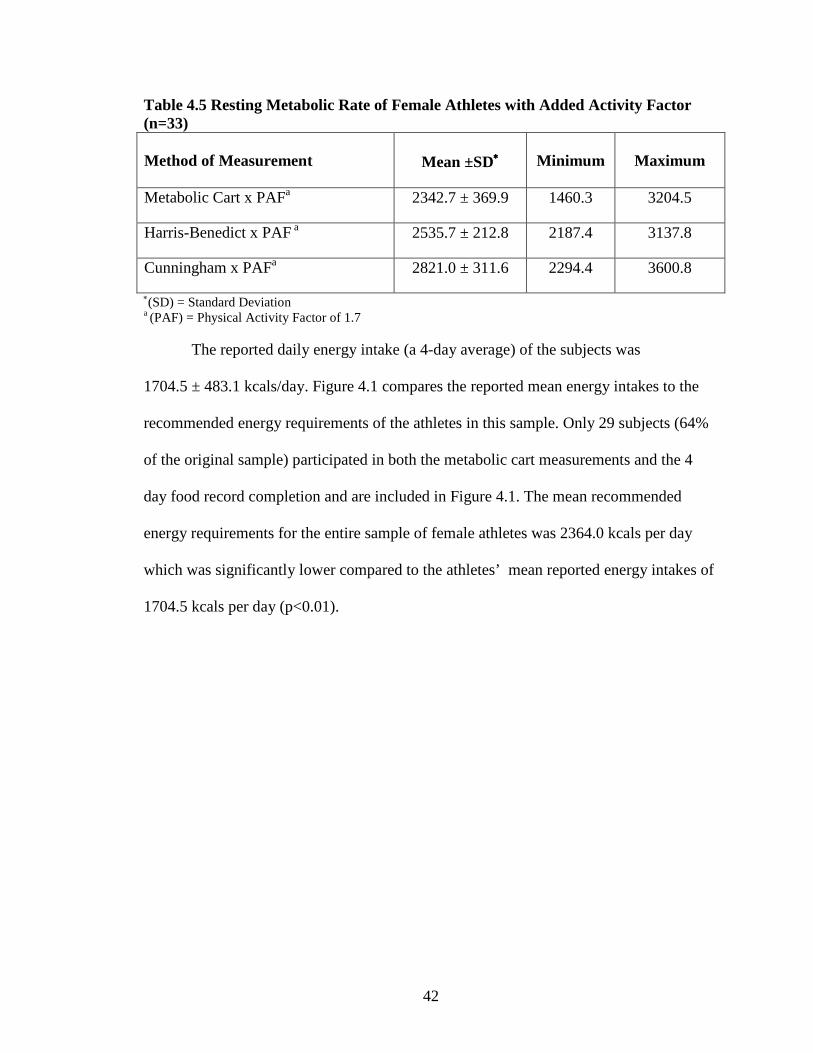
42
Table 4.5 Resting Metabolic Rate of Female Athletes with Added Activity Factor (n=33) Method of Measurement
Mean ±SD∗∗∗∗
Minimum
Maximum
Metabolic Cart x PAFa 2342.7 ± 369.9 1460.3 3204.5
Harris-Benedict x PAF a 2535.7 ± 212.8 2187.4 3137.8
Cunningham x PAFa 2821.0 ± 311.6 2294.4 3600.8
∗(SD) = Standard Deviation a (PAF) = Physical Activity Factor of 1.7
The reported daily energy intake (a 4-day average) of the subjects was
1704.5 ± 483.1 kcals/day. Figure 4.1 compares the reported mean energy intakes to the
recommended energy requirements of the athletes in this sample. Only 29 subjects (64%
of the original sample) participated in both the metabolic cart measurements and the 4
day food record completion and are included in Figure 4.1. The mean recommended
energy requirements for the entire sample of female athletes was 2364.0 kcals per day
which was significantly lower compared to the athletes’ mean reported energy intakes of
1704.5 kcals per day (p<0.01).
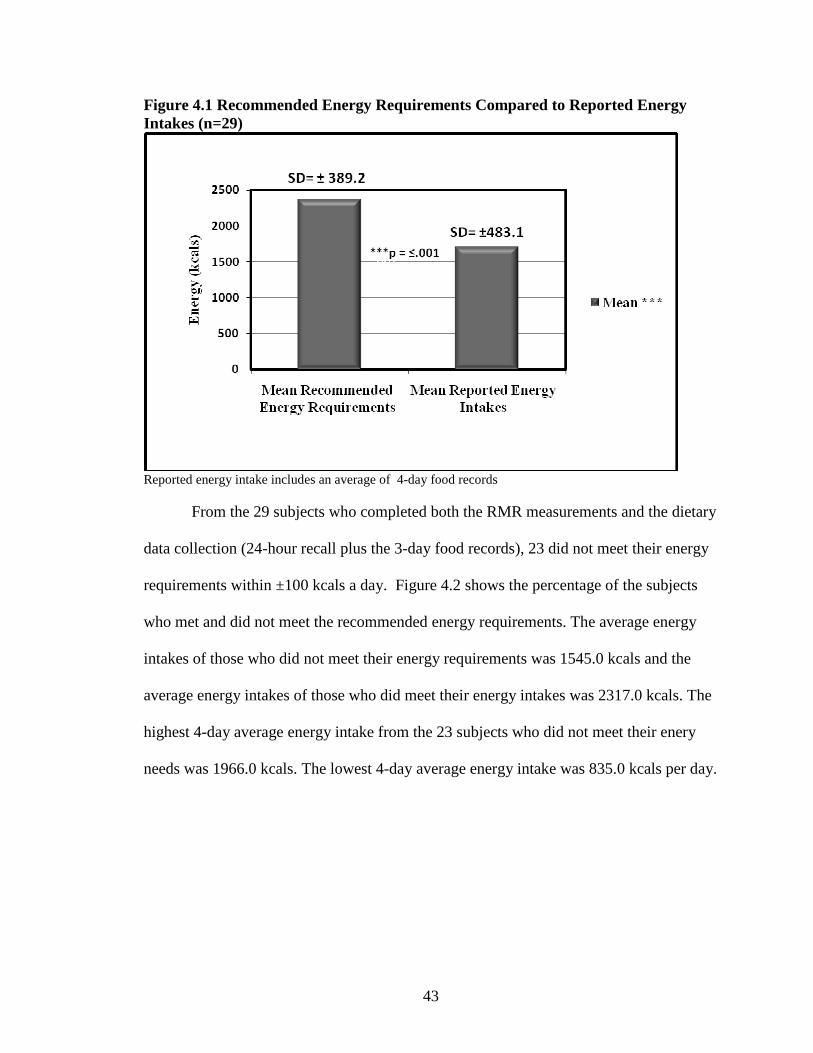
43
Figure 4.1 Recommended Energy Requirements Compared to Reported Energy Intakes (n=29)
Reported energy intake includes an average of 4-day food records
From the 29 subjects who completed both the RMR measurements and the dietary
data collection (24-hour recall plus the 3-day food records), 23 did not meet their energy
requirements within ±100 kcals a day. Figure 4.2 shows the percentage of the subjects
who met and did not meet the recommended energy requirements. The average energy
intakes of those who did not meet their energy requirements was 1545.0 kcals and the
average energy intakes of those who did meet their energy intakes was 2317.0 kcals. The
highest 4-day average energy intake from the 23 subjects who did not meet their enery
needs was 1966.0 kcals. The lowest 4-day average energy intake was 835.0 kcals per day.

44
Figure 4.2 The Comparison of Mean Reported Energy Intakes between Subjects Who Met and Did Not Meet Their Total Daily Energy Requirements
a= Reported energy intake for the group of subjects who met their energy requirements (mean±SD) b= Reported energy intake for the group of subjects who did not met their energy requirements (mean±SD)
Body composition, including LBM and body fat percentage, was also examined
within the sample. A comparison of body composition was made between the subjects
who met and who did not meet their energy requirements using the Mann-Whitney test.
Figure 4.3 shows the LBM of the 6 subjects who met their recommended energy intakes
compared to that of the 23 who did not meet their recommended energy intakes. Figure
4.4 also shows the comparison of body fat percentage between the 6 subjects who did
meet their recommended energy intakes to the 23 who did not meet their recommended
energy intakes.
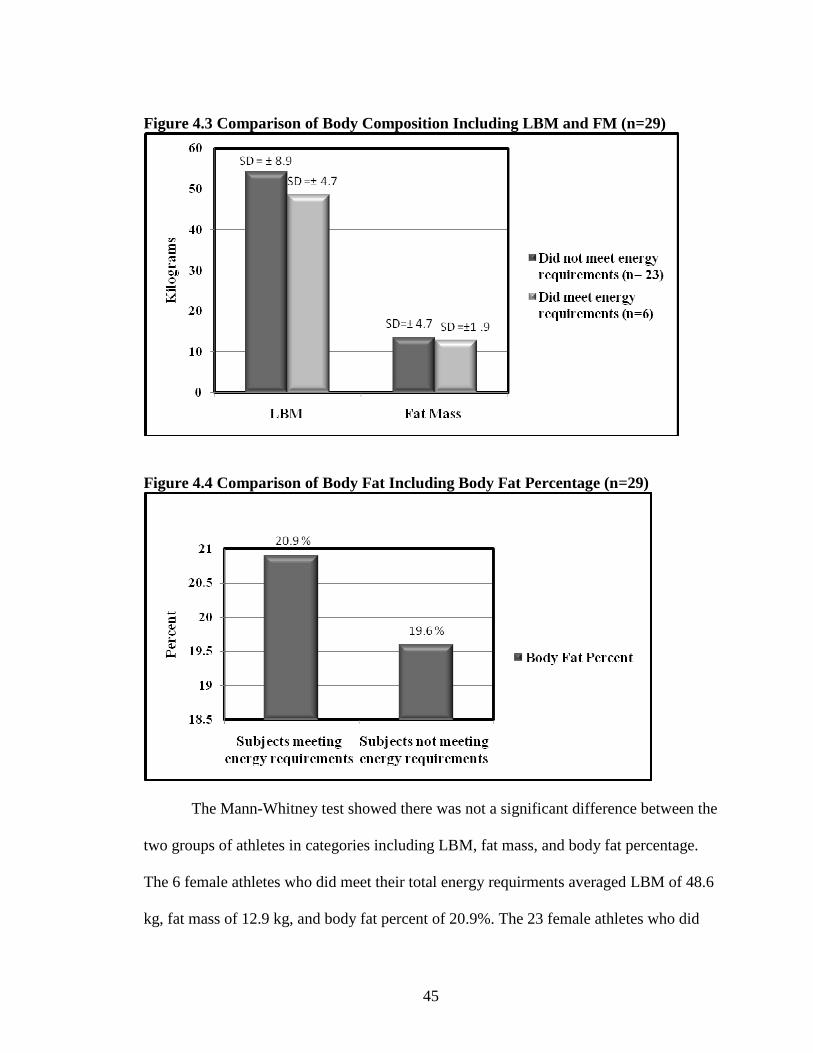
45
Figure 4.3 Comparison of Body Composition Including LBM and FM (n=29)
Figure 4.4 Comparison of Body Fat Including Body Fat Percentage (n=29)
The Mann-Whitney test showed there was not a significant difference between the
two groups of athletes in categories including LBM, fat mass, and body fat percentage.
The 6 female athletes who did meet their total energy requirments averaged LBM of 48.6
kg, fat mass of 12.9 kg, and body fat percent of 20.9%. The 23 female athletes who did
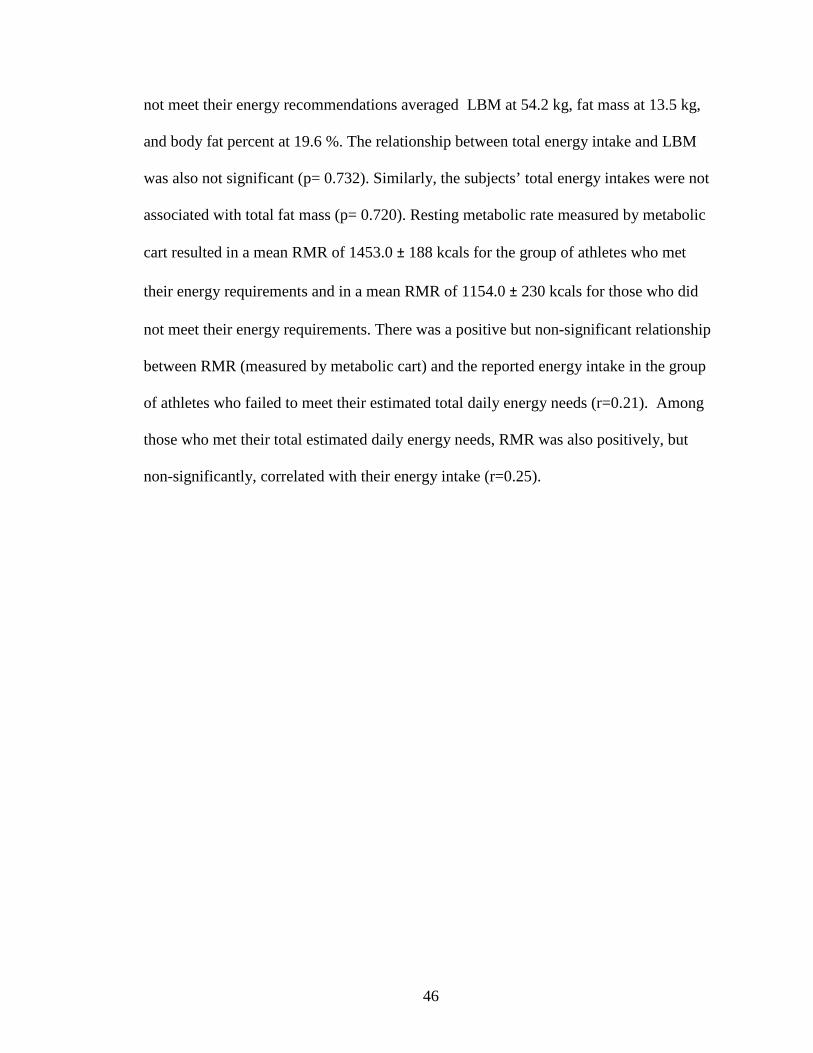
46
not meet their energy recommendations averaged LBM at 54.2 kg, fat mass at 13.5 kg,
and body fat percent at 19.6 %. The relationship between total energy intake and LBM
was also not significant (p= 0.732). Similarly, the subjects’ total energy intakes were not
associated with total fat mass (p= 0.720). Resting metabolic rate measured by metabolic
cart resulted in a mean RMR of 1453.0 ± 188 kcals for the group of athletes who met
their energy requirements and in a mean RMR of 1154.0 ± 230 kcals for those who did
not meet their energy requirements. There was a positive but non-significant relationship
between RMR (measured by metabolic cart) and the reported energy intake in the group
of athletes who failed to meet their estimated total daily energy needs (r=0.21). Among
those who met their total estimated daily energy needs, RMR was also positively, but
non-significantly, correlated with their energy intake (r=0.25).
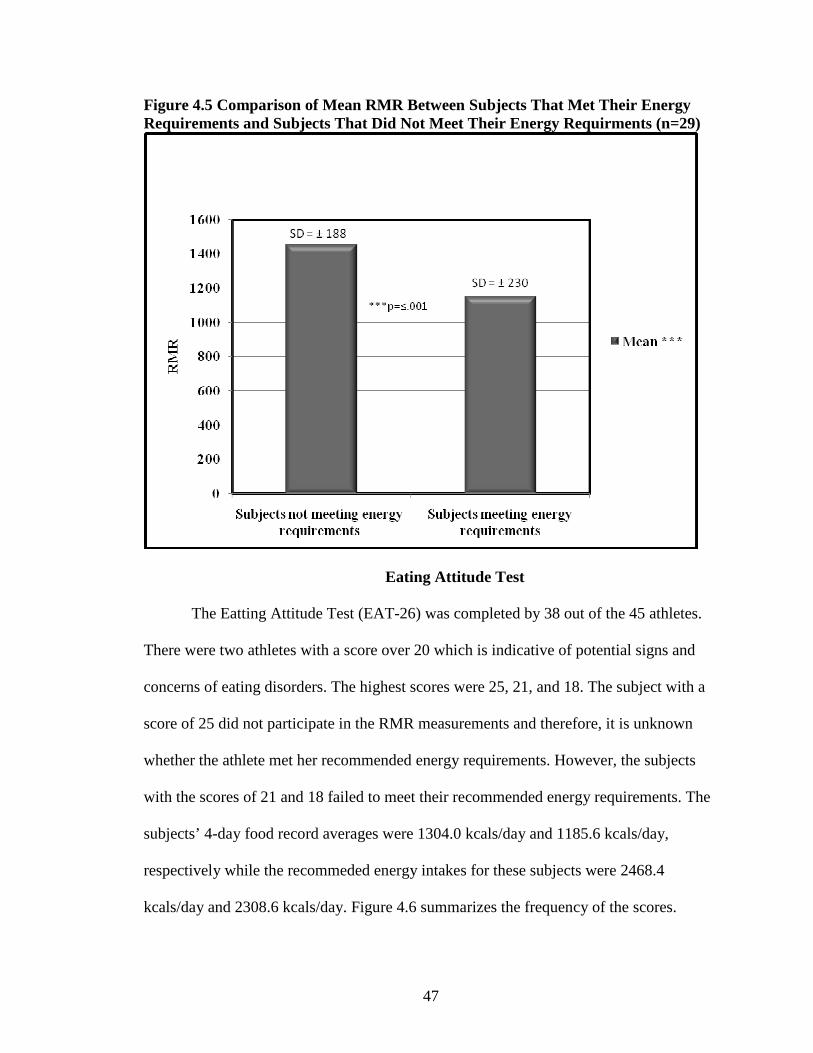
47
Figure 4.5 Comparison of Mean RMR Between Subjects That Met Their Energy Requirements and Subjects That Did Not Meet Their Energy Requirments (n=29)
Eating Attitude Test
The Eatting Attitude Test (EAT-26) was completed by 38 out of the 45 athletes.
There were two athletes with a score over 20 which is indicative of potential signs and
concerns of eating disorders. The highest scores were 25, 21, and 18. The subject with a
score of 25 did not participate in the RMR measurements and therefore, it is unknown
whether the athlete met her recommended energy requirements. However, the subjects
with the scores of 21 and 18 failed to meet their recommended energy requirements. The
subjects’ 4-day food record averages were 1304.0 kcals/day and 1185.6 kcals/day,
respectively while the recommeded energy intakes for these subjects were 2468.4
kcals/day and 2308.6 kcals/day. Figure 4.6 summarizes the frequency of the scores.
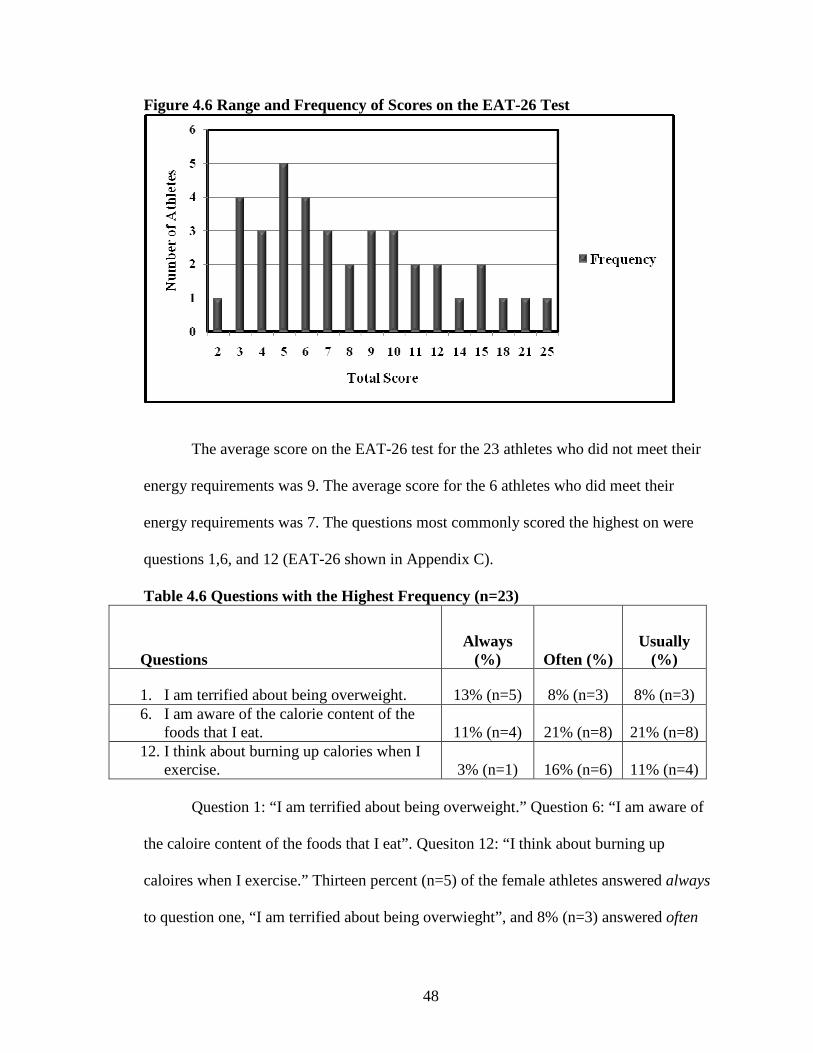
48
Figure 4.6 Range and Frequency of Scores on the EAT-26 Test
The average score on the EAT-26 test for the 23 athletes who did not meet their
energy requirements was 9. The average score for the 6 athletes who did meet their
energy requirements was 7. The questions most commonly scored the highest on were
questions 1,6, and 12 (EAT-26 shown in Appendix C).
Table 4.6 Questions with the Highest Frequency (n=23)
Questions Always
(%) Often (%) Usually
(%)
1. I am terrified about being overweight. 13% (n=5) 8% (n=3) 8% (n=3) 6. I am aware of the calorie content of the
foods that I eat. 11% (n=4) 21% (n=8) 21% (n=8) 12. I think about burning up calories when I
exercise. 3% (n=1) 16% (n=6) 11% (n=4)
Question 1: “I am terrified about being overweight.” Question 6: “I am aware of
the caloire content of the foods that I eat”. Quesiton 12: “I think about burning up
caloires when I exercise.” Thirteen percent (n=5) of the female athletes answered always
to question one, “I am terrified about being overwieght”, and 8% (n=3) answered often
49
and usually to the same question. Approximately 21% ( n=8) of the athletes answered
often and usually to questions #6, “I am aware of the caloire content of the foods that I
eat”, while 11% (n=4) answered always. Sixteen percent (n=6) of the athletes answered
often to question 12, “I think about burning up caloires when I exercise”, and 11% (n=4)
answered usually with only 3% (n=1) answering always. The total EAT score was
negatively associated with reported energy intakes of the subjects (r=-0.34; p=0.09) and
body fat % (r=-0.17; p=0.93). However to total EAT score was positively associated with
LBM (r=0.08; p=0.69). None of these relationships were statistically significant.
50
CHAPTER V
DISCUSSION
The main purpose of this study was to compare female athletes’ reported energy
intakes to their recommended energy requirements. The second purpose of the study was
to determine whether significant differences between measured RMR and estimated
RMR by Harris-Benedict and Cunningham equations exist in a sample of collegiate
female athletes. The third purpose of the study was to identify the relationship between
reported energy intakes and body composition of the female athletes, including LBM, FM
and body fat percentage. Finally, the relationship between individual’s reported energy
intake and score on the EAT-26 test was explored.
The majority of female athletes participating in this study failed to meet their energy
requirements. When we compared the athletes’ reported energy intakes with their
recommended energy intakes, we found that the average recommended energy intakes for
the sample was 2342.65 kcals per day, while the athletes in our sample reported
consuming only an average of 1704.50 kcals per day. This study’s results support
research indicating that female athletes do not meet their recommended energy
requirements and experience a negative energy balance on a regular basis (Mullinix et al,
2003; Hassapidou & Manstrantoni, 2001; Estok & Rudy, 1996; Estok & Rudy, 1996;
Edward, Lindeman, Mikesky, & Stager, 1993). For instance, Manstrantoni (2001) found
that all female athletes participating in their study, with the exception of volleyball
players, were in negative energy balance during the competitive season.

51
Research shows that female athletes with negative energy balances may compromise
their performance and their long-term health. Mullinix and colleagues (2003) state that
female athletes who consume less than 2400 kcals per day often have inadequate intakes
of calcium, magnesium, iron and zinc. Other micronutrients that can be inadequate with
long term insufficient energy intakes are niacin, riboflavin, vitamin B6, calcium, and iron
(Holschen, 2004; Mullinix, Jonnalagadda, Rosenbloom, Thompson, & Kickligher, 2003).
Notably, these vitamins and minerals do not provide energy; they play important roles in
the metabolism of macronutrients, which do provide energy. Therefore, athletes with low
energy intakes risk a negative energy balance and inadequate stores of some
micronutrients.
The second purpose of this study was to determine differences between measured
RMR and RMR estimated by Harris-Benedict and Cunningham equations. Accuracy of
estimated RMR is important in determining the precise daily energy requirements
specific for individual athletes. This study found that the Harris-Benedict and
Cunningham equations both estimated RMR significantly higher compared to the
measured RMR by Vmax metabolic cart. These results do not support the hypothesis for
this study which predicted RMR estimated using the Harris-Benedict equation will be
lower than measured RMR. Nor do our findings support previous research which
concluded that estimated RMR would be lower than measured RMR (Thompson &
Manore 1996). Thompson and Manore (1996) tested other equations used for estimating
RMR which included Mifflin et al. (1990) and Owens et al. (1986) (for male and
females) and found that predicted values were significantly lower than measured values
in all equations but the Cunningham. The Cunningham equation uses LBM as the only
52
variable and several studies conclude LBM is the best predictor of resting metabolic rate
(Thompson & Manore, 1996; Mifflin et al, 1990; Cunningham, 1980; Cunningham,
1982). However, our study indicates that the RMR estimated by the Cunningham
equation was significantly higher than the RMR measured by the V Max metabolic cart
and the RMR estimated by the Harris-Benedict equation. In this study the Harris-
Benedict equation is more accurate for estimating RMR than the Cunningham equation.
However, this study shows that the Harris-Benedict equation overestimated RMR of
individuals considered lean, whereas the Harris-Benedict equation is actually known to
underestimate RMR of lean individuals and overestimate energy requirements of obese
individuals (Harris & Benedict, 1919; Thompson & Manore, 1996; Owens et al, 1986).
Unfortunately, the validity of these equations in the athletic population has not been
adequately studied.
In this study, the body fat percentages and BMI were gathered on all subjects.
Body fat percentages conducive to peak performance vary among individual athletes.
Current body fat percent classifications for the general population range from 20-30%
(Sawyer, hypes, & Brown, 2003; Coleman, 2003; Armstrong, et al., 2006). In this study
27 out of 45 subjects fell into the general population’s normal range. The average BMI
and percent body fat of those with a BMI above 25 was 26.6 kg/m2 and 23%,
respectfully. In this study 8 athletes were classified as overweight: measured BMI above
25. This shows that even though their BMI fell in the overweight category, their body fat
percent was still within a healthy range. The average BMI and percent body fat of those
with a BMI lower than 20 (underweight) were 19.3kg/m2 and 17.4%, respectfully. Once
again, the BMI category classifies this group as underweight; however, their body fat
53
percentage is still classified as healthy for female athletes (American Counsel on
Exercise, 2009). BMI is an unsatisfactory assessment tool for athletes because it does not
account for LBM. LBM (or muscle) weighs more than FM. Therefore, a lean athlete may
classify as overweight or obese based on BMI measurements. The same is true with
athletes who may be classified as underweight; a small athlete with a low BMI could still
have a healthy body fat percentage.
The third purpose of this study was to determine the nature of the relationship
between reported energy intakes and body composition between those who met their
energy requirements and those who did not meet their energy requirements. This study’s
results showed that 23 of 29 female athletes (79%) did not meet their energy
requirements as measured by Vmax metabolic cart with added physical activity factor.
The 6 female athletes that met their total energy requirements averaged a LBM of 48.6
kg. This was less than the 23 female athletes who did not meet their energy requirements
and averaged a LBM of 54.2 kg. Also the subjects who met their energy requirnments
had a slightly higher, but not significant, amount of fat mass. Although previous research
shows that inadequate energy intakes lead to lower LBM (Bryner et al., 1999; Benardot
1996), our findings do not support this argument. Deutz and colleagues (2000) found that
energy deficits greater than 300kcals per day were significantly associated with higher
body fat in both DEXA-derived and skin fold-derived body fat percentages. Our study
also did not support the finding of Zachwieja and colleagues (2001) where short-term
dietary energy restriction (2 weeks) resulted in weight loss with most of the loss coming
from LBM. Our study did not measure energy deficits or weight loss over time, which
54
could account for our results not supporting previous research by Duetz and colleagues
(2000) and Zachwieja and colleagues (2001).
Although no differences in LBM and FM were detected between athletes who did
consume their recommended energy requirements and those that did not, our findings
support the argument that female athletes consume less energy than recommended and
their nutritional status may suffer as a consequence of low energy availability. Inadequate
energy intakes of athletes may also significantly influence their athletic performance not
only physically but mentally as well (Economos, Bortz, & Nelson, 1993). Economos,
Bortz, and Nelson (1993) state it is not uncommon for decreases in an athlete’s
performance to be traced back to poor energy intake. Previous research has suggested that
female athletes often restrict their energy intake despite having high energy demands
during training and competition (Manore, Kam, & Loucks, 2007; Edwards, Lindeman,
Mikesky, & Stager, 1993). Research has shown that energy deficient individuals will
often have a skewed (lower) measured RMR because of the body’s ability to adapt to low
energy intake (Deutz, Benardot, Martin, & Cody, 1999). This is known as adaptive
thermogenesis and can dramatically affect estimated RMR which can lead to lower
recommended energy intake in elite athletes (Benardot, 2007; Dulloo & Samee, 2001).
In our study the RMR of those that met their recommended energy requirements
was 1154kcals which was lower than the group who did not meet their recommended
energy requirements 1453kcal. Therefore the group who met their energy requirements
consumed less energy in order to meet the requirement. There was a positive but non-
significant relationship between RMR (measured by metabolic cart) and the reported
energy intake in the group of athletes who failed to meet their estimated total daily
55
energy needs and among those who met their total estimated daily energy needs, RMR
was also positively, but non-significantly, correlated with their energy intake. The
positive but non-significant correlation between reported energy intake and RMR shows
the higher the estimated energy needs, the higher the reported kcal intake. This suggests
that the higher the estimated energy needs, the harder it is to consume the recommended
calories.
Previous research by Deutz and colleagues (1999) suggests that long term energy
restriction may allow for the body to adapt to lower energy intakes thus lowering RMR.
Recent research indicates that athletes should maintain frequent small meals along with
adequate fluid intake to maintain body weight, body composition, and to maximize
energy levels to decrease fatigue (Benardot, 2007).
The fourth purpose of this study was to determine the relationship between EAT-
26 scores and reported energy intake. The total EAT scores were negatively associated
with reported energy intakes of the subjects. This association was not significant but
could show significance with a larger population.
Understanding the energy requirements of the female athlete is a relatively new
research area. More research has been performed with male athletes due to confounding
variables of female athletes such as menstruation. Research comparing female athletes
and energy intake focuses mostly on eating disorders rather than body composition
(Estok & Rudy, 1996; Kirk, Singh, & Getz, 2001; Kerr, Berman, & Jane De Souza,
2006). This study did not focus on eating disorders but did administer an EAT-26 test to
identify signs and symptoms of eating disorders. The EAT-26 test is not a diagnostic
indicator of eating disorders but subjects with a score greater than 20 are considered at
56
high risk for disordered eating. This study only had one subject with a score greater than
20. The highest scores on the EAT-26 test were 21 and 18. Interestingly, these subjects
did not meet their recommended energy requirements. These two subject’s energy
recommendations were among the average of the total group which does not fully support
previous research by Benardot (2007) and Dulloo & Samee (2001) suggest that long term
energy restriction can lead to lower RMR. This could be due to the fact that these specific
subjects have not been practicing energy restriction long term, but short term during
certain phases of their season. Although some studies found a very high prevalence of
eating disorders among female athletes (Milligan and Pritchard, 2006), only 2% of the
athletes in our sample scored at the cutoff for showing signs of clinical eating disorders.
This study’s results may be explained by the nature of the athletes in our study who were
primarily from sports that are less susceptible to eating disorders than aesthetic or weight-
restricted sports such as gymnastics.
Limitations
As mentioned above, underreporting energy intake could be a major limiation of
this study. Underreporting of energy intake is often seen in those indivuals who are not
satisified with their body. Studies show that when self reported energy intake is compared
with the double labeled water technique; evidence of underreporting is strong (McKeown
et al, 2001; Hill & Davies, 2001; Schoeller, 1995). Burke and colleagues (2001) state that
the more dissatisfied a person is with their body, the more likely they are to underreport
energy intake. Barbra and colleagues (2003) found that BMI and underreporting were
57
positively correlated, as well as underreporting and participation in aesthetic sports.
Female athletes also experience pressure from outside sources to have an ideal body
which can also lead to underreporting. Another aspect that can lead to
underreporting/overreporting is a knowledge deficit of food and nutrition when
completing the 3-day food record. This knowledge deficit can lead to overreporting of
some items, such as water intake, as well as underreporting of other items. Also
contributing to underreporting can be a time delay. If a subject does not record foods
eaten as soon as possible, their food record might not be as accurate as if they recorded
foods eaten at the precise time that they were consumed. In this study, there was a delay
in receiving some of the 3-day food records. This delay may have decreased the accuracy
of food items recorded.
This study had a relatively small sample size (n=45) and only a subsample of
subjects completed both the RMR measurement and returned a completed 3-day food
record. This small sample size makes determining significant differences between LBM
and FM of those that met energy requirments and those that did not meet energy
requirments, difficult. Previous research by Zachwieja and colleagues (2001) took
baseline measurements of body weight and body fat, then restricted energy intake for 2
weeks and re-measured body fat and body weight. Zachwieja and colleagues (2001)
found that short-term energy restriction reduces LBM. Therefore, not having
measurements of body weight and body fat over time is a limitation of our study. The
results of this study also cannot be generalized to all female athletes due to a relatively
small sample size. Also these results cannot be generalized for the entire population of
female athletes becuase only three sports were represented in this sample.
58
According to previous research, chronic low energy intake can lead to an
inaccurate measurement of RMR (Deutz, Benardot, Martin, & Cody, 1999). Therefore, it
is possible that the measured RMR of some of our subject’s could be metabolically
lowered due to long-term energy restriction.
Lastly, it is important to gather accurate data on energy intake in order to compare
energy intake to energy requirements. Ideally, food records would have been collected for
a longer period of time than the 4 days used in this study. Future studies should compile
a longer food record period (at least 7 days) and have the completed food records
returned as soon as possible (Trabulsi & Schoeller, 2001; Schoeller, 1995). Also,
nutrition education would improve the accuracy of the 3-day food records. In this study
athletes were presented with directions on completing the 3-day food record and
instructions on recording serving sizes. However subjects did not receive formal
education on completion or serving sizes. Accuracy could be improved if athletes
attended a session on measuring and recording serving sizes. In this study food records
were not collected from all subjects for various reasons, such as lack of time, withdrawal
from the sports team, and/or loss of contact with the athlete this decreased the number of
athletes included in overall measurements comparing recommended energy requirements
to reported energy intakes.
Conclusions
Based on the results of this study, the female athletes’ energy intake in our sample
was significantly lower than recommended energy requirements based on the indirect
59
metabolic rate measurements. This study also found that the athletes’ RMR estimated by
the Harris-Benedict and Cunningham equations was significantly overestimated
compared to the RMR measured by indirect calorimetry. Although further research is
warranted in this area with large and representative samples of female athletes from
various sports, our study suggests that the Harris-Benedict and Cunningham equations
may not represent a reliable tool for estimating RMR within the female athletic
population. Although not significant, there was a trend shown that the athletes who did
not meet their recommended energy requirements scored slightly higher on the EAT-26
test compared to those who met their energy recommendation. The question that received
the highest score on the EAT-26 test was “I am aware of the calorie content of the foods
that I eat” suggesting pressure to consume a small number of calories, thus achieving a
negative energy balance.
Implications for Practice
The results of this study support previous research indicating that female athletes
tend to under consume energy and that equations such as Harris-Benedict and
Cunningham may not represent accurate estimators of athletes’ RMR. In an ideal setting,
metabolic carts are the best method to measure RMR but if prediction equations are used,
the Harris-Benedict may estimate athletes’ RMR more accurately than the Cunningham
equation, as shown in our study. One of the main goals of nutritionists and other
professionals working with athletes should be to influence female athletes to consume the
recommended amount of energy. While providing nutrition education in order to increase
60
nutrition knowledge and make female athletes aware of the importance of adequate
energy and nutrient intakes. Professionals should guide and encourage female athletes to
increase energy intake throughout their days by eating small and frequent meals, with a
special emphasis on carbohydrate-rich meals that are essential for optimal athletic
performance.
The intention of athletic training is to maximize performance. However, athletes
may not consider energy balance when trying to obtain this goal. Too often achieving
maximum performance is centered on lowering body weight by decreasing energy intake.
This strategy ignores that fact that body composition is could be more important to
maximizing performance rather than overall weight. No specific standards currently exist
for ideal body fat percentage or weight for athletes (Rodriguez, DiMarco, & Langley,
2009; Jeukendrup & Gleeson, 2004). Ideal body composition and weight is highly
dependant on the particular individual and is based on individual characteristics such as
genetic predispositions, body frame, training regime, and past performances. Athletes
need specific, attainable, and measureable goals for body size and body composition
based on their individual needs. Female athletes and coaches must understand attainable,
healthy body sizes and body composition which should be accurately measured
throughout an athlete’s off-season, pre-season, and season.
Implications for Future Research
Further research is needed to compare reported energy intakes to recommended
energy requirements among different types of female athletes, including aesthetic and
61
weight-restricted sports. This study was initiated with a total of 45 subjects but only 29
subjects completed the entire study, including comparing reported energy intakes to
recommended energy requirements. A larger sample size would give more precise results
which could be generalized to the female athlete population.
Additional research is also warranted on the accuracy of various prediction
equations used to estimate RMR with both male and female athletes. While several
studies have been conducted on the validity of selected prediction equations in the past,
the results are not consistent because these studies used different methodologies and
diverse samples. Additionally, the accuracy of metabolic cart should be tested against
other measures of RMR. Although the metabolic cart has been validated for accuracy in
previous research (Pinnington, Wong, Tay, Green, & Dawson, 2001; Peel & Utsey,
1993), some still suggest the gold standard for testing resting metabolic rate is the double
labeled water technique (Kien & Ugrasbul, 2004).
62
REFERENCES
Ainslie, P.N., Reilly, T., & Westerterp, K.R. (2003). Estimating human energy expenditure. Journal of Sports Medicine. 33: 683-698. Armstrong, L., Balady, G.J., Berry, M.J., Davis, S.E., Davy, B.M., Davy, K.P., Franklin, B.A., Gordon, N.F., Lee, I., McConnell, T., Myers, J.N., Pizza, F.X., Rowland, T.W., Stewart, K., Thompson, P.D., & Wallace, J.P. (2006). ACSM’s Guidelines for Exercise Testing and Prescription Seventh Edition. Baltimore: Lippincott Williams & Wilkins. Bauer, J., Reeves, M.M., & Capra, S. (2004). The agreement between measured and predicted resting energy expenditure in patients with pancreatic caner: A pilot study. Journal of the Pancreas. 5: 32-40. Benardot, D. (1996). Working with young athletes: views of a nutritionist on the sports medicine team. International Sports Nutrition. 6: 110-120. Benardot, D. (2007).Timing of energy and fluid intake: New Concepts for Weight Control and Hydration. ACSM'S Health & Fitness Journal.11:13-19. Berning, J. R., & Steen, S.N. Nutrition for Sport and Exercise. Gaithersburg, Maryland. Aspen publishers, Inc., 1998. Bishop, N.C., Blannin, A.K., Walsh, N.P., Robson, P.J., & Gleeson, M. (1999). Nutritional aspects of immunosuppression in athletes. Journal of Sports Medicine. 28: 151-176. Broeder, C.E., Burrhus, K.A., Svanevik, L.S., & Wilmore, J.H. (1992). The effects of aerobic fitness on resting metabolic rate. American Journal of Clinical Nutrition. 55: 795-801. Bryner, RW., Ullrich, IH., Sauers, J., Donley, D., Hornsby, G., Kolar, M., & Yeater, R. (1999). Effects of resistance vs. aerobic training combined with an 800 calorie liquid diet on lean body mass and resting metabolic rate. Journal of the American College of Nutrition. 18: 115-121. (1999) Burke, L.M., Cox, G.R., Cummings, N.K., Desbrow, B. (2001). Guidelines for daily carbohydrate intake. Journal of Sports Medicine. 31: 267-299. Burke, L. M., Kiens, B., & Ivy, J.L. (2004). Carbohydrate and fat for training and recovery. Journal of Sports Science. 22: 15-30. Burrows, M., & Bird, S. (2000). The physiology of the highly trained female endurance runner. Sports Medicine. 4: 281-300.
63
Chen, Z., Wang, Z., Lohman, T., Heymsfield, S.B., Outwater, E., Nicholas, J.S., Bassford, T., LaCroix, A., Sherill, D., Punyanitya. M., Wu, G., & Going, S. (2007). Dual-Energy X-ray absorptiometry is a valid tool for assessing skeletal muscle mass in older women. Journal of Nutrition. 137: 2775-2780. Coleman, E. Eating for Endurance. Boulder CO. Bull Publishing Company. 2003. Cook, S.D., Harding, A.F., Thomas, K.A., Morgan, E.L., Schnurpfeil, K.M., & Haddad, R.J. (1987). Trabecular bone density and menstrual function in women runners. The American Journal Sports Medicine. 15:503-507. Crovetti, R., Porrini, M., Santangelo, A., & Testolin, G. (1997). The influence of thermic effect of food on satiety. European Journal of Clinical Nutrition. 52: 482-488. Cunningham, J.J. (1980) A reanalysis of the factors influencing basal metabolic rate in normal adults. American Journal of Clinical Nutrition. 33: 2372-2374 Cunningham, J.J. (1982) Body composition and resting metabolic rate; the myth of feminine metabolism. American Journal of Clinical Nutrition. 36: 721-726 Deutz, R.C., Benardot, D., Martin, D.E., & Cody, M.M. (2000). Relationship between energy deficits and body composition in elite female gymnasts and runners. Medicine & Science in Sports & Exercise. 32:659-668 Diet Analysis Plus version 8.0. (2007). Belmont, CA: Wadsworth/Thompson Learning. Dulloo, A.G. & Samec, S. (2001). Uncoupling proteins: their role in adaptive thermogenesis and substrate metabolism reconsidered. British Journal of Nutrition. 86: 123-139. Economos, C.D., Bortz, S.S., & Nelson, M.E. (1993). Nutritional practices of elite athletes. Journal of Sports Medicine. 16: 381-399. Edwards, J.E., Lindeman, A.K., Mikesky, A.E., & Stager, J.M. (1993). Energy balance in highly trained female endurance runners. Medicine and Science in Sports and exercise, 25: 1398-1404. Estok, P.J., & Rudy, E.B. (1996). The relationship between eating disorders and running in women. Research in Nursing and Health. 19: 377-387.
FAO/WHO/UNU (1985): Energy and Protein Requirements Report of a Joint Expert Consultation. WHO Technical Report Series, no 724. Geneva: WHO.
Fields, D.A., & Goran, M.I. (2000). Body composition techniques and the four-compartment model in children. Journal Applied Physiology. 89: 613-620.
64
Frankenfield, D.C., Muth, E.R., & Rowe, W.A. (1998). The Harris-Benedict studies of human basal metabolism: history and limitations. Journal of the American Dietetic Association. 98: 439-445.
Frankenfield, D., Roth-Yousey, L., & Compher, C. (2005). Comparison of predictive equations for resting metabolic rate in healthy non-obese and obese adults: a systematic review. Journal of American Dietetics Association. 105: 775-789.
Garner, D.M., & Garfinkel, PE. (1979). The eating attitudes test: an index of the symptoms of anorexia nervosa. Psychological Medicine. 9: 273-279.
Garner, D.M., Olmsted, M.P., Bohr, Y. & Garfinkel, P.E. (1982). The Eating Attitudes Test: Psychometric features and clinical correlates. Psychological Medicine. 12, 871-878. Gerlach, K.E., Burton, H.W., Dorn, J.M., Leddy, J.J., & Horvath, P.J. (2008). Fat intake and injury in female runners. Journal of International Society of Sports Nutrition. 5:1-8. Harris, A.J., & Benedict, F.G. (1919). A Biometric Study of Basal Metabolism in Man. Washington: Carnegie Institution of Washington. . Haskell, W.L., Lee, I.M., Pate, R.R., Powell, K., Blair, S.N. Franklin, B.A., Macera, C.A., Heath, G.W., Thompson, P.D., Bauman, A. (2007) Physical Activity and Public Health: Updated Recommendation for Adults from the American College of Sports Medicine and the American Heart Association. 39: 1423-1434. Hassapidou, M.N., & Manstrantoni, A. (2001). Dietary intakes of elite female athletes in Greece. The British Dietetic Association. 14: 391-296. Hill, R.J., & Davies, P.S.W. (2001). The validity of self-reported energy intake as determined using the doubly labeled water technique. British Journal of Nutrition. 85: 415-430. Holschen, J.C. (2004). The female athlete. The Southern Medical Association. 97. 852-858. Horvath, P. J., Eagen, C.K., Fisher, N.M., Leddy, J.J., & Pendergast, D.R. (2000). The effects of varying dietary fat on performance and metabolism in trained male and female runners. Journal of the American College of Nutrition, 19: 52-60. Horvath, P. J., Eagen, C.K., Ryer-Calvin. S.D., &. Pendergast, D.R. (2000). The effects of varying dietary fat on the nutrient intakes in male and female runners. Journal of American College of Nutrition, 19: 42-51. Jeukendrup, Asker & Michael Gleeson (2004). Sport Nutrition. United States of America. Human Kinetics, Inc.
65
Johnson, C., Powers, PS., & Dick, R. (1999). Athletes and eating disorders: the national collegiate athletic association study. International Journal of Eating Disorders. 26: 179-188. Kern, M. (2005). CRC desk reference on sports nutrition. Florida: Taylor & Francis. Kerr, G., Berman, E., & Mary JDS. Disordered eating in women’s gymnastics: Perspectives of athletes, coaches, parents, and judges (2006). Journal of Applied Sport Psychology. 18: 28-43. Lewis, R.D. (1997). Riboflavin and Niacin. In I.Wolinsky and J.A. Driskell, (Eds.), Sports nutrition: Vitamins and trace elements. (pp. 57-75). Boca Raton, FL: CRC Press.
Kien, LC., & Ugrasbul, F. (2004). Prediction of daily energy expenditure during a feeding trial using measurements of resting energy expenditure, fat-free mass, or Harris-Benedict equations. American Journal of Clinical Nutrition. 80: 876-880.
Kohrt, W.M. (1998). Preliminary evidence that DEXA provides an accurate assessment of body composition. Journal of Applied Physiology. 84: 372-377.
Kirk, G., Singh, K., & Getz, H. (2001). Risk of eating disorders among female college athletes and non athletes. 4:122-132. Krane, V., Stilite-Shipley, J., Waldron, J., & Michalenok, J. (2001) Relationship among body satisfaction, social physique anxiety, and eating behaviors in female athletes and exercisers. Journal of Sports Behavior. 34: 247-218. Lane, H.J., Lane, A.M., & Matheson, H. (2004). Validity of the eating attitude test among exercisers. Journal of Sports Science and Medicine. 3: 244-253 Liu, B., Woo, J., Tang, N., Ng, K., Ip, R., & Yu, A. (2001). Assessment of total energy expenditure in Chinese population by a physical activity questionnaire: examination of validity. International Journal of Food Sciences and Nutrition. 52: 269-282. Lorenzo, A,D., Bertini, I., Puijia, A., Testolin, G., Testolin, C. (1999) Comparison between measured and predicted resting metabolic rate in moderately active adolescents. International Journal Neurological Sciences. 36: 141-145. Loucks, A. B. (2007). Low energy availability in the marathon and other endurance sports. Sports Medicine. 37: 348-352. Loucks A. B. (2004) Energy balance and body composition in sports and exercise. Journal of Sports Sciences. 22: 1-14.
66
Lytle L.A., Nichaman M.Z., Obarzanek E., Glovsky E., Montgomery D., Nicklas T., Zive M., & Feldman H. (1993). Validation of 24-hour recalls assisted by food records in third-grade children. The CATCH Collaborative Group. Journal of the American Dietetic Association, 93: 1431-1436. Magkos, F., & Yannakoulia, M. (2003). Methodology of dietary assessment in athletes: concepts and pitfalls. Assessment of nutritional status and analytical methods. Current Opinion in Clinical Nutrition & Metabolic Care. 6:539-549 Manore, M.M. (2000). Effect of physical activity on thiamine, riboflavin, and vitamin B-6 Requirements. The American Journal of Clinical Nutrition. 72(supplement): 598S–606S. Manore, M.M. (2002). Dietary recommendations and athletic menstrual dysfunction. Journal of Sports Medicine. 32: 887-901. Manore, M.M., Barr, S.I., Butterfield, G.E. (2000). Position of the American Dietetic Association, Dietitians of Canada, and the American College of Sports Medicine: Nutrition and Athletic Performance. Journal of the American Dietetic Association. 100:1543-1556. Manore, M.M., Kam, L.C., & Loucks, A.B. (2007). The female athlete triad: Components, nutrition issues, and health consequences. Journal of Sports Sciences. 25: S61-S71. Maughan, Ron J. (1999) Role of micronutrients in sport and physical activity. British Medical Bulletin. 55: 683-690. McKeown, N.M., Day, N.E., Welch, A.A., Runswick, S.A., Luben, R.N., Mullugan, A.A. Mctaggart, A., & Bingham, S.A. (2001). Use of biological markers to validate self-reported dietary intake in a random sample of the European prospective investigation into cancer United Kingdom Norfolk cohort. American Journal Clinical Nutrition. 74: 188-196. Mifflin, M.D., Jeor, S.T., Hill, L.A., Scott, B.J., Daugherty, S.A., & Koh, Y.O. (1990). A new predictive equation for resting energy expenditure in healthy individuals. American Journal of Clinical Nutrition. 51: 241-247. Milligan, BA., & Pritchard, M. (2006). The relationship between gender, type of sport, body dissatisfaction, self esteem and disordered eating behaviors in division I athletes. Journal of Sport Psychology. 8: 32-46. Morgenthal, A.P. (2002). Female athlete triad. Journal of Chiropractic Medicine. 1: 97-106.
67
Moshfegh, A., Borud, L., Perloff, B., LaComb, R. (1999). Improved method for the 24-hour dietary recall use in national surveys. FASEB, 13(4):A603. Mullinix, M.C., Jonnalagadda, S.S., Rosenbloom, C.A., Thompson, W.R., & Kicklighter, J.R. (2003). Dietary intakes of US soccer players. Nutrition Research. 23: 585-583. Nichols, David L., Charlotte F. Sanbourn and Eve V. Essery. (2007). Bone density and young athletic women. Sports Medicine. 37: 1001-1014. Nielsen, K., Kondrup, J., Martinsen, L., Stilling, B., & Wikman. (1993). Nutritional assessment and adequacy of dietary intake in hospitalized patients with alcoholic liver cirrhosis. British Journal of Nutrition. 69: 665-679. Nieman, D.C. (2007). Exercise testing and prescription: A health-related approach (6 ed.). New York: McGraw-Hill. Owens, O.E., Kavle, E., Owens, R.S., Polansky, M., Caprio, S., Mazzoli, M.A., Kendrick, Z.V., Bushman, M.C., & Boden, G. (1986) A reappraisal of caloric requirements in healthy women. American Society for Clinical Nutrition. 44: 1-19. Peel, C. & Utsey, C. (1993). Oxygen consumption using the K2 telemetry system and a metabolic cart. Medicine & Science in Sports & Exercise. 25: 369-400. Pendergast, D. R. E., Leddy, J.J., Venkatraman, J.G. (2000). A perspective on fat intake in athletes. Medicine and Biomedical Sciences, 19: 345-353. Phillips, S.M. (2006). Dietary protein for athletes: from requirements to metabolic advantage. 6: 647-654. Pinnington, Hugh C., Wong, P., Tay, J., Green, D. & Dawson, B (2001). The level of accuracy and agreement in measures of FEO2, FECO2 and V�E between the consumed K4b2 portable, respiratory gas analysis system and a metabolic cart. Journal of Science and Medicine in Sport. 4: 324-335 Plank, L.D. Dual-energy x-ray absorptiometry and body composition. (2005) Current Opinion in Clinical Nutrition & Metabolic Care. 8:305-309.
Punpilai, S., Sriareporn, T., Ouyporn, T., Teraporn, V., & Sombut, B. (2005) Menstrual status and bone mineral density among female athletes. Nursing and Health Sciences. 7: 259-265.
Quintas, M.E., Ortega, R.M., Lopez-Sobaler A.M., Garrido, G., & Requejo, A.M. (2003). Influence of dietetic and anthropometric factors and of the type of sport practiced on bone density in different groups of women. European Journal of Clinical Nutrition. 57:558-562.
68
Rodriguez, N.R., DiMarco, N.M., Langley, S. (2009). Position of the American Dietetic Association, Dietitians of Canada, and the American college of Sports Medicine: Nutrition and Athletic Performance. Journal of the American Dietetic Association. 109: 509-527. Sawyer, T.H., Hypes, M.G., & Brown, J. (2003). A guide to sports nutrition. Sayamore publishing, Champaign, Illinois. Schoeller, D.A. (1995). Limitations in the assessment of dietary energy intake by self-report. Metabolism. 44: 18-22. Schoeller, D.A., Colligan, A.S., Shriver, T., Avak, H., Bartok-Olson, C. (2000). Use of an automated chromium reduction system for hydrogen isotope ratio analysis of physiological fluids applied to doubly labeled water analysis. Journal of Mass Spectrometry. 35: 1128-1132.
Schulz, L.O., Alger, S., Harper, I., Wilmore, J.H., & Ravussin, E. (1992). Energy expenditure of elite female runners measured by respiratory chamber and doubly labeled water. Journal of Applied Physiology. 72: 23-28.
Sjodin, A.M., Forslund, A.H., Westerterp, K.R., Andersson, A.B., Forslund, J.M., & Hambraeus, L.M. (1995). The influence of physical activity on BMR. Medicine and Science in Sports and Exercise. 28: 85-91.
Smith, A., Petrie, T., (2008). Reducing the risk of disordered eating among female athletes: a test of alternative interventions. Journal of Applied Sport Psychology. 20: 392-407. Sundgot-Borgen, J. (2004). Prevalence of Eating Disorders in Elite Athletes Is Higher than in the General Population. Clinical Journal of Sport Medicine. 14:25-32.
Thompson, J., & Manore, M.M. (1996). Predicted and measured resting metabolic rate of male and female endurance athletes. Journal of American Dietetic Association. 96: 30-34. Thompson, S. H. (2007). Characteristics of the female athlete triad in collegiate cross-country runners. Journal of American College Health. 56: 129-136. Trabulsi, J., & Schoeller, DA. (2001). Evaluation of dietary assessment instruments against doubly labeled water, a biomarker of habitual energy intake. American Journal of Physiology- Endocrinology and Metabolism. 281: E891–E899. USDA. (1998). Design and operation. The Continuing Survey of Food Intakes by Individuals and the Diet and Health Knowledge Survey, 1994-1996. Washington D.C: US Department of Agriculture, Report No. 96-1.
69
Venes, D., Biderman, A., Alder, E., Fenton, B., Enright, A. (Eds). (2005). Taber’s Cyslopedic Medical Dictionary. Philadelphia, PA: F.A. Davis Company. Waterlow, J.C. (1986). Metabolic adaptation to low intakes of energy and protein. Annual Reviews of Nutrition. 6: 495-526. Weibel, E.R., & Hoppeler, H. (2005). Exercise-induced maximal metabolic rate scales with muscle aerobic capacity. The Journal of Experimental Biology. 208: 1635-1644. Weight Control Information Network. Statistic related to over weight and obesity. http://win.niddk.nih.gov/statistics/index.htm Accessed April 4, 2006. Westerterp-Plantenga, M.S. (2004). Fat intake and energy balance effects. Journal of Physiology & Behavior. 83: 579-585. Williams, N.I., Helmreich, D.L., Parfitt, A.C.B., & Cameron, J.L. (2002). Evidence for a causal role of low energy availability in the induction of menstrual cycle disturbances during strenuous exercise training. Journal of Clinical Endocrinology and Metabolism. 86: 5184–5193.
Zachwieja, J.J., Ezell, D.M., Cline, A.D., Ricketts, J.C., Vicknair, S.M., Ryan, D.H. (2001). Short-term dietary energy restriction reduces lean body mass but not performance in physically active men and women. International Journal Sports Medicine. 22: 310-316. Zalcman, I., Guarita, H.V., Juzwiak, C.R., Crispim, C.A., Anntunes, H.K.M., Edwards, B., Tufik, S., de Mello, M.T. (2007). Nutritional status of adventure racers. Nutrition. 23: 404-411. Zello, G.A., (2006). Dietary reference intakes for the macronutrients and energy: consideration for physical activity. Journal of Applied Physiology Nutrition and Metabolism. 31: 74-79. Ziegler, P.J., & Jonnalagadda, S.S. (2006). Nutrient intake is inadequate for US national synchronized skaters. 26: 313-317. Ziegler, P.J., Nelson, J.A., Barratt-Fornell, A., Fiveash, L., Drewnowski, A. (2001). Energy and macronutrient intakes of elite figure skaters. Journal of American Dietetic Association. 101: 319-325.
70
APPENDIX
APPENDIX A INFORMED CONSENT FOR PARTICIPANTS
Project Title: Nutrition-related Parameters, Dietary Intakes, and Food and Exercise-Related Attitudes among Collegiate Athletes Project Leaders: Lenka Humenikova, PhD; Nancy Betts, PhD, RD; Brenda Smith, PhD We are asking you to participate in a study measuring body composition, metabolic rate,
food intake and attitudes about food and exercise in pre-season, season, and off-season.
We are asking you to volunteer to participate because you are an OSU student athlete
who is 18 years of age or older. The purpose of this study is to assess nutrition-related
parameters, dietary intakes, and food- and exercise- related behaviors and attitudes
among OSU collegiate athletes and monitor changes that occur throughout the year.
The ultimate purpose of this research project is to make recommendations for dietary
intakes that will optimize athletic performance of OSU male and female athletes. You
must be 18 years old or older to be able to participate in this study. You will be invited to make one visit to the Department of Nutritional Sciences during
the pre-
season, season, and off-season (a total of 3 visits). Each visit will take approximately 1.5-
2 hours.
Your body composition and bone density will be measured using the Dual Energy X-ray
Absorptiometry (DEXA). DEXA is currently the most accurate scan that measures body
composition and bone density. You will be asked to dress in comfortable clothing (we
will provide
clothing if needed), removing any metal (excluding orthodontic braces). During the
scan, you will
lay on an examination table while a machine arm passes over his body. You will feel no
discomfort. The X-ray exposure from DEXA is much smaller than exposure from a chest
X-ray
(approximately 10 times less). The scan will take approximately 10-15 minutes,
including all the
preparation procedures.
Your body composition will also be measured using standard skinfold thickness
measurements. A
trained researcher will measure your body fat using calipers in 7 different places on the
body (arm,
stomach, back etc.). This measurement will take approximately 10 minutes. Before the
body
composition measurement, we will measure your height and weight. Because body
composition
71
affects metabolic rate, we will measure your resting metabolic rate during each visit.
You will sit
in a semi-recumbent chair with a clear canopy placed over your head. You will be asked
to rest as
much as possible. We will measure the amount of oxygen you breathe in and the
amount of
carbon dioxide you breathe out with each breath for approximately 20-30 minutes.
In addition, during each visit, you will also be asked to remember what foods and
beverages you ate during the previous day. This activity will take about 10-15 minutes.
You will be also asked to complete two questionnaires that contain items related to your
diet history, hydration, body weight, and other nutrition- and exercise-related topics. It
will take approximately 10 minutes to fill out the questionnaires. Lastly, you will be
instructed on how to complete a food record and you will be asked to complete a 3-day
food record at home. To complete a 3-day food record, you will be asked to write down
all foods and beverages you consume within the next 3 days
immediately following your visit.
The measurements that will be completed are not medical procedures and no medical
diagnoses will be made. However, you will benefit from the study by receiving results
of the study through your athletic trainers. The results of these tests will be useful for
determining the optimal nutrition for your sport. Your performance may be optimized
as a result of this knowledge. If you are a male, there are no known risks associated
with this research study which are greater than those ordinarily encountered in daily
life. If you are a female, you must not be pregnant while participating in this study.
Although the radiation dose from the DEXA scans is very low, there may be some risks
to an embryo or fetus, including birth defects. If you become pregnant or suspect that
you are pregnant during the course of this study, you will be asked to do a pregnancy
test (urine test) prior to having a DEXA scan. The pregnancy test kit will be provided to
any female athlete that requests it. If pregnancy is confirmed, you will not be allowed to
have the DEXA scan performed, but may participate in the other assessment associated
with the study.
We will protect your confidentiality during the project by assigning you an ID number.
The list of all names and corresponding ID numbers will be kept in a locked drawer and
only the project leaders will have access to the list. Your measurements will be obtained
in a separate room without the presence of other individuals. Any reports we prepare
from the study will be for grouped data and no individual will be identified. None of
the results of the measurements will be shared with your coach.
The OSU Institutional Review Board has the authority to inspect consent records and
data files to assure compliance with approved procedures. The participation in the study
is voluntary. If you feel uncomfortable while reporting any information, you can choose
72
not to answer any question, or to withdraw completely from the study at any time. A
decision to withdraw from the study will not result in any loss of benefits to which you
are otherwise entitled.
If you have questions about the project, please contact Lenka Humenikova at (405) 744-
8285 or [email protected] or Nancy Betts at (405) 744-5040 or
[email protected] or Brenda Smith at 744-3866 or [email protected]. If you
have any questions about your rights as a research participant, you may contact Dr. Sue
Jacobs, Institutional Review Board Chair, 218 Cordell Hall, Oklahoma State University,
Stillwater, OK 74078 at (405) 744-1676. DOCUMENTATION OF INFORMED CONSENT
You are voluntarily making a decision whether or not to participate in the
research study. Your signature certifies that you have decided to participate
having read and understood the information presented. You will be given a
copy of this consent form to keep. I have read and fully understand the consent form. I,____________________________(print name), agree to participate in the described research. _____________________________ ________________________ Signature Date I certify that I have personally explained this document before requesting that the participant sign it. _________________________________________________________________ _______________ Signature of PI Date
73
INFORMATION RELEASE FORM
Your signature certifies that the project leaders have your permission to send the results
of your measurements to your team athletic trainer(s) who will then share the results
with you. If the measurements collected during the study indicate that you may have
any potential nutrition-related problems, the project leaders will make nutrition
recommendations through your athletic trainer(s) and suggest a referral to your team
physician.
I fully understand the information release form. I, ____________________________(print name), give permission to the project leaders to share the results of my measurements with my athletic trainer(s). __________________________________ ____________________ Signature Date
74
APPENDIX B APPROVAL LETTER FROM OSU
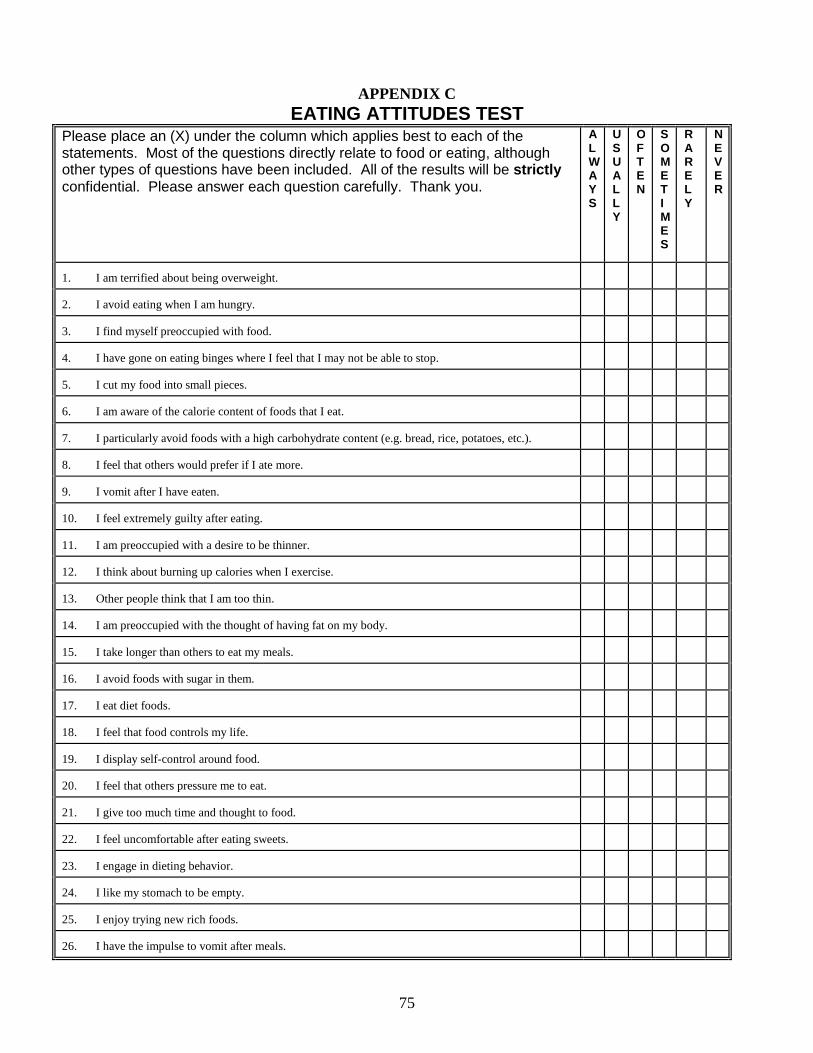
75
APPENDIX C EATING ATTITUDES TEST
Please place an (X) under the column which applies best to each of the statements. Most of the questions directly relate to food or eating, although other types of questions have been included. All of the results will be strictly confidential. Please answer each question carefully. Thank you.
ALWAYS
USUALLY
OFTEN
SOMETIMES
RARELY
NEVER
1. I am terrified about being overweight.
2. I avoid eating when I am hungry.
3. I find myself preoccupied with food.
4. I have gone on eating binges where I feel that I may not be able to stop.
5. I cut my food into small pieces.
6. I am aware of the calorie content of foods that I eat.
7. I particularly avoid foods with a high carbohydrate content (e.g. bread, rice, potatoes, etc.).
8. I feel that others would prefer if I ate more.
9. I vomit after I have eaten.
10. I feel extremely guilty after eating.
11. I am preoccupied with a desire to be thinner.
12. I think about burning up calories when I exercise.
13. Other people think that I am too thin.
14. I am preoccupied with the thought of having fat on my body.
15. I take longer than others to eat my meals.
16. I avoid foods with sugar in them.
17. I eat diet foods.
18. I feel that food controls my life.
19. I display self-control around food.
20. I feel that others pressure me to eat.
21. I give too much time and thought to food.
22. I feel uncomfortable after eating sweets.
23. I engage in dieting behavior.
24. I like my stomach to be empty.
25. I enjoy trying new rich foods.
26. I have the impulse to vomit after meals.
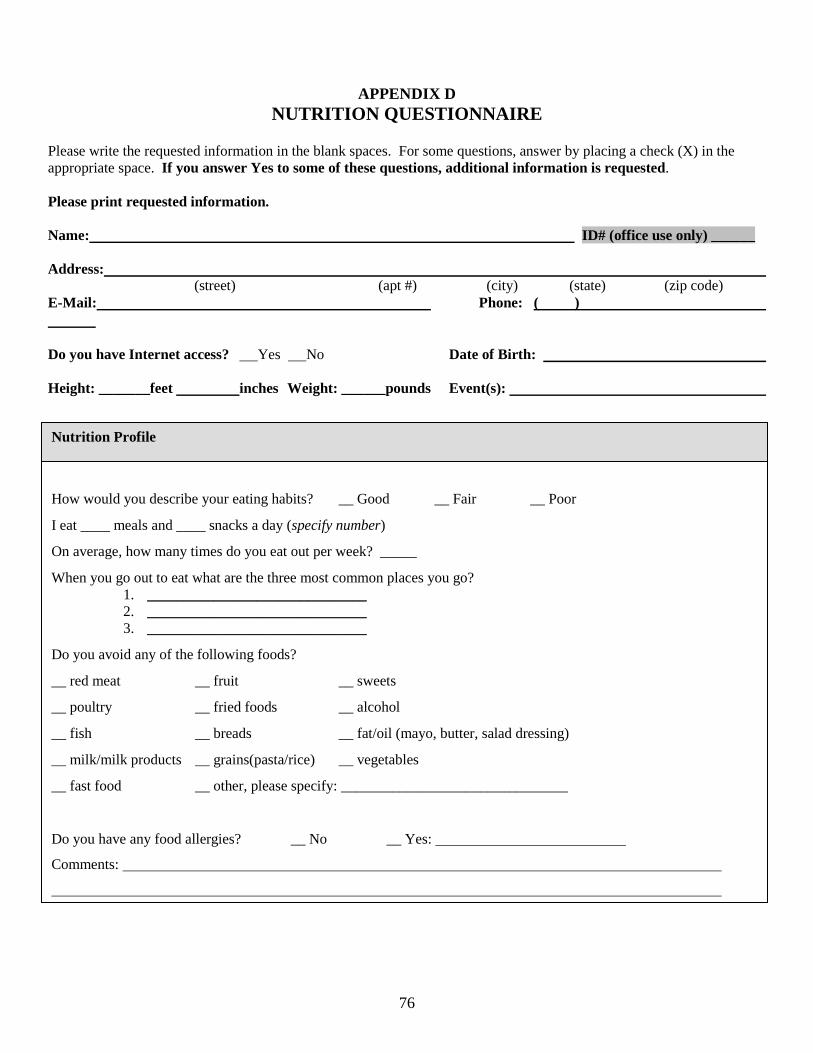
76
APPENDIX D NUTRITION QUESTIONNAIRE
Please write the requested information in the blank spaces. For some questions, answer by placing a check (X) in the appropriate space. If you answer Yes to some of these questions, additional information is requested. Please print requested information. Name: ID# (office use only) ______ Address: (street) (apt #) (city) (state) (zip code) E-Mail: Phone: ( ) Do you have Internet access? Yes No Date of Birth: Height: _______feet inches Weight: ______pounds Event(s):
How would you describe your eating habits? __ Good __ Fair __ Poor
I eat ____ meals and ____ snacks a day (specify number)
On average, how many times do you eat out per week? _____
When you go out to eat what are the three most common places you go? 1. ______________________________ 2. ______________________________ 3. ______________________________
Do you avoid any of the following foods?
__ red meat __ fruit __ sweets
__ poultry __ fried foods __ alcohol
__ fish __ breads __ fat/oil (mayo, butter, salad dressing)
__ milk/milk products __ grains(pasta/rice) __ vegetables
__ fast food __ other, please specify: _______________________________
Do you have any food allergies? __ No __ Yes:
Comments:
Nutrition Profile
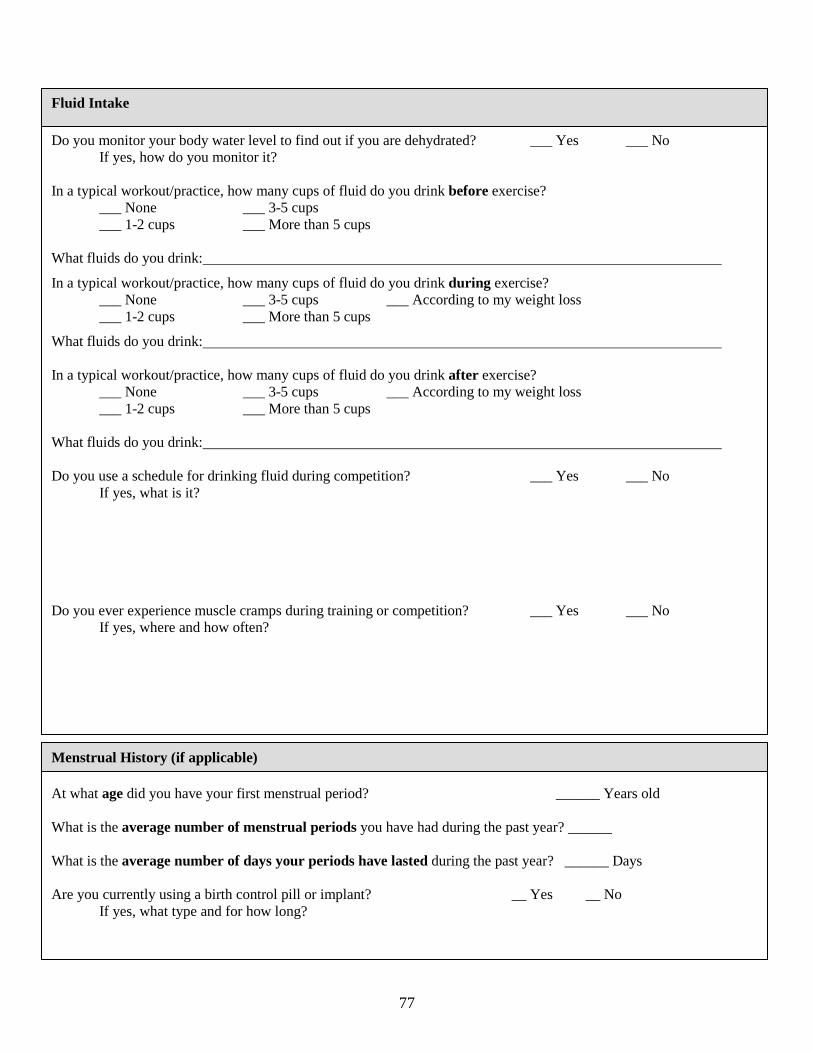
77
Fluid Intake
Do you monitor your body water level to find out if you are dehydrated? ___ Yes ___ No If yes, how do you monitor it? In a typical workout/practice, how many cups of fluid do you drink before exercise? ___ None ___ 3-5 cups ___ 1-2 cups ___ More than 5 cups What fluids do you drink:
In a typical workout/practice, how many cups of fluid do you drink during exercise? ___ None ___ 3-5 cups ___ According to my weight loss
___ 1-2 cups ___ More than 5 cups
What fluids do you drink: In a typical workout/practice, how many cups of fluid do you drink after exercise?
___ None ___ 3-5 cups ___ According to my weight loss ___ 1-2 cups ___ More than 5 cups What fluids do you drink: Do you use a schedule for drinking fluid during competition? ___ Yes ___ No If yes, what is it? Do you ever experience muscle cramps during training or competition? ___ Yes ___ No If yes, where and how often?
At what age did you have your first menstrual period? ______ Years old What is the average number of menstrual periods you have had during the past year? ______ What is the average number of days your periods have lasted during the past year? ______ Days Are you currently using a birth control pill or implant? __ Yes __ No If yes, what type and for how long?
Menstrual History (if applicable)
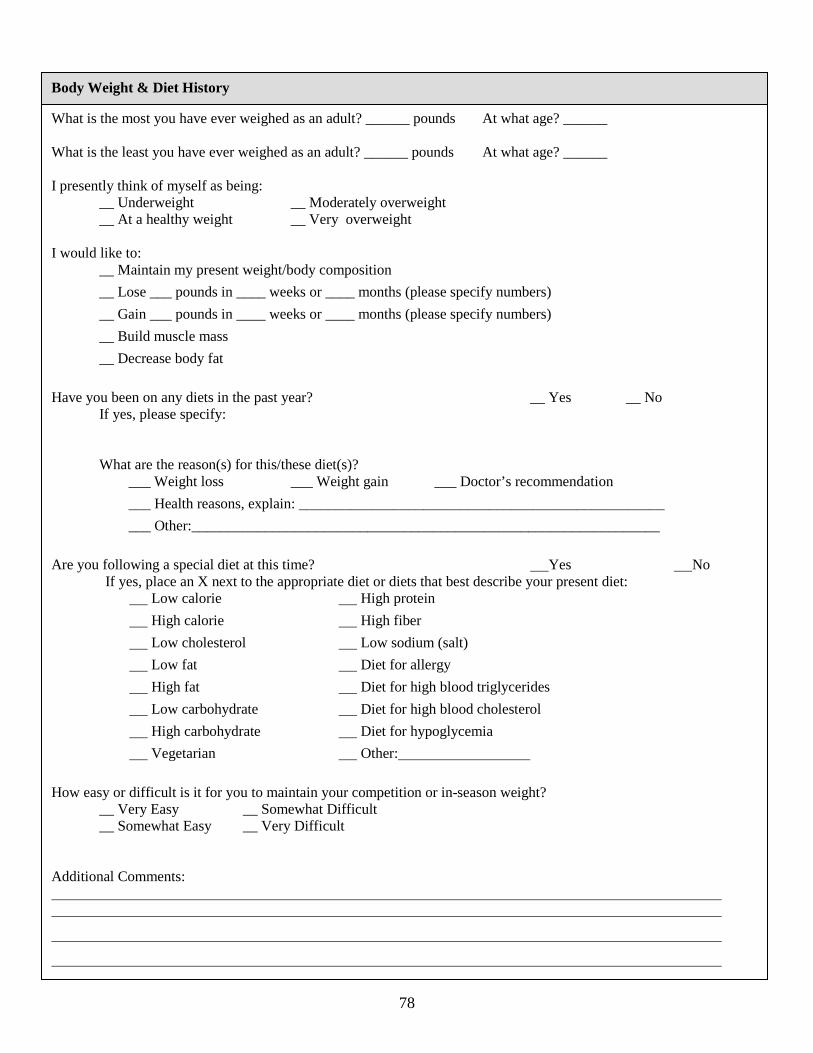
78
Body Weight & Diet History
What is the most you have ever weighed as an adult? ______ pounds At what age? ______ What is the least you have ever weighed as an adult? ______ pounds At what age? ______ I presently think of myself as being: __ Underweight __ Moderately overweight __ At a healthy weight __ Very overweight I would like to: __ Maintain my present weight/body composition
__ Lose ___ pounds in ____ weeks or ____ months (please specify numbers)
__ Gain ___ pounds in ____ weeks or ____ months (please specify numbers)
__ Build muscle mass
__ Decrease body fat
Have you been on any diets in the past year? __ Yes __ No If yes, please specify: What are the reason(s) for this/these diet(s)? ___ Weight loss ___ Weight gain ___ Doctor’s recommendation
___ Health reasons, explain: __________________________________________________
___ Other:________________________________________________________________
Are you following a special diet at this time? Yes No If yes, place an X next to the appropriate diet or diets that best describe your present diet: Low calorie High protein
High calorie High fiber
Low cholesterol Low sodium (salt)
Low fat Diet for allergy
High fat Diet for high blood triglycerides
Low carbohydrate Diet for high blood cholesterol
High carbohydrate Diet for hypoglycemia
Vegetarian Other:
How easy or difficult is it for you to maintain your competition or in-season weight? __ Very Easy __ Somewhat Difficult __ Somewhat Easy __ Very Difficult Additional Comments:
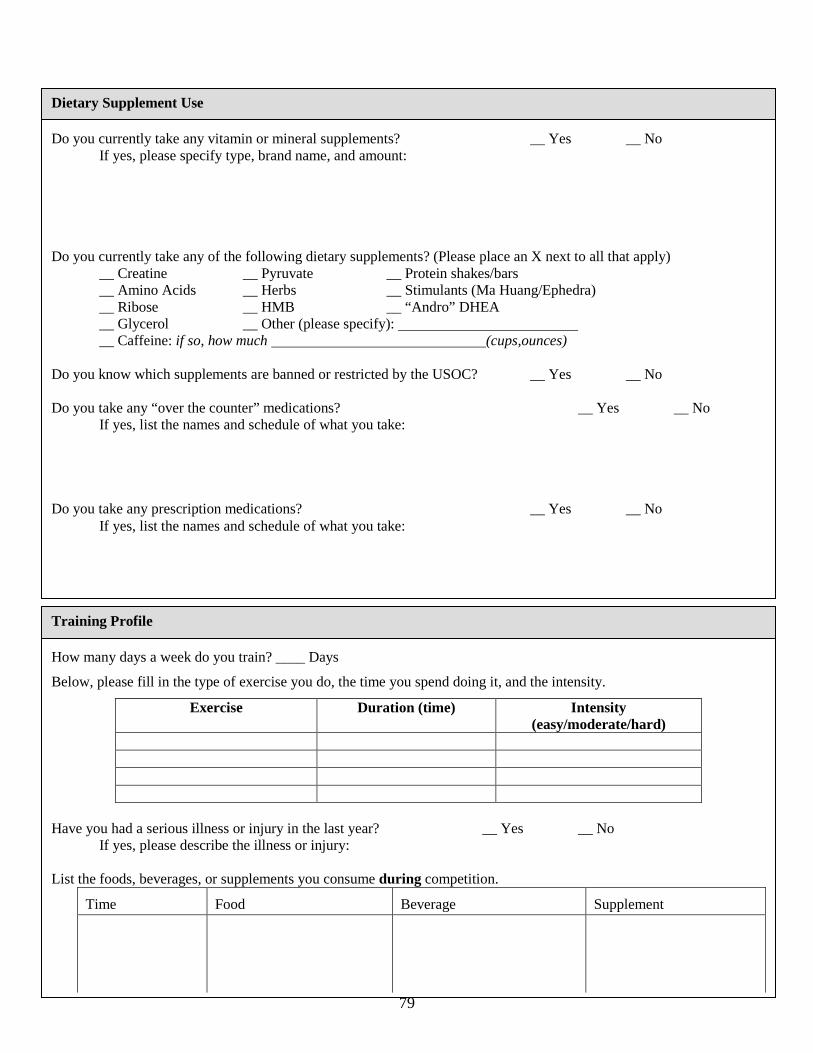
79
Do you currently take any vitamin or mineral supplements? __ Yes __ No If yes, please specify type, brand name, and amount: Do you currently take any of the following dietary supplements? (Please place an X next to all that apply) __ Creatine __ Pyruvate __ Protein shakes/bars __ Amino Acids __ Herbs __ Stimulants (Ma Huang/Ephedra) __ Ribose __ HMB __ “Andro” DHEA
__ Glycerol __ Other (please specify): __ Caffeine: if so, how much (cups,ounces)
Do you know which supplements are banned or restricted by the USOC? __ Yes __ No Do you take any “over the counter” medications? __ Yes __ No If yes, list the names and schedule of what you take: Do you take any prescription medications? __ Yes __ No If yes, list the names and schedule of what you take:
Dietary Supplement Use
How many days a week do you train? ____ Days
Below, please fill in the type of exercise you do, the time you spend doing it, and the intensity.
Exercise Duration (time) Intensity (easy/moderate/hard)
Have you had a serious illness or injury in the last year? __ Yes __ No If yes, please describe the illness or injury: List the foods, beverages, or supplements you consume during competition.
Time
Food
Beverage
Supplement
Training Profile
80
Do you have problems following your training and competition diet when traveling? Yes No If yes, what problems do you have? Rate the quality of your current dietary habits/plan for your Training Phases by putting the RATING SCALE number in the blanks before each Training Phase. RATING SCALE: 1 = Excellent 5 = Poor Training Phase Diet Rating Comments (if applicable) Training Pre-competition During Competition Post-competition
Training Profile Continued
Do you have regular blood tests for iron status? __ Yes __ No
If yes, please specify: __ Ferritin
__ HCT
__ HGB
__ Other:
Do you take iron supplements? __ Yes __ No
Please indicate the topics you would like to learn about by placing an X next to “Yes”.
Changing body composition __ Yes Optimal Nutrient Intake Timing __ Yes
Increasing energy __ Yes Nutrition programs for peak performance __ Yes Avoiding cramps and nausea __ Yes Tips for eating out __ Yes Tips on eating for injury recovery __ Yes Tips of snacking __ Yes Other, please specify: If you have additional comments or question please indicate them below:
Additional Information
VITA
Gena Suela Crenshaw
Candidate for the Degree of
Master of Science or Arts
Thesis: ENERGY INTAKES OF FEMALE COLLEGIATE ATHLETES
Major Field: Nutritional Sciences Biographical:
Personal Data: Born in Stillwater, Oklahoma, on September 5, 1984, the daughter of Gene and Carla Wollenberg.
Education: Graduated from Perkins-Tryon High School, Perkins, Oklahoma in
May 2003; received Bachelor of Science degree in Nutritional Sciences with honors from Oklahoma State University, Stillwater Oklahoma May 2008. Completed the requirements for the Master of Science in Nutritional Sciences at Oklahoma State University, Stillwater, Oklahoma in May 2009.
Experience: Employed by Oklahoma State University, Colvin Center Recreation, Personal Trainer and Group Fitness Instructor from August 2006-present. Employed by Oklahoma State University, Department of Nutritional Sciences as a graduate teaching assistant from June 2008 to December 2008. Professional Memberships: American Dietetic Association
(Student Liaison), Sports, Cardiovascular, and Wellness Nutritionists, Oklahoma Dietetic Association, North Central District Dietetic Association (President- Elect), Phi Kappa Phi National Honor Society.

ADVISER’S APPROVAL: Lenka Shriver Ph.D.
Name: Gena Suela Crenshaw Date of Degree: May, 2009 Institution: Oklahoma State University Location: OKC or Stillwater, Oklahoma Title of Study: ENERGY INTAKES OF FEMALE COLLEGIATE ATHLETES
Pages in Study: 79 Candidate for the Degree of Master of Science
Major Field: Nutritional Sciences Scope and Method of Study: The main purpose of this study was to evaluate energy intakes in a sample of female collegiate athletes and compare their reported energy intakes to the total daily energy needs. The second purpose of the study was to determine whether differences between RMR measured by indirect calorimetry and RMR estimated by the Harris-Benedict and Cunningham equations exist in the target population. The third purpose of the study was to explore the relationship between energy intake and body composition, including lean body mass and fat mass in the target population. Finally, the relationship between athletes’ reported energy intake and eating attitudes was explored. This exploratory study used a convenience sample of collegiate athletes and 45 female athletes were recruited from several teams including soccer (n=18), cross-country and/or track and field (n=16), and basketball (n=11). Athletes were assessed for body composition using a Hologic DEXA scanner. RMR for each athlete was measured using indirect calorimetry (Vmax Encore metabolic cart, Viasys) as well as estimated by the Harris-Benedict and Cunningham equations. Each athlete completed a 24 hour recall, 3-day food record, and eating attitude test. Measured RMR was compared to estimated RMR. Recommended energy intake based on measured RMR was compared to reported energy intake from a 4-day energy intake average. Findings and Conclusions: The results of this study indicated that subjects’ consumed a significantly lower amount of energy compared to their daily energy recommendations. Only six out of 29 subjects who completed the dietary and metabolic measurements met their total daily energy needs. The Harris-Benedict and Cunningham equations were not reliable tools for estimating RMR within this athletic population, with both estimating RMR to be significantly higher than the RMR measured using indirect calorimetry. There was no significant difference in body composition between athletes who reported consuming the recommended amount of energy and those who failed to meet their total daily energy requirements.