energy + innovation for the life of your building energy/facilities connection 05.21.08 ryan...
TRANSCRIPT

ENERGY + INNOVATIONFOR THE LIFE OF YOUR
BUILDING
Energy/Facilities Connection 05.21.08
Ryan Dickerson - Analyst | McKinstry
Agenda Introductions (Ryan Dickerson, McKinstry) What is Total Cost of Ownership? Case Studies Questions?

McKinstry Overview… 47 Year old Seattle Headquartered Company
WA, OR, ID, CO, MN, & WY pre-qualified ESCO Offer Full Service M/E/P Design & Construction Services Largest Dedicated Energy Services Group in the PNW Perform Projects of all sizes ($50k to $15M) Financially strong - $100M in bonding capacity 1200+ dedicated employees (500 professionals & 700 trades) 55 Engineers with 23 LEED Accredited Professionals

Total Cost of Ownership

Where did Total Cost of Ownership Come From?
Developed in the late 1980’s in the computer industry to manage the cost of IT infrastructure
Found that 1st costs were minor in comparison to infrastructure & support costs
Developed an integrated financial modeling tool for projects

Difficulties in Achieving High Performance Buildings
Typical approaches are fragmented – not integrated! No connections between first costs, operations costs, and
sustainability Design decisions are often first cost driven Last minute Value Engineering! LEED is based on a scorecard and not long term building
functionality
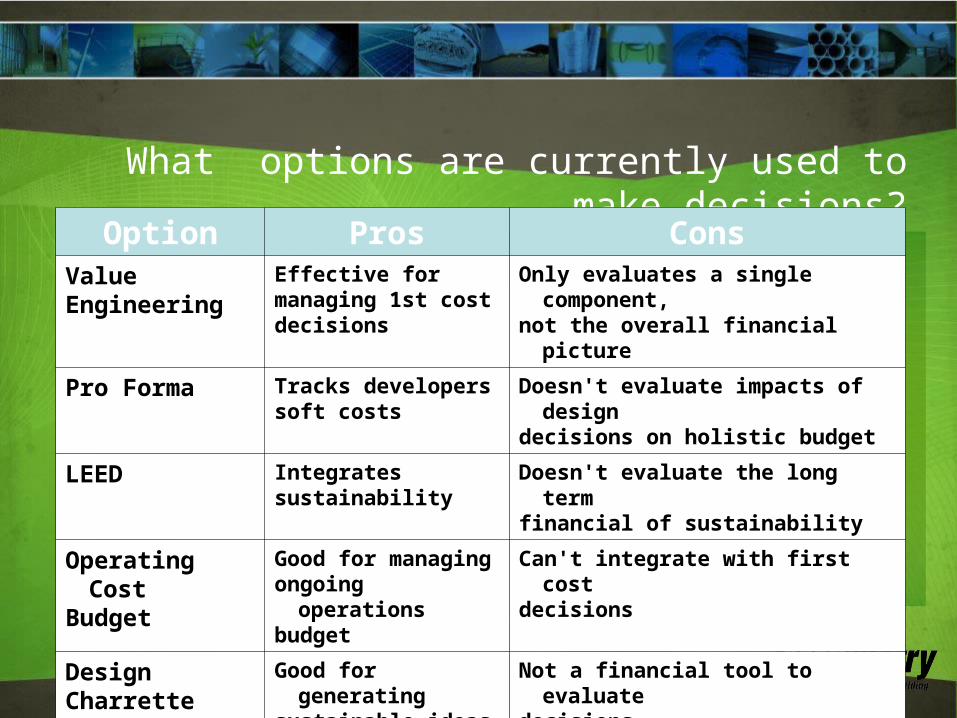
What options are currently used to make decisions?
Option Pros ConsValueEngineering
Effective formanaging 1st costdecisions
Only evaluates a single component,not the overall financial picture
Pro Forma Tracks developerssoft costs
Doesn't evaluate impacts of designdecisions on holistic budget
LEED Integratessustainability
Doesn't evaluate the long termfinancial of sustainability
Operating CostBudget
Good for managingongoing operationsbudget
Can't integrate with first costdecisions
DesignCharrette
Good for generatingsustainable ideas
Not a financial tool to evaluatedecisions
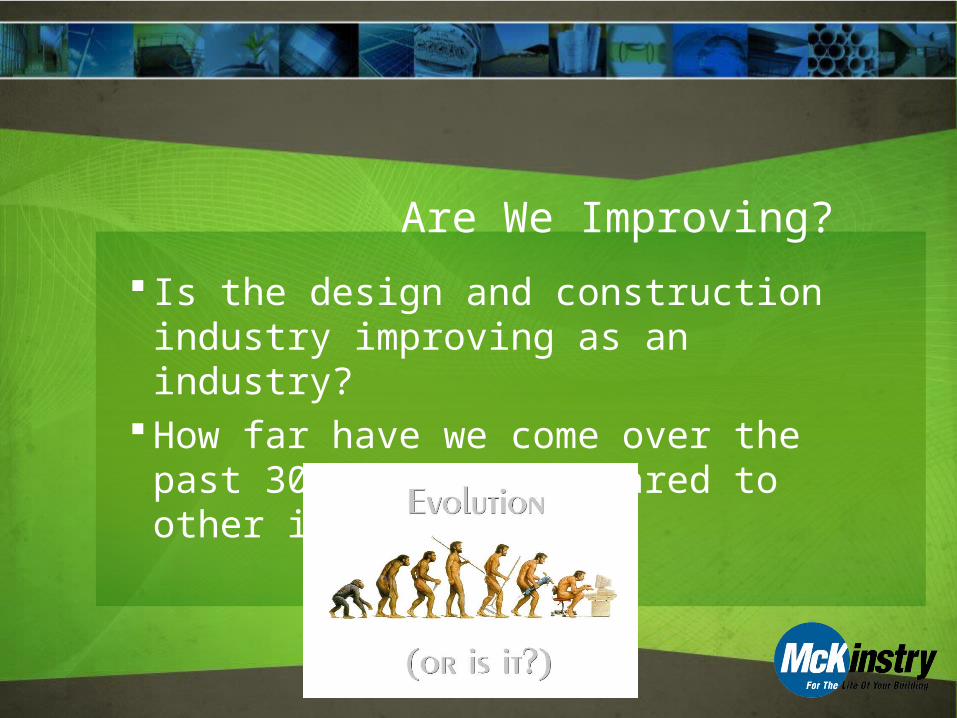
Are We Improving?
Is the design and construction industry improving as an industry?
How far have we come over the past 30 years as compared to other industries?

Industry Example:
Boeing changed the airline industry
Vertical Integration Outcome Focused Approach Span of Control Aligned All Parties

How does TCO Create High Performance Buildings?

What do you get with TCO? Decision making platform – considering all factors! Integration of all financial elements related to a building Clear view of NOI/ROI for each element of a project Integrates first cost with long term costs Allows for pragmatic assessment of sustainable features
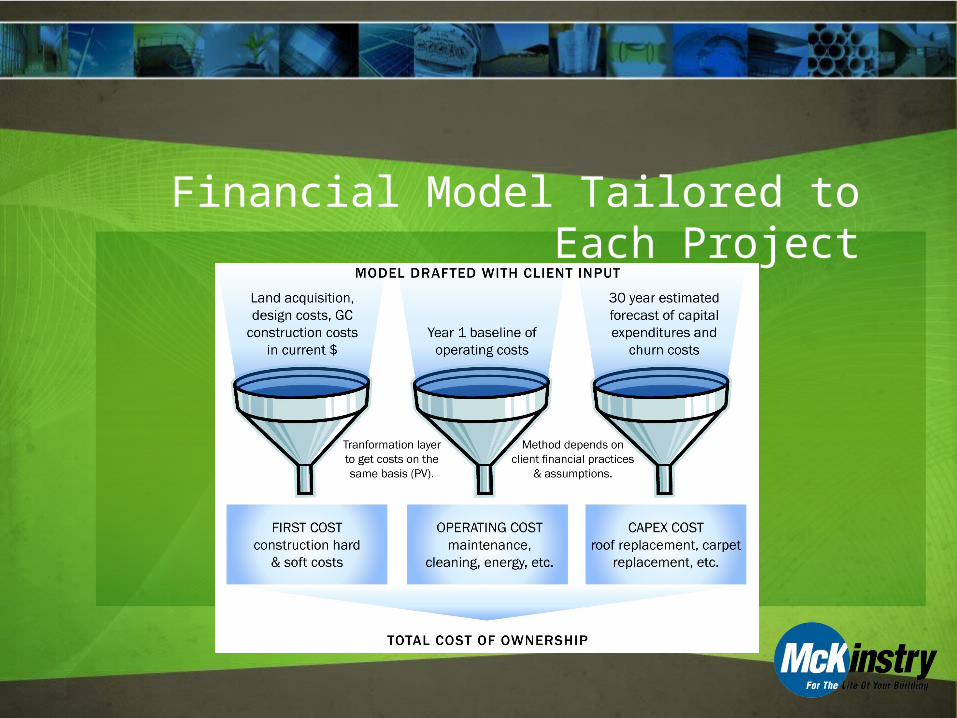
Financial Model Tailored to Each Project

Evaluate Design Concepts
TCO
First cost
Capital
Renewal
costs
Program
Flexibility
costs
Operational
costs
Operational
benefitsImproved
productivity
Risk
Management
Energy
modeling
TCO
First cost
Capital
Renewal
costs
Program
Flexibility
costs
Operational
costs
Operational
benefitsImproved
productivity
Risk
Management
Energy
modeling
LEED / Carbon Footprint
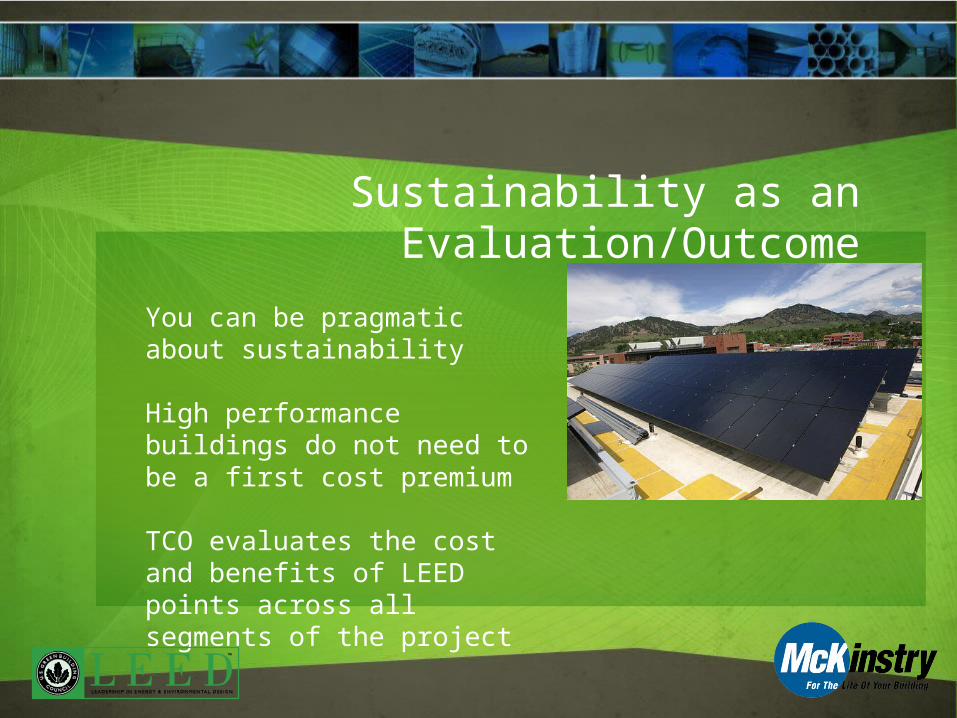
Sustainability as an Evaluation/Outcome
You can be pragmatic about sustainability
High performance buildings do not need to be a first cost premium
TCO evaluates the cost and benefits of LEED points across all segments of the project
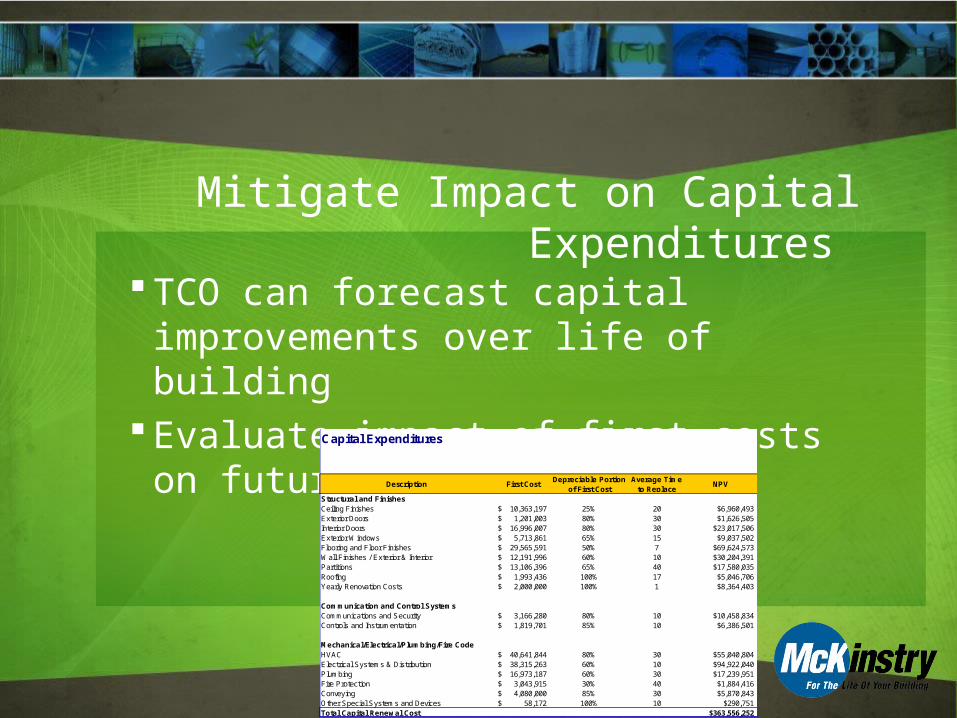
Mitigate Impact on Capital Expenditures
TCO can forecast capital improvements over life of building
Evaluate impact of first costs on future expendituresCapital Expenditures
Description First Cost Depreciable Portion
of First CostAverage Time
to ReplaceNPV
Structural and FinishesCeiling Finishes 10,363,197$ 25% 20 $6,960,493Exterior Doors 1,201,003$ 80% 30 $1,626,505Interior Doors 16,996,007$ 80% 30 $23,017,506Exterior Windows 5,713,861$ 65% 15 $9,037,502Flooring and Floor Finishes 29,565,591$ 50% 7 $69,624,573Wall Finishes / Exterior & Interior 12,191,996$ 60% 10 $30,204,391Partitions 13,106,396$ 65% 40 $17,580,035Roofing 1,993,436$ 100% 17 $5,046,706Yearly Renovation Costs 2,000,000$ 100% 1 $8,364,403
Communication and Control SystemsCommunications and Security 3,166,280$ 80% 10 $10,458,834Controls and Instrumentation 1,819,701$ 85% 10 $6,386,501
Mechanical/Electrical/Plumbing/Fire CodeHVAC 40,641,844$ 80% 30 $55,040,804Electrical Systems & Distribution 38,315,263$ 60% 10 $94,922,040Plumbing 16,973,187$ 60% 30 $17,239,951Fire Protection 3,043,915$ 30% 40 $1,884,416Conveying 4,080,000$ 85% 30 $5,870,843Other Special Systems and Devices 58,172$ 100% 10 $290,751Total Capital Renewal Cost $363,556,252

Truly Understand Operational Costs
Vast database of historical operations information to build the model
TCO aides decision making to minimize operations impacts
TCO helps bridge the gap between capital planning and operations department to achieve decision buy in.
Maintenance and Repair Summary
Maintenance & Repair Mixed UseBase
DesignCurrent Option
Elevator 0.35 0.35 0.35HVAC 0.15 0.15 0.15HVAC Controls 0.05 0.05 0.00Water Treatment 0.18 0.20 0.20Electrical 0.03 0.03 0.03Struc/Roof 0.06 0.06 0.06Plumbing 0.03 0.03 0.03Fire/Life Safety 0.08 0.08 0.08General Exterior 0.17 0.17 0.17General Interior 0.35 0.35 0.35Other/Contract 0.20 0.20 0.20Salaries 0.20 0.20 0.20Generator 0.12 0.12 0.12Data Center/Labs 0.10 0.10 0.10Total 2.07 2.09 2.04
Current DesignBenchmark
Operations Costs
Utilities25%
Security12%
Roads and Grounds2%
Maintenance20%
Custodial33%
Administrative8%
Utilities
Security
Roads and Grounds
Maintenance
Custodial
Administrative

Productivity – Improve Physical Learning , Teaching & Research Environment
Evaluate qualitative aspects of the building Evaluate success meeting tenant and owner priorities
PRIORITY VALUE CURRENT SCORE PRIOR
CATEGORY ITEM (1-10) (points) ( % VALUE)
PRODUCTIVITY Individual Work areas 7 20 0.80 16.00Team collaboration space 9 20 0.30 6.00Supervision adjacency 6 5 0.80 4.00Ammenities access 5 10 0.70 7.00Lab access 7 5 0.90 4.50
CATEGORY TOTAL 60 37.50
ENVIRONMENT Outside Air 7 5 0.75 3.75Natural Light 8 5 0.80 4.00Ceiling Height 4 5 0.60 3.00Noise Levels 6 5 0.60 3.00
CATEGORY TOTAL 20 13.75
SATISFIERS Food Service 8 5 0.90 4.50Shower & Bike Facilities 4 3 0.50 1.50Covered/proximate Parking 5 2 0.50 1.00Privacy Areas 7 5 0.60 3.00Interaction Areas 9 5 0.60 3.00
CATEGORY TOTAL 20 13.00
Total Score 64.25
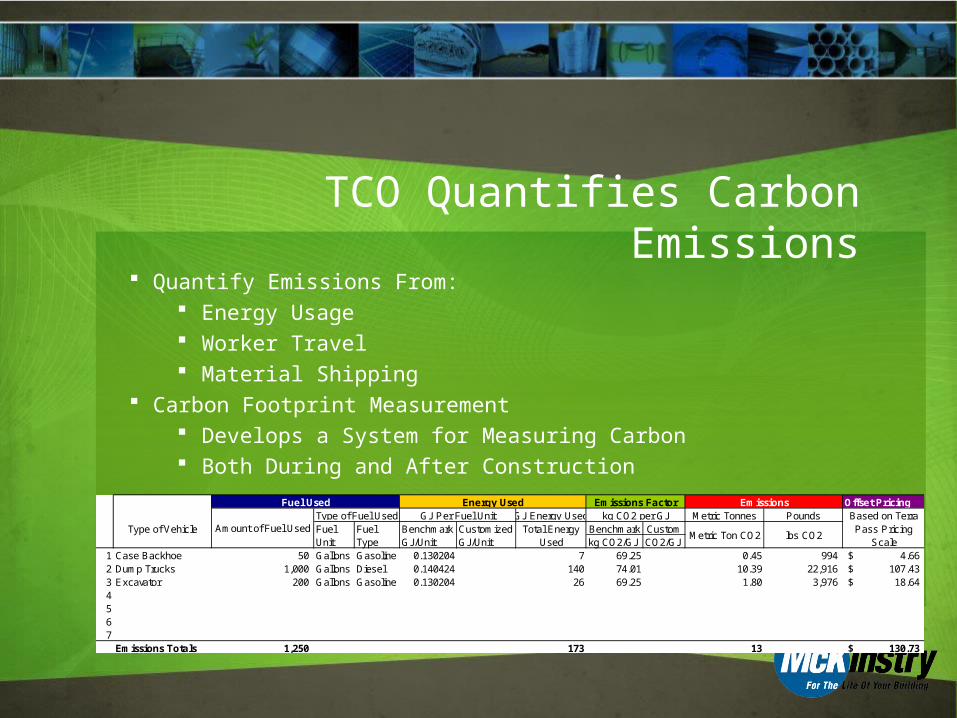
TCO Quantifies Carbon Emissions Quantify Emissions From:
Energy Usage Worker Travel Material Shipping
Carbon Footprint Measurement Develops a System for Measuring Carbon Both During and After Construction
Offset PricingGJ Energy Used Metric Tonnes Pounds
Type of Vehicle Fuel Fuel Benchmark Customized Benchmark CustomUnit Type GJ/Unit GJ/Unit kg CO2/GJ CO2/GJ
1 Case Backhoe 50 Gallons Gasoline 0.130204 7 69.25 0.45 994 4.66$ 2 Dump Trucks 1,000 Gallons Diesel 0.140424 140 74.01 10.39 22,916 107.43$ 3 Excavator 200 Gallons Gasoline 0.130204 26 69.25 1.80 3,976 18.64$ 4567
Emissions Totals 1,250 173 13 130.73$
Total Energy Used
Metric Ton CO2
Type of Fuel UsedFuel Used Energy Used
Amount of Fuel UsedGJ Per Fuel Unit
lbs CO2
EmissionsBased on Terra Pass Pricing
Scale
Emissions Factorkg CO2 per GJ

Wide Range of Project Types Leveraging TCO
A Commercial Real Estate Project used TCO: To evaluate designs against previous benchmarks
K – 12 School District Client Project used TCO: To facilitate team communication Instead of traditional value engineering
Higher Education Project: To develop a Sustainability Master Plan
A Healthcare Project used TCO: To evaluate remodel vs. new construction scenarios

Keys to Successful Sustainable Projects
»Involve Entire Team»Understand the Desired End Result»Focus on the Real Project Drivers and Financial
Assumptions / Requirements»Integrated and Guaranteed Turn-key delivery»Stay Committed
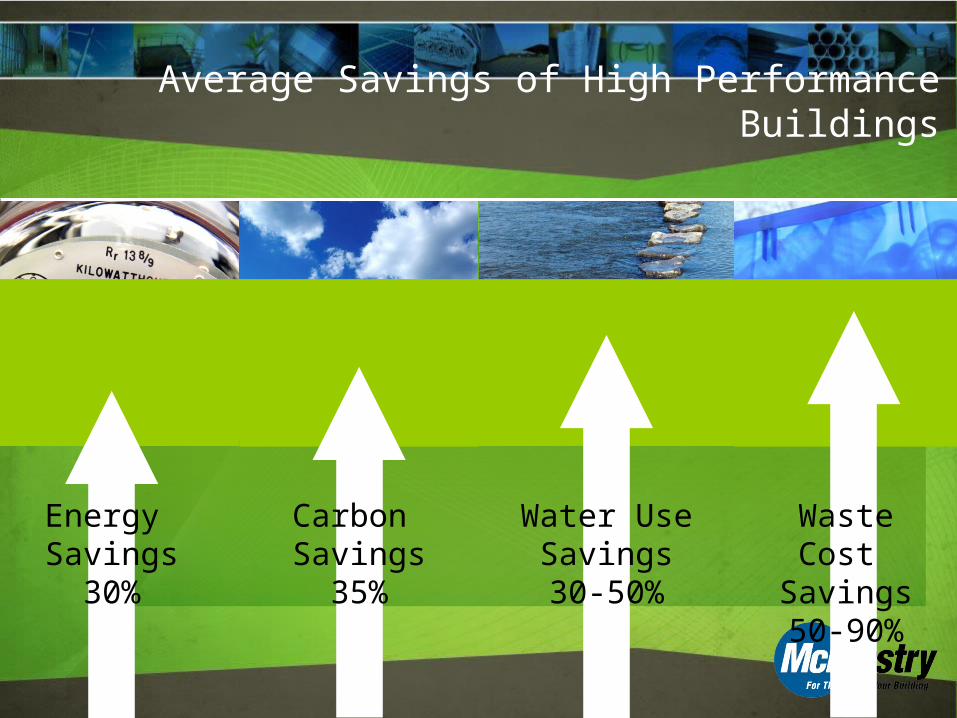
Average Savings of High Performance Buildings
Energy Savings
30%
Carbon Savings
35%
Water Use Savings30-50%
Waste Cost Savings50-90%

“For the Life of Your Building” McKinstry projects have eliminated 150,000 metric ton of CO2 emissions in
the past five years. This equates to: Planting 9 million trees Removing 8,500 cars from local highways
McKinstry has saved customers nearly 150 million kWh & 10 million Therms in the past five years. That equates to
Converting 1 million 60-watt incandescent bulbs to fluorescent bulbs Converting 200,000 showerheads from 2.5 gpm to 2.0 gpm.
On average, McKinstry uses over 2 million pounds of steel annually, of which: 1.3 million pounds is recycled. The recycled content saves enough energy to power over 110 American
households per year.

Questions?