energy in tune with you - enel - enel.com of thermal power plant cooling waters, were requested upon...
TRANSCRIPT

ENERGY IN TUNE WITH YOU
Environmental Report 2003


Reduction of specific emissions
SO2-49%

Reduction of specific emissions
NOX-19%

Reduction of specific emissions
Particulates -44%


Environmental Report 2003

The 2003 Environmental Report reviews the activities that Enel’s Divisions and Companies– in their configuration as of 31 Dec. 2003 – carried out in Italy and abroad (Spain,Bulgaria, North and South America). The data of each Division or Company refer to the entire year and include acquisitions, if any, made in the course of the year. The reported data are equal to 100%, independently of Enel’s holdings in the Companies.
By way of example:> Interpower, sold on 29 January 2003, is excluded;> the data of Deval, of which Enel has a 51% stake, are equal to 100%.
The Report, which has the typical format of annual reports, consists of the followingsections:
> Enel’s organizational structure;> environmental policy;> environmental management organization;> environmental governance;> some facts about research, environment and quality;> environmental features and highlights of Enel’s business activities (with data
sheets summarizing their environmental performance);> eco-balance, consolidating the results of Enel’s Companies and Divisions and
including indicators and graphic presentations.
A special section is dedicated to initiatives and results in the area of occupational health& safety. The verifier’s statement closes the publication.
The data on international operations are limited, for this first year, to those appearing in the “International” chapter, “Business Activities” section.
The data on number and characteristics of installations as well as the organization of business activities over the country, etc. are reported as of 31 December.
For additional informationon the general contents ofthe Environmental Report,contact:Marcello CoggiattiEnel / Public and RegulatoryAffairsEnvironmental PoliciesViale Regina Margherita, 13700198 RomaTel. no. [email protected]

Business Activities
Eco-Balance and Indicators
Occupational Health & Safety
Certification Report
CEO’s Message
Enel SpA
Environmental policy
Environmental management organization
Environmental governance
Some facts about research, environment
and quality
Generation and Energy Management
Networks, Infrastructure and Sales
International
Telecommunications
Terna
Eco-Balance
Indicators
Protection of workers’ health and improvement
of workplace safety
Verifier’s statement
4
6
7
8
9
15
20
27
32
34
36
40
61
72
78

The task of generating electricity in more efficient ways, minimizing emissions and the environmental
impact, is an integral part of our mission. The publication of the Environmental Report is an opportunity
to measure our performance and take stock of our activities and achievements during the year.
2003 was the International Year of Research, a field where Enel had a particularly good performance,
because we feel that innovation and research can help reconcile economic development with
environmental sustainability and social accountability. Two of our projects – the use of debris from
marble processing for desulfurizers and the elimination of the typical odor of geothermal plants –
received the Innovation & Environment Award organized by Legambiente (environmental association)
and the Bocconi and Politecnico di Milano universities. But during 2003, we also launched the
Hydrogen Project as part of the Hydrogen Park Consortium of Venice, as well as the Archimedes
Project, an initiative resulting from the cooperation between Enel and Enea (New Technologies,
Energy and Environment Agency) for construction of a thermodynamic solar facility associated with
the combined-cycle plant of Priolo Gargallo in Sicily. The facility will generate electricity from the
high-temperature steam produced from solar heat.
This year, the Environmental Report is presented for the first time together with the Annual Report
and the Sustainability Report. This initiative stresses that the three Reports are not separate objects
but an integrated set of documents reflecting an economic, environmental and social reality which
shares the same mission. An integrated reading of these documents demonstrates that excellent
financial performance can be attained in parallel with improvements in the environmental and social
management of our activities.
On the environmental front, Enel achieved all the targets that it had set. At the international level,
we are among the companies with the best environmental performance. We continued to decrease
the emissions of traditional pollutants from thermal power plants; with respect to 2002, sulfur
dioxide (SO2) dropped by 46%, nitrogen oxides (NOX) were slashed by 12% and also particulates fell
by 40%. The rationale behind these positive results lies in improvement and rebalancing of the fuel
mix, as well as in enhanced efficiency of our thermal plants (from below 38% to over 39%).
The only legislative derogations, for emissions into the atmosphere and for the temperature of the
releases of thermal power plant cooling waters, were requested upon the heat wave of the Summer
of 2003, but only to avert the risk of an electricity generation deficit.
4 > 5 ENVIRONMENTAL REPORT 2003
CEO’s Message

We recorded positive results also in terms of greenhouse gases (CO2): average specific emissions from
thermal generation were equal to 670 g/kWh, i.e. about 7% less than in 2002 and more than 9%
less than in 1990. Furthermore, we went on with our programs for optimizing waste and water
management.
Thanks to our efforts in the use of renewables, net generation from wind sources rose by 24 GWh
with the entry into operation of new plants with a total capacity of 68 MW.
Another important aspect is the mitigation of the impact of our medium- and low-voltage power
lines on land use and landscape: over 68% of the medium- and low-voltage grid uses underground
or insulated overhead cables.
These results substantiate that the strategy of conversion of our plants to more efficient and less
costly fuels – thanks to advanced flue gas abatement technologies – can drive down costs but also
significantly curb emissions.
Efficiency, positive financial performance, care for the environment and landscape where we work
can and should go hand in hand. This is our commitment and we will keep it also in the coming years.
The Chief Executive Officer
Paolo Scaroni

The organizational structure of Enel, which took shape in the course of 2002, is organized into
Divisions (Generation and Energy Management, Networks, Infrastructure and Sales, International,
Telecommunications, Services and Other activities) to more adequately reflect Enel’s strategic change
from a multi-utility model to an organization focused on electricity and gas.
In the new organization, which includes Terna (owner of the near totality of the national transmission
grid), Enel SpA has a more significant role of guidance and monitoring.
6 > 7 ENVIRONMENTAL REPORT 2003
Enel SpA
Corporate
Generation and Energy Management Division
International OperationsDivision
Electricity Gas
Telecommunications Division Services and Other activities Division
Transmission Networks
Networks, Infrastructure and Sales Divisions

Enel has always showed environmental care in addressing aspects of electricity generation and
distribution, efficient use of resources, abatement of emissions, operation of installations and their
integration into the landscape. Environmental protection has thus become a corporate asset of
strategic and societal relevance, which adds value to Enel’s industrial policies.
Good environmental performance over the years led Enel to reiterate its environmental policy and
underlying principles also in 2003 and to propose the achievement of the related targets with
renewed impetus.
> Protecting the environment and the health & safety of workers.
> Safeguarding Enel’s corporate value.
> Raising environmental and product quality standards.
> Use of processes and technologies which prevent and/or mitigate impacts on the environment
and landscape.
> Rational and efficient use of energy resources and raw materials.
> Optimization of waste recovery.
> Application of international environmental and safety management systems in the various
activities.
> Optimized integration of installations into the landscape.
> Use of the best operating practices.
> Communication of corporate environmental performance to the public at large and to
institutions.
> Environmental awareness, education & training of employees.
Environmental policy
Principles
Strategic targets

Environmental Policies Unit of Enel’s Corporate Public and Regulatory Affairs has the mission of
identifying Enel’s strategic environmental targets, ensuring their consistency with the Divisions’
programs and initiatives.
In particular, the Unit:
> promotes, implements and coordinates programs and agreements with environmental institutions
and agencies;
> identifies indicators and monitors the progress of corporate initiatives in terms of environmental
impacts;
> conducts analyses on specific environmental issues having particular repercussions on Enel’s
system and arousing public interest;
> establishes relations with environment-focused institutions and agencies on technical matters;
> prepares Enel’s Environmental Report.
Furthermore, depending on the specific issues to be covered, each Business Division may have
in-house environmental teams and/or specialists.
Enel’s total human resources that are full- or part-time dedicated to environmental matters amount
to over 220 equivalent full-time units.
8 > 9 ENVIRONMENTAL REPORT 2003
Environmental management
organization

The new organizational structure strengthened Enel SpA’s responsibilities, especially in terms of
governance of cross-cutting processes, with a view to maximizing effectiveness and efficiency in the
performance of business activities.
Environmental governance helps raise the social credibility of Enel and is a measure of the
competitiveness and value of its policies vis-à-vis shareholders, customers and communities.
Enel’s environmental governance is currently implemented via reporting, management, awareness,
training & education instruments, which also serve the purpose of transferring it to regional units so
as to ensure consistent actions and behaviors.
Effective environmental governance also means careful management of financial resources.
Although Enel has not yet a dedicated accounting system, its environmental expenses are recorded
on a yearly basis in order to guide investments of an environmental nature.
Moreover, the governance process is designed in such a way as to address the inevitable environmental
criticalities, which occasionally evolve into lawsuits.
The reporting system has become a key instrument for constantly monitoring the interactions of Enel’s
industrial activities with the environment.
The system was refined over the years, thanks to constant utilization and introduction of techniques
and procedures that ensure data management reliability. Additionally, the formats for data collection
were revised both for recording occupational health & safety items and for making the reporting
system more flexible and more adaptable to Enel’s new organizational configuration, as well as to
evolving legislation.
Data reporting has become engrained into Enel's environmental management system and its
methodology ensures the best homogeneity of the collected data.
Thanks to its high manageability, the reporting system has become an instrument for periodical
monitoring the environmental performance of many of Enel’s business activities vs. targets.
In 2003, once again, Enel was engaged in the application of environmental management systems in
its electricity generating sites, in accordance with the international ISO 14001 standard and with the
EMAS (Eco-Management and Audit Scheme) Regulation.
In particular, Enel is committed to certifying all of its Italian power plants under ISO 14001 and to
subsequently apply for EMAS registration of at least 90% of them.
As of December 31, 2003, 51% of Enel’s installed capacity (58 power plants) was certified under ISO
14001; 27% of such capacity also obtained the EMAS registration.
The ISO 14001-certified sites which have already been EMAS-registered are the thermal power plants
Environmental governance
Environmental reporting
Environmental management

of Fusina, La Casella, Leri Cavour, Montalto di Castro, Porto Marghera, Sulcis and Torrevaldaliga
Nord, the hydro power area of Vomano and the hydro operation units of Avisio and Cordevole. The
thermal power plants of Porto Tolle, Priolo Gargallo, Brindisi Sud and La Spezia, the hydro business
unit of Bologna, the hydro power plant of Entracque, the hydro power area of Taloro and the hydro
operation unit of Nove are only ISO 14001-certified, but are already preparing for EMAS registration.
Furthermore, the Power Grid Business Unit of the Networks and Infrastructure Division is awaiting
the ISO 14001 certification.
Terna actively participated in the drafting of guidelines for environmental management of high-voltage
power lines. The guidelines were issued by APAT (National Agency for Environmental Protection and
Technical Services).
In November 2003, the Telecommunications Division (Wind) obtained the three-year renewal of its
ISO 14001 certification.
Environmental awareness, training & education initiatives have become core elements of Enel’s yearly
education plan for improving the skills and know-how of human resources.
In 2003, Enel developed 55 education modules for its environment-dedicated personnel, delivering
a total of about 10,000 man-hours of courses.
Also in 2003, Enel relied on communication activities for disseminating knowledge of its initiatives
internally and externally.
Brilliant communication results were achieved, among others, through two thematic sections of
Enel’s portal, the “Environment Channel” (www.enel.it/ambiente) and the “Nature Channel”
(www.enel.it/natura), which have been active for almost three years and which are intended to build
public awareness of the relations between industrial settlements, the environment, nature and landscape.
10 > 11 ENVIRONMENTAL REPORT 2003
Awareness, training & education
■ Certified 51.1%
■ Certification under way 0.3%
■ Planned certification 48.6%
ISO 14001 in power plantsWith reference to overall capacity: 41,846 MW
■ Registered 26.8%
■ Registration under way 12.8%
■ Planned registration 60.4%
EMAS in power plantsWith reference to overall capacity: 41,846 MW

Web users highly appreciated the contents posted on the two channels. In 2003, the channels had
an average of about 6,300 first-time visitors per month, corresponding to about 21,500 accesses per
month, with average sessions of about 20 minutes each.
To intensify its communication with the external world on specific themes of environmental protection
and nature conservation, Enel activated an online forum (www.enel.it/it/enel/portale/forum) and a
dedicated mailbox ([email protected]).
Moreover, in its “Nature Channel”, Enel posted a “Travel Notes” section, as well as a multi-media
section with atlases of Italian birds, mammals and orchids. A new navigable version of “Electricscapes”
and “Visit the Power Plants” is also available.
In 2003, sizeable financial resources were allocated to environmental protection:
> 131 million euro of investments;
> 637 million euro of current expenditure.
The near totality of the above figures refer to
electric activities.
In line with the guiding principles of Enel's
previous environmental reports, environmental
expenditure is defined as the costs incurred for
protection of the external environment and of
the health of the general population. This
expenditure excludes the costs incurred for
activities that, albeit beneficial to the environment,
are carried out mainly for industrial and economic
purposes, for protection of workers and for the
safety and security of power installations.
Among the most significant environmental investments, it is worth mentioning those for fluidized-bed
conversion of unit 2 of the Sulcis power plant; the unit is scheduled to go into service by the end of
2004. Improvements were also made to emission abatement systems in the Livorno and Genova
power plants.
In the first months of 2004, the first of the two Termini Imerese units became operational, thus
completing the first step of the program (2002-2006) of conversions of the power plants of La Casella,
Priolo Gargallo, Porto Corsini and Pietrafitta to combined cycles. Although this investment is not based
on environmental considerations, it increases the efficiency of thermal generation.
Financial resources
■ Electricity generation and geothermal drilling 53.5%
■ Electricity transmission 1.5%
■ Electricity distribution 44.4%
■ Telecommunications 0.6%
Environmental investmentsby business activity Total: 130.8 million euro

In 2003, more vigorous initiatives were taken to eliminate the impact of prior geothermal activities
on landscape, by implementing most of the projects included in the 2001-2006 plan of environmental
rehabilitation of geothermal areas.
The most significant environmental investments were made in the following areas:
> power grid: in the range of 60 million euro;
> thermal power plants: in the range of 59 million euro;
> geothermal plants: in the range of 8 million euro.
The current environmental expenditure for 2003 includes:
> costs for the operation of equipment and systems for environmental protection, for waste
disposal and for the personnel involved of Enel and contractors: about 132 million euro;
> eco-taxes, the most significant of which were the eco-tax on SO2 and NOX emissions, the
carbon tax on fossil fuels and the levy on geothermal power plants: about 58 million euro.
It is worth stressing:
> the captive use – for environmental compliance – of low-sulfur fuels, especially natural gas in steam
generators and medium-, low- very low-sulfur fuel oil, in place of the originally planned fuel;
> the partial or total unavailability of power installations for environmental requirements, such as
reduction of the power of some plants in order to satisfy the temperature limits of cooling
water releases.
In 2003, the corresponding costs were in the range of 450 million euro.
12 > 13 ENVIRONMENTAL REPORT 2003
■ Operating expenses 20.7%
■ Environmental taxes 9.1%
■ Research 0.1%
■ Extra costs of fuels 70.1%
Items of current environmental expenditureTotal: 637.3 million euro
5.5
Current environmental expenditure perkWh generated By type of generation (thousandths of euro/kWh net)
Thermalgeneration(includingextra costsof fuels)
Thermalgeneration(excluding extra costsof fuels)
Hydrogeneration
Geothermalgeneration
Wind and photovoltaic generation
1.3 1.1
2.93.3

The use of the most rigorous and advanced organizational measures cannot avoid the occurrence of
environmental criticalities, which originate from various factors, including the excessive emphasis
that the media place on some issues, thus inducing a wrong perception of reality and improper
expectations among communities.
Environmental criticality is the rejection of or opposition to installations (and/or to the impact deriving
from their operation). Such rejection or opposition is expressed – obviously for environmental reasons
– by a third party feeling disturbed, damaged or threatened by present or future installations.
Environmental opposition translates into initiatives which include legal notices (including written
protests) or administrative measures and which may involve significant costs owing to failed
authorizations, suspension of works, modifications of installations, etc.
73% of environmental criticalities involve the power distribution grid, 15% telecommunications,
11% electricity generation and geothermal drilling and the remaining 1% other activities. The most
frequent criticalities concern electric & magnetic fields (over 56%), biodiversity and landscape, noise
and vibrations.
The criticalities concerning air and climate, waste, soil, groundwater and surface water only relate to
electricity generation and geothermal drilling. “Other” criticalities (those which do not fall under the
above-mentioned headings) mainly involve the power distribution grid.
76% of the criticalities arose from complaints, while the remaining part was due to administrative
measures and legal notices.
Environmental criticalities
■ Air and climate 1.4%
■ Waste 0.5%
■ Soil, groundwater and surface waters 2.3%
■ Noise and vibrations 7.8%
■ Biodiversity and landscape 16.0%
■ Radiation (including electromagnetic fields) 56.5%
■ Other 15.5%
Environmental criticalities by environmental protection activityTotal: 219
■ Electricity generation and geothermal drilling 11.4%
■ Electricity distribution 73.1%
■ Telecommunications 15.0%
■ Other installations 0.5%
Environmental criticalities by business activityTotal: 219

As of December 31, 2003, Enel had 555 pending lawsuits, of which 52% administrative, 33% civil
and 15% criminal.
The distribution of lawsuits by business activity and by environmental protection activity is practically
the same as the one of environmental criticalities.
It is worth mentioning that, in 2003, 66 new lawsuits were filed, whereas a higher number of lawsuits
(91) were settled. In 80% of the cases, the judgment was in favor of Enel.
14 > 15 ENVIRONMENTAL REPORT 2003
Environmental litigation

Enel is very attentive to capturing the opportunities arising from hydrogen research. Numerous
initiatives were taken in 2003 to apply well-established technologies and test emerging concepts
for production of hydrogen and its use in transportation as well as in electricity and heat generation.
The following are the most significant activities that the Generation and Energy Management
Division carried out in this field.
> Launch of an integrated project for developing and testing technologies of production of
hydrogen from coal, as well as for developing an advanced hydrogen-fueled thermal cycle,
also in view of Enel’s participation in the Hydrogen Park Consortium of Venice (formalized at
the beginning of 2004).
The plants involved in the project are located near the coal-fired plant of Fusina.
> Construction of an experimental station, consisting of a combined heat & power generation
system based on Proton Exchange Membrane (PEM) fuel cells, for testing innovative concepts
in distributed generation. In 2003, the system (5 MW capacity) operated for 1,000 hours under
different load conditions, generating electricity and heat.
> Completion of an international demonstration project for testing a hybrid-cycle facility
integrating Solid Oxide Fuel Cells (SOFCs) with gas turbines. Partners in the project, coordinated
by the German electricity company RWE, were the German gas company (Thyssen Gas) and
Siemens Westinghouse, which provided the technology.
In 2003, an important agreement between Enea (New Technologies, Energy and Environment Agency)
and Enel opened the way to the testing of power plants associating combined cycles with solar
concentration systems consisting of linear parabolic collectors.
The new technology will be applied on the industrial scale at Enel’s plant of Priolo Gargallo (Sicilia),
recently converted to two combined-cycle gas-turbine units, each with a capacity of 380 MW.
The plant site has about 60 hectares of flat vacant land, which will be used as solar field.
The collectors will be aligned along the North-South axis and arrayed in parallel rows with a spacing
of about 12 meters. 306 100 m-long and 108 50-m long collectors will cover an area of about 40
hectares, providing a total active area of nearly 20 hectares.
The about 20-MW solar facility, which will integrate the Priolo plant, is based on an innovative
technology developed by Enea: its mirrors will absorb the available solar radiation to produce steam,
which will be fed to the plant turbines; this steam, combined with the steam produced by the
combined-cycle heat recovery steam generators, will increase the total generation of electricity,
fuel consumption remaining equal.
In particular, Enea’s research innovated the solar absorption system, whose linear parabolic mirrors
concentrate solar radiation and reflect it onto a receiving tube, specially designed to withstand
Some facts about research,
environment and quality
Electricity evolution: from fossil fuels to hydrogen
The new frontier of renewable-energy plants: “Archimedes Project”

operating temperatures (550°C). Inside the tube, there is a heat transfer fluid consisting of a mix
of molten salts.
The plant will generate more than 60 GWh of electricity per year, saving almost 13,000 tons
of oil-equivalent and avoiding over 40,000 tons of CO2 emissions into the atmosphere.
The planned investment is equal to roughly 50 million euro.
In 2003, Enel joined the Intend project, within the framework of the European LIFE Environment
program. The project is targeted to apply the Environmental Product Declaration (EPD - highly
developed in North-European countries, especially in Sweden) in Italy on an experimental basis.
The EPD is a voluntary certification (under the ISO/TR 14025 standard) which provides information
on the environmental performance of a product or service through the application of the Life Cycle
Assessment (LCA) methodology. Similarly to an eco-label, the EPD informs consumers about the
environmental impact of a product or service.
This certification is not alternative but complementary to environmental management schemes or
systems, such as EMAS or ISO 14001.
Enel’s interest in the EPD scheme arises from the need to offer more and more transparency to its
customers in terms of the impact of the entire cycle of generation of electricity which, in this case, is
regarded as a “commodity”. Thus, in 2003, as part of the Intend project, Enel started the process for
obtaining the Environmental Product Declaration in respect of the electricity generated by two of its
renewable-energy power plants: the wind plant of Sclàfani Bagni (8.5 MW) in the province of Palermo
and one geothermal plant still to be identified. The certification is expected to be obtained by the
end of 2004.
Enel will thus be the first Italian company to engage in the EPD.
16 > 17 ENVIRONMENTAL REPORT 2003
Energy Quality: the Environmental Product Declaration


Business Activities

The Generation and Energy Management Division is one of the six areas of Enel’s new organization.
The Division gathers all assets of electricity generation in Italy and, through Enel Trade, of electricity
sales in the Italian market to customers with a yearly consumption of over 100 million kWh and to
resellers.
Always through Enel Trade, the Division sells natural gas to distributors and is active in trading on
international markets.
Fuel handling services are provided through Enel Logistica Combustibili.
Electricity generation assets abroad (Spain, North America, Latin America, Bulgaria) were transferred
to the recently established International Division.
The Generation and Energy Management Business Units which are involved in electricity generation
from conventional sources (fuel oil, natural gas, coal, orimulsion) and from renewables are:
> “Thermal Generation”, which manages thermal power plants;
> “Renewables”, which develops and operates renewable-energy plants.
The Generation and Energy Management Division is implementing programs which have a positive
impact on the environment: rationalization of the use of energy resources, development of renewables,
increased efficiency of power plants and reduction of CO2.
20 > 21 Business Activities ENVIRONMENTAL REPORT 2003
Generation and Energy Management

The new power plant of Torrevaldaliga Nord (Civitavecchia)In December 2003, Enel obtained the authorization for converting its Torrevaldaliga Nord
power plant from oil- to coal-firing. The plant will have a capacity of about 2,000 MW. It is
one of the most ambitious and advanced projects of the kind at the international level.
The project features highly innovative technological applications, such as coal handling and
storage in a closed-loop and vacuum system, which prevents the dispersion of particulates.
Furthermore, with high-efficiency fabric filters, as well as last-generation desulfurizers and
denitrification systems, the emissions into the atmosphere from the plant will be kept at about
60-70% of the levels indicated in the new national and EC regulations (maximum allowed
stack concentrations: 100 mg/Nm3 for nitrogen and sulfur oxides and 15 mg/Nm3 for
particulates).
The solution chosen for boilers will result into a plant efficiency of 45% as against 35-38% of
other coal-fired plants. CO2 emissions will thus be extremely limited.
The construction of the plant, to be completed in 2008, will require an investment of about
1.5 billion euro.
New renewable-energy power plantsIn 2003, renewables had a further development, especially as a result of the entry into
operation of new wind farms:
> Campolieto, province of Campobasso (2.5 MW);
> Sclafani Bagni, province of Palermo (8.5 MW);
> Serra Cortina, municipality of Colobraro, province of Matera (2.5 MW);
> Contrada Corvo, municipality of Caltavuturo, province of Palermo (30.6 MW);
> Sa Turrina Manna, municipality of Tula, province of Sassari (23.8 MW).
The total new installed capacity (68 MW) will generate about 24 GWh per year.
22 > 23 Business Activities ENVIRONMENTAL REPORT 2003
BrindisiBari
Rossano
Priolo GargalloAugusta
Porto Empedocle
Termini Imerese
afitta
Porto Tolle
Leri Ca
La Spezia
Piombino
Montalto di CastroTorre Nord
Sulcis
stardo
Ge
Barbara
Porto Corsini
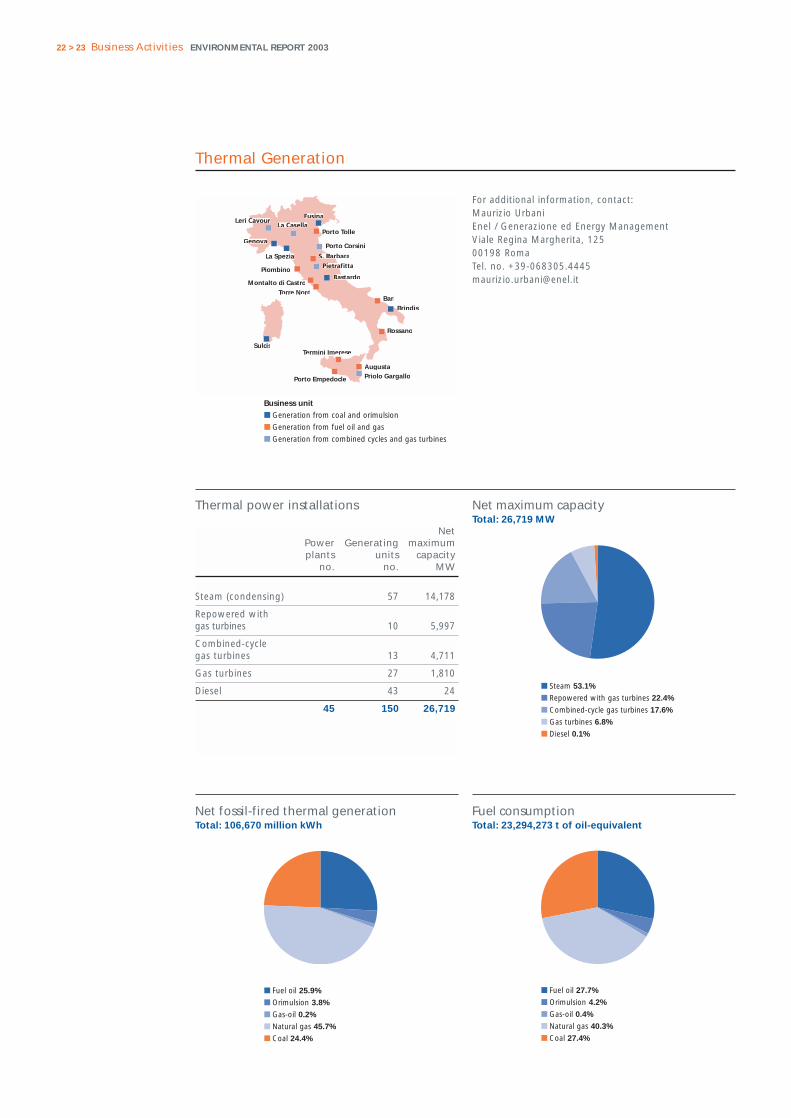
Thermal Generation
Business unit
■ Generation from coal and orimulsion
■ Generation from fuel oil and gas
■ Generation from combined cycles and gas turbines
For additional information, contact:Maurizio UrbaniEnel / Generazione ed Energy ManagementViale Regina Margherita, 12500198 RomaTel. no. [email protected]
Net Power Generating maximumplants units capacity
no. no. MW
Steam (condensing) 57 14,178
Repowered withgas turbines 10 5,997
Combined-cyclegas turbines 13 4,711
Gas turbines 27 1,810
Diesel 43 24
45 150 26,719
Net maximum capacityTotal: 26,719 MW
■ Steam 53.1%
■ Repowered with gas turbines 22.4%
■ Combined-cycle gas turbines 17.6%
■ Gas turbines 6.8%
■ Diesel 0.1%
Thermal power installations
■ Fuel oil 25.9%
■ Orimulsion 3.8%
■ Gas-oil 0.2%
■ Natural gas 45.7%
■ Coal 24.4%
Net fossil-fired thermal generationTotal: 106,670 million kWh
■ Fuel oil 27.7%
■ Orimulsion 4.2%
■ Gas-oil 0.4%
■ Natural gas 40.3%
■ Coal 27.4%
Fuel consumptionTotal: 23,294,273 t of oil-equivalent

Waste waters
Discharged into water bodies (m3) 12,576,493
Used inside plants (m3) 3,200,279
Waste waters include those meteoric waters that are susceptible to
pollution and are therefore fed to treatment systems before being
discharged or used.
CO2 (t) 71,457,170> from combustion 71,345,045> from desulfurization 112,125
SF6 (kg) 637(t of CO2-equivalent) 15,212
Total (t of CO2-equivalent) 71,472,382
■ From rivers 22.3%
■ From wells 16.5%
■ From aqueducts 12.7%
■ From the sea (as-is) 21.3%
■ From the sea (desalinated) 19.8%
■ From waste waters (used inside plants) 7.4%
Water for industrial usesTotal requirements: 43,372,381 m3
Total abstraction from inland waters: 22,340,346 m3
Special WasteTotal production: 1,699,641 tTotal delivery to recovery operators: 1,586,406 t
Emissions into the atmosphere
■ Limestone for flue gas desulfurization 85.7%
■ Caustic soda, sulfuric & hydrochloric acids 3.2%
■ Resins, hydrazine, carbohydrazide, lime,
sodium hypochlorite & chlorine dioxide 3.6%
■ Ammonia 6.7%
■ Other 0.8%
ExpendablesTotal: 297,267 t
100,655
62,230
3,487
SO2 (t) NOX (t) Particulates (t)
Non-hazardous Total production: 1,677,869 tTotal delivery to recovery operators: 1,584,923 t
1,07
9,74
1
1,06
5,73
7
442,
598
431,
009
155,
531
88,1
77
Coal ash Gypsum fromdesulfurization
Other
■ Production ■ Delivery to recovery operators
HazardousTotal production: 21,771 tTotal delivery to recovery operators: 1,483 t
11,4
79
948
10,2
92
535
Fuel-oil flyash Other
■ Production ■ Delivery to recovery operators

24 > 25 Business Activities ENVIRONMENTAL REPORT 2003
Sardegna (Cagliari)
Sicilia (C
Montorio al Vomano
ologna
Vittorio VenetoBolzano
Sondr
a
Domodossola
Cune
Torino
ltre
(Pisa)
Ascoli
Ceprano
Bergamo
Renewables
Business unit
■ Generation from large hydro plants
■ Generation from alternative sources
■ Geothermal generation
For additional information, contact:Maurizio UrbaniEnel / Generazione ed Energy ManagementViale Regina Margherita, 12500198 RomaTel. no. [email protected]
HYDRO NetPower Head maximumplants installations capacity
no. no. MW
Run-of-river 317 1,639.0
Pondage/reservoir 192 5,180.5
Pure/mixed pumped storage 20 7,510.6
495 529 14,330.1
GEOTHERMAL NetPower Generating maximumplants units capacity
no. no. MW
Condensing 36 659.6
Atmospheric exhaust 1 5.9
34 37 665.5
WIND Net Power maximumplants capacity
no. MW
14 127.7
PHOTOVOLTAIC NetPower maximumplants capacity
no. MW
5 3.6
Net maximum capacityTotal: 15,127 MW
■ Hydro 94.74%
■ Geothermal 4.40%
■ Wind 0.84%
■ Photovoltaic 0.02%
Power installations
■ Hydro from natural flows 60.01% (18,679 GWh)
■ Hydro from pumped storage 23.56% (7,333 GWh)
■ Geothermal 16.18% (5,036 GWh)
■ Wind 0.24% (75 GWh)
■ Photovoltaic 0.01% (2 GWh)
Net electricity generationTotal: 31,124 million kWh

Geothermal fluid
Total fluid extracted (t) 41,591,440
Net of reinjected fluids (t) 28,627,040
Steam for electricity generation (t) 41,372,120
Fluid for non-electric uses (t) 819,620> used directly 219,320> used after expansion
in atmospheric-exhaust turbine 600,300
Non-electric uses are uses of resources that do not have or have lost the
thermodynamic properties making them suitable for geothermal generation.
These uses fall under two main categories: supply of heat (especially for
greenhousing and district heating) and extraction of substances (e.g.: carbon
dioxide for foodstuffs).
* On a statistical basis: yearly energy capability/capacity ratio
Water for industrial uses(geothermal activities)
Abstraction from inland waters, entirely from rivers (m3) 1,100
Gas-oil (geothermal activities)
Total consumption (toe) 1,800
Used for driving the drilling equipment.
Emissions into the atmosphere
H2S - geothermal generation (t) 24,388
CO2 - geothermal drilling (t) 5,527
SF 6 - all types of generation (kg) 793(t of CO2-equivalent) 18,955
Carbon dioxide is produced by the combustion of gas-oil, which is used for
driving the drilling equipment.
Special waste Total production: 50,663 tTotal delivery to recovery operators: 7,926 t
■ Hydrochloric acid 3.4%
■ Bentonite 20,9%
■ Geothermal cement 30.3%
■ Caustic soda 41.6%
■ Other 3.8%
Expendables (geothermal activities)Total: 8,869 t
7,900
3,600
48,1
86
2,47
7 7,37
6
550
Non-hazardousspecial
Hazardousspecial
■ Production ■ Delivery to recovery operators
Yearly equivalent hours of utilization*
Hydro Wind Photovoltaic
2,0001,300
Geothermal

26 > 27 Business Activities ENVIRONMENTAL REPORT 2003
HYDRO GENERATION
Desilted reservoirs quantity (no.) 23
alluvial sediments removed and reused locally (t) 141,300
Fish ladders (no.) 30
Fish restocking campaigns quantity (no.) 133
restocked fish individuals 3,081,000in addition to kg 6,600
Other data
GEOTHERMAL ACTIVITIES
Drilled wells new (no.) 2
deepened (no.) 1
rehabilitated (no.) 3
Meters drilled (m) 11,856
In-service wells for steam production (no.) 221
for reinjection (no.) 28
Avoided CO2 emissions (t)
Hydro generation from natural flows (t) 12,513,000
Geothermal generation (t) 3,373,000
Wind generation (t) 50,000
Photovoltaic generation (t) 1,000
Total (t) 15,937,000
Avoided CO2 emissions from the otherwise necessary conventional
thermal generation.
WIND & PHOTOVOLTAIC GENERATION
Wind systems surface area occupiedby machines, buildings and roads (ha) 100
total surface area affected by the installations (ha) 30 to 100
times larger
Photovoltaic systems surface area occupied by modules (ha) 6.7
total surface area affected by the installations (ha) 10.0

In Enel’s new organizational model, the assets and know-how of the electricity and gas grids were
placed under the responsibility of two Divisions – the Sales Division and the Networks and Infrastructure
Division – and the coordination of commercial activities was strengthened.
In particular, the Sales Division has the mission of developing an integrated offering of electricity and
gas products and services, to be provided via focused distribution channels. The Division sells electricity
and gas in the eligible and captive market, provides public and artistic lighting and is generally active
in demand-side management.
The Networks and Infrastructure Division, instead, has the task of managing electricity and gas grids.
Deval SpA, of which Enel SpA has a 51% stake, distributes electricity in the region of Valle d’Aosta.
Networks, Infrastructure and Sales
Adoption of the Environmental Management SystemIn 2003, the Networks and Infrastructure Division, Power Grid Business Unit fine-tuned
its Environmental Management System organization and procedures to conform to the
international ISO 14001 standard.
The Environmental Management System documentation (Handbook, Procedures and
Instructions) was finalized and the tender for certification of the System – expected by the
end of 2004 – was awarded to the selected certifying body.
Always in 2003, the development of a corporate intra-network software system (called
“Environment and Safety”) was completed. The system is intended to collect process data
(waste, PCBs, SF6, etc.) and process them, as well as to internally circulate the documentation
of the Safety Management System and of the Environmental Management System. A section
of the system, called “Legislative Observatory”, enables users to identify the applicable
legislation and regulations and improve their understanding of specific topics by accessing
appropriate summaries.

28 > 29 Business Activities ENVIRONMENTAL REPORT 2003
End-use energy efficiencyOn October 8, 2003, the Authority for Electricity and Gas issued Decision no. 103: Guidelines
for preparation, implementation and evaluation of the projects referred to in art. 5, para. 1,
of the Ministerial Decrees of April 24, 2001, and for the definition of criteria, terms and
conditions for the issuing of energy efficiency certificates.
The Decision gave impetus to a host of activities in the area of end-use energy efficiency
(micro-plants, combined heat & power, photovoltaic and solar thermal plants) and of
promotional initiatives (through Enel’s Captive Customers Commercial Business Unit).
Moreover, in the course of 2003, Enel launched a research project for quantifying energy
savings from innovative concepts and planned related promotion and awareness actions.
Electric and magnetic fields: survey of power linesThe recently-approved implementing decrees of frame-law 36/2001 on electric and magnetic
fields specified limits of exposure, attention thresholds and quality targets for power lines
and mobile-telephony, radio and television stations.
Enel started a survey of power lines to identify critical conditions, if any, in terms of attention
thresholds.

LOMBARDIA TRIVENETO
EMILIA ROMAGNAE MARCHE
CALABRIA
SICILIA
SARDEGNA
PIEMONTEE LIGURIA
T
F
Bari
CatanzaroPalermoCagliari
TOSCANAE UMBRIA
LAZIO, ABRUZZOE MOLISE
CAMPANIA
PUGLIA EBASILICATA
Power grid
■ Regional unit and headquarters location
For additional information, contact:Anna BrogiEnel / Infrastrutture e RetiVia Ombrone, 200198 RomaTel. no. [email protected]
SUBSTATIONS Installedtransforming
capacityno. MVA
HV/MV 1,983 87,532
Satellite substations and MV units 477 -
MV/LV 345,388 65,688
MV/MV 62,453 1,197
410,301 154,237
LINES (km)
Overhead Under-bare Overhead ground
conductors cables cables Total
HV (>40 kV) 18,905 - 374 19,279
MV (1-30 kV) 205,740 7,159 120,295 333,194
LV (380 V) 127,801 377,181 220,753 725,735
352,446 384,339 341,422 1,078,208
Power installations
Electricity
Total electricity distributed (million kWh) 243,520
Emissions into the atmosphere
SF6 (kg) 2,010(t of CO2-equivalent) 48,039
Special waste Total production: 47,340 tTotal delivery to recovery operators: 45,133 t
39,1
46
39,3
76
8,19
4
5,75
7
Non-hazardousspecial
Hazardousspecial
■ Production ■ Delivery to recovery operators
General data
Regional units (no.) 11
Operation centers (no.) 29
Zones (no.) 129
Municipalities served (no.) 7,942
Customers connected to the divisional grid (no.) 29,484,870> supplied by the Division 29,413,669> only using its wheeling service 41,201
The Power Grid Business Area also operates 199 isolated photovoltaic systems.
With a net maximum capacity of 589 kW and a yearly energy capability of
about 648,000 kWh, they offer a cost-effective and environmentally sustainable
solution for supplying power to mountain huts, nature sanctuaries and small
isolated consumers.

30 > 31 Business Activities ENVIRONMENTAL REPORT 2003
Aosta
Deval
For additional information, contact:Andrea MottaDeval SpAVia Clavalité, 811100 AostaTel. no. [email protected]
SUBSTATIONS Installedtransforming
capacityno. MVA
HV/MV 13 372
Satellite substations and MV units 4 22
MV/LV 1,318 235
MV/MV 203 30
1,538 659
LINES (km)
Overhead Under-bare Overhead ground
conductors cables cables Total
HV (>40 kV) 57 - 0 57
MV (1-30 kV) 819 42 492 1,352
LV (380 V) 10 1,843 898 2,751
885 1,885 1,390 4,159
Power installations
Electricity
Total electricity distributed (million kWh) 905
Emissions into the atmosphere
SF6 (kg) 23t of CO2-equivalent) 545
Special waste Total production: 81 tTotal delivery to recovery operators: 56 t
64
56
17
0
Non-hazardousspecial
Hazardousspecial
■ Production ■ Delivery to recovery operators
General data
Municipalities served (no.) 68
Surface area served (km2) 3,132
Customers connected to Deval’s grid (no.) 118,239> supplied by Deval 118,005> only using its wheeling service 234
Deval also operates 2 isolated photovoltaic systems, which feed as many
agricultural customers (in middle-mountain areas), each with a subscribed
demand of 1.5 kW.

NORD OVESTNORD EST
LOMBARDIANORD
LOMBARDIA SUD,EMILIA, TOSCANA
TIRRENICA ADRIATICA
Gas grid
For additional information, contact:Gabriele ParisEnel / Infrastrutture e RetiVia Ripamonti, 8520141 MilanoTel. no. [email protected]
STATIONS (no.)
HP/MP 528
MP/LP with a power of > 1,200 kW 8,699
9,227
PIPELINES (km)
HP (p > 5 bar) 123
MP (0.04 bar < p ≤ 5 bar) 10,566
LP (p ≤ 0.04 bar) 16,505
27,194
Installations Natural gas
Total natural gas distributed (million m3) 3,493
Own consumption (million m3) 5.8
Losses along the grid (million m3) 12.2
Own consumption is the use of natural gas for its heating: before being
distributed to customers, natural gas is heated in order to prevent it from
freezing upon depressurization.
The gas is heated through an intermediate water circuit.
Resource consumption
Electricity (kWh) 3,130,000
Used for cathode protection of pipelines, for powering gas-heating circuit
water pumps and for lighting of installations.
Emissions into the atmosphere
CH4 (t) 6,307(t of CO2-equivalent) 132,437
CO2 (t) 11,095
The emissions of methane are the share of this gas which is present in the
natural gas lost along the grid.
The emissions of carbon dioxide are produced by the combustion of natural
gas used for own consumption.
Special waste Total production: 181 tTotal delivery to recovery operators: 175 t
175
175
6 0
Non-hazardousspecial
Hazardousspecial
■ Production ■ Delivery to recovery operators
General data
Municipalities served (no.) 1,051
Surface area served (km2) 30,066
Customers connected to the grid (no.) 1,795,919
■ Regional unit and headquarters location

In 2003, Enel created its International Division with the mission of conducting international
operations in the areas of electricity generation, as well as electricity and gas distribution and sales.
The Division is also in charge of business development, i.e. of the search for alliances and acquisitions
abroad in line with Enel’s strategies.
Enel’s international portfolio includes the following companies:
> Viesgo Generación and Enel Unión Fenosa Renovables (EUFR), operating in Spain;
> Maritza, in Bulgaria;
> Enel North America (ENA), in North America;
> Enel Latin America (ELA), in Central and South America;
> Electra de Viesgo Distribución and Viesgo Energía, in Spain.
Enel’s investments in international operations respond to strictly industrial strategies and involve
programs of modernization and environmental improvements for compliance with international
emission standards.
The 2003 Environmental Report provides, for the first time, the main data on the number,
characteristics, operation and environmental impact of Enel’s power plants abroad.
32 > 33 Business Activities ENVIRONMENTAL REPORT 2003
International

Generating mix
Enel Unión Enel Enel Total InternationalViesgo Generación Fenosa Renovables Maritza North America Latin America Division
Net Net Net Net Net Netmaximum Power maximum Power maximum Power maximum Power maximum Power maximum Power
capacity plants capacity plants capacity plants capacity plants capacity plants capacity plants(MW) (no.) (MW) (no.) (MW) (no.) (MW) (no.) (MW) (no.) (MW) (no.)
Thermal 1,592 6 62 9 (1) 732 1 25 2 (2) 2,411 18Hydro 669 12 69 33 233 60 175 6 1,146 111Wind 250 18 67 27 24 1 341 46
Total 2,261 18 381 60 732 1 325 89 199 7 3,898 175
(1) Combined heat & power
(2) 1 biomass, 1 biogas
Net electricity generationMillion kWh
Enel Unión Enel Enel Total International Viesgo Generación Fenosa Renovables Maritza North America Latin America Division
Thermal from fossil fuels 4,676 359 2,751 0 0 7,786Coal 3,934 3,934Brown coal 2,751 2,751Fuel oil and natural gas 742 359 1,101
Total from renewables 1,211 717 0 1,301 779 4,007Thermal from biomass and biogas 175 175Hydro from natural flows 1,211 234 952 719 3,115Wind 483 175 60 718
Total 5,886 1,076 2,751 1,301 779 11,793
Emissions into the atmosphere from thermal power plantsThousand tons
Enel Unión Total InternationalViesgo Generación Fenosa Renovables Maritza Division
SO2 54 n.a. 172 n.a.NOX 11 n.a. 3 n.a.Particulates 4 n.a. 4 n.a.CO2 4,944 81 3,322 8,347
By generating electricity from renewables, the International Operations Division avoided about 4.3 million tons
of CO2 emissions into the atmosphere from the otherwise necessary thermal generation.
For additional information, contact: Gaetano Salierno - Viale Regina Margherita, 125 - 00198 Rome - Tel. no. +39-068305.5636 - [email protected]
Net electricity generation by sourceTotal: 11,793 million kWh
■ Thermal from fossil fuels 66.0%
■ Total from renewables 34.0%
The new Telecommunications Division is featured by Wind, the company providing fixed & mobile
telephony, as well as Internet services in an integrated way.
The take-over of Infostrada enabled Wind to operate fixed-telephony services more effectively. Wind
provides Internet services through “Libero”, which has become Italy’s top-ranking Internet portal in
terms of pages visited and market penetration.
Among the new Italian telecoms operators, Wind is the one with the largest fiber-optic transmission
network.
34 > 35 Business Activities ENVIRONMENTAL REPORT 2003
Telecommunications
Constant commitment to the environmentIn 2003, Wind renewed its commitment to environmental protection, safety and social
accountability. Wind plans to start a process which will lead it to become, during 2004, the
first telecoms operator in the world with certified management systems in the above three
areas.
In addition to the already achieved ISO 14001 and OHSAS 18001 certifications, Wind
initiated the process of ethical certification under the international SA 8000 standard.
With regard to environmental protection, Wind developed a network for monitoring the
electromagnetic fields emitted by its installations. Through this network, Wind can constantly
control the contribution of its aerials to population exposure to electric and magnetic fields.
Finally, Wind is preparing Memoranda of Understanding with Regional Environmental
Agencies in the main Italian regions in order to provide them access to the technical
documentation of its installations, thus giving evidence of its well-established policy of
transparency.
In 2003, Wind:
> developed a system for monitoring and thus minimizing the energy consumption of its
installations;
> started a plan of replacement of all of its liquid-acid batteries with gel batteries, thereby
eliminating the risk of leakage and soil contamination; to date, about 90% of its in-
service batteries have been replaced;
> prepared a project for computerized central management of incoming and outgoing
waste records, in order to keep track of waste production and optimize waste reuse,
recycling and recovery; the contractors managing and handling stocks and disused
installations for Wind are involved in the project.

NORD OVEST
NORD EST
CENTRORom
Iv
Torino
G ologna
Pozzuoli
Bari
Palermo
M eziaMarghera
MilanoSesto S. Giovanni
SUD
For additional information, contact:Guido MoriscoVia G. Casalinuovo, 800142 RomaTel. no. [email protected]
Fiber-optic networks (km) 18,200
Local loops (km) 2,000
Fixed telephony switches (no.) 63
Mobile telephony switches (no.) 50
Radio base stations (telephony aerials - no.) 8,076
Points of Presence - POPs (no.) 206
Installations Usage
Voice – fixed telephony (billion minutes) 15.0
Voice – mobile telephony (billion minutes) 9.5
Internet (billion minutes) 24.7
Resource consumption
Electricity (kWh) 255,824,490
Used for powering telecommunications systems.
Gas-oil (toe) 2,558
Used in generating sets which supply electricity in emergencies and to
installations not connected to the power grid.
Emissions into the atmosphere
CO2 (t) 7,852
The emissions of carbon dioxide are produced by the combustion of the
gas-oil used in generating sets.
Special waste Total production: 1,005 tTotal delivery to recovery operators: 963 t
878
837
127
127
Non-hazardousspecial
Hazardousspecial
■ Production ■ Delivery to recovery operators
General data
Fixed telephony active customers (millions) 3.1
Mobile telephony customers (millions) 9.9
Registered Internet customers (millions) 15.2
Population coverage by mobile telephony network (%) 98
■ Registered office
● Field office
■ Regional office
■ Other office

36 > 37 Business Activities ENVIRONMENTAL REPORT 2003
Terna owns more than 90% of the national power transmission grid and is responsible for its
operation, maintenance and development on the basis of the directions of GRTN (Gestore della Rete
di Trasmissione Nazionale, the Italian Independent System Operator).
Terna’s transmission grid is the country’s most important infrastructure for energy transmission.
In 2003, Terna acquired about 900 km of high-voltage grid from Enel Distribuzione.
Terna supplies specialist services to owners of high- and extra-high voltage systems or of remote
control and operation systems in accordance with customer care and environmental protection
principles.
Terna also offers its infrastructures as supports for aerials, fiber-optic cables, sensors, etc., as well
as related services to Wind and third parties.
Terna
Power line towers with low environmental impact in protected areasAs part of its program of mitigation of the environmental impact of its power lines, Terna
developed six single-mast towers along its “Laino-Rizziconi” 380 kV power line in the Pollino
Park (Calabria).
Single-mast design towers are particularly suitable for supporting power lines in areas of high
natural value, given the small space requirements of their foundations.
The towers were built with a low environmental impact process involving the assembly of
prefabricated elements by means of helicopters. This process is now commonly used both for
building power lines and for minimizing ancillary structures (e.g. access roads and construction
sites), which would be highly invasive.
Given its scale and voltage level, the project represents the most important Italian initiative
taken so far in this area.

TorinoMilano
Firenze
Padova
Roma
Napoli
Palermo
Cagliari
■ Transmission field unit
For additional information, contact:Giovan Battista CavallariViale Regina Margherita, 12500198 RomaTel. no. [email protected]
ELECTRICAL STATIONS Installedtransforming
capacityno. MVA
380 kV 121 79,920
220 kV 107 24,693
< 220 kV 67 2,872
295 107,485
LINES (km)
Circuits Lines
380 kV 9,866 9,016
220 kV 9,296 7,751
< 220 kV 18,349 17,310
Direct-current links 1,066 747
38,577 34,824
Power installations
Electricity
Own consumption (for operation of the power grid - million kWh) 107
Emissions into the atmosphere
SF6 (kg) 1,636(t of CO2-equivalent) 39,103
Special waste Total production: 7,961 tTotal delivery to recovery operators: 7,133 t
6,64
4
6,31
8
1,31
7
814
Non-hazardousspecial
Hazardousspecial
■ Production ■ Delivery to recovery operators


Eco-Balance and Indicators

Electricity generation, transmission and distribution are the activities of Enel which have the most
significant effects on and interactions with the environment.
Also in 2003, primary energy (fuels and electricity) consumption, greenhouse gas emissions and
special waste production in non-electric activities (gas distribution and telecommunications) were
about 1,000 times lower than those in electric activities alone. Moreover, in Enel’s non-electric activities,
water consumption, as well as air and water emissions of pollutants are practically equal to zero.
However, the eco-balance extends to all the industrial activities that Enel carries out in Italy and
quantifies in an integrated way their interactions with the environment.
The data of the eco-balance are divided into three sections:
> resources;
> processes and products;
> emissions.
For each item, the eco-balance gives the data for the past five years and related comments. With regard
to gas distribution and telecommunications, the data relevant to the first three years of the period are
not reported; nevertheless, note that gas distribution only appeared among Enel’s activities in 2000.
It is worth recalling that, in the course of 2003, Enel recorded the following changes in its assets:
> sale of Interpower (subsequently Tirreno Power) – about 63 MW of hydro capacity and over
2,500 MW of thermal capacity – which concluded the sale of Enel’s three Gencos;
> sale of the distribution grids of the Municipalities of Vercelli, Gorizia, Vicenza, Terni, Brescia and
of 52 other minor Municipalities (including 3 previously served by Deval) – distributing a total of
about 4 billion kWh of electricity per year – as well as the acquisition of the grids of 10 minor
Municipalities;
> transfer from Enel Distribuzione to Terna of roughly 900 km of high-voltage power distribution grid.
The sale of Interpower and the sale or acquisition of distribution grids (except for: the sale of the grids
of Brescia and of 45 nearby Municipalities, arising from a voluntary initiative; and the sale of the grids
of the Municipalities previously served by Deval, resulting from a ruling of “TAR”, the Regional
Administrative Court) were carried out in accordance with Legislative Decree no. 79 of March 16,
1999. The Decree stipulates, among others, that each power producer/importer shall not generate or
import more than 50% of the total electricity generated in or imported to Italy. The Decree also contains
provisions on rationalization of the electricity distribution business.
The transfer of the distribution grid from Enel Distribuzione to Terna was made in compliance with a
Ministerial Decree of December 23, 2002, through which the Ministry of Production Activities changed
the extent of the national transmission grid, by incorporating elements of the high-voltage grid
previously belonging to distribution grids.
As a result of the above-mentioned changes in the size of Enel’s activities, most of the variations
appearing in the data in the course of the reported period are poorly significant or self-evident. Thus,
the percentage changes recorded in the data in the entire period and in the last year have been omitted.
40 > 41 Eco-Balance and Indicators ENVIRONMENTAL REPORT 2003
Eco-Balance

To facilitate the interpretation and assessment of the eco-balance data, the following table summarizes
the number and type of Enel’s power installations in Italy as of December 31 of each of the years
elapsed from 1999 to 2003.
Generating mix
1999 2000 2001 2002 2003
Power plants (no,) 687 711 658 613 593> hydro 594 615 555 517 495> thermal 57 59 59 48 45> geothermal 32 33 33 34 34> wind* 2 2 6 9 14> solar (photovoltaic)** 2 2 5 5 5
* in addition to: wind test fields 2 1 1 0 0** in addition to: photovoltaic test fields 1 1 0 0 0
isolated photovoltaic systems n.a. n.a. n.a. 201 201
Net maximum capacity (MW) 55,842 56,349 49,981 43,752 41,847> hydro 16,581 16,890 15,061 14,344 14,330> thermal 38,648 38,838 34,336 28,679 26,719> geothermal 584 595 540 666 666> wind 25 23 40 59 128> solar (photovoltaic) 3.5 3.3 3.6 4.1 4.2
Power lines circuit-length (km)
1999 2000 2001 2002 2003
Total 1,088,225 1,100,096 1,097,458 1,100,593 1,120,944> high voltage (40 to 380 kV) 57,338 57,620 57,372 57,899 57,913> medium voltage (1 to 30 kV) 328,188 331,793 331,181 332,055 334,546> low voltage (up to 380 V) 702,699 710,683 708,905 710,639 728,486
■ Hydro 34.24%
■ Thermal 63.85%
■ Geothermal 1.59%
■ Wind 0.31%
■ Solar (photovoltaic) 0.01%
Net maximum generating capacity as of 31 Dec. 2003Total: 41,847 MW
■ High voltage 5.2%
■ Medium voltage 29.8%
■ Low voltage 65.0%
Circuit-length of power lines as of 31 Dec. 2003Total: 1,120,944 km

Gas pipelines length (km)
1999 2000 2001 2002 2003
Total - 1,300 9,847 24,890 27,194> high pressure (p > 5 bar) - n.a. n.a. 137 123> medium pressure (0.04 bar < p ≤ 5 bar) - n.a. n.a. 9,370 10,566> low pressure (p ≤ 0.04 bar) - n.a. n.a. 15,383 16,505
Telecommunications infrastructures
1999 2000 2001 2002 2003
Fiber-optic networks - length (km) n.a. 11,230 17,500 18,275 18,200Radio base stations (telephony aerials) (no.) n.a. 3,296 5,655 7,369 8,076
This section shows the consumption of energy resources (fossil fuels, geothermal steam, primary
electricity) and non-energy resources (water for industrial uses, expendables).
In most of the cases, fossil fuels represent the energy source for thermal generation.
The consumption of fuel oils is indicated on the basis of their sulfur content (HS = high: > 2.5%;
MS = medium: >1.3% and ≤ 2.5%; LS = low: > 0.5% and ≤ 1.3%; VLS = very low: ≤ 0.5%).
Orimulsion is an emulsion of bitumen in water, coming from the Orinoco basin (Venezuela); like coal,
it is used in power plants equipped with flue gas desulfurizers and denitrification systems.
Gas-oil, a high-cost fuel, is used on an exceptional basis in: gas-turbine power plants that are not
connected to the natural gas grid; diesel-engine power plants (supplying some minor Italian islands);
start-up of steam-fired thermal plants; and, as an emergency fuel, in all gas-turbine power plants.
The maximum sulfur content in the gas-oil used for electricity generation is specified in the applicable
legislation as 0.2%. However, Enel's gas turbines use gas-oil with a sulfur content of 0.05%.
A very small quantity of gas-oil is used also in other activities: for driving geothermal drilling equipment
and in the generating sets of telecommunications installations.
The consumption of natural gas is broken down on the basis of its uses: non-technologically captive
(when the use of gas is a corporate choice) and technologically captive (when gas feeds single-cycle
and combined-cycle gas turbines, for which it is the only practicable option).
With the exhaustion of the mines adjoining the Pietrafitta and Santa Barbara power plants, the use
of brown coal was discontinued.
42 > 43 Eco-Balance and Indicators ENVIRONMENTAL REPORT 2003
Resources
Fossil fuels

Fuel consumption, obtained from data measured and certified in each installation, is expressed in
metric units (thousand tons or million cubic meters). To enable the summing of the various
contributions, the overall fuel consumption is expressed in energy potential (thousand tons of
oil-equivalent).
In 2003, the commissioning of additional thermal power plants, converted from oil-firing to combined
cycles (about 1,500 MW), justifies the decreasing consumption of fuel-oils and the correspondingly
increasing consumption of natural gas, whose technologically-captive use appears for the first time
as dominant.
The almost complete disappearance of HS and MS fuel-oils depends on the massive use of “clean”
fuels in order to comply with Ministerial Decree of July 12, 1990 on point-source limits of emissions
from existing power plants.
Finally, the reduction of coal consumption is related to the sale of the Vado Ligure plant (Interpower).
Geothermal fluid, in the form of steam at adequate pressure and temperature values, is the energy
source for geothermal generation. A minimum amount of this fluid is allocated to non-electric uses,
i.e. uses of resources whose thermodynamic properties are unsuitable for geothermal generation.
These uses fall under two main categories: supply of heat (especially for greenhousing and district
heating) and extraction of substances (e.g. carbon dioxide for foodstuffs).
In 2003, the geothermal steam used for electricity generation was significantly above the average of
the period, after its drop in 2001 owing to the shutdown of some power plants for renovation works.
Geothermal fluid
■ Fuel oil & gas-oil 28.1%
■ Natural gas 40.3%
■ Coal 27.4%
■ Orimulsion 4.2%
Fuel consumption for thermal generation in 2003Total: 23,294 ktoe
■ MS 1.3%
■ LS 35.6%
■ VLS 63.1%
Fuel-oil consumption for thermal generationin 2003Total: 6,487 kt

The capability of geothermal basins is mostly
sustained by the reinjection of fluids into the
geothermal reservoir. These fluids consist of: the
water entrained by steam and separated from it
at the well outlet; the steam that is condensed
after its expansion in the turbines, net of the
fraction evaporated in the cooling tower; and
the fluid remaining after non-electric uses.
Thanks to reinjection, the geothermal reservoir
represents a practically inexhaustible heat
resource. The practice of reinjection of fluids into
the deep subsoil does not jeopardize shallow
aquifers which, among others, are isolated from
the wells by metal pipings, cemented to the soil and between them.
Electricity is used as energy raw material in telecommunications and, to a minimum extent, in gas
distribution.
In the first instance, it is used for the functioning of telecommunications installations.
In the second instance, it is used for cathode protection of gas pipelines, for driving the water pumps
of the circuits which heat natural gas upon its depressurization, as well as for lighting gas installations.
Water for industrial uses is consumed:
> in thermal power plants, mainly to make up for the amounts of water lost in the generation
process of steam-turbine power plants and in closed-cycle wet cooling towers, to carry out
clean-up jobs (especially of boilers), and to feed auxiliaries and desulfurizers;
> in geothermal activities for the preparation of the drilling slurry; the amounts of water used in
these activities is very variable, depending on the type of activity (e.g. drilling of new wells,
rehabilitation or deepening of existing wells) and on the characteristics of the geological
formations crossed: however, these amounts are poorly significant (the functioning of cooling
towers does not require water, as it is based on re-vaporization of part of the condensates of
the steam discharged by turbines).
Water requirements do not include the water used for open-cycle cooling of thermal power plants,
because it is returned to the original water body without appreciable physico-chemical changes.
The increasing consumption of water for industrial uses is justified by: the retrofitting of thermal
power plants through the installation of desulfurizers – for environmental compliance (Ministerial
Decree of July 12, 1990) – all of which have become operational; the new cooling tower systems
44 > 45 Eco-Balance and Indicators ENVIRONMENTAL REPORT 2003
Primary electricity
Water for industrial
uses
Consumption of geothermal fluidthousand tons
■ Total
■ Net of reinjected fluids
20032002
37,3
16
23,0
01
41,5
91
28,6
27

installed in the Fusina and Porto Marghera
power plants to decrease the thermal load in the
Venice lagoon. The former requirements were
practically covered by as-is sea water, the latter
by abstraction from inland waters.
Expendables complete the list of the resources
used; the following are the main ones.
> Resins are used to produce (via ion
exchange) the high-purity water which is
needed for the thermal cycle of steam-fired
thermal power plants.
> Hydrazine and carbohydrazide deoxygenate
the thermal-cycle water and regulate its pH.
> Magnesium oxide is injected into the flue
gas circuits of thermal power plants fed
with vanadium-containing fuels, to prevent
corrosion of heat-transfer surfaces due to the indirect action of vanadium.
> Ammonia is used to regulate the pH of the thermal-cycle water, but at present primarily as a
reagent in the flue gas denitrification process.
> Limestone is the reagent for the flue gas desulfurization process.
> Lime is mainly used in waste water treatment, thanks to its neutralizing and flocculating
properties.
> Sodium hypochlorite and chlorine dioxide are occasionally added to the cooling waters of
steam-fired thermal power plants to prevent deposits and fouling. Ferrous sulfate is used to
protect heat-transfer tube surfaces from corrosion.
> Sulfuric acid, hydrochloric acid and caustic soda are most commonly used in the regeneration
of ion-exchange resins and in the clean-up of equipment. However, in geothermal activities,
the primary application of soda is as an additive in the slurries used in the drilling of geothermal
wells.
> Bentonite is a clay which is used as a slurry for the drilling of geothermal wells.
> Barite is used in some cases to thicken bentonite slurries, thereby improving their effectiveness
upon the drilling of mechanically unstable rock formations.
> Geothermal cement is used for joining the steel walls of new wells and for permanent plugging
of disused wells.
Expendables
■ From rivers 22.3%
■ From wells 16.5%
■ From aqueducts 12.7%
■ From the sea (as-is) 21.3%
■ From the sea (desalinated) 19.8%
■ From waste waters (used inside plants ) 7.4%
Coverage of water requirements for industrial uses in 200343.4 million m3

The figures shown for expendables are obtained from the accounting records of purchases, which
are held in each installation. Given the small size of stocks and the high number of installations
surveyed, the amounts purchased are practically equivalent to those consumed.
It should be pointed out that the consumption of limestone had a trend reversal, thanks to the low-
rate operation of desulfurizers in the Sulcis power plant; the plant used lower quantities of local coal,
whose sulfur content is about eight times higher than the average sulfur content of the foreign coals
used in the other power plants.
46 > 47 Eco-Balance and Indicators ENVIRONMENTAL REPORT 2003
■ Resins, hydrazine, carbohydrazide & lime 3.2%
■ Ammonia 6.5%
■ Limestone 83.2%
■ Sodium hypochlorite, chlorine dioxide
& ferrous sulfate 0.3%
■ Sulfuric & hydrochloric acids 2.3%
■ Caustic soda 2.2%
■ Bentonite, barite & geothermal cement 1.5%
■ Other 0.8%
Expendables in 2003Total: 306,136 t

Resources
1999 2000 2001 2002 2003
Fossil fuelsThermal generation
fuel oil thousand t 15,420 13,639 10,708 8,241 6,487> HS thousand t 1,176 173 221 6 0> MS thousand t 6,514 5,741 4,446 2,518 83> LS thousand t 3,530 4,114 3,266 2,458 2,309> VLS thousand t 4,201 3,610 2,775 3,260 4,095orimulsion thousand t 1,689 2,508 1,589 1,620 1,481gas-oil thousand t 209 136 75 58 93natural gas million m3 11,302 13,208 10,549 8,893 11,075> non-technologically captive use million m3 7,966 9,547 6,452 6,487 4,520> technologically captive use million m3 3,336 3,661 4,097 2,407 6,555coal thousand t 8,395 9,489 10,425 11,295 10,427brown coal thousand t 80 19 0 0 0Total thousand toe 31,046 32,083 27,022 23,864 23,294
Other activities: geothermal drilling & telecommunications thousand toe n.a. n.a. n.a. 5.0 4.4Grand total thousand toe n.a. n.a. n.a. 23,869 23,299
Geothermal fluidTotal fluid extracted thousand t n.a. n.a. n.a. 37,316 41,591
net of reinjected fluids thousand t n.a. n.a. n.a. 23,001 28,627Geothermal steam for electricity generation thousand t 35,339 37,500 35,374 37,112 41,372
Primary electricity(gas distribution & telecommunications) GWh n.a. n.a. n.a. 199 259
Water for industrial usesFrom rivers million m3 11.1 10.8 10.7 8.4 9.6From wells million m3 12.9 14.1 11.4 7.0 7.2From aqueducts million m3 5.5 5.8 5.6 5.5 5.5Total abstraction from inland waters million m3 29.6 30.7 27.7 20.9 22.3From the sea (as-is) million m3 12.2 6.9 5.1 5.8 9.2From the sea (desalinated) million m3 8.0 8.7 8.1 8.4 8.6From waste waters (used inside plants) million m3 4.1 3.6 3.2 3.1 3.2Total requirements million m3 53.9 49.9 44.1 38.2 43.4
for thermal generation million m3 53.8 49.7 44.1 38.1 43.4for geothermal drilling million m3 0.093 0.192 0.042 0.027 0.001
ExpendablesResins t 90 63 81 35 17Hydrazine t 71 47 35 51 12Carbohydrazide t n.a. n.a. 1 13 14Magnesium oxide t n.a. n.a. 213 153 116Ammonia t 15,482 18,703 20,455 22,909 19,869Limestone t 333,275 325,150 302,067 327,661 254,828Lime t 12,135 14,005 13,541 11,926 9,672Sodium hypochlorite t 1,077 1,071 962 612 888Chlorine dioxide t n.a. n.a. 0 28 13Ferrous sulfate t n.a. n.a. 0 3 1Sulfuric & hydrochloric acids t 7,834 8,354 7,440 5,432 6,931Caustic soda t 6,692 7,728 7,237 6,314 6,722Bentonite t 1,361 623 1,044 2,045 1,853Barite t 6 8 60 0 0Geothermal cement t 2,748 1,545 2,331 2,520 2,691Other t 6,242 8,915 4,360 3,002 2,508Total t 387,015 386,210 359,828 382,703 306,136
n.a.: not available (in 1999 and 2000, the amounts of carbohydrazide, magnesium oxide, chlorine dioxide and ferrous sulfate were included in the “Other” expendables).

48 > 49 Eco-Balance and Indicators ENVIRONMENTAL REPORT 2003
The strategy of diversification led Enel to add natural gas distribution and telecommunications (fixed
& mobile telephony and Internet) to its electricity generation, transmission and distribution activities.
As regards electricity generation, it is worth recalling that in 2001, 2002 and 2003, the extent of the
electricity generating assets falling under Enel’s responsibility changed. As a result: from 2001, the
data exclude Elettrogen and Valgen; from 2002, the data also exclude Eurogen; while the 2003 data
exclude Interpower, too.
Furthermore,
> the various contributions are net of the electricity consumed by power plant auxiliaries;
> the hydro generation from pumped storage is the electricity that is produced, in peak-load
hours, through the falling of water pumped from a lower reservoir to an upper reservoir, using
electricity surpluses in low-load hours (pumped storage is the only available option for storing
significant amounts of electricity, albeit indirectly);
> the actually available generation is the total net generation, after deducting the electricity
consumed for pumped storage.
In terms of trends, the 2003 data show that, in spite of the sale of Interpower, the contribution of
thermal generation increased, owing to low availability of water resources and thus to the contraction
of hydro generation. However, the contraction was offset, to a certain extent, by the further growth
of geothermal and wind generation.
Processes and products
Electric activities
■ Fuel oil & gas-oil 20.2%
■ Natural gas 35.4%
■ Coal 18.9%
■ Orimulsion 2.9%
■ Geothermal, wind & solar 3.7%
■ Hydro from natural flows 13.6%
■ Hydro from pumped storage 5.3%
Net electricity generation by source in 2003Total: 137,794 million kWh
■ Geothermal 21.2%
■ Hydro from natural flows 78.5%
■ Wind & solar (photovoltaic) 0.3%
Net electricity generation from renewablesin 2003Total: 23,792 million kWh

As regards electricity transmission and distribution, with the disaggregation of its vertically integrated
electric activities, the transfer of its dispatching assets to GRTN, the Italian independent transmission
system operator, and the start of the liberalized market (option for “eligible” customers to choose
their supplier), Enel has lost the possibility of measuring the electricity wheeled on the transmission
grid and, in general, of both measuring and directly controlling grid losses. In the past, these losses,
expressed as a percentage of electricity demand, were among the indicators of power system
efficiency.
Therefore, from 2002, reference is made only to the electricity wheeled on the distribution grid (total
electricity delivered to final customers connected to the grid).
The amount of natural gas wheeled represents the total amount of gas that is delivered to customers.
The consumption of natural gas for operation of the grid (“own consumption”) is due to the combustion
of one fraction of the gas that is wheeled; this fraction is used for heating of the gas, to prevent it
from freezing upon depressurization.
The natural gas losses from the grid are estimated on the basis of the amount of natural gas wheeled,
using loss factors (average value in the two years surveyed: 0.35% by volume) which take into account
gas pressures, length and configuration of pipelines, their state of conservation, etc.
Usage (voice and Internet) is the “product” of this activity, i.e. the quantity that defines the extent
of the relevant process.
Telecommunications
Natural gas
distribution
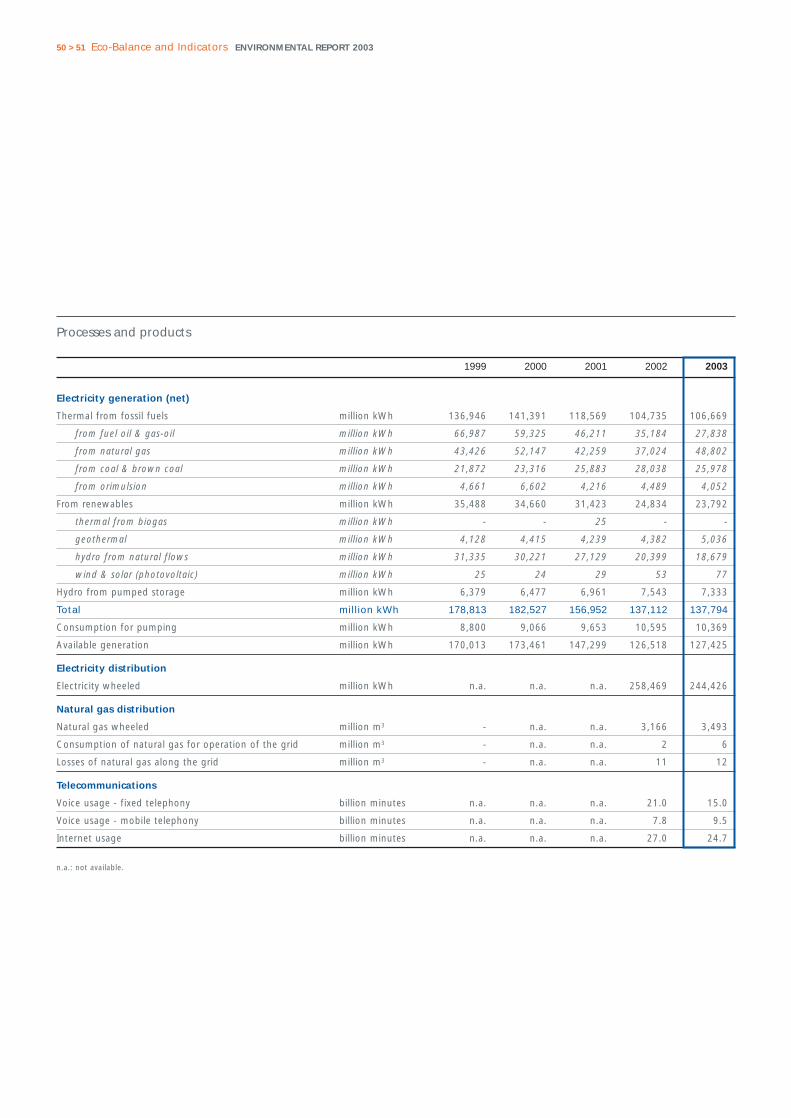
50 > 51 Eco-Balance and Indicators ENVIRONMENTAL REPORT 2003
Processes and products
1999 2000 2001 2002 2003
Electricity generation (net)
Thermal from fossil fuels million kWh 136,946 141,391 118,569 104,735 106,669
from fuel oil & gas-oil million kWh 66,987 59,325 46,211 35,184 27,838
from natural gas million kWh 43,426 52,147 42,259 37,024 48,802
from coal & brown coal million kWh 21,872 23,316 25,883 28,038 25,978
from orimulsion million kWh 4,661 6,602 4,216 4,489 4,052
From renewables million kWh 35,488 34,660 31,423 24,834 23,792
thermal from biogas million kWh - - 25 - -
geothermal million kWh 4,128 4,415 4,239 4,382 5,036
hydro from natural flows million kWh 31,335 30,221 27,129 20,399 18,679
wind & solar (photovoltaic) million kWh 25 24 29 53 77
Hydro from pumped storage million kWh 6,379 6,477 6,961 7,543 7,333
Total million kWh 178,813 182,527 156,952 137,112 137,794
Consumption for pumping million kWh 8,800 9,066 9,653 10,595 10,369
Available generation million kWh 170,013 173,461 147,299 126,518 127,425
Electricity distribution
Electricity wheeled million kWh n.a. n.a. n.a. 258,469 244,426
Natural gas distribution
Natural gas wheeled million m3 - n.a. n.a. 3,166 3,493
Consumption of natural gas for operation of the grid million m3 - n.a. n.a. 2 6
Losses of natural gas along the grid million m3 - n.a. n.a. 11 12
Telecommunications
Voice usage - fixed telephony billion minutes n.a. n.a. n.a. 21.0 15.0
Voice usage - mobile telephony billion minutes n.a. n.a. n.a. 7.8 9.5
Internet usage billion minutes n.a. n.a. n.a. 27.0 24.7
n.a.: not available.

NOX emissions from fossil-fired thermalgeneration only power plants included within Enel’s present limits (thousand t)
The tables display the amounts of emissions in the gaseous, liquid and solid form.
The emissions of some substances into the atmosphere have a polluting effect, while the emissions
of other substances contribute to the greenhouse effect.
The most significant emissions into the atmosphere, which are quantitatively significant and typical
of Enel’s industrial activities are as follows: in the first category, sulfur dioxide (SO2), nitrogen oxides
(NOX), particulates and hydrogen sulfide (H2S); and, in the second category, carbon dioxide (CO2)
sulfur hexafluoride (SF6) and methane (CH4).
> SO2, NOX and particulates originate from the combustion process in thermal power plants.
The amounts shown include both emissions yearly reported to the Ministry of the Environment
(SO2 and NOX from “large combustion systems” and particulates from “steam-fired thermal
power plants”) and emissions from the other power plants.
Their values are obtained by multiplying their concentrations in the flue gases (generally
continuously monitored) by the volumes of the same flue gases. NOX are expressed in terms
of NO2-equivalent.
Over the years, all these emissions fell
significantly, thanks above all to: the wide
use and constant tuning of advanced
combustion systems (prevention measures);
the installation or upgrading of flue gas
abatement systems (desulfurizers in large
coal- and orimulsion-fired plants;
denitrification systems in the same plants
or in other plants when prevention
measures are insufficient; particulate
collection systems in almost all plants,
Emissions
Emissions into
the atmosphere
2003
285
238213
187
101
1999 2000 2001 2002
SO2 emissions from fossil-fired thermalgeneration only power plants included within Enel’s present limits (thousand t)
2003
89
71 7162
1999 2000 2001 2002 2003
10
9
76
3
1999 2000 2001 2002
Particulate emissions from fossil-firedthermal generation only power plants included within Enel’s present limits (thousand t)
78

including oil-fired ones; the latter systems are usually based on electrostatic precipitators, but
also on more efficient fabric filters, which are suitable for all-coal-fired plants); as well as the
use of high-grade fuels.
These emissions show a decrease even when reference is made only to the power plants included
within Enel’s present limits; this happened also in 2003, in spite of the above-mentioned
increase of thermal generation.
> H2S is the only potentially polluting substance which is present in significant amounts in
geothermal fluid.
Its values are estimated on the basis of periodical monitoring of the composition and flow rate
of geothermal steam used by power plants.
> CO2 is the typical product of combustion and, as such, the near totality of it derives from
thermal power plants. Small amounts - reported here in view of the attention paid to the
greenhouse effect – also derive from geothermal drilling (combustion of the gas-oil which
feeds the diesel engines of drilling equipment), from distribution of natural gas (combustion of
one fraction of the wheeled gas for heating of the gas upon depressurization) and from
telecommunications (combustion of gas-oil feeding the generating sets of telecommunications
installations).
CO2 is also contained, albeit in much lower amounts, in the reaction products from the process
of desulfurization of the flue gases outgoing from the boilers of some thermal power plants.
The CO2 from combustion is computed by applying specific emission factors to the consumption
of the various fuels. The factors used in the past conformed to the criteria adopted by the
Ministry of the Environment: 4.03 t of CO2/toe for coal and coal-derived products; 3.27 for oil
products; 2.35 for natural gas. Since 2001, these factors have been replaced by those recommended
by the 1996 IPPC (International Panel on Climate Change) Guidelines for national greenhouse
gas inventories and transposed into the second national report on greenhouse gas emissions:
3.24 t of CO2/toe for fuel oil; 3.38 for orimulsion; 3.10 for gas-oil; 2.35 for natural gas; 4.02 for
coal; 4.24 for brown coal. Each of these factors is then multiplied by a correction coefficient
which accounts for the typical fraction of unburned carbon: 0.980 for solid fuels; 0.990 for liquid
fuels; 0.995 for gaseous fuels. As in the past, the computation considers that the burned carbon
fraction – whose value, as indicated above, is now taken to be below 100% - is completely
oxidized to CO2.
As the application of the new emission factors and of the related correction coefficients was
extended to the entire time series, it also modified the time series of avoided CO2 emissions,
as well as of specific CO2 emissions (from fossil-fired thermal generation and total electricity
generation, see next Chapter on “Indicators”).
52 > 53 Eco-Balance and Indicators ENVIRONMENTAL REPORT 2003

The amount of CO2 from the desulfurization process is computed stoichiometrically from the
amount of limestone used.
In line with the aforesaid IPCC Guidelines, the following emissions have not been reported:
- emissions of CO2 from combustion of renewable organic sources, because the CO2 that is
released into the atmosphere practically offsets the CO2 that is absorbed by biomass during its
growth (these emissions only refer to 2001, when Enel generated electricity from landfill gas);
- emissions of CO2 from geothermal steam, which are not regarded as anthropogenic; indeed,
the emissions from geothermal power plants are counterbalanced by an equivalent reduction
of natural emissions – visible or invisible exhalations – from the soil of geothermal areas.
> SF6 is used in high- and medium-voltage electrical equipment as an insulant and for electric arc
extinction; in these applications, it is irreplaceable. Its emissions into the atmosphere are due to
leaks from the above equipment. In 2003, 28% of SF6 emissions were due to electricity
generation, 32% to electricity transmission and 40% to electricity distribution.
These emissions are determined with a complex procedure (difference between the weights of
SF6 contained in the bottles used for replenishment, at the start of the year and at the end of
the year, increased by the weight of SF6 contained in the bottles purchased or acquired during
the year and decreased by the weight of SF6 contained in the bottles transferred during the
year). This procedure makes it possible to report fairly reliable data on SF6 emissions.
The amounts of SF6 are expressed in weight of SF6 and in weight of CO2-equivalent, in terms of
Global Warming Potential (GWP = 23,900).
The values of SF6, when expressed in CO2-equivalent, appear to be extremely low (in 2003, 1.7‰
of Enel’s overall greenhouse gas emissions). The variability of SF6 emissions from one year to the
other is largely due to the occasional character of the above-mentioned replenishment jobs.
> CH4 emissions are due to the losses of natural gas from the distribution grid.
They are determined on the basis of grid losses, taking into account the methane content of
natural gas (average value in 2003: 92.9%) and its density (average value in 2003: 0.555 kg/m3).
They are expressed both in weight of CH4 and in weight of CO2-equivalent, in terms of Global
Warming Potential (GWP = 21).
The values of CH4, when expressed in CO2-equivalent, appear to be extremely low (1.8‰ of
Enel’s overall greenhouse gas emissions in 2003).
With regard to ‘minor’ pollutants (e.g. metals), Enel conducted extensive programs of monitoring
of their concentrations, under different conditions of types of fuel and presence of flue gas
abatement systems. The results indicate that these concentrations comply – with wide margins –
with the point-source limits of emissions established by the Ministerial Decree of July 12, 1990.

Avoided CO2 emissions are an indicator of the environmental benefits arising from the mix of energy
sources used for production processes and from the efficiency of the full cycle, from the utilization of
the sources to the end-uses of the various products.
The tables show the CO2 emissions which were avoided thanks to electricity generation from
renewables, rather than from the otherwise necessary conventional fuels.
These emissions are determined by multiplying the electricity generation from each renewable source
by the average specific CO2 emissions from Enel’s fossil-fired thermal generation. In the case of hydro
power, reference is made to generation from natural flows alone, excluding the contribution of
pumped-storage power plants.
The reported percentage variations are obviously consistent with the corresponding variations in
electricity generation.
In 2003, generation of electricity from renewables avoided over 18% of CO2 emissions, which would
have been produced by Enel’s electric activities, should generation from renewables have been absent.
Waste waters include residual process water and meteoric waters collected from the outdoor areas
of thermal power plants. After being treated, these waters are in part used inside the plants – thereby
contributing to the coverage of water requirements for industrial uses – and in part returned to
water bodies.
The volumes of waste waters are estimated by referring to the potential capability of water treatment
systems, to their utilization, as well as to the modes of operation of the power plants where these
systems are installed.
As is obvious, their trend is reflective of the trend of water requirements for industrial uses.
However, in 2003, owing to scarce rainfall, the amount of waste waters decreased, in spite of the
above-mentioned increase in water requirements.
Waste waters carry substances that alter the physico-chemical characteristics of the recipient water
bodies, thus having a negative impact on ecosystems and preventing subsequent water uses (e.g. for
drinking and farming).
In the case of Enel, the extent of the problem is much smaller than in other industries, such as the
chemical industry. Nevertheless, the applicable legislation specifies strict limits for concentration of
pollutants, with which Enel complies thanks to the use of treatment systems. Note that treatment
systems are also needed for the waste waters that are reused inside Enel’s power plants (reducing
the requirements of water for industrial uses) to comply with specifications.
In the treatment, waste waters are distinguished on the basis of their characteristics (acidic/alkaline,
54 > 55 Eco-Balance and Indicators ENVIRONMENTAL REPORT 2003
Waste waters
Releases into water
bodies
Avoided CO2
emissions

oily, coming from desulfurizer drains, meteoric, sanitary), and some of their parameters (e.g. conductivity,
pH, turbidity, dissolved oxygen and oil content) are continuously monitored. This monitoring activity
ensures compliance with regulatory limits; indeed, when pollutant concentrations get close to regulatory
limits, waste waters are treated again.
Over the years, larger and larger samples of power plants have had their waste water releases
monitored. The generalized use of environmental management systems (albeit not yet certified) in
thermal power plants made it possible – for the first time in 2003 – to report, for all waste water
releases (i.e. net of the amounts used inside power plants), overall emissions of typical and quantitatively
significant pollutants (metals and compounds, nitrogen and compounds, phosphorus and compounds),
as well as COD (Chemical Oxygen Demand) and BOD (Biochemical Oxygen Demand).
The data were obtained by multiplying the concentrations by the volumes of waste waters discharged
into water bodies.
Special waste represents the refuse from Enel’s industrial activities. This refuse is regulated by
Legislative Decree no. 22 of February 5, 1997, as amended, which classifies it into non-hazardous
and hazardous waste.
> Non-hazardous waste includes not only
coal ash and gypsum from desulfurization,
but also fuel-oil bottom ash, orimulsion ash
(from 2002, only bottom ash) and other
materials which are typical of the various
activities: machinery & equipment and their
parts; supports of power lines; conductors;
cables; sludges from water treatment;
materials removed by Enel from the
trashracks of hydro plant intake structures;
the portion of alluvial sediments that is
removed from hydro basins upon desilting
and that is not reused locally; drill cuttings
from geothermal activities, etc. This waste
also includes materials of a general or
exceptional nature (packaging materials,
clothing, debris from construction and
demolition, etc.).
Special waste
■ Coal ash 60.9%
■ Gypsum from desulfurization 25.0%
■ Machinery & equipment 2.7%
■ Sludges from water treatment 4.5%
■ Materials removed from trashracks 1.5%
■ Geothermal drill cuttings 0.6%
■ Packaging materials 0.1%
■ Other 4.7%
Non-hazardous special waste in 2003Total production: 1,772,962 t

> Hazardous waste comprises fuel-oil flyash, materials which are typical of the various activities
(namely, PCB-containing transformers and capacitors, their parts, batteries, used oils, sludges
from condensation of geothermal steam, etc.) or of a general or exceptional nature (dirt and
deposits, asbestos, etc.).
The waste data (aggregated by the most representative types) are those yearly reported to the Public
Inventory of Waste. These reports are based on the qualitative and quantitative characteristics of the
waste, recorded at least on a weekly basis in the books of incoming and outgoing waste.
“Waste production” refers to the amounts of waste recorded as “incoming waste” in the books of
incoming and outgoing waste.
“Waste delivered to recovery operators” refers to the amounts of waste which is delivered to authorized
operators of waste recovery plants (possibly, Enel itself).
The following trends emerge from the data:
> the production of ash is obviously correlated with fuel consumption and characteristics, but it
reflects fluctuations that depend on: the frequency of ash removal from flue gas ducts and
from the hoppers of boilers and of particulate collectors; the possible addition of water to the
ash to prevent the formation of dust during its temporary storage on the plant site; the combustion
of flyash in the upper part of boiler furnaces in the case of dual oil-gas firing, etc.;
> the production of gypsum from desulfurization reflects limestone consumption;
> the production of “other waste”, non-hazardous and hazardous, may depend on contingent
circumstances, such as demolition work and environmental rehabilitation efforts (e.g. 2001-2006
Plan of Environmental Rehabilitation of Geothermal Areas).
56 > 57 Eco-Balance and Indicators ENVIRONMENTAL REPORT 2003
■ Fuel-oil flyash 33.9%
■ Machinery & equipment 17.8%
■ Used oils with PCBs > 25 ppm 0.7%
■ Used oils free of PCBs or with PCBs ≤ 25 ppm 6.5%
■ Used batteries 2.1%
■ Asbestos-containing materials 5.9%
■ Other 33.1%
Hazardous special waste in 2003Total production: 33,909 t
Main categories of special waste in 2003 (thousand t)
Coa
l ash
Gyp
sum
fro
mde
sulfu
rizat
ion
Oth
er n
on-h
azar
dous
spec
ial w
aste
Fuel
-oil
flyas
h
Oth
er h
azar
dous
spec
ial w
aste
Tota
l was
te
1,07
9.7
1,80
6.9
1,64
7.8
1,06
5.7
442.
6
431.
0 250.
6
142.
3
11.5
0.95 22
.4
7.8
■ Production ■ Delivery to recovery operators

Note, in the Tables, that the amounts of “waste delivered to recovery operators” may exceed those
of “waste production”, when the waste has been temporarily stored on the plant site in a given year
but delivered to recovery operators only in the subsequent year.
Finally, it is worth stressing that, in 2003, 141,300 tons of alluvial sediments (removed with mechanical
equipment upon desilting of basins) were used locally (e.g. for restoring the embankments of hydro
basins) and thus not included in waste production.

58 > 59 Eco-Balance and Indicators ENVIRONMENTAL REPORT 2003
Emissions
Source
1999 2000 2001 2002 2003
Emissions into the atmosphere
SO2 fossil-fired thermal generat. thousand t 404 354 284 196 101
NOX fossil-fired thermal generat. thousand t 144 129 101 75 62
Particulates fossil-fired thermal generat. thousand t 16 14 10 6 3
H2S geothermal generation thousand t 25 28 25 21 24
CO2 fossil-fired thermal generat.
(from combustion) thousand t 95,170 97,718 83,742 75,246 71,345
fossil-fired thermal generat.(from desulfurization) thousand t 147 143 133 144 112
total from fossil-fired thermal generation thousand t 95,317 97,861 83,875 75,391 71,457
geothermal drilling,gas distribution,telecommunications thousand t n.a. n.a. n.a. 19 24
Total thousand t n.a. n.a. n.a. 75,410 71,482
SF6 electricity generation,transmission & distribution kg 3,447 4,906 4,398 4,652 5,099
thousand tCO2-equivalent 82 117 105 111 122
CH4 gas distribution thousand t - n.a. n.a. 6 6
thousand tCO2-equivalent - n.a. n.a. 120 132
Total greenhouse gases thousand t(CO2, SF6, CH4) CO2-equivalent n.a. n.a. n.a. 75,641 71,736
Avoided CO2 emissions
Hydro generation from natural flows thousand t 21,809 20,917 19,191 14,684 12,513
Geothermal generation thousand t 2,873 3,056 2,999 3,154 3,373
Generation from wind & solar thousand t 17 17 20 38 52
Generation from biogas thousand t - - 18 - -
Total thousand t 24,700 23,989 22,228 17,876 15,938
Waste waters(discharged into water bodies) thermal generation million m3 23.0 22.3 20.2 16.4 12.6
Releases into water bodies
Metals and compounds (expressed as metal equivalent) thermal generation kg n.a. n.a. n.a. n.a. 4,605
Total nitrogen (expressed as N) thermal generation kg n.a. n.a. n.a. n.a. 50,696
Total phosphorus (expressed as P) thermal generation kg n.a. n.a. n.a. n.a. 3,381
COD thermal generation kg n.a. n.a. n.a. n.a. 408,067
BOD thermal generation kg n.a. n.a. n.a. n.a. 62,575
n.a.: not available.

Emissions
Source
1999 2000 2001 2002 2003
Special wasteNon-hazardous
Coal bottom ash thermal generation
production t 50,542 34,738 63,761 58,311 35,855
delivery to recovery operators t 50,097 34,265 63,735 58,336 35,855
Coal flyash thermal generation
production t 839,411 952,367 1,056,605 1,146,320 1,043,885
delivery to recovery operators t 891,744 958,411 981,465 1,078,017 1,029,882
Gypsum from desulfurization thermal generation
production t 509,294 562,220 470,240 579,777 442,598
delivery to recovery operators t 502,325 574,151 428,666 547,872 431,009
Other
production electricity generation& geothermal drilling t 116,473 135,950 168,867 219,723 203,717
electricity transmission& distribution t 96,537 87,842 61,598 52,218 45,853
gas distribution& telecommunications n.a. n.a. n.a. 233 1,053
Total t n.a. n.a. n.a. 272,174 250,623
delivery to recovery operators electricity generation& geothermal drilling t 74,706 81,222 116,938 99,950 95,553
electricity transmission& distribution t 86,016 83,074 57,145 49,422 45,751
gas distribution& telecommunications n.a. n.a. n.a. 116 1,012
Total t n.a. n.a. n.a. 149,488 142,316
Total
production electricity generation& geothermal drilling t 1,515,719 1,685,275 1,759,473 2,004,131 1,726,055
electricity transmission& distribution t 96,537 87,842 61,598 52,218 45,853
gas distribution& telecommunications n.a. n.a. n.a. 233 1,053
Total t n.a. n.a. n.a. 2,056,582 1,772,962
delivery to recovery operators electricity generation& geothermal drilling t 1,518,872 1,648,049 1,590,803 1,784,175 1,592,299
electricity transmission& distribution t 86,016 83,074 57,145 49,422 45,751
gas distribution& telecommunications n.a. n.a. n.a. 116 1,012
Total t n.a. n.a. n.a. 1,833,714 1,639,061
n.a.: not available.
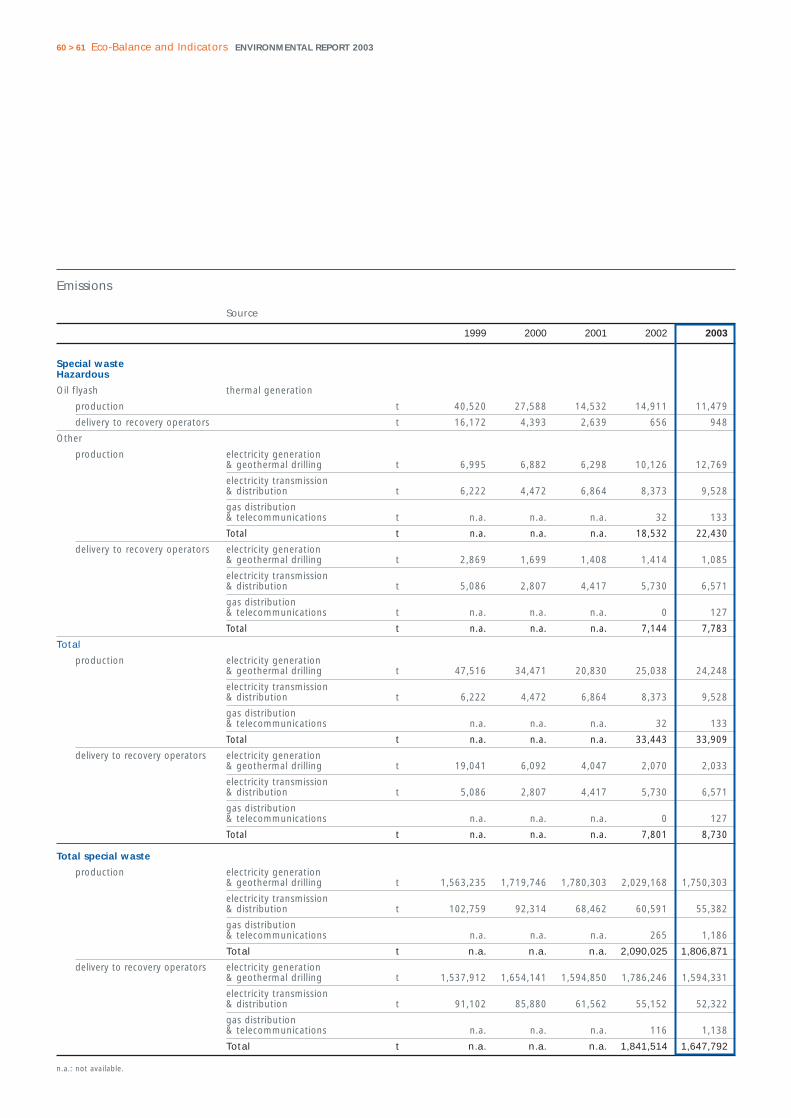
60 > 61 Eco-Balance and Indicators ENVIRONMENTAL REPORT 2003
Emissions
Source
1999 2000 2001 2002 2003
Special waste Hazardous
Oil flyash thermal generation
production t 40,520 27,588 14,532 14,911 11,479
delivery to recovery operators t 16,172 4,393 2,639 656 948
Other
production electricity generation & geothermal drilling t 6,995 6,882 6,298 10,126 12,769
electricity transmission& distribution t 6,222 4,472 6,864 8,373 9,528
gas distribution & telecommunications t n.a. n.a. n.a. 32 133
Total t n.a. n.a. n.a. 18,532 22,430
delivery to recovery operators electricity generation & geothermal drilling t 2,869 1,699 1,408 1,414 1,085
electricity transmission& distribution t 5,086 2,807 4,417 5,730 6,571
gas distribution & telecommunications t n.a. n.a. n.a. 0 127
Total t n.a. n.a. n.a. 7,144 7,783
Total
production electricity generation & geothermal drilling t 47,516 34,471 20,830 25,038 24,248
electricity transmission& distribution t 6,222 4,472 6,864 8,373 9,528
gas distribution & telecommunications n.a. n.a. n.a. 32 133
Total t n.a. n.a. n.a. 33,443 33,909
delivery to recovery operators electricity generation & geothermal drilling t 19,041 6,092 4,047 2,070 2,033
electricity transmission& distribution t 5,086 2,807 4,417 5,730 6,571
gas distribution & telecommunications n.a. n.a. n.a. 0 127
Total t n.a. n.a. n.a. 7,801 8,730
Total special waste
production electricity generation & geothermal drilling t 1,563,235 1,719,746 1,780,303 2,029,168 1,750,303
electricity transmission& distribution t 102,759 92,314 68,462 60,591 55,382
gas distribution & telecommunications n.a. n.a. n.a. 265 1,186
Total t n.a. n.a. n.a. 2,090,025 1,806,871
delivery to recovery operators electricity generation & geothermal drilling t 1,537,912 1,654,141 1,594,850 1,786,246 1,594,331
electricity transmission& distribution t 91,102 85,880 61,562 55,152 52,322
gas distribution & telecommunications n.a. n.a. n.a. 116 1,138
Total t n.a. n.a. n.a. 1,841,514 1,647,792
n.a.: not available.

Indicators (ratios between homogeneous or heterogeneous quantities) are used to analyze Enel's
environmental performance over time, regardless of the volume of activities in each year.
The following paragraphs describe the characteristics of the indicators presented in the tables and
provide comments, if any, on their trends.
> The net heat rate of fossil-fired thermal generation defines the average quantity of fossil fuels,
which are consumed by thermal power plants to generate one kWh net.
Its trend in the first four years of the period is the result of the opposite effects of the growing
internal electricity consumption related to the wide use of flue gas abatement systems and of
the entry into operation of new high-efficiency combined-cycle plants. The latter was by far
predominant in 2003.
> The net heat rate of geothermal generation defines the average quantity of geothermal steam
which is used by geothermal power plants to produce one kWh net.
Its trend reflects the increasingly efficient utilization of the geothermal resource, thanks also to
the renovation of some old plants. In 2001, owing to the shutdown of these plants for the
works, the net heat rate of geothermal generation was significantly lower than the average
recorded in the first four years of the period.
> The net efficiency of hydro generation from pumped storage expresses, in percentages, the
ratio of the electricity produced by pumped-storage hydro power plants to the electricity
consumed for pumping.
> The natural gas consumption for operation of the grid and the losses of natural gas from the
grid are expressed as percentages of the total gas distributed.
> The net specific requirements of water for industrial uses in thermal generation express the
amount of water consumed per kWh net of thermal generation.
Their increase in 2003 is mainly ascribable to the entry into operation of the last desulfurizers
and of the cooling towers installed in the Fusina and Porto Marghera power plants. If the
Indicators
Conservation and
quality of resources
Net heat rate of fossil-fired thermal generation(kcal/kWh)
2003
2,267 2,269
2,279 2,278
2,184
1999 2000 2001 2002
Net heat rate of geothermal generation(kcal/kWh)
2003
5,605
5,534
5,411
5,491
5,324
1999 2000 2001 2002

62 > 63 Eco-Balance and Indicators ENVIRONMENTAL REPORT 2003
contribution of as-is sea water (main source for covering the water requirements of desulfurizers)
is excluded, the increase is much less significant.
> The percentage contributions to coverage of the requirements of water for industrial uses show
the downward trend of inland waters (rivers, wells and aqueducts) in the past three years.
> The fossil fuel consumption reflects: a further substantial decrease of fuel oils (now only low- and
very low-sulfur - LS and VLS - oils are used) and the role of natural gas as the dominant fuel.
Thanks to the entry into operation of new combined-cycle power plants, the technologically
captive uses of gas have more than doubled in the last year, prevailing over non-captive uses,
i.e. uses of gas in lower-efficiency multi-fuel plants in order to respond to local environmental
needs.
> The share of geothermal fuel which has suitable thermodynamic characteristics and is thus
allocated to electricity generation accounts for the near totality of the total geothermal fluid
extracted.
20031999 2000 2001 2002
■ Contribution of as-is sea water
20031999 2000 2001 2002
■ Waste waters (used inside plants)
■ Sea water
■ Inland waters
2003
44.2 45.9 43.4 45.4
58.0
1999 2000 2001 2002 2003
2.3 2.42.7
3.2
3.7
1999 2000 2001 2002
Consumption of natural gas and VLS fuel oil(% of total fuel consumption for fossil-fired thermal generation)
Thermal generation from biogas, geothermal,wind & solar (photovoltaic) sources vs. totalelectricity generation (%)
Specific requirements of water for industrialuses in thermal generation(liters/kWh)
Coverage of requirements of water for industrial uses(%)
0.30
40.
089
0.30
30.
049
0.32
80.
043
0.30
90.
056
0.32
0
54.9
61.5
62.8
54.8
51.5
7.6
7.2
7.2
8.0
7.4
37.5 31
.3
30.0
37.2
41.1
0.08
7

> The generation from renewables, expressed as a percentage of total electricity generation,
reflects a low value of the hydro energy capability index also in 2003, but shows the progressive
growth of all other contributions.
As far as electricity generation is concerned, they express the amounts of the typical and significant
substances (see page 51 - “Emissions into the atmosphere”) that are released into the atmosphere
per kWh net of (thermal, geothermal or total) electricity generation.
Specific emissions represent:
> for SO2, NOX and particulates: the cumulative effect of the fossil fuel mix, of the efficiency of
thermal power plants and of direct prevention and abatement measures;
> for CO2: the cumulative effect of the fossil fuel mix and of the efficiency of thermal power
plants; the contribution due to the operation of desulfurizers is definitely marginal but included
in the data;
> for H2S: the cumulative effect of the composition of geothermal steam and of the efficiency
of geothermal power plants and abatement systems.
The trends of specific emissions of SO2, NOX and particulates show progressive reductions, thanks to
the combined effect of: i) advanced combustion systems; ii) flue gas emission abatement systems,
whose phasing-in was completed as part of the plan for retrofitting thermal plants for environmental
compliance; iii) growing reliance on high-grade fuels; and ii) increase of the average efficiency of
thermal power plants.
In 2003, the ratio of CO2 emissions to net fossil-fired thermal generation had the lowest value in the
period, thanks to the increase in the average efficiency of thermal plants and to the dominant use of
natural gas. In 1990, such ratio was equal to 738 g/kWh.
Specific emissions
into the atmosphere
2003
2.9
2.5 2.4
1.9
0.9
1999 2000 2001 2002
Specific SO2 emissions from fossil-firedthermal generation(g/kWh net)
Specific NOX emissions from fossil-firedthermal generation(g/kWh net)
2003
1.1
0.90.8
0.70.6
1999 2000 2001 2002

In line with a practice adopted by many electricity companies, specific CO2 emissions are also determined
with reference to total (net) generation of electricity, thereby mirroring also the effect of the overall
mix of energy sources.
Also from the latter standpoint, the value of specific CO2 emissions is the lowest in the period, in
spite of the continued decrease of the share of generation from renewables in total electricity
generation (in 1990: 618 g/kWh).
Relative SF6 emissions, which concern all electric activities, express the ratio of the yearly emissions of
SF6 to the volume of SF6 contained in in-service & in-stock equipment, as well as in the bottles used
for replenishment.
Although the percentages of SF6 over the years show fluctuations (due above all to the occasional
character of replenishment jobs), they all lie below the typical value indicated in the 1996 IPCC
Guidelines for national greenhouse gas inventories (1%).
The ratio of CH4 emissions to the total gas wheeled expresses the specific emissions of this gas
during distribution.
The reported values are well below those suggested by the 1996 IPCC Guidelines for national
greenhouse gas inventories (2.5 to 6.2 g of CH4 per m3 of natural gas distributed). However, it should
be pointed out that the IPCC values refer to all the activities included in natural gas transport and
distribution in Western Europe.
64 > 65 Eco-Balance and Indicators ENVIRONMENTAL REPORT 2003
2003
0.110.10
0.09
0.06
0.03
1999 2000 2001 2002
Specific particulate emissions from fossil-fired thermal generation(g/kWh net)
Specific CO2 emissions from fossil-firedthermal generation (g/kWh net)
2003
696 692707
720
670
1999 2000 2001 2002

They express the amount of typical and significant substances (see page 54 - “Releases into water
bodies”) which are entrained by the share of waste waters of thermal power plants that are returned
to water bodies, per kWh net of thermal generation.
As is obvious, these releases are chiefly dependent on the efficiency of waste water treatment systems
and cannot be easily correlated with other factors concerning the power plants and their modes of
operation.
Ash is the only waste which has a significant correlation with the volume of activities. As a result, the
tables show the production of coal ash (bottom ash and flyash) and of fuel-oil flyash per kWh of the
corresponding generation.
The use of better quality fuels (lower production of ash) and the generalized application of advanced
particulate collection technologies (higher production of flyash) have opposite effects which are
accompanied by fluctuations that depend on contingent circumstances, as previously pointed out
with reference to the waste production figures in absolute terms.
For the main groups of waste, this indicator expresses the ratio of the quantities delivered to recovery
operators to the quantities produced.
The trends infer that:
> recovery of the near totality of coal ash and gypsum remains a well-established practice;
> recovery of fuel-oil ash, previously reflecting a progressive drop in demand by the markets of
recovered materials (heavy metals), had a sustained value in 2003;
> recovery of “other” non-hazardous and hazardous waste from electricity generation and
geothermal drilling was, again, penalized by the need for delivering to disposal facilities most
of the exceptional amount of waste resulting from the implementation of the geothermal site
rehabilitation plan;
> recovery of non-hazardous waste and
hazardous waste from electricity
transmission and distribution (already
excellent values for non-hazardous waste
and significant values for hazardous waste)
rose further in the last year;
> recovery of non-hazardous and hazardous
waste from gas distribution and
telecommunications reached excellent
levels in 2003.
Specific releases into
water bodies
Specific waste
production
Waste recovery
Total waste recovery(% of production)
2003
98 9690 88
91
1999 2000 2001 2002

With regard to landscape and land conservation, note the progressive increase in the percentage of
overhead and underground cables for low- and medium-voltage lines and, accordingly, the gradual
decrease of bare conductors.
66 > 67 Eco-Balance and Indicators ENVIRONMENTAL REPORT 2003
Land
2003
65.2
66.466.9
67.5
68.5
1999 2000 2001 2002
Overhead and underground cables in low- and medium-voltage lines (% of entire LV and MV grid)

Indicators% %
1999 2000 2001 2002 2003 (‘03-’99)/’99 (‘03-’02)/’02
Resource conservation and qualityNet heat rate of fossil-fired thermal generation kcal/kWh 2,267 2,269 2,279 2,278 2,184 -3.7 -4.2Net heat rate of geothermal generation kcal/kWh 5,605 5,534 5,411 5,491 5,324 -5.0 -3.0Net efficiency of hydro generation from pumped storage % 72.5 71.4 72.1 71.2 70.7 -2.5 -0.7Consumption of natural gas for operation of the gas grid % of natural gas distributed - n.a. n.a. 0.06 0.16 - 169.7Losses of natural gas along the grid % of natural gas distributed - n.a. n.a. 0.35 0.35 - 0.0Net specific requirements of water for industrial uses in thermal generation
including contribution of as-is sea water liters/kWh 0.393 0.352 0.371 0.364 0.407 3.5 11.6excluding contribution of as-is sea water liters/kWh 0.304 0.303 0.328 0.309 0.320 5.3 3.7
Coverage of requirements of water for industrial uses
from rivers % of requirements 20.6 21.7 24.2 22.0 22.2 7.9 0.9from wells % of requirements 24.0 28.2 25.9 18.2 16.5 -31.2 -9.3from aqueducts % of requirements 10.2 11.5 12.7 14.5 12.7 24.7 -12.0from the sea (as is) % of requirements 22.7 13.8 11.6 15.3 21.3 -5.9 39.5from the sea (desalinated) % of requirements 14.8 17.5 18.4 21.9 19.8 33.3 -9.8from waste waters (used inside plants) % of requirements 7.6 7.2 7.2 8.0 7.4 -3.5 -8.3
Fossil fuel consumption for thermal generationfuel oil % of total fuel consumption 48.5 41.6 38.9 34.1 27.6 -43.0 -18.9orimulsion % of total fuel consumption 3.6 5.1 3.9 4.5 4.2 17.1 -7.3gas-oil % of total fuel consumption 0.7 0.4 0.3 0.2 0.4 -41.1 68.4natural gas % of total fuel consumption 30.7 34.6 33.1 31.7 40.3 31.5 27.1coal % of total fuel consumption 16.5 18.2 23.9 29.5 27.4 66.3 -6.9brown coal % of total fuel consumption 0.03 0.01 0.00 0.00 0.00 -100.0 -
HS fuel oil % of total fuel-oil consum. 7.5 1.2 2.0 0.1 0.0 -100.0 -100.0MS fuel oil % of total fuel-oil consum. 41.7 41.6 41.1 30.0 1.2 -97.0 -95.8LS fuel oil % of total fuel-oil consum. 22.9 30.1 30.4 29.7 35.0 52.8 17.8VLS fuel oil % of total fuel-oil consum. 27.9 27.1 26.5 40.2 63.8 128.4 58.5
natural gas. non-technologically captive use % of tot. natural gas consum. 70.5 72.1 62.5 72.9 41.0 -41.9 -43.8natural gas. technologically captive use % of tot. natural gas consum. 29.5 27.9 37.5 27.1 59.0 100.0 118.2
Geothermal steam for electricity generation % of total geothermal fluid extracted n.a. n.a. n.a. 99.5 99.5 n.a. 0.0
Electricity generation from renewablesthermal from biogas % of total generation - - 0.016 - - - -geothermal % of total generation 2.3 2.4 2.7 3.2 3.7 58.3 14.4hydro from natural flows % of total generation 17.5 16.6 17.3 14.9 13.6 -22.6 -8.9wind & solar (photovoltaic) % of total generation 0.014 0.013 0.018 0.038 0.056 299.9 45.3Total % of total generation 19.8 19.0 20.0 18.1 17.3 -13.0 -4.7
Specific emissions into the atmosphereSO2 (fossil-fired thermal generation) g/kWh thermal net 2.9 2.5 2.4 1.9 0.9 -68.0 -49.5NOX (fossil-fired thermal generation) g/kWh thermal net 1.1 0.9 0.8 0.7 0.6 -44.5 -19.0Particulates (fossil-fired thermal generation) g/kWh thermal net 0.11 0.10 0.09 0.06 0.03 -71.3 -43.7H2S (geothermal generation) g/kWh geothermal net 6.1 6.4 5.9 4.8 4.8 -20.1 0.1CO2 (fossil-fired thermal generation) g/kWh thermal net 696 692 707 720 670 -3.8 -6.9
g/kWh total net 533 536 534 550 519 -2.7 -5.7SF6 (electric activities) % of SF6 in stock
or in equipment 0.6 0.9 0.8 0.8 0.8 30.7 0.6CH4 (gas distribution) g/m3 of nat. gas wheeled - n.a. n.a. 1.8 1.8 - 0.1
Specific releases into water bodies(thermal generation) Releases into water bodies (expressed as metal equivalent) mg/kWh thermal net n.a. n.a. n.a. n.a. 0.04 n.a. n.a.Total nitrogen (expressed as N) mg/kWh thermal net n.a. n.a. n.a. n.a. 0.5 n.a. n.a.Total phosphorus (expressed as P) mg/kWh thermal net n.a. n.a. n.a. n.a. 0.03 n.a. n.a.COD mg/kWh thermal net n.a. n.a. n.a. n.a. 3.8 n.a. n.a.BOD mg/kWh thermal net n.a. n.a. n.a. n.a. 0.6 n.a. n.a.
n.a.: not available

68 > 69 Eco-Balance and Indicators ENVIRONMENTAL REPORT 2003
Indicators % %
1999 2000 2001 2002 2003 (‘03-’99)/’99 (‘03-’02)/’02
Specific production of waste
Coal ash g/kWh net from coal 41 42 43 43 42 2,2 -3,3
Fuel-oil flyash g/kWh net from fuel oil & gas-oil 0,60 0,47 0,31 0,42 0,41 -31,8 -2,7
Waste recovery
Coal ash % of production 106 101 93 94 99 -6,7 4,6
bottom ash % of production 99 99 100 100 100 0,9 0,0
flyash % of production 106 101 93 94 99 -7,1 4,9
Gypsum from desulfurization % of production 99 102 91 94 97 -1,3 3,1
Other non-hazardous special waste
electricity generation & geothermal drilling % of production 64 60 69 45 47 -26,9 3,1
electricity transmission & distribution % of production 89 95 93 95 100 12,0 5,4
gas distribution & telecommunications % of production n.a. n.a. n.a. 50 96 n.a. 92,4
Total % of production n.a. n.a. n.a. 55 57 n.a. 3,4
Total non-hazardous special waste
electricity generation & geothermal drilling % of production 100 98 90 89 92 -7,9 3,6
electricity transmission & distribution % of production 89 95 93 95 100 12,0 5,4
gas distribution & telecommunications % of production n.a. n.a. n.a. 50 96 n.a. 92,4
Total % of production n.a. n.a. n.a. 89 92 n.a. 3,7
Fuel-oil flyash % of production 40 16 18 4 8 -79,3 87,5
Other hazardous special waste
electricity generation & geothermal drilling % of production 41 25 22 14 8 -79,3 -39,2
electricity transmission & distribution % of production 82 63 64 68 69 -15,6 0,8
gas distribution & telecommunications % of production n.a. n.a. n.a. 0 95 n.a. -
Total % of production n.a. n.a. n.a. 39 35 n.a. -10,0
Total hazardous special waste
electricity generation & geothermal drilling % of production 40 18 19 8 8 -79,1 1,4
electricity transmission & distribution % of production 82 63 64 68 69 -15,6 0,8
gas distribution & telecommunications % of production n.a. n.a. n.a. 0 95 n.a. -
Total % of production n.a. n.a. n.a. 23 26 n.a. 10,4
Total special waste
electricity generation & geothermal drilling % of production 98 96 90 88 91 -7,4 3,5
electricity transmission & distribution % of production 89 93 90 91 94 6,6 3,8
gas distribution & telecommunications % of production n.a. n.a. n.a. 44 96 n.a. 118,7
Total % of production n.a. n.a. n.a. 88 91 n.a. 3,5
Land
LV cable lines
overhead cable (insulated) % of entire LV grid 50,4 50,8 51,5 52,1 52,0 3,3 -0,2
underground cable % of entire LV grid 29,2 29,8 29,7 29,6 30,4 4,3 2,7
Total % of entire LV grid 79,6 80,6 81,2 81,7 82,5 3,6 0,9
MV cable lines
overhead cable (insulated) % of entire MV grid 0,68 1,12 1,54 1,88 2,15 214,8 14,7
underground cable % of entire MV grid 33,8 34,8 34,8 35,2 36,1 6,7 2,4
Total % of entire MV grid 34,5 35,9 36,4 37,1 38,3 10,8 3,1
Double-circuit 380-kV lines % of total 380-kV lines 8,7 8,7 8,6 9,2 9,4 8,9 2,6
n.a.: not available


Occupational Health & Safety

Enel is committed to “spread and reinforce a culture of safety, developing an awareness of risks
while promoting responsible forms of behavior on the part of all staff members” (Code of Ethics).
Occupational health & safety are reiterated in the tenets of Enel’s environmental policy, whose
strategic targets include the application of the best international practices for the management
of safety in the various activities.
Health & safety in workplaces are an integral part of Enel’s culture and industrial policy and their
implementation actively involves all workers, as well as their representatives.
This commitment translates into actions on various fronts:
> awareness, education & training of employees;
> continuous updating of risk assessment documents;
> application of occupational health & safety systems conforming to the international
OHSAS 18001 specification.
The Corporate Personnel & Organization, Health & Safety, Regulations and Industrial Relations Unit
has the mission of issuing guidelines for the homogenous application of occupational health & safety
regulations throughout Enel.
The organization of these activities is described in a corporate document (issued in 1997, updated
in 2000 and under revision in 2003), which is used as a reference by all the units of Enel that are
responsible for health & safety.
In all of Enel’s sites, the so-called “Production Units” as well as their hierarchical and functional
organization (employer, manager, controller) have been identified since 1997. At the same time,
within each Production Unit, Enel also created the Prevention and Protection Service, appointing its
Manager and the Physicians in charge of health surveillance and risk monitoring.
It goes without saying that any organizational change within Enel requires an adaptation of its health
& safety organization.
The human resources that are permanently or partially dedicated to health & safety in workplaces
amount to over 350 equivalent full-time units.
In 2003, Enel delivered about 260,000 hours of training & education courses on health & safety at
work. These are, in practice, continuing education initiatives, which are intended for electrical
equipment workers and are focused on correct working practices and methods for mitigating the risk
of accidents. Enel also continued the delivery of training courses for the positions specified in
Legislative Decrees no. 626/94 (prevention and protection manager and staff, emergency team,
workers' safety & health representative) and no. 494/96 on the safety of temporary and mobile
construction sites (design coordinator, site management coordinator).
As regards office work, employees participate in yearly programs aimed at making them aware of the
72 > 73 Occupational Health & Safety ENVIRONMENTAL REPORT 2003
Protection of workers’ health and
improvement of workplace safety
Organization
Awareness, training & education

related risks (use of display screens, etc.) and of the procedures included in the emergency plans of
the individual industrial sites and offices.
Also for 2003, only the most significant items of current expenditure are reported under the following
macro-categories:
> awareness, training & education;
> health surveillance (appointment of the physician in charge, creation of health facilities,
periodical medical examinations, etc.);
> personnel dedicated to health & safety;
> individual protection systems;
> specialist studies and research (participation in national and international projects concerning
health & safety, epidemiological studies, analysis of the trend of injuries).
The above categories of expenditure amounted
to 32 million euro.
The "awareness, training & education" category
also embodies the activities listed in Legislative
Decrees no. 626/94 and no. 494/96, i.e. training
of workers' health & safety representatives,
prevention and protection managers and staff,
emergency team, design and site management
coordinators.
Investments in safety & health – most of which
are part of programs of reorganization,
renovation or retrofitting of office and/or plant
sites for compliance with the relevant legislation
– are not reported, owing to the difficulty of identifying them among overall investments.
Nevertheless, it is worth emphasizing that such investments always result into an improvement of the
general conditions of health & safety in workplaces.
In the course of 2003, Enel undertook efforts to mitigate risks in workplaces. These efforts, which are
also based on findings from focused studies & research, are complementary to specific prevention
and protection measures adopted in the individual working environments.
In particular:
> the Generation and Energy Management Division formulated an action plan; the plan provides
for greater involvement of the personnel (especially manual workers) in the definition and
implementation of prevention measures, as well as for closer and closer cooperation with
Expenditure
Initiatives
■ Awareness, training & education 19.1%
■ Health surveillance 10.4%
■ Occupational safety personnel 25.0%
■ Individual protection devices 44.6%
■ Studies & research 0.9%
Main items of current expenditureTotal: 32 million euro

contractors on awareness of risks in power plant sites and on related prevention and protection
measures, including the training of their personnel;
> also the Networks, Infrastructure and Sales Divisions set the target of minimizing the injuries of
their own personnel and of their contractors’/suppliers’ personnel; this target is pursued
through specific education & training courses to be delivered from 2004 to 2006; the courses
are mainly intended for Enel’s personnel in charge of supervising construction sites and for
those who will conduct audits and inspections on contracted-out work in order to verify the
adequacy of safety management provisions; with regard to third parties’ injuries arising from
improper behaviors in or around Enel’s industrial sites, awareness campaigns will be organized
for the most representative associations of sport fishing and of the construction industry;
> with a view to further improving workplace hygiene, safety and security in the Networks,
Infrastructure and Sales Divisions, major investments are planned (from 2004 to 2006) in the
buildings which are used as offices, warehouses or sites of field teams (total investments: 15
million euro);
> Terna obtained the ISO 9002 (now Vision 2000) certification for its quality assurance system,
which involves, among others, health & safety aspects; in the next three-year period, working
procedures and methods will be periodically revised, also in view of regulatory evolution, and
work-related accident awareness and mitigation actions will be initiated;
> in the next three years, with a view to maintaining its OHSAS 18001 health & safety management
system certification, Wind plans awareness actions for its employees as well as for its partners,
also by auditing and monitoring their health & safety organizations;
> in line with recent regulatory developments, Enelpower revised its guidelines for health & safety
in construction sites (Legislative Decree no. 494 of 1996) and for the formulation of health &
safety and coordination plans, by developing specific courses for design and construction-site
management personnel;
> in the course of 2003, at the request of external companies, such as Endesa Italia and Sogin,
Enel coordinated the preparation of the new edition of the Memorandum of Understanding on
prevention of electric risks upon maintenance of cross-border elements of the grid and of
elements with mutual interference; the new edition also laid down rules to be followed upon
the testing of power installations.
The process of OHSAS certification of working environments and procedures, started in 2002, now
covers about 64% of Enel’s sites. The certification process of the Generation and Energy Management
Division is at an advanced stage; with the completion of the process, expected by 2006, OHSAS-certified
sites will cover over 80% of Enel’s workforce.
74 > 75 Occupational Health & Safety ENVIRONMENTAL REPORT 2003

In 2003, the total number of occupational injuries continued to drop significantly. For the first time
since 1963, the frequency rate fell below 10 (9.7).
In the year, 6 serious injuries and 4 fatal injuries were recorded; of these, three were due to road
accidents during working hours and one to collision with moving objects. The most recurrent causes
of serious and fatal injuries in 1999-2003 were electrocution and falling from elevated areas.
Finally, in spite of its general downward trend, the number of serious and fatal injuries of contractors’
personnel in 2003 remained significant (37).
Injuries
20031999199819971996199519941993 2000 2001 2002
Number of injuries involving at least one dayof absence from work*
3,153
2,692
2,2042,073
1,754 1,680 1,605 1,6081,460 1,348
1,033
45
40
35
30
25
20
15
10
5
1965
1967
1969
1971
1973
1975
1977
1979
1981
1983
1985
1987
1989
1991
1993
1995
1997
1999
2001
2003
Fatal injuries*(no.)
20031999199819971996199519941993 2000 2001 2002
Number of injuries per million hours of work(frequency rate)
19.2
17.0
15.014.2
12.7 12.6 13.3 12.611.7 12.2
9.7
■ Electrical 36.5%
■ Collision with moving objects 9.4%
■ Falls from elevated areas 30.2%
■ Road accidents 15.6%
■ Other 8.3%
Serious and fatal injuries from 1999 to 2003Total: 96
* In the reported period Enel’s personnel progressively decreased.


Certification Report


Enel
Società per azioni
Registered office in Rome
137, Viale Regina Margherita
Capital Stock
Euro 6,063,075,189
fully paid-in
Tax I.D. and Companies’ Register
of Rome no. 00811720580
R.E.A. of Rome no. 756032
VAT Code no. 00934061003
DesignAReA - Rome
Publishing serviceIMAGE DESIGN - Rome
Copy editingpostScriptum - Rome
Photo/ Olivetti, Schmidt
Printed byPrimaprint - Viterbo
Printed in July 2004 on recycledFedrigoni Symbol Freelife
1,000 copies printed
Publication not for sale
Edited by the Communication Department


Certified capacity
51% ISO 14001

Registered capacity
27% EMAS

Reduction of specific emissions
CO2-7%

