energy in perspective
TRANSCRIPT

March 2017
ENERGY IN PERSPECTIVE Monthly Update
INSIDE THIS ISSUE:
Recent Simmons Transactions
Select M&A Transactions
Energy Industry Statistics and Forecasts
Public Markets - Key Trading Statistics
TABLE OF CONTENTS
Page 2 Energy In Perspective Monthly Update - As of February 28, 2017
Recent Simmons Transactions........................................................................................................................................................................................................................... 3
Select M&A Transactions .................................................................................................................................................................................................................................... 4
Energy Industry Statistics and Forecasts .................................................................................................................................................................................... 5 - 6
Public Markets - Key Trading Statistics ..................................................................................................................................................................................... 7 - 15
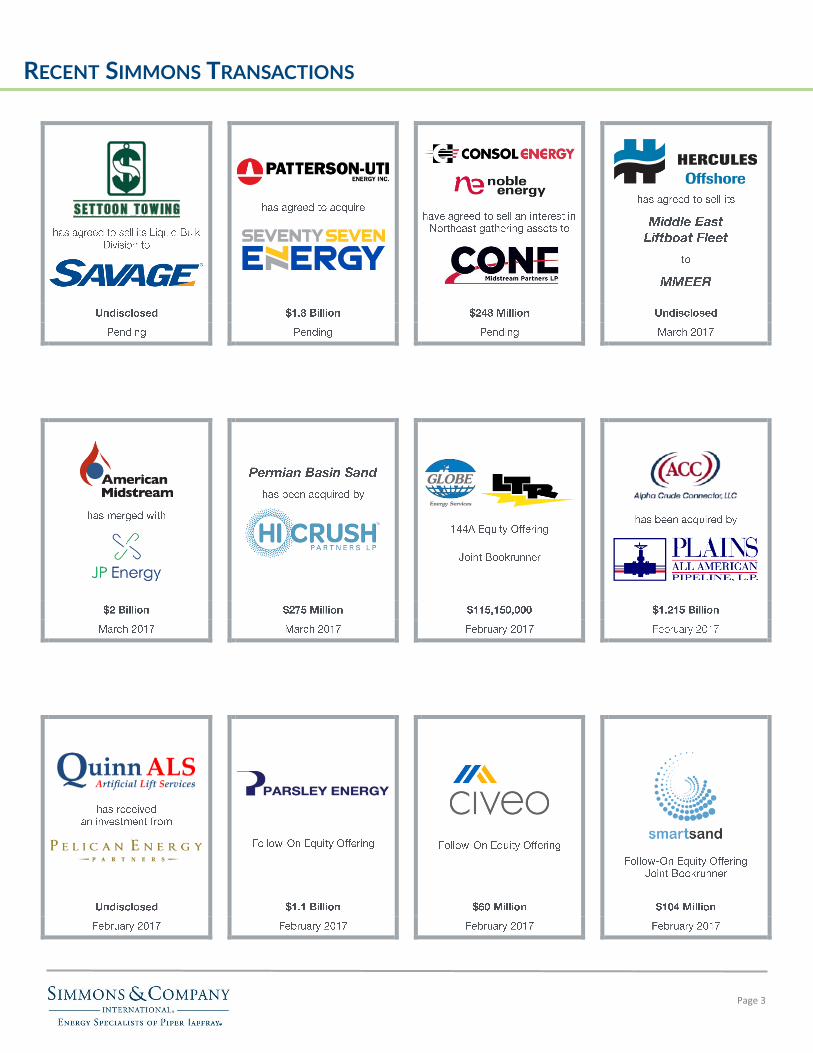
RECENT SIMMONS TRANSACTIONS
Page 3

SELECT M&A TRANSACTIONS
Page 4 Energy In Perspective Monthly Update - As of February 28, 2017
Source: Capital IQ, IHS Herold and Public Filings
*Simmons transactions denoted in light blue.
Date
Announced Buyer Target
Transaction
Amount ($MM) Description Sector
2/23/17 Hi-Crush Partners LP ("Hi-
Crush")
Permian Basin Sand ("PBS") $275 Hi-Crush has agreed to acquire PBS, the owner of a 1,226-acre frac sand
reserve consisting of more than 55 million tons of 100 mesh frac sand in the
Permain Basin, for $275 million.
Energy
Equipment &
Services
2/16/17 Benefit Street Partners
L.L.C. ("Benefit Street")
California Resources
Corporation ("CRC")
$250 CRC entered a joint venture with Benefit Street covering CRC’s oil and gas
properties in California. CRC will operate the properties, and Benefit Street will
invest up to $250 million for development opportunities in both conventional
and unconventional assets.
Exploration &
Production
2/14/17 Mike Mullen Energy
Equipment Resources, Inc.
("MMEER")
Hercules Liftboat
Company, LLC ("Hercules")
Undisclosed MMEER has agreed to acquire Hercules' Middle East Liftboat Fleet, comprising
the Amberjack, Kingfish and Whaleshark, for an undisclosed amount.
Energy
Equipment &
Services
2/13/17 Noble Midstream Partners
LP ("Noble");Plains All
American Pipeline LP
("Plains")
Advantage Pipeline, LLC
("Advantage Pipeline")
$133 Plains All American Pipeline LP ("Plains") and Noble Midstream Partners LP
("Noble") will form a 50-50 joint-venture to acquire the Advantage Pipeline in
the Southern Delaware basin.
Midstream /
Downstream
2/13/17 MPLX LP ("MPLX") Enbridge Incorporated
("Enbridge")
$220 A subsidiary of MPLX LP ("MPLX") has entered into an asset purchase
agreement with a subsidiary of Enbridge Incorporated ("Enbridge") to acquire the
Ozark Pipeline which originates in Cushing, OK and terminates in Wood River,
IL.
Midstream /
Downstream
2/9/17 EQT Corporation ("EQT") Stone Energy Corporation
("Stone Energy")
$527 EQT won a bankruptcy auction to acquire 53,400 core net Marcellus acres,
including drilling rights on 44,100 net acres in the Utica from Stone Energy for
$527 million in cash. The acquisition includes current natural gas production of
80 MMcfe/d, and the transaction implies a deal value of $6,588 per Mcfe of
daily production and $9,869 per acre.
Exploration &
Production
2/7/17 Pelican Energy Partners Quinn Artificial Lift Services
("Quinn ALS")
Undisclosed Pelican Energy Partners completed an equity investment in Quinn ALS, a
downhole rod pump manufacturing and service company headquartered in Red
Deer, Alberta, for an undisclosed amount.
Energy
Equipment &
Services
2/7/17 Parsley Energy, Inc.
("Parsley")
Double Eagle Energy
Permian LLC ("Double
Eagle")
$2,800 Parsley agreed to acquire undeveloped acreage and producing oil and gas
properties inthe Midland Basin from Double Eagle for an aggregate purchase
price of approximately $2.8 billion. The deals implies a deal value of $39,437
per acre. The acquisition also includes 23 drilled uncompleted wells, variously
targeting the Lower Spraberry, Middle Spraberry, Wolfcamp A, and Wolfcamp B
formations, with an average lateral length of approximately 8,400 feet.
Exploration &
Production
2/7/17 Savage Inland Marine, LLC
("Savage")
Settoon Towing, LLC
("Settoon")
Undisclosed Settoon Towing, LLC ("Settoon") sold its Liquid Bulk Division consisting primarily
of 35 towboats and 63 liquid tank barges with total capacity of nearly 2 million
barrels, to Savage Inland Marine, LLC ("Savage"). Settoon will retain and
continue to operate its legacy Gathering & Storage and Logistics & Vessel
Management business lines.
Midstream /
Downstream
2/6/17 Solstad Offshore ASA
("Solstad")
Farstad Shipping ASA
("Farstad") and Deep Sea
Supply
$1,270 Solstad has agreed to merge with Farstad and Deep Sea Supply, suppliers of
offshore service vessels (OSVs), for $1,926 million. The newly-consolidated
group will be called Solstad Farstad.
Energy
Equipment &
Services
12/20/16 National Oilwell Varco
("NOV")
Axiom Process Limited
("Axiom")
Undisclosed NOV has acquired Axiom, a leading developer and provider of solids control
technologies used in oil and gas drilling, for an undisclosed amount.
Energy
Equipment &
Services

ENERGY INDUSTRY STATISTICS AND FORECASTS
Page 5
Equity Market Indices - Indexed to Price as of 02/28/2016 U.S. Rig Count By Type
Source: Capital IQ Source: Baker Hughes
Brent vs. WTI Spot Prices NYMEX 3-2-1 Crack Spread
Source: Bloomberg Source: Bloomberg
Natural Gas Cash Prices - Henry Hub Market Working Natural Gas Storage
Source: Bloomberg Source: Energy Information Administration
70%
90%
110%
130%
150%
170%
190%
Feb-16 Apr-16 Jun-16 Aug-16 Oct-16 Dec-16 Feb-17
S&P 500 OSX Index
EPX Index Alerian MLP Index
0%
10%
20%
30%
40%
50%
60%
70%
80%
90%
0
100
200
300
400
500
600
700
800
Feb-16 Apr-16 Jun-16 Aug-16 Oct-16 Dec-16 Feb-17
Oil Directed Gas Directed % Horizontal
Rigs % Horizontal
$0
$20
$40
$60
$80
$100
$120
$140
$160
2010 2011 2012 2013 2014 2015 2016 2017
WTI Spot Brent Spot
Dollars Per Barrel
$0
$10
$20
$30
$40
$50
2010 2011 2012 2013 2014 2015 2016 2017
Dollars Per Barrel
$1.00
$1.50
$2.00
$2.50
$3.00
$3.50
$4.00
$4.50
$5.00
$5.50
2010 2011 2012 2013 2014 2015 2016 2017
HHUB Spot NYMEX Gas Futures
Dollars Per MMBtu
0
500
1,000
1,500
2,000
2,500
3,000
3,500
4,000
4,500
Jan Feb Mar Apr May Jun Jul Aug Sep Oct Nov Dec
2008 - 2013 Range
2013
2014
2015
2016
2017
Bcf

ENERGY INDUSTRY STATISTICS AND FORECASTS
Page 6 Energy In Perspective Monthly Update - As of February 28, 2017
Futures Pricing Futures Pricing
Source: Bloomberg Source: Bloomberg
International Jackup Rig Count & Utilization International Deepwater Rig Count & Utilization
Source: IHS Petrodata Source: IHS Petrodata
$30
$35
$40
$45
$50
$55
$60
$65
$70
Mar-17 Sep-17 Mar-18 Sep-18 Mar-19 Sep-19 Mar-20 Sep-20 Mar-21 Sep-21
Contract Expiry Month
WTI - 02/28/2017 WTI - 01/31/2017
Brent - 02/28/2017 Brent - 01/31/2017
Dollars per Barrel
40%
50%
60%
70%
80%
90%
100%
400
420
440
460
480
500
520
540
560
2010 2011 2012 2013 2014 2015 2016 2017
Total Supply % Utilization
Rigs Utilization
40%
50%
60%
70%
80%
90%
100%
0
50
100
150
200
250
300
350
2010 2011 2012 2013 2014 2015 2016 2017
Total Supply % Utilization
Rigs Utilization
$1.50
$2.00
$2.50
$3.00
$3.50
$4.00
$4.50
$5.00
$5.50
$6.00
$30
$35
$40
$45
$50
$55
$60
$65
$70
Mar-17 Sep-17 Mar-18 Sep-18 Mar-19 Sep-19 Mar-20 Sep-20 Mar-21 Sep-21
Contract Expiry Month
WTI - 02/28/2017 WTI - 01/31/2017
Henry Hub - 02/28/2017 Henry Hub - 01/31/2017
WTI ($/Bbl) Henry Hub ($/MMBtu)
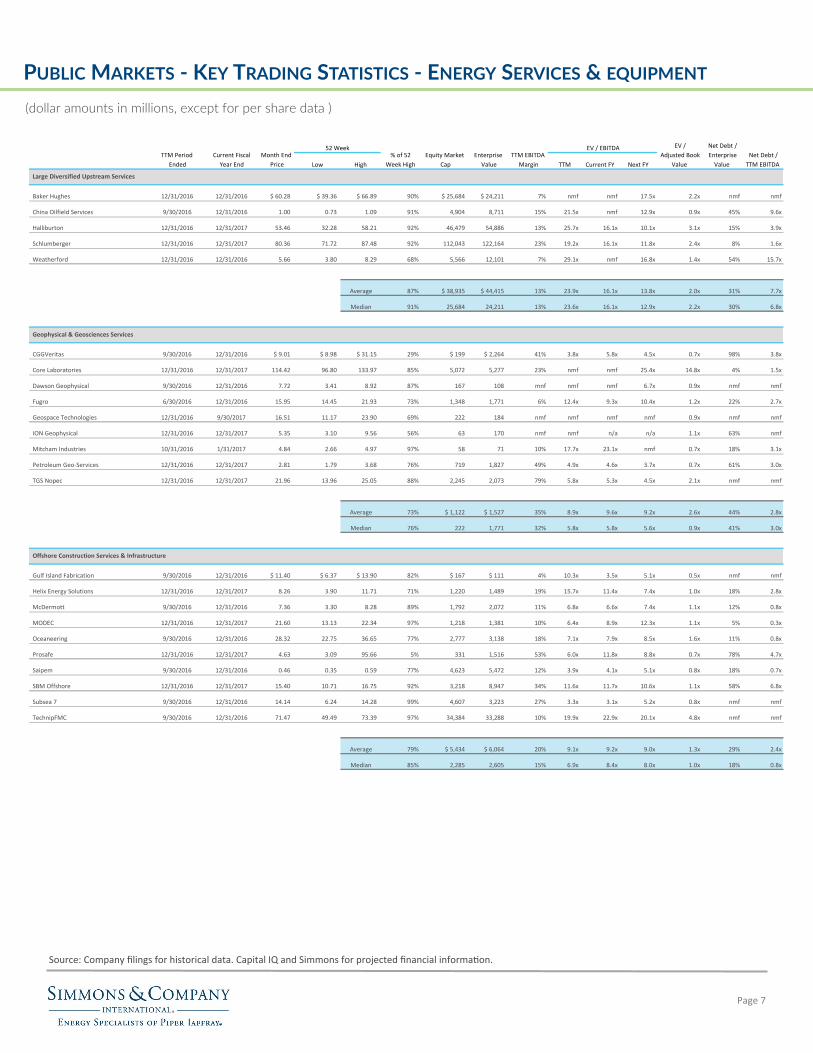
PUBLIC MARKETS - KEY TRADING STATISTICS - ENERGY SERVICES & EQUIPMENT
(dollar amounts in millions, except for per share data )
Page 7
Source: Company filings for historical data. Capital IQ and Simmons for projected financial information.
Low High TTM Current FY Next FY
Baker Hughes 12/31/2016 12/31/2016 $ 60.28 $ 39.36 $ 66.89 90% $ 25,684 $ 24,211 7% nmf nmf 17.5x 2.2x nmf nmf
China Oilfield Services 9/30/2016 12/31/2016 1.00 0.73 1.09 91% 4,904 8,711 15% 21.5x nmf 12.9x 0.9x 45% 9.6x
Halliburton 12/31/2016 12/31/2017 53.46 32.28 58.21 92% 46,479 54,886 13% 25.7x 16.1x 10.1x 3.1x 15% 3.9x
Schlumberger 12/31/2016 12/31/2017 80.36 71.72 87.48 92% 112,043 122,164 23% 19.2x 16.1x 11.8x 2.4x 8% 1.6x
Weatherford 12/31/2016 12/31/2016 5.66 3.80 8.29 68% 5,566 12,101 7% 29.1x nmf 16.8x 1.4x 54% 15.7x
Average 87% $ 38,935 $ 44,415 13% 23.9x 16.1x 13.8x 2.0x 31% 7.7x
Median 91% 25,684 24,211 13% 23.6x 16.1x 12.9x 2.2x 30% 6.8x
CGGVeritas 9/30/2016 12/31/2016 $ 9.01 $ 8.98 $ 31.15 29% $ 199 $ 2,264 41% 3.8x 5.8x 4.5x 0.7x 98% 3.8x
Core Laboratories 12/31/2016 12/31/2017 114.42 96.80 133.97 85% 5,072 5,277 23% nmf nmf 25.4x 14.8x 4% 1.5x
Dawson Geophysical 9/30/2016 12/31/2016 7.72 3.41 8.92 87% 167 108 mnf nmf nmf 6.7x 0.9x nmf nmf
Fugro 6/30/2016 12/31/2016 15.95 14.45 21.93 73% 1,348 1,771 6% 12.4x 9.3x 10.4x 1.2x 22% 2.7x
Geospace Technologies 12/31/2016 9/30/2017 16.51 11.17 23.90 69% 222 184 nmf nmf nmf nmf 0.9x nmf nmf
ION Geophysical 12/31/2016 12/31/2017 5.35 3.10 9.56 56% 63 170 nmf nmf n/a n/a 1.1x 63% nmf
Mitcham Industries 10/31/2016 1/31/2017 4.84 2.66 4.97 97% 58 71 10% 17.7x 23.1x nmf 0.7x 18% 3.1x
Petroleum Geo-Services 12/31/2016 12/31/2017 2.81 1.79 3.68 76% 719 1,827 49% 4.9x 4.6x 3.7x 0.7x 61% 3.0x
TGS Nopec 12/31/2016 12/31/2017 21.96 13.96 25.05 88% 2,245 2,073 79% 5.8x 5.3x 4.5x 2.1x nmf nmf
Average 73% $ 1,122 $ 1,527 35% 8.9x 9.6x 9.2x 2.6x 44% 2.8x
Median 76% 222 1,771 32% 5.8x 5.8x 5.6x 0.9x 41% 3.0x
Gulf Island Fabrication 9/30/2016 12/31/2016 $ 11.40 $ 6.37 $ 13.90 82% $ 167 $ 111 4% 10.3x 3.5x 5.1x 0.5x nmf nmf
Helix Energy Solutions 12/31/2016 12/31/2017 8.26 3.90 11.71 71% 1,220 1,489 19% 15.7x 11.4x 7.4x 1.0x 18% 2.8x
McDermott 9/30/2016 12/31/2016 7.36 3.30 8.28 89% 1,792 2,072 11% 6.8x 6.6x 7.4x 1.1x 12% 0.8x
MODEC 12/31/2016 12/31/2017 21.60 13.13 22.34 97% 1,218 1,381 10% 6.4x 8.9x 12.3x 1.1x 5% 0.3x
Oceaneering 9/30/2016 12/31/2016 28.32 22.75 36.65 77% 2,777 3,138 18% 7.1x 7.9x 8.5x 1.6x 11% 0.8x
Prosafe 12/31/2016 12/31/2017 4.63 3.09 95.66 5% 331 1,516 53% 6.0x 11.8x 8.8x 0.7x 78% 4.7x
Saipem 9/30/2016 12/31/2016 0.46 0.35 0.59 77% 4,623 5,472 12% 3.9x 4.1x 5.1x 0.8x 18% 0.7x
SBM Offshore 12/31/2016 12/31/2017 15.40 10.71 16.75 92% 3,218 8,947 34% 11.6x 11.7x 10.6x 1.1x 58% 6.8x
Subsea 7 9/30/2016 12/31/2016 14.14 6.24 14.28 99% 4,607 3,223 27% 3.3x 3.1x 5.2x 0.8x nmf nmf
TechnipFMC 9/30/2016 12/31/2016 71.47 49.49 73.39 97% 34,384 33,288 10% 19.9x 22.9x 20.1x 4.8x nmf nmf
Average 79% $ 5,434 $ 6,064 20% 9.1x 9.2x 9.0x 1.3x 29% 2.4x
Median 85% 2,285 2,605 15% 6.9x 8.4x 8.0x 1.0x 18% 0.8x
TTM Period
Ended
% of 52
Week High
Net Debt /
TTM EBITDA
Net Debt /
Enterprise
Value
Current Fiscal
Year End
Month End
Price
Enterprise
Value
TTM EBITDA
Margin
Equity Market
Cap
EV /
Adjusted Book
Value
52 Week EV / EBITDA
Offshore Construction Services & Infrastructure
Large Diversified Upstream Services
Geophysical & Geosciences Services
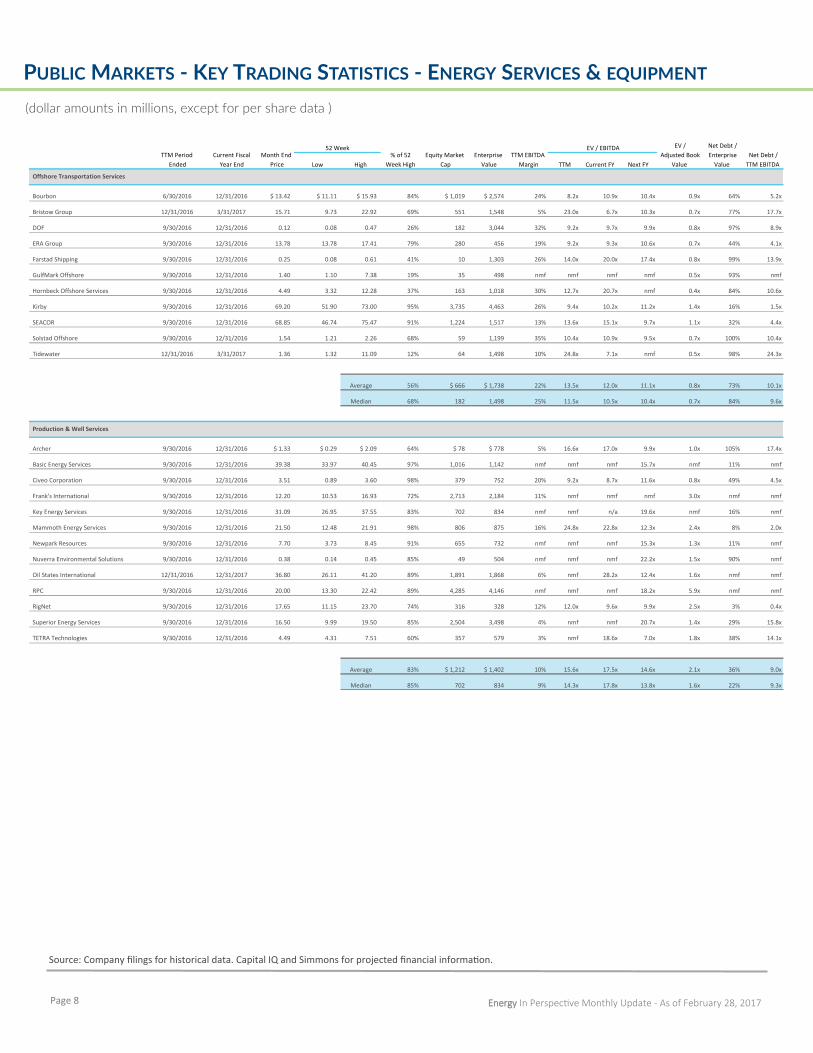
PUBLIC MARKETS - KEY TRADING STATISTICS - ENERGY SERVICES & EQUIPMENT
(dollar amounts in millions, except for per share data )
Page 8 Energy In Perspective Monthly Update - As of February 28, 2017
Source: Company filings for historical data. Capital IQ and Simmons for projected financial information.
Low High TTM Current FY Next FY
Bourbon 6/30/2016 12/31/2016 $ 13.42 $ 11.11 $ 15.93 84% $ 1,019 $ 2,574 24% 8.2x 10.9x 10.4x 0.9x 64% 5.2x
Bristow Group 12/31/2016 3/31/2017 15.71 9.73 22.92 69% 551 1,548 5% 23.0x 6.7x 10.3x 0.7x 77% 17.7x
DOF 9/30/2016 12/31/2016 0.12 0.08 0.47 26% 182 3,044 32% 9.2x 9.7x 9.9x 0.8x 97% 8.9x
ERA Group 9/30/2016 12/31/2016 13.78 13.78 17.41 79% 280 456 19% 9.2x 9.3x 10.6x 0.7x 44% 4.1x
Farstad Shipping 9/30/2016 12/31/2016 0.25 0.08 0.61 41% 10 1,303 26% 14.0x 20.0x 17.4x 0.8x 99% 13.9x
GulfMark Offshore 9/30/2016 12/31/2016 1.40 1.10 7.38 19% 35 498 nmf nmf nmf nmf 0.5x 93% nmf
Hornbeck Offshore Services 9/30/2016 12/31/2016 4.49 3.32 12.28 37% 163 1,018 30% 12.7x 20.7x nmf 0.4x 84% 10.6x
Kirby 9/30/2016 12/31/2016 69.20 51.90 73.00 95% 3,735 4,463 26% 9.4x 10.2x 11.2x 1.4x 16% 1.5x
SEACOR 9/30/2016 12/31/2016 68.85 46.74 75.47 91% 1,224 1,517 13% 13.6x 15.1x 9.7x 1.1x 32% 4.4x
Solstad Offshore 9/30/2016 12/31/2016 1.54 1.21 2.26 68% 59 1,199 35% 10.4x 10.9x 9.5x 0.7x 100% 10.4x
Tidewater 12/31/2016 3/31/2017 1.36 1.32 11.09 12% 64 1,498 10% 24.8x 7.1x nmf 0.5x 98% 24.3x
Average 56% $ 666 $ 1,738 22% 13.5x 12.0x 11.1x 0.8x 73% 10.1x
Median 68% 182 1,498 25% 11.5x 10.5x 10.4x 0.7x 84% 9.6x
Archer 9/30/2016 12/31/2016 $ 1.33 $ 0.29 $ 2.09 64% $ 78 $ 778 5% 16.6x 17.0x 9.9x 1.0x 105% 17.4x
Basic Energy Services 9/30/2016 12/31/2016 39.38 33.97 40.45 97% 1,016 1,142 nmf nmf nmf 15.7x nmf 11% nmf
Civeo Corporation 9/30/2016 12/31/2016 3.51 0.89 3.60 98% 379 752 20% 9.2x 8.7x 11.6x 0.8x 49% 4.5x
Frank's International 9/30/2016 12/31/2016 12.20 10.53 16.93 72% 2,713 2,184 11% nmf nmf nmf 3.0x nmf nmf
Key Energy Services 9/30/2016 12/31/2016 31.09 26.95 37.55 83% 702 834 nmf nmf n/a 19.6x nmf 16% nmf
Mammoth Energy Services 9/30/2016 12/31/2016 21.50 12.48 21.91 98% 806 875 16% 24.8x 22.8x 12.3x 2.4x 8% 2.0x
Newpark Resources 9/30/2016 12/31/2016 7.70 3.73 8.45 91% 655 732 nmf nmf nmf 15.3x 1.3x 11% nmf
Nuverra Environmental Solutions 9/30/2016 12/31/2016 0.38 0.14 0.45 85% 49 504 nmf nmf nmf 22.2x 1.5x 90% nmf
Oil States International 12/31/2016 12/31/2017 36.80 26.11 41.20 89% 1,891 1,868 6% nmf 28.2x 12.4x 1.6x nmf nmf
RPC 9/30/2016 12/31/2016 20.00 13.30 22.42 89% 4,285 4,146 nmf nmf nmf 18.2x 5.9x nmf nmf
RigNet 9/30/2016 12/31/2016 17.65 11.15 23.70 74% 316 328 12% 12.0x 9.6x 9.9x 2.5x 3% 0.4x
Superior Energy Services 9/30/2016 12/31/2016 16.50 9.99 19.50 85% 2,504 3,498 4% nmf nmf 20.7x 1.4x 29% 15.8x
TETRA Technologies 9/30/2016 12/31/2016 4.49 4.31 7.51 60% 357 579 3% nmf 18.6x 7.0x 1.8x 38% 14.1x
Average 83% $ 1,212 $ 1,402 10% 15.6x 17.5x 14.6x 2.1x 36% 9.0x
Median 85% 702 834 9% 14.3x 17.8x 13.8x 1.6x 22% 9.3x
Net Debt /
TTM EBITDA
Offshore Transportation Services
Production & Well Services
TTM Period
Ended
Current Fiscal
Year End
Month End
Price
52 Week% of 52
Week High
Equity Market
Cap
Enterprise
Value
TTM EBITDA
Margin
EV / EBITDA EV /
Adjusted Book
Value
Net Debt /
Enterprise
Value

PUBLIC MARKETS - KEY TRADING STATISTICS - ENERGY SERVICES & EQUIPMENT
(dollar amounts in millions, except for per share data )
Page 9
Source: Company filings for historical data. Capital IQ and Simmons for projected financial information.
Low High TTM Current FY Next FY
Calfrac Well Services 12/31/2016 12/31/2017 $ 3.72 $ 1.19 $ 5.24 71% $ 449 $ 1,316 nmf nmf 23.2x 6.6x 1.0x 67% nmf
Canadian Energy Services 9/30/2016 12/31/2016 7.49 2.90 8.50 88% 1,960 2,248 2% nmf nmf 19.0x 2.7x 13% 29.7x
Canyon Services Group 9/30/2016 12/31/2016 5.76 3.43 7.39 78% 495 514 nmf nmf nmf 14.0x 1.4x 4% nmf
Essential Energy Services Ltd 9/30/2016 12/31/2016 0.73 0.54 0.85 86% 104 136 nmf nmf nmf 7.3x 0.6x 24% nmf
Mullen Group 12/31/2016 12/31/2017 16.70 13.45 20.05 83% 1,732 2,118 17% 11.7x 10.9x 9.1x 1.6x 20% 2.3x
Secure Energy Services 9/30/2016 12/31/2016 10.24 7.41 11.71 87% 1,641 1,843 5% nmf 20.4x 13.1x 1.6x 11% 3.3x
Trican Well Service 9/30/2016 12/31/2016 4.92 1.12 5.49 90% 951 1,047 nmf nmf nmf 27.5x 1.8x 18% nmf
Western Energy Services Corp. 12/31/2016 12/31/2017 2.66 2.01 3.78 70% 196 419 1% nmf 15.9x 6.9x 0.7x 53% nmf
Xtreme Drilling 9/30/2016 12/31/2016 2.42 1.53 3.05 79% 206 86 nmf nmf nmf 8.0x 0.4x nmf nmf
Average 81% $ 859 $ 1,081 6% 11.7x 17.6x 12.4x 1.3x 26% 11.8x
Median 83% 495 1,047 3% 11.7x 18.2x 9.1x 1.4x 19% 3.3x
Ensign Energy Services 9/30/2016 12/31/2016 $ 5.98 $ 3.60 $ 7.35 81% $ 919 $ 1,429 22% 9.5x 10.7x 8.8x 0.7x 36% 3.4x
Helmerich & Payne 12/31/2016 9/30/2017 68.37 52.97 83.46 82% 7,464 6,979 34% 13.8x 20.0x 12.3x 1.7x nmf nmf
Independence Contract Drilling 9/30/2016 12/31/2016 5.95 3.76 7.14 83% 223 239 20% 15.8x 15.5x 14.1x 0.8x 7% 1.0x
Nabors Industries 12/31/2016 12/31/2017 14.64 6.87 18.19 80% 4,052 7,343 29% 11.2x 10.1x 7.1x 1.1x 45% 5.0x
Parker Drilling 12/31/2016 12/31/2017 1.90 1.55 3.06 62% 237 694 7% 23.0x 10.7x 4.8x 0.9x 66% 15.1x
Patterson-UTI Energy 12/31/2016 12/31/2017 27.62 15.54 29.47 94% 4,641 5,204 22% 26.3x 16.6x 8.4x 1.9x 11% 2.8x
Pioneer Energy Services 12/31/2016 12/31/2017 5.25 1.37 7.15 73% 406 735 4% nmf 13.4x 6.5x 1.2x 45% 27.6x
Precision Drilling 12/31/2016 12/31/2017 5.11 3.21 6.02 85% 1,500 2,832 25% 16.0x 10.8x 7.0x 1.0x 47% 7.6x
Savanna Energy Services 9/30/2016 12/31/2016 1.42 0.92 1.67 85% 129 323 15% 8.7x 8.0x 6.8x 0.6x 58% 5.0x
Trinidad Drilling 9/30/2016 12/31/2016 2.02 1.10 2.67 76% 448 695 32% 7.0x 6.7x 7.5x 0.6x 61% 4.3x
Unit Corporation 9/30/2016 12/31/2016 27.14 5.36 30.25 90% 1,397 2,255 34% 11.2x 9.5x 7.0x 1.1x 38% 4.2x
Average 81% $ 1,947 $ 2,612 22% 14.2x 12.0x 8.2x 1.1x 41% 7.6x
Median 82% 919 1,429 22% 12.5x 10.7x 7.1x 1.0x 45% 4.6x
Production & Well Services (Canadian Oriented) - Financials are presented in Canadian dollars
Land Drillers
TTM Period
Ended
Current Fiscal
Year End
Month End
Price
52 Week% of 52
Week High
Equity Market
Cap
Enterprise
Value
TTM EBITDA
Margin
EV / EBITDA EV /
Adjusted Book
Value
Net Debt /
Enterprise
Value
Net Debt /
TTM EBITDA

PUBLIC MARKETS - KEY TRADING STATISTICS - ENERGY SERVICES & EQUIPMENT
(dollar amounts in millions, except for per share data )
Page 10 Energy In Perspective Monthly Update - As of February 28, 2017
Source: Company filings for historical data. Capital IQ and Simmons for projected financial information.
Low High TTM Current FY Next FY
Atwood Oceanics 12/31/2016 9/30/2017 $ 10.51 $ 6.48 $ 14.05 75% $ 846 $ 1,984 57% 4.0x 10.2x 14.6x 0.5x 57% 2.3x
Diamond Offshore Drilling 12/31/2016 12/31/2017 16.84 14.80 26.11 64% 2,310 4,239 45% 6.1x 7.4x 9.3x 0.8x 46% 2.8x
ENSCO 9/30/2016 12/31/2016 9.74 6.64 12.45 78% 2,952 5,896 51% 3.8x 5.0x 8.0x 0.5x 50% 1.9x
Fred Olsen 12/31/2016 12/31/2017 2.73 1.32 4.32 63% 181 770 60% 1.5x 8.8x 14.1x 0.5x 76% 1.2x
Noble Corp. 12/31/2016 12/31/2017 6.68 4.64 13.56 49% 1,625 5,948 58% 4.6x 12.1x 13.3x 0.6x 61% 2.8x
North Atlantic Drilling Limited 9/30/2016 12/31/2016 1.81 1.74 7.82 23% 44 2,402 61% 6.8x 7.7x nmf 0.9x 98% 6.6x
Ocean Rig 12/31/2016 12/31/2017 0.76 0.70 3.07 25% 63 3,178 66% 2.9x 5.8x nmf 1.0x 98% 2.9x
Pacific Drilling 12/31/2016 12/31/2017 2.65 2.65 8.50 31% 56 2,616 54% 6.3x nmf nmf 0.5x 98% 6.2x
Rowan 12/31/2016 12/31/2017 18.12 12.46 20.90 87% 2,272 3,856 52% 4.0x 8.6x 14.7x 0.6x 41% 1.6x
Seadrill 9/30/2016 12/31/2016 1.72 1.63 5.51 31% 874 8,251 55% 4.6x 4.4x 7.6x 0.5x 107% 5.0x
Songa Offshore 9/30/2016 12/31/2016 3.95 1.77 6.08 65% 455 2,637 59% 5.9x 6.0x 6.6x 0.9x 83% 4.9x
Transocean 9/30/2016 12/31/2016 13.82 8.41 15.84 87% 5,051 11,106 41% 6.2x 6.4x 9.3x 0.5x 52% 3.2x
Average 57% $ 1,394 $ 4,407 55% 4.7x 7.5x 10.8x 0.6x 72% 3.4x
Median 64% 860 3,517 56% 4.6x 7.4x 9.3x 0.6x 69% 2.8x
Aker Solutions 12/31/2016 12/31/2017 $ 5.79 $ 2.86 $ 5.79 100% $ 1,573 $ 1,885 8% 8.2x 11.1x 10.8x 1.8x 16% 1.3x
CARBO Ceramics 12/31/2016 12/31/2017 12.83 6.08 23.68 54% 348 337 nmf nmf nmf 17.1x 0.6x nmf nmf
Chart Industries 9/30/2016 12/31/2016 35.59 19.24 40.43 88% 1,095 1,069 16% 7.4x 10.2x 13.2x 1.6x nmf nmf
Dril-Quip 9/30/2016 12/31/2016 61.35 47.50 67.10 91% 2,322 1,787 33% 8.7x 12.7x nmf 2.1x nmf nmf
Enerflex Industries 9/30/2016 12/31/2016 13.03 6.69 14.31 91% 1,152 1,358 14% 11.4x 10.2x 7.4x 1.2x 15% 1.7x
Fairmount Santrol 9/30/2016 12/31/2016 9.48 1.98 12.97 73% 2,122 3,053 nmf nmf nmf 17.4x 3.3x 30% nmf
Flotek Industries 12/31/2016 12/31/2017 13.52 6.73 16.60 81% 774 818 0% nmf 26.7x 9.3x 2.5x 5% nmf
Forum Energy Technologies 12/31/2016 12/31/2017 21.70 11.49 24.30 89% 2,115 2,219 nmf nmf nmf 14.8x 1.7x 7% nmf
Hunting 6/30/2016 12/31/2016 6.57 3.84 8.00 82% 1,096 1,248 nmf nmf nmf 27.7x 1.0x 10% nmf
MRC Global 12/31/2016 12/31/2017 20.21 11.95 22.01 92% 1,917 2,577 nmf nmf 17.1x 10.8x 1.8x 26% nmf
NOW, Inc. 12/31/2016 12/31/2017 19.14 15.96 23.21 82% 2,057 2,016 nmf nmf nmf 18.5x 1.8x nmf nmf
National Oilwell Varco 12/31/2016 12/31/2017 40.42 27.32 41.10 98% 15,308 17,177 nmf nmf 27.8x 14.0x 1.1x 11% nmf
Pason Systems 9/30/2016 12/31/2016 13.62 11.26 15.51 88% 1,169 1,051 13% nmf nmf 16.3x 5.6x nmf nmf
Schoeller-Bleckmann 9/30/2016 12/31/2016 73.83 55.07 81.94 90% 1,178 1,241 nmf nmf nmf 18.2x 2.4x 5% nmf
ShawCor 9/30/2016 12/31/2016 26.66 19.78 29.14 91% 1,866 2,029 6% nmf nmf 10.9x 2.5x 9% 2.9x
Smart Sand 9/30/2016 12/31/2016 17.17 10.77 21.00 82% 672 729 35% nmf 23.7x 20.0x 12.3x 8% 3.6x
Tenaris 9/30/2016 12/31/2016 16.47 10.93 18.47 89% 19,448 18,032 22% 17.2x 25.6x 19.0x 1.8x nmf nmf
Tesco 9/30/2016 12/31/2016 8.35 5.76 9.60 87% 390 300 nmf nmf nmf nmf 1.3x nmf nmf
U.S. Silica Holdings, Inc. 9/30/2016 12/31/2016 50.57 19.10 59.98 84% 4,037 4,279 1% nmf nmf 16.5x 4.1x 6% nmf
Vallourec 9/30/2016 12/31/2016 5.49 3.16 7.87 70% 2,443 3,967 nmf nmf nmf nmf 0.8x 29% nmf
Average 85% $ 3,154 $ 3,359 15% 10.6x 18.3x 15.4x 2.6x 14% 2.4x
Median 88% 1,719 1,836 13% 8.7x 17.1x 16.3x 1.8x 10% 2.3x
TTM EBITDA
Margin
EV / EBITDA EV /
Adjusted Book
Value
Net Debt /
Enterprise
Value
Net Debt /
TTM EBITDA
Offshore Drillers
Upstream Equipment Manufacturing & Distribution
TTM Period
Ended
Current Fiscal
Year End
Month End
Price
52 Week% of 52
Week High
Equity Market
Cap
Enterprise
Value
PUBLIC MARKETS - KEY TRADING STATISTICS - ENERGY SERVICES & EQUIPMENT
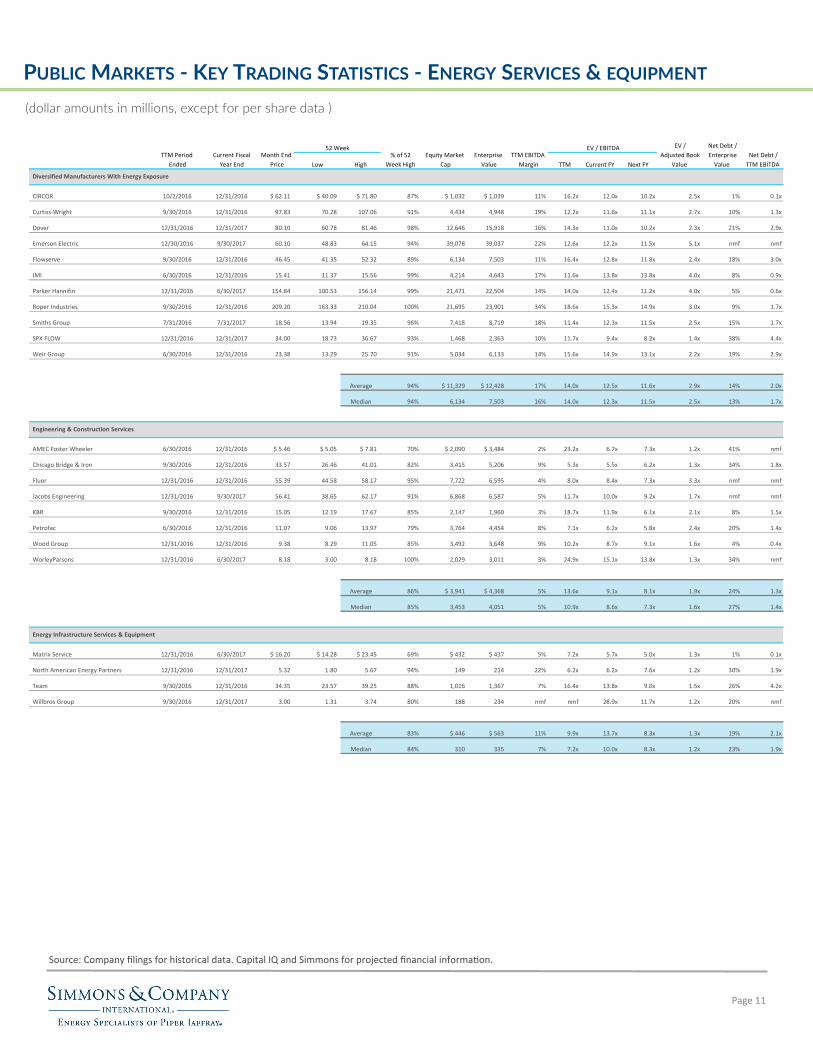
(dollar amounts in millions, except for per share data )
Page 11
Source: Company filings for historical data. Capital IQ and Simmons for projected financial information.
Low High TTM Current FY Next FY
CIRCOR 10/2/2016 12/31/2016 $ 62.11 $ 40.09 $ 71.80 87% $ 1,032 $ 1,039 11% 16.2x 12.0x 10.2x 2.5x 1% 0.1x
Curtiss-Wright 9/30/2016 12/31/2016 97.83 70.28 107.06 91% 4,434 4,948 19% 12.2x 11.6x 11.1x 2.7x 10% 1.3x
Dover 12/31/2016 12/31/2017 80.10 60.78 81.46 98% 12,646 15,918 16% 14.3x 11.0x 10.2x 2.3x 21% 2.9x
Emerson Electric 12/30/2016 9/30/2017 60.10 48.83 64.15 94% 39,078 39,037 22% 12.6x 12.2x 11.5x 5.1x nmf nmf
Flowserve 9/30/2016 12/31/2016 46.45 41.35 52.32 89% 6,134 7,503 11% 16.4x 12.8x 11.8x 2.4x 18% 3.0x
IMI 6/30/2016 12/31/2016 15.41 11.37 15.56 99% 4,214 4,643 17% 11.6x 13.8x 13.8x 4.0x 8% 0.9x
Parker Hannifin 12/31/2016 6/30/2017 154.84 100.53 156.14 99% 21,471 22,504 14% 14.0x 12.4x 11.2x 4.0x 5% 0.6x
Roper Industries 9/30/2016 12/31/2016 209.20 163.33 210.04 100% 21,695 23,901 34% 18.6x 15.3x 14.9x 3.0x 9% 1.7x
Smiths Group 7/31/2016 7/31/2017 18.56 13.94 19.35 96% 7,418 8,719 18% 11.4x 12.3x 11.5x 2.5x 15% 1.7x
SPX FLOW 12/31/2016 12/31/2017 34.00 18.73 36.67 93% 1,468 2,363 10% 11.7x 9.4x 8.2x 1.4x 38% 4.4x
Weir Group 6/30/2016 12/31/2016 23.38 13.29 25.70 91% 5,034 6,133 14% 15.6x 14.9x 13.1x 2.2x 19% 2.9x
Average 94% $ 11,329 $ 12,428 17% 14.0x 12.5x 11.6x 2.9x 14% 2.0x
Median 94% 6,134 7,503 16% 14.0x 12.3x 11.5x 2.5x 13% 1.7x
AMEC Foster Wheeler 6/30/2016 12/31/2016 $ 5.46 $ 5.05 $ 7.81 70% $ 2,090 $ 3,484 2% 23.2x 6.7x 7.3x 1.2x 41% nmf
Chicago Bridge & Iron 9/30/2016 12/31/2016 33.57 26.46 41.01 82% 3,415 5,206 9% 5.3x 5.5x 6.2x 1.3x 34% 1.8x
Fluor 12/31/2016 12/31/2016 55.39 44.58 58.17 95% 7,722 6,595 4% 8.0x 8.4x 7.3x 3.3x nmf nmf
Jacobs Engineering 12/31/2016 9/30/2017 56.41 38.65 62.17 91% 6,868 6,587 5% 11.7x 10.0x 9.2x 1.7x nmf nmf
KBR 9/30/2016 12/31/2016 15.05 12.19 17.67 85% 2,147 1,960 3% 18.7x 11.9x 6.1x 2.1x 8% 1.5x
Petrofac 6/30/2016 12/31/2016 11.07 9.06 13.97 79% 3,764 4,454 8% 7.1x 6.2x 5.8x 2.4x 20% 1.4x
Wood Group 12/31/2016 12/31/2016 9.38 8.29 11.05 85% 3,492 3,648 9% 10.2x 8.7x 9.1x 1.6x 4% 0.4x
WorleyParsons 12/31/2016 6/30/2017 8.18 3.00 8.18 100% 2,029 3,011 3% 24.9x 15.1x 13.8x 1.3x 34% nmf
Average 86% $ 3,941 $ 4,368 5% 13.6x 9.1x 8.1x 1.9x 24% 1.3x
Median 85% 3,453 4,051 5% 10.9x 8.6x 7.3x 1.6x 27% 1.4x
Matrix Service 12/31/2016 6/30/2017 $ 16.20 $ 14.28 $ 23.45 69% $ 432 $ 437 5% 7.2x 5.7x 5.0x 1.3x 1% 0.1x
North American Energy Partners 12/31/2016 12/31/2017 5.32 1.80 5.67 94% 149 214 22% 6.2x 6.2x 7.6x 1.2x 30% 1.9x
Team 9/30/2016 12/31/2016 34.35 23.57 39.25 88% 1,016 1,367 7% 16.4x 13.8x 9.0x 1.5x 26% 4.2x
Willbros Group 9/30/2016 12/31/2017 3.00 1.31 3.74 80% 188 234 nmf nmf 28.9x 11.7x 1.2x 20% nmf
Average 83% $ 446 $ 563 11% 9.9x 13.7x 8.3x 1.3x 19% 2.1x
Median 84% 310 335 7% 7.2x 10.0x 8.3x 1.2x 23% 1.9x
Net Debt /
Enterprise
Value
Net Debt /
TTM EBITDA
Equity Market
Cap
Enterprise
Value
TTM EBITDA
Margin
EV / EBITDA EV /
Adjusted Book
Value
TTM Period
Ended
Current Fiscal
Year End
Month End
Price
52 Week% of 52
Week High
Engineering & Construction Services
Energy Infrastructure Services & Equipment
Diversified Manufacturers With Energy Exposure

PUBLIC MARKETS - KEY TRADING STATISTICS - OTHER
(dollar amounts in millions, except for per share data )
Page 12 Energy In Perspective Monthly Update - As of February 28, 2017
Source: Company filings for historical data. Capital IQ and Simmons for projected financial information.
Low High TTM Current FY Next FY
CMS Energy 12/31/2016 12/31/2017 $ 44.52 $ 39.38 $ 46.17 96% $ 12,528 $ 22,299 33% 10.5x 10.1x 9.6x 1.6x 44% 4.6x
Dominion Resources 9/30/2016 12/31/2017 77.64 68.77 78.92 98% 48,771 80,000 46% 15.6x 12.4x 11.0x 1.7x 37% 5.8x
Duke Energy 9/30/2016 12/31/2017 82.55 72.75 87.23 95% 57,062 100,111 40% 11.0x 10.2x 9.8x 1.2x 44% 4.8x
Enbridge 12/31/2016 12/31/2017 41.85 34.76 45.73 92% 39,618 73,615 19% 15.0x 11.7x 10.1x 1.7x 49% 7.5x
Kinder Morgan 12/31/2016 12/31/2017 21.31 16.85 23.13 92% 47,766 80,272 47% 13.0x 11.1x 10.6x 1.2x 40% 5.2x
ONEOK 9/30/2016 12/31/2017 54.05 24.00 59.03 92% 11,383 22,903 20% 13.9x 11.6x 10.5x 2.0x 40% 5.6x
TransCanada 12/31/2016 12/31/2017 45.99 35.58 49.34 93% 34,949 66,585 49% 15.4x 11.6x 10.6x 1.4x 46% 7.0x
The Williams Companies 9/30/2016 12/31/2017 28.34 14.81 32.42 87% 21,420 46,364 46% 13.9x 10.2x 9.4x 1.5x 49% 6.8x
Average 93% $ 34,187 $ 61,519 37% 13.5x 11.1x 10.2x 1.5x 44% 5.9x
Median 93% 37,284 70,100 43% 13.9x 11.4x 10.3x 1.5x 44% 5.7x
Clean Energy Fuels 9/30/2016 12/31/2016 $ 2.45 $ 2.39 $ 4.68 52% $ 335 $ 592 15% 9.3x nmf 14.1x 0.9x 39% nmf
First Solar 12/31/2016 12/31/2017 36.19 29.21 73.21 49% 3,761 1,742 19% 3.2x 8.7x 5.3x 0.5x nmf nmf
SunPower 12/31/2016 12/31/2017 8.76 6.30 24.74 35% 1,215 2,799 nmf nmf 23.4x 10.5x 1.1x 50% nmf
Vestas Wind Systems 12/31/2016 12/31/2017 73.81 56.25 86.24 86% 15,727 12,065 16% 6.5x 6.8x 6.6x nmf nmf nmf
Average 56% $ 5,259 $ 4,299 17% 6.3x 13.0x 9.1x 0.8x 45% nmf
Median 51% 2,488 2,270 16% 6.5x 8.7x 8.6x 0.9x 45% nmf
TTM Period
Ended
Current Fiscal
Year End
Month End
Price
52 Week% of 52
Week High
Equity Market
Cap
Enterprise
Value
TTM EBITDA
Margin
EV / EBITDA EV /
Adjusted Book
Value
Net Debt /
Enterprise
Value
Net Debt /
TTM EBITDA
Diversified Energy
Alternative Energy
Low High TTM Current FY Next FY
Alon USA 9/30/2016 12/31/2017 $ 12.16 $ 5.99 $ 12.80 95% $ 866 $ 1,214 3% 12.0x 7.3x 5.8x 1.4x 24% 2.8x 576 5,413
CVR Energy 9/30/2016 12/31/2017 22.92 12.64 26.87 85% 1,990 3,249 4% 19.0x 10.6x 8.3x 1.5x 12% 2.3x 1,353 15,608
Delek US 9/30/2016 12/31/2017 24.07 11.88 25.38 95% 1,498 2,209 5% 7.8x 10.2x 9.1x 1.3x 23% 1.8x 834 7,899
HollyFrontier Corporation 9/30/2016 12/31/2017 29.28 22.31 38.36 76% 5,148 6,893 13% 4.9x 6.0x 5.3x 1.1x 17% 0.8x 727 8,820
Marathon Petroleum Corp. 9/30/2016 12/31/2017 49.60 32.81 52.93 94% 26,374 40,239 8% 8.8x 7.2x 6.7x 1.5x 24% 2.2x 945 10,384
PBF Refining 9/30/2016 12/31/2017 24.49 19.82 35.29 69% 2,670 4,890 3% 9.9x 5.8x 5.2x 1.2x 34% 3.4x 478 5,567
Phillips 66 12/31/2016 12/31/2017 78.19 74.26 90.16 87% 40,932 49,506 3% 22.1x 8.3x 7.7x 1.6x 15% 3.2x 414 4,592
Tesoro 12/31/2016 12/31/2017 85.19 70.01 92.49 92% 10,012 13,650 10% 5.6x 5.1x 4.9x 1.2x 27% 1.5x n/a n/a
Valero Energy 9/30/2016 12/31/2017 67.95 47.24 70.42 96% 30,759 34,553 7% 6.3x 5.8x 5.5x 1.4x 9% 0.5x 761 9,864
Western Refining 9/30/2016 12/31/2017 36.52 18.33 39.50 92% 3,960 6,309 7% 11.0x 8.6x 7.1x 1.6x 29% 3.2x 2,355 21,643
Average 88% $ 12,421 $ 16,271 7% 10.7x 7.5x 6.6x 1.4x 21% 2.2x 938 9,977
Median 92% 4,554 6,601 6% 9.3x 7.3x 6.3x 1.4x 23% 2.2x 761 8,820
Nelson
Capacity
Refining
Capacity
Independent Refiners
Enterprise
Value
TTM
EBITDA
Margin
EV / EBITDA EV / Adjusted
Book Value
Net Debt /
Enterprise
Value
Net Debt /
TTM EBITDA TTM Period Ended
Current Fiscal
Year End
Month
End Price
52 Week % of 52
Week
High
Equity
Market Cap

PUBLIC MARKETS - KEY TRADING STATISTICS - MLP
(dollar amounts in millions, except for per share data )
Page 13
Source: Company filings for historical data. Capital IQ and Simmons for projected financial information.
Low High TTM
Current
FY Next FY TTM
Current
FY Next FY TTM
Current
FY Next FY
Energy Service & Equipment MLPs
Archrock Partners 9/30/2016 12/31/2016 $ 23.64 $ 9.40 $ 23.87 99% $ 1,549 $ 2,962 5% 11.5x 10.8x 10.4x 47% 1.5x 5.4x 11.8x 11.7x 12.2x 9.1x 9.0x 9.5x
CSI Compressco 9/30/2016 12/31/2016 14.71 6.73 16.75 88% 489 1,070 10% 11.1x 11.0x 10.5x 53% 1.3x 5.9x 11.3x 12.9x 11.4x 8.1x 9.9x 8.5x
Cypress Energy Partners 9/30/2016 12/31/2016 17.55 8.68 18.12 97% 208 298 9% 22.4x 14.3x 13.0x 37% 2.3x 8.3x 14.5x 14.2x 14.0x 14.7x 14.4x 14.2x
Emerge Energy Services 9/30/2016 12/31/2016 22.77 4.37 30.99 73% 628 762 0% nmf nmf nmf 18% 3.7x nmf nmf 43.3x 40.4x nmf nmf nmf
Hi-Crush Partners 9/30/2016 12/31/2016 22.78 5.18 28.96 79% 1,450 1,622 0% nmf nmf nmf 10% 3.5x 6.9x nmf nmf 39.3x nmf nmf nmf
Seadrill Partners 9/30/2016 12/31/2016 6.19 3.77 8.22 75% 568 4,623 6% 3.8x 4.4x 6.0x 61% 0.9x 2.3x 10.2x 6.2x 9.2x 2.1x 1.1x 1.9x
USA Compression Partners 12/31/2016 12/31/2017 23.54 12.16 25.88 91% 1,412 2,137 9% 16.0x 14.7x 14.0x 32% 1.5x 5.1x 15.5x 15.7x 14.0x 12.4x 12.6x 11.2x
Average 86% $ 901 $ 1,925 6% 13.0x 11.0x 10.8x 37% 2.1x 5.7x 12.6x 17.3x 20.1x 9.3x 9.4x 9.1x
Median 88% 628 1,622 6% 11.5x 11.0x 10.5x 37% 1.5x 5.6x 11.8x 13.5x 14.0x 9.1x 9.9x 9.5x
Transportation MLPs
Boardwalk Pipeline Partners 12/31/2016 12/31/2017 $ 23.97 $ 16.46 $ 24.90 96% $ 6,000 $ 9,676 2% 9.0x 11.4x 11.4x 37% 1.2x 3.3x 13.3x 13.7x 14.0x 12.6x 11.7x 12.3x
Delek Logistics Partners 9/30/2016 12/31/2016 40.99 28.87 46.84 88% 996 1,446 6% 11.3x 15.1x 14.3x 19% 5.4x 2.2x 14.6x 19.0x 17.9x 14.2x 18.4x 18.3x
Enbridge Energy Partners 9/30/2016 12/31/2016 23.97 22.23 34.90 69% 8,305 22,083 10% 10.3x 11.7x 11.1x 61% 1.3x 6.2x 14.6x 15.8x 15.1x 9.2x 8.9x 8.7x
Energy Transfer Partners 9/30/2016 12/31/2016 50.08 35.44 56.41 89% 27,364 78,148 8% 13.4x 13.9x 11.7x 42% 1.5x 5.7x 14.4x 15.7x 12.9x 13.0x 12.5x 9.8x
Enterprise Products Partners 9/30/2016 12/31/2016 37.12 30.83 39.17 95% 78,091 99,541 4% 15.7x 19.1x 17.7x 22% 2.3x 3.4x 18.3x 20.0x 18.5x 18.8x 19.2x 18.2x
Holly Energy Partners 9/30/2016 12/31/2016 47.57 39.47 49.61 96% 2,987 5,244 5% 14.9x 18.7x 15.8x 20% 4.0x 2.9x 19.1x 19.5x 16.4x 19.7x 19.1x 16.4x
NuStar Energy 9/30/2016 12/31/2016 69.19 47.01 72.56 95% 5,430 9,415 6% 12.3x 16.3x 15.5x 34% 2.0x 4.1x 15.7x 17.1x 17.1x 14.9x 15.2x 15.1x
ONEOK Partners 9/30/2016 12/31/2016 69.37 38.47 70.73 98% 19,829 35,671 5% 16.2x 19.1x 18.1x 18% 2.9x 2.9x 18.9x 19.7x 19.3x 20.7x 20.1x 19.9x
Plains All American 9/30/2016 12/31/2016 42.49 26.12 45.40 94% 27,956 37,993 5% 15.9x 18.0x 16.5x 26% 2.0x 4.2x 18.8x 20.3x 18.2x 19.6x 19.5x 17.3x
Average 91% $ 19,662 $ 33,246 6% 13.2x 15.9x 14.7x 31% 2.5x 3.9x 16.4x 17.9x 16.6x 15.8x 16.1x 15.1x
Median 95% 8,305 22,083 5% 13.4x 16.3x 15.5x 26% 2.0x 3.4x 15.7x 19.0x 17.1x 14.9x 18.4x 16.4x
Equity
Market
Cap
EV / Unlevered DCF Equity Value / DCF
Enterprise
Value
Current
Yield
EV / EBITDA Net Debt /
Enterprise
Value
EV /
Adjusted
Book Value
Net Debt
/ TTM
EBITDA
TTM Period
Ended
Current
Fiscal Year
End
Month End
Price
52 Week% of 52
Week
High
Low High
Current
FY Next FY
Legacy Reserves LP 12/31/2016 12/31/2016 2.26 0.81 5.15 44% 165 1,465 1,601 84% 272 248 239 5.2x 5.0x 0.92 2.1x 649% 19.4x 3.8x
Memorial Production Partners LP 9/30/2016 12/31/2016 0.16 0.16 4.25 4% 14 1,797 1,223 36% 212 254 265 4.7x 5.2x 1.47 0.8x nmf 10.9x 4.7x
Average 24% $ 90 $ 1,631 1,412 60% 242 251 252 5.0x 5.1x $ 1.19 1.4x 649% 15.1x 4.3x
Median 24% 90 1,631 1,412 60% 242 251 252 5.0x 5.1x 1.19 1.4x 649% 15.1x 4.3x
Exploration & Production MLPs
Month
End Price
52 Week% of 52
Week
High
Equity
Market
Cap
EV / EBITDAXEV /
Proved
Reserves
($/Mcfe)
EV /
Adjusted
Book
Value
Total
Debt /
Equity
Net Debt /
TTM
EBITDAX
Net Debt /
Current FY
EBITDAX
Enterprise
Value
Proved
Reserves
(Bcfe)
% Gas of
Reserves
Current
Production
(Mmcfe/d)
Current FY
Production
(Mmcfe/d)
Next FY
Production
(Mmcfe/d)
TTM Period
Ended
Current Fiscal
Year End

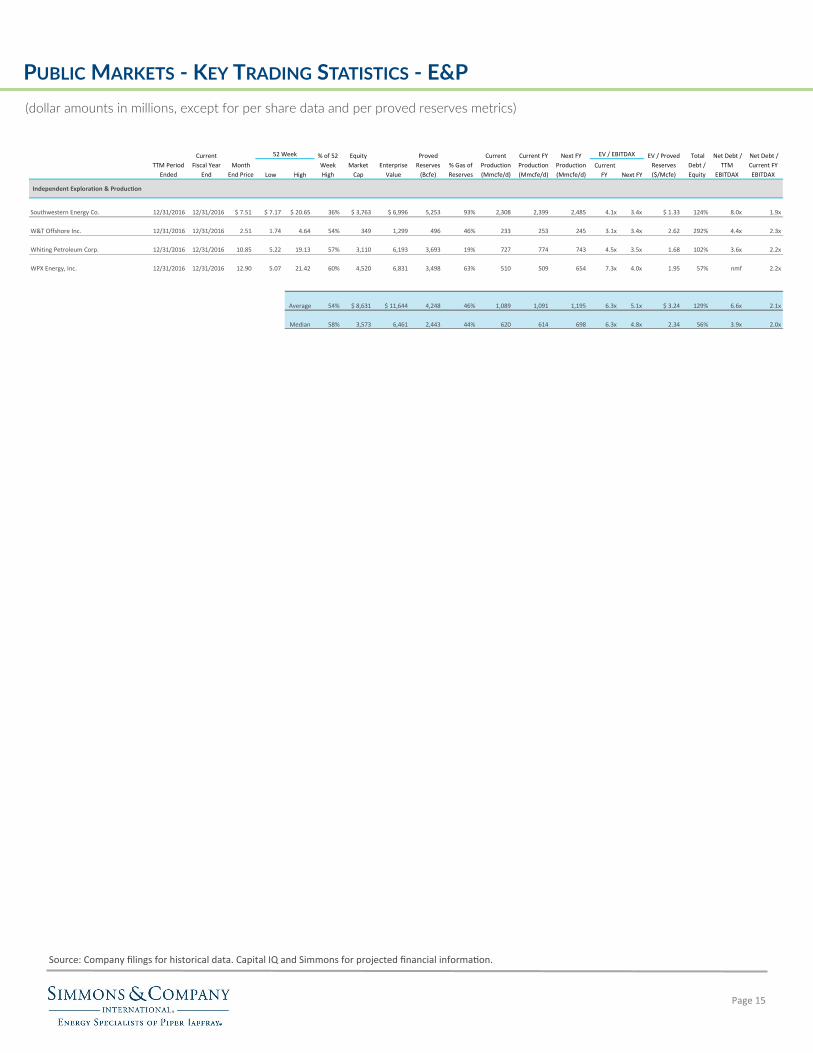
PUBLIC MARKETS - KEY TRADING STATISTICS - E&P
(dollar amounts in millions, except for per share data and per proved reserves metrics)
Page 14 Energy In Perspective Monthly Update - As of February 28, 2017
Source: Company filings for historical data. Capital IQ and Simmons for projected financial information.
Low High
Current
FY Next FY
Independent Exploration & Production
Anadarko Petroleum Corporation 12/31/2016 12/31/2016 $ 64.65 $ 49.87 $ 97.12 67% $ 36,138 $ 52,928 10,334 43% 4,754 4,757 5,455 6.5x 5.4x $ 5.12 46% 2.7x 1.6x
Antero Resources Corporation 12/31/2016 12/31/2016 23.98 28.41 40.61 59% 7,685 13,563 12,323 70% 1,895 1,803 2,205 6.0x 4.4x 1.10 58% nmf 2.0x
Apache Corp. 12/31/2016 12/31/2016 52.59 48.02 91.39 58% 20,068 28,676 14,378 43% 2,755 3,164 3,179 5.3x 4.4x 1.99 43% 2.1x 1.3x
Approach Resources, Inc. 9/30/2016 12/31/2016 2.65 0.97 5.76 46% 216 583 877 34% 28 71 79 6.3x 5.5x 0.66 171% 7.6x 4.0x
Bill Barrett Corp. 12/31/2016 12/31/2016 5.51 3.59 12.42 44% 412 748 511 19% 109 100 106 3.5x 2.7x 1.46 149% 4.4x 1.6x
Cabot Oil & Gas Corporation 12/31/2016 12/31/2016 21.90 25.93 35.42 62% 10,254 11,147 8,576 97% 1,644 1,714 1,872 7.3x 5.5x 1.30 15% 1.5x 0.7x
Callon Petroleum Company 12/31/2016 12/31/2016 12.62 7.95 24.54 51% 2,537 2,160 489 13% 124 142 220 5.7x 3.4x 4.42 26% nmf nmf
Carrizo Oil & Gas Inc. 12/31/2016 12/31/2016 32.55 27.23 58.22 56% 2,161 3,483 1,196 25% 247 252 305 5.5x 4.0x 2.91 61% 5.0x 2.1x
Chesapeake Energy Corporation 12/31/2016 12/31/2016 5.45 3.38 10.86 50% 4,893 15,372 8,537 65% 3,756 3,791 3,354 5.4x 4.1x 1.80 191% 29.3x 3.0x
Cimarex Energy Co. 12/31/2016 12/31/2016 125.72 108.33 194.64 65% 12,209 13,044 2,890 51% 947 965 1,124 7.9x 6.3x 4.51 12% 1.1x 0.5x
Comstock Resources Inc. 12/31/2016 12/31/2016 9.37 3.50 17.78 53% 141 1,092 564 92% 175 159 209 4.2x 4.0x 1.94 719% 9.1x 3.6x
Concho Resources, Inc. 12/31/2016 12/31/2016 132.45 117.96 195.42 68% 19,797 22,463 4,592 39% 940 905 1,103 8.9x 7.3x 2.00 15% 3.6x 1.1x
Continental Resources, Inc. 12/31/2016 12/31/2016 45.20 28.97 79.86 57% 17,074 23,637 7,649 50% 1,259 1,302 1,350 7.3x 5.8x 3.09 39% 3.6x 2.0x
Denbury Resources Inc. 12/31/2016 12/31/2016 2.71 1.62 6.36 43% 1,090 4,073 1,732 2% 369 145 133 6.8x 5.6x 2.35 274% 11.8x 5.0x
Devon Energy Corporation 12/31/2016 12/31/2016 43.36 24.58 67.14 65% 22,747 35,430 12,351 46% 3,223 3,659 3,318 6.9x 5.7x 2.87 45% 2.6x 1.6x
Diamondback Energy, Inc. 12/31/2016 12/31/2016 100.86 91.33 150.99 67% 9,123 8,883 1,233 14% 314 249 417 7.5x 5.0x 7.21 12% nmf nmf
Eclipse Resources Corporation 12/31/2016 12/31/2016 2.16 0.86 34.29 6% 563 790 356 72% 222 229 314 8.0x 12.4x 2.22 76% 3.9x 2.3x
Encana Corporation 12/31/2016 12/31/2016 11.11 5.45 18.13 61% 10,815 14,531 7,430 64% 2,022 1,950 2,400 6.7x 4.3x 1.96 42% 6.0x 1.7x
EOG Resources, Inc. 12/31/2016 12/31/2016 96.99 82.82 144.86 67% 56,708 62,233 12,973 29% 3,322 3,358 3,678 8.8x 6.8x 4.80 12% 1.5x 0.8x
EXCO Resources Inc. 9/30/2016 12/31/2016 0.56 0.68 2.57 22% 160 1,430 907 86% 290 249 227 6.0x 12.4x 1.58 817% nmf 5.5x
Gulfport Energy Corp. 12/31/2016 12/31/2016 17.34 22.82 45.92 38% 2,763 2,837 2,321 93% 793 720 1,073 2.8x 2.0x 1.22 58% 2.5x 0.3x
Kosmos Energy Ltd. 12/31/2016 12/31/2016 6.14 5.81 9.79 63% 2,443 3,572 459 3% 62 122 185 5.9x 5.5x 7.78 54% 32.7x 1.9x
Laredo Petroleum, Inc. 12/31/2016 12/31/2016 13.83 6.45 21.81 63% 3,381 4,458 1,003 32% 323 297 352 6.9x 5.5x 4.45 40% 17.1x 2.0x
Matador Resources Company 12/31/2016 12/31/2016 24.07 20.36 37.76 64% 2,435 2,833 541 44% 178 187 229 7.3x 5.1x 5.24 25% 2.8x 1.0x
Newfield Exploration Co. 12/31/2016 12/31/2016 36.46 35.42 66.22 55% 7,339 8,810 3,076 44% 1,024 966 953 5.9x 4.6x 2.86 33% 2.0x 1.0x
Noble Energy, Inc. 12/31/2016 12/31/2016 36.41 36.89 55.67 65% 17,678 24,149 9,073 59% 2,520 2,475 2,477 6.3x 4.9x 2.66 44% 2.9x 1.7x
Northern Oil and Gas, Inc. 12/31/2016 12/31/2016 3.00 2.05 7.75 39% 191 1,017 604 12% 81 80 82 5.6x 4.7x 1.68 436% nmf 4.5x
Oasis Petroleum Inc. 9/30/2016 12/31/2016 14.16 6.64 22.62 63% 3,382 5,818 2,132 23% 353 302 408 6.0x 4.5x 2.73 72% 4.9x 2.5x
Parsley Energy, Inc. 12/31/2016 12/31/2016 30.39 14.71 52.74 58% 8,114 10,951 743 21% 267 229 408 11.4x 6.3x 14.74 32% 8.3x 2.6x
PetroQuest Energy Inc. 9/30/2016 12/31/2016 3.82 2.12 6.29 61% 87 405 174 75% 116 76 102 4.8x 3.9x 2.33 322% nmf 2.9x
Pioneer Natural Resources Co. 12/31/2016 12/31/2016 185.97 159.04 264.66 70% 31,577 32,232 4,361 29% 1,439 1,403 1,644 9.3x 6.7x 7.39 10% 0.6x 0.2x
QEP Resources, Inc. 12/31/2016 12/31/2016 13.76 12.15 27.97 49% 3,323 4,900 4,338 59% 950 927 1,055 4.4x 3.3x 1.13 61% 5.1x 1.4x
Range Resources Corporation 12/31/2016 12/31/2016 27.62 30.13 62.20 44% 6,845 10,614 13,450 66% 1,521 1,541 2,095 6.4x 5.2x 0.79 55% nmf 2.3x
RSP Permian, Inc. 12/31/2016 12/31/2016 39.49 31.59 62.14 64% 5,913 6,730 955 14% 300 177 324 7.6x 5.4x 7.05 25% 2.8x 0.9x
Sanchez Energy Corporation 12/31/2016 12/31/2016 11.50 4.34 19.06 60% 741 3,175 1,293 25% 513 320 480 4.9x 3.3x 2.46 347% nmf 3.2x
SM Energy Company 12/31/2016 12/31/2016 24.65 10.68 57.07 43% 2,485 5,688 2,565 49% 926 906 767 6.6x 4.7x 2.22 129% 11.6x 3.7x
Net Debt /
Current FY
EBITDAX
Enterprise
Value
Proved
Reserves
(Bcfe)
EV / Proved
Reserves
($/Mcfe)
Total
Debt /
Equity
Net Debt /
TTM
EBITDAX
Equity
Market
Cap
% Gas of
Reserves
Current
Production
(Mmcfe/d)
Current FY
Production
(Mmcfe/d)
Next FY
Production
(Mmcfe/d)
EV / EBITDAX
TTM Period
Ended
Current
Fiscal Year
End
Month
End Price
52 Week % of 52
Week
High
PUBLIC MARKETS - KEY TRADING STATISTICS - E&P
(dollar amounts in millions, except for per share data and per proved reserves metrics)
Page 15
Source: Company filings for historical data. Capital IQ and Simmons for projected financial information.
Low High
Current
FY Next FY
Independent Exploration & Production
Southwestern Energy Co. 12/31/2016 12/31/2016 $ 7.51 $ 7.17 $ 20.65 36% $ 3,763 $ 6,996 5,253 93% 2,308 2,399 2,485 4.1x 3.4x $ 1.33 124% 8.0x 1.9x
W&T Offshore Inc. 12/31/2016 12/31/2016 2.51 1.74 4.64 54% 349 1,299 496 46% 233 253 245 3.1x 3.4x 2.62 292% 4.4x 2.3x
Whiting Petroleum Corp. 12/31/2016 12/31/2016 10.85 5.22 19.13 57% 3,110 6,193 3,693 19% 727 774 743 4.5x 3.5x 1.68 102% 3.6x 2.2x
WPX Energy, Inc. 12/31/2016 12/31/2016 12.90 5.07 21.42 60% 4,520 6,831 3,498 63% 510 509 654 7.3x 4.0x 1.95 57% nmf 2.2x
Average 54% $ 8,631 $ 11,644 4,248 46% 1,089 1,091 1,195 6.3x 5.1x $ 3.24 129% 6.6x 2.1x
Median 58% 3,573 6,461 2,443 44% 620 614 698 6.3x 4.8x 2.34 56% 3.9x 2.0x
EV / Proved
Reserves
($/Mcfe)
Total
Debt /
Equity
Net Debt /
TTM
EBITDAX
Net Debt /
Current FY
EBITDAX
TTM Period
Ended
Current
Fiscal Year
End
Month
End Price
52 Week % of 52
Week
High
Equity
Market
Cap
Enterprise
Value
Proved
Reserves
(Bcfe)
% Gas of
Reserves
Current
Production
(Mmcfe/d)
Current FY
Production
(Mmcfe/d)
Next FY
Production
(Mmcfe/d)
EV / EBITDAX

© 2017 Piper Jaffray & Co. Since 1895. Simmons & Company International Energy Specialists of Piper Jaffray is a brand name used by certain broker/dealer affiliates of Piper Jaffray Companies.
Piper Jaffray Companies (NYSE: PJC) is a leading investment bank and asset management firm. Securities brokerage and investment banking services are offered in the United States through Piper Jaffray & Co., member SIPC and FINRA; in Europe through two separate U.K.-based broker/dealers - Piper Jaffray Ltd., authorized and regulated by the Financial Conduct Authority and Simmons & Company International Limited, authorized and regulated by the Financial Conduct Authority and the Dubai Financial Services Authority as a representative office; and in Hong Kong through Piper Jaffray Hong Kong, registered with the Securities and Futures Commission. Asset management prod-ucts and services are offered through four separate investment advisory affiliates―three registered with the U.S. Securities and Exchange Commission (Advisory Research, Inc.; Piper Jaffray Investment Management LLC; and PJC Capital Partners LLC), and one international asset management firm registered with the Guernsey Financial Services Commission (Parallel General Partner Limited).
ENERGY IN PERSPECTIVE
www.simmonspjc.com
INVESTMENT BANKING
Houston
James P. Baker
Managing Director,
Co-head of Energy Investment Banking
Ira H. Green, Jr.
Managing Director,
Head of Energy Capital Markets
Paul R. Steier
Managing Director,
Energy Services & Equipment
Jay B. Boudreaux
Managing Director,
Exploration & Production [email protected]
Spencer W. Rippstein
Managing Director,
Midstream & Downstream
Michael S. Sulton
Managing Director,
Midstream & Downstream
Damon Box
Managing Director,
Exploration & Production
Andrew C. Schroeder
Managing Director,
Energy Services & Equipment
David A. Watson
Managing Director,
Energy Services & Equipment
Frederick W. Charlton
Managing Director, Chairman and
Co-Head of Energy Investment Banking
Sanjiv Shah
Managing Director,
Energy Services & Equipment
Aberdeen
Mike Beveridge
Managing Director
Nick Dalgarno
Managing Director