energy impact report - gogla
TRANSCRIPT
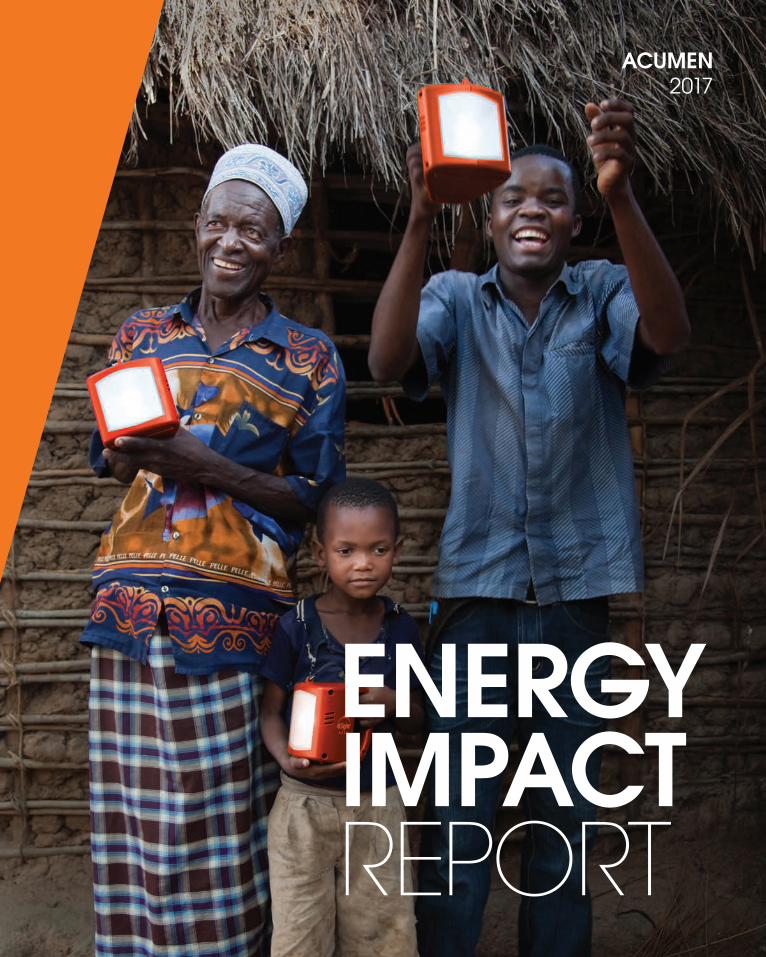
ENERGYIMPACTREPORT
ACUMEN2017
44 APPENDIX
3240 LOOKING
AHEAD16 CUSTOMER
IMPACT
36 Cookstove Case Study: A Deeper Look
38 d.light Case Study: A Patient Capital Story
104 ENERGY
IS POWER
08 Our Energy Portfolio
09 The Impact of Our Energy Portfolio
12 Acumen Case Study: Investing as a Means Not an End
14 Then and Now Case Study: Seeking the Best Power Sources
02 FOREWORD
TABLE OF CONTENTS
FOREWORD: JACQUELINE NOVOGRATZ, FOUNDER & CEO
Dear Friends,
Imagine a life without electricity. It isn’t easy to do. Most of us take for granted that we can flip a switch and illuminate our homes and offices since Thomas Edison invented the lightbulb in 1879. But for one in seven people on earth today, life alters dramatically once the sun goes down. A lack of electricity means spending 10 percent of your income on kerosene, a dirty, expensive, dangerous fuel. It means inhaling fumes equivalent to smoking two packs of cigarettes a day. It means spending hours searching for firewood to cook each meal. It all adds up to inhibiting human potential and harming the earth.
It doesn’t have to be this way.
Ten years ago, Acumen made a commitment to raise philanthropy to invest patient capital in entrepreneurs determined to find market-oriented solutions to energy poverty. At the time, there weren’t a lot of viable solutions available that were financially sustainable, affordable to the poor and good for the environment, but a few entrepreneurs were beginning to experiment with solar-powered lights, biomass (a renewable source of energy that comes from burning waste like rice husk), and micro-hydro systems. These entrepreneurs stood out for their willingness to experiment, their commitment to see the poor as customers, and their razor-sharp focus on using clean energy to light the world. No one had the answers, but Acumen, armed with philanthropic support from our pioneering community of partners, was determined to experiment at the edge.
And, so we did.
In the past decade, Acumen has invested more than $20 million as equity and debt in 20 energy companies across South Asia and Africa. With our investees, we came to understand the power of patient capital in creating entirely new markets for people surviving on a few dollars a day. Entrepreneurs seeking viable solutions to energy poverty had to fight a status quo of kerosene and diesel providers entrenched in bureaucracy and, too often, corruption. They had to convince low-income people to risk their hard-earned income on technologies they had no reason to trust, with few financing options available.
The good news is that we bet on the right entrepreneurs with the right vision and, more importantly, the moral imagination, grit and resilience to commit to purpose before profit and not give up. As those entrepreneurs created a path toward renewable energy, the world changed around them, too. The price of solar dropped by more than 80 percent. An ecosystem of players emerged to develop solar product opportunities that could improve lives in significant ways. Brand awareness developed as low-income markets moved from pre-nascent to fledgling. Patient capital attracted not only additional investment but also grant support for marketing and technical assistance. Progressive corporations supported companies to develop more robust supply chains. Paths to productivity from off-grid energy became more visible, believable and, ultimately, attractive to a wider spectrum of investors.
Thanks to those pioneering philanthropists who enabled Acumen to take this bet, more than 81 million people have sustainable sources of energy today. Eighty-one million. It’s impossible to compare this to what it would
2 ENERGY IMPACT REPORT | ACUMEN 2017
have cost to give those lights away with charity because it required the patient capital investments to create the low-cost technologies in the first place. It is, however, worthy of consideration because, while these investments may take longer, they can change overall systems. Forever.
Patient capital helps create new markets—and outsized social impact. We are committed to honor our partners by reporting on the impact our investments have made, especially on poverty. How we measure our impact also has changed dramatically over the last decade, largely because of technological advances. Acumen’s Lean DataSM methodology allows us to reach thousands of customers at a time, gaining powerful insights quickly and inex-pensively in ways that align incentives for investors, companies and customers alike. That is a game-changer.
Lean Data provides us with more than simply the number of people reached and jobs created. We now know the various levels of income customers earn and whether they see a tangible change in their lives. For instance, with solar light, individuals typically stay active an extra hour each night. Children also study about an hour more. Customers tend to value peace of mind and security. And, last but not least, our investments have kept more than 6.4 million tons of carbon dioxide and black carbon from being released into the atmosphere.
Understanding impact in off-grid energy matters more than ever, especially on a continent like Africa, which still has more than 600 million people living without electricity. Our experience has led us to believe that Africa has a unique opportunity to solve its energy problem with safe, affordable solar power and leapfrog the electrical grid altogether. We have taken what we have learned over the last 10 years and are in the process of building a $100 million initiative to scale energy companies and develop a robust solar ecosystem in East Africa. We are also doubling down on our philanthropy-backed investing to support early-stage energy companies in East and West Africa, Latin America and South Asia through our Pioneer Energy Investment Initiative.
With your support, Acumen feels proud to be part of the clean energy revolution and to have done so standing with the poor each step of the way, for our vision is a world in which everyone has access to energy to release their own potential. We have learned what it will take and have been able to turn philanthropic dollars into massive impact while betting that we will see financial returns that enable us to invest in more pioneering entrepreneurs.
Importantly, this work has deepened our understanding of our own humanity. In speaking with an elderly man in Rwanda, I was struck by his words about loneliness and living in darkness. With solar lighting, he no longer feels insecure when he lies on the mat on his hut’s hard floor. With the power to charge his radio, he can bring voices of the world into his tiny home. While I wish for him a mattress and a pillow to rest his head, the fact that he can turn on his lights with a flick of a switch means he is a step closer to a life free from fear, a life free to bring our best selves to each other, a life of dignity.
Our intent with this report is to share our impact and our insights from our journey investing in solutions to end energy poverty, and to inspire more people to recognize that, for the first time in history, bringing affordable electricity to every human on earth is within our collective reach. Thanks to all of you who have supported Acumen’s work to date. We wouldn’t be here without you.
Jacqueline Novogratz
Founder and CEO, Acumen
3FOREWORD
1 ENERGY IS POWER
the first time. Forty million feel safer because they have light at night and are no longer exposed to open flames when cooking. These families have an hour of additional light each night. And 6.4 million tons of carbon dioxide and black carbon have not been released into the atmosphere.
This is the sort of impact that is possible when we take risk- oriented, philanthropic capital and put it to work as equity or debt in companies run by some of the most daring, committed, and hard-working entrepreneurs on the planet.
These entrepreneurs are walking a long and difficult road, and it’s one that we choose to walk with them because we believe it leads to a world where everyone can lead a life of choice, opportunity, and dignity.
SETTING A NEW STANDARD FOR REPORTING ON IMPACTAcumen exists to create meaning-ful change in the lives of low- income and poor people, which is why we are so committed to
For the last decade, we have invested in clean, affordable energy solutions because we believe it is the best way to solve energy poverty, help mitigate climate change, and release an extraordi-nary amount of human potential.
The headlines are exciting: the $22.1 million we have invested has enabled 20 early-stage companies to provide 81 million people with high-quality, affordable light, power, and improved cookstoves.
These people no longer have to live in the dark after the sun goes down or use unhealthy, expensive, and dangerous kerosene lanterns to read or sit together and talk into the night. This is life- changing in the most basic way.
Eighty-one million translates to nearly four people for every dollar we have invested. And there’s more. Fifty-nine million of these customers are low-income or poor.1 Fifty-seven million have access to modern energy for
Energy lights up homes and powers communities and businesses. For the last 10 years Acumen has invested to bring energy to the more than 1 billion people living off the grid.
understanding where, when, and how we create impact through our investing.
In 2014, we created Lean DataSM, a customer-centric, technology- based approach to impact measurement to speak directly to customers and hear what their lives are like and how they change when they get access to energy.
Lean Data sets a new standard for how impact measurement can add value to customers, companies, and investors, and does so at a fraction of the cost of other approaches. Most importantly, the data we gather are helping our entrepreneurs build more impact-ful businesses to better serve their customers. These data are also enabling us to learn where our investment capital is having the greatest impact on customers’ lives and the environment. They are also helping us identify where we can do better.
For example, we’ve learned that some customers end up spending more during their first year after purchasing a new lighting or power solution than they did on traditional lighting and fuel. And while the proportion of our customers from the lowest-income segments is higher than other impact investors, it is not as high as we’d ultimately like for our energy portfolio as a whole.
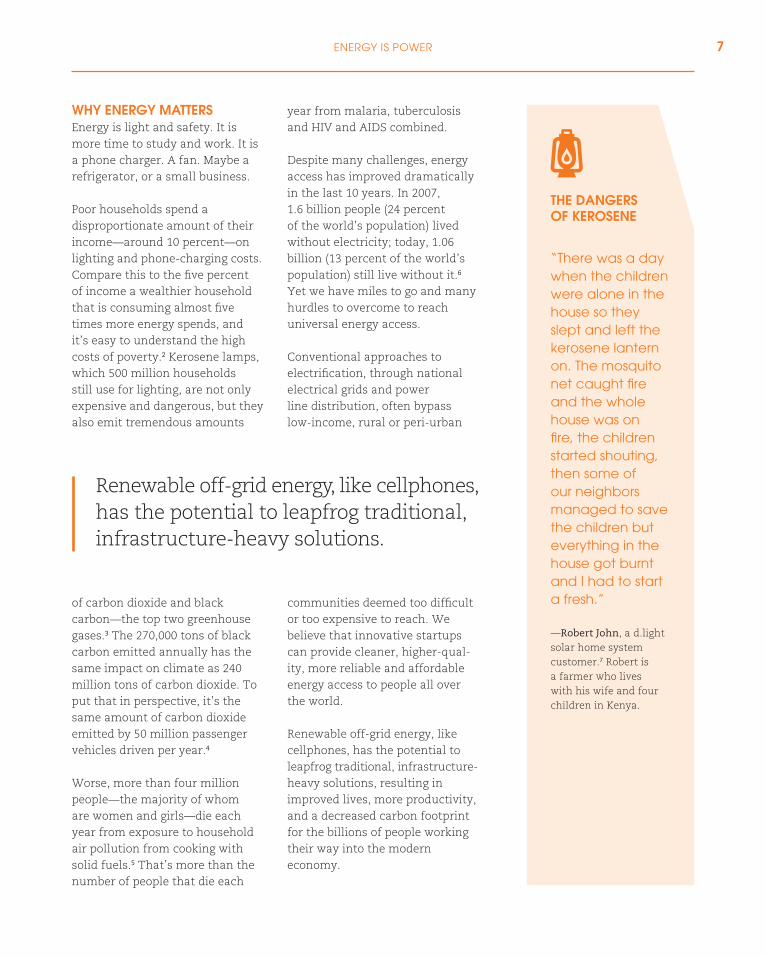
This kind of clear-eyed focus on impact is needed to build scalable, lasting solutions to the lighting, power, and cooking needs of the more than 1 billion people still living without electricity.PHOTO: d.light customer with his family
5ENERGY IS POWER
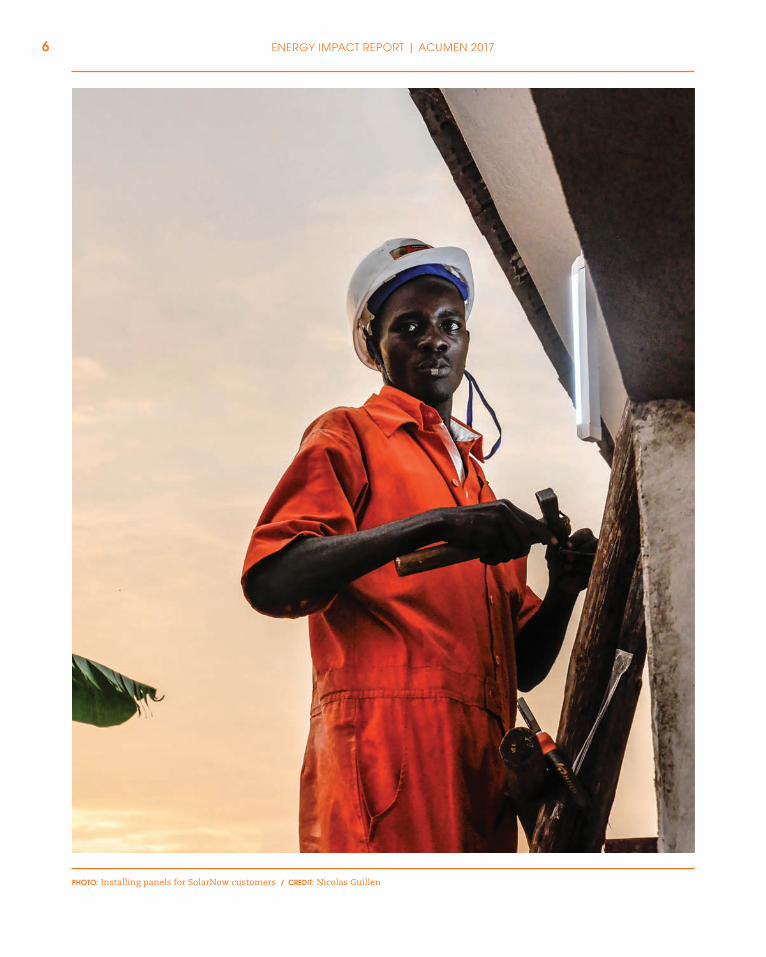
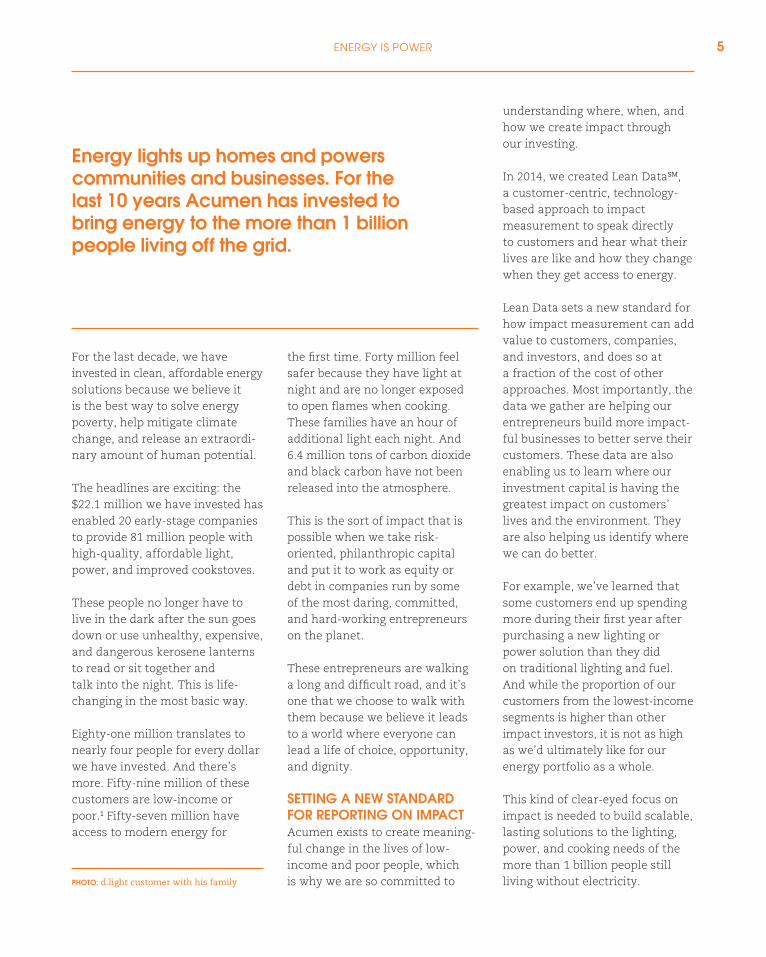
PHOTO: Installing panels for SolarNow customers / CREDIT: Nicolas Guillen
6 ENERGY IMPACT REPORT | ACUMEN 2017
THE DANGERS OF KEROSENE
“There was a day when the children were alone in the house so they slept and left the kerosene lantern on. The mosquito net caught fire and the whole house was on fire, the children started shouting, then some of our neighbors managed to save the children but everything in the house got burnt and I had to start a fresh.”
—Robert John, a d.light solar home system customer.7 Robert is a farmer who lives with his wife and four children in Kenya.
WHY ENERGY MATTERSEnergy is light and safety. It is more time to study and work. It is a phone charger. A fan. Maybe a refrigerator, or a small business.
Poor households spend a disproportionate amount of their income—around 10 percent—on lighting and phone-charging costs. Compare this to the five percent of income a wealthier household that is consuming almost five times more energy spends, and it’s easy to understand the high costs of poverty.2 Kerosene lamps, which 500 million households still use for lighting, are not only expensive and dangerous, but they also emit tremendous amounts
of carbon dioxide and black carbon—the top two greenhouse gases.3 The 270,000 tons of black carbon emitted annually has the same impact on climate as 240 million tons of carbon dioxide. To put that in perspective, it’s the same amount of carbon dioxide emitted by 50 million passenger vehicles driven per year.4
Worse, more than four million people—the majority of whom are women and girls—die each year from exposure to household air pollution from cooking with solid fuels.5 That’s more than the number of people that die each
year from malaria, tuberculosis and HIV and AIDS combined.
Despite many challenges, energy access has improved dramatically in the last 10 years. In 2007, 1.6 billion people (24 percent of the world’s population) lived without electricity; today, 1.06 billion (13 percent of the world’s population) still live without it.6 Yet we have miles to go and many hurdles to overcome to reach universal energy access.
Conventional approaches to electrification, through national electrical grids and power line distribution, often bypass low-income, rural or peri-urban
communities deemed too difficult or too expensive to reach. We believe that innovative startups can provide cleaner, higher-qual-ity, more reliable and affordable energy access to people all over the world.
Renewable off-grid energy, like cellphones, has the potential to leapfrog traditional, infrastructure- heavy solutions, resulting in improved lives, more productivity, and a decreased carbon footprint for the billions of people working their way into the modern economy.
Renewable off-grid energy, like cellphones, has the potential to leapfrog traditional, infrastructure-heavy solutions.
7ENERGY IS POWER
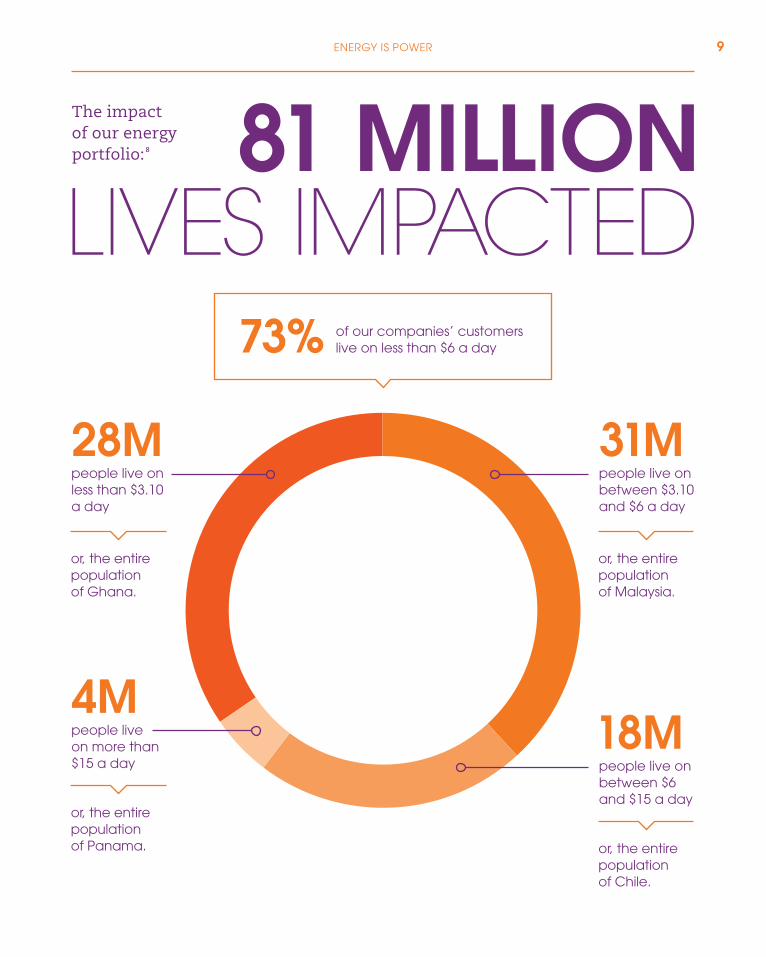
LIVES IMPACTED81 MILLION
18Mpeople live on between $6 and $15 a day
31Mpeople live on between $3.10and $6 a day
or, the entire population of Malaysia.
28Mpeople live on less than $3.10 a day
or, the entire population of Ghana.
or, the entire population of Chile.
4Mpeople live on more than $15 a day
or, the entire population of Panama.
of our companies’ customers live on less than $6 a day73%
The impact of our energyportfolio: 8
GREEN ENERGY BIOFUELS
BURN MANUFACTURING
BIOLITE
BIOLITE
DEVERGY
SOLARNOWKMRI
AZIMUTH
PEG
ORB ENERGY
ORB ENERGY
AVANI
FRONTIER MARKETS
NIZAM ENERGY
SRE SOLUTIONS
HUSK POWER SYSTEMS
HUSK POWER SYSTEMS
GREENWAY GRAMEEN
AKRSP*
M-KOPA*
FLOWING CURRENTS*
D.LIGHT**
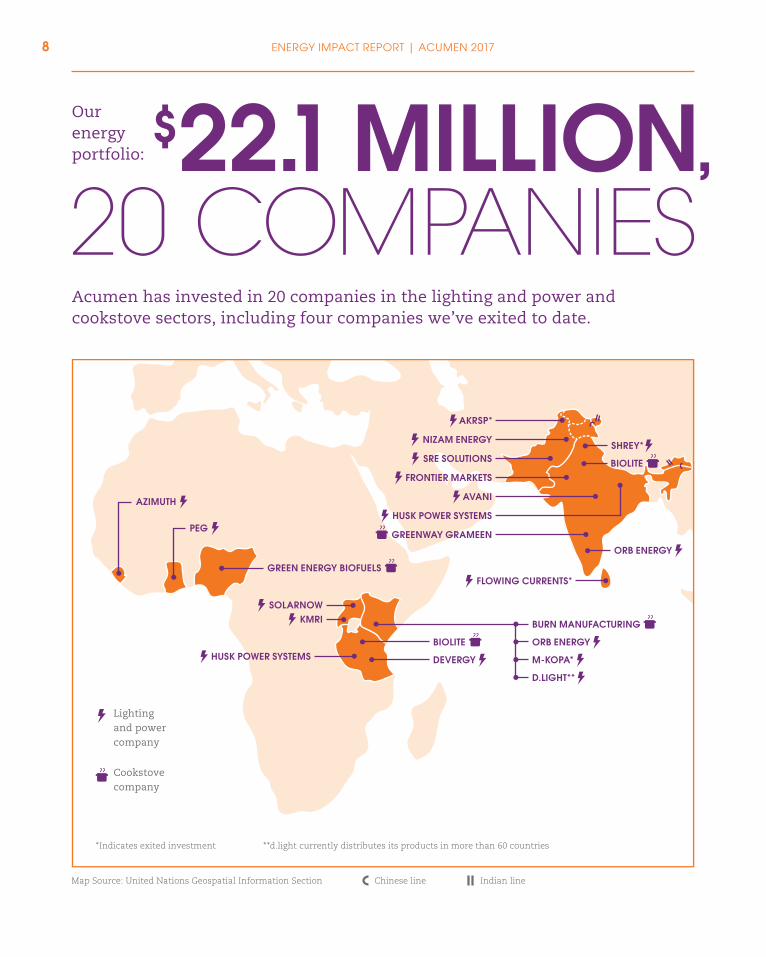
*Indicates exited investment
Map Source: United Nations Geospatial Information Section
**d.light currently distributes its products in more than 60 countries
SHREY*
20 COMPANIES$22.1 MILLION,
Ourenergyportfolio:
Acumen has invested in 20 companies in the lighting and power and cookstove sectors, including four companies we’ve exited to date.
Lighting and power company
Cookstove company
Chinese line Indian line
8 ENERGY IMPACT REPORT | ACUMEN 2017
LIVES IMPACTED81 MILLION
18Mpeople live on between $6 and $15 a day
31Mpeople live on between $3.10and $6 a day
or, the entire population of Malaysia.
28Mpeople live on less than $3.10 a day
or, the entire population of Ghana.
or, the entire population of Chile.
4Mpeople live on more than $15 a day
or, the entire population of Panama.
of our companies’ customers live on less than $6 a day73%
The impact of our energyportfolio: 8
GREEN ENERGY BIOFUELS
BURN MANUFACTURING
BIOLITE
BIOLITE
DEVERGY
SOLARNOWKMRI
AZIMUTH
PEG
ORB ENERGY
ORB ENERGY
AVANI
FRONTIER MARKETS
NIZAM ENERGY
SRE SOLUTIONS
HUSK POWER SYSTEMS
HUSK POWER SYSTEMS
GREENWAY GRAMEEN
AKRSP*
M-KOPA*
FLOWING CURRENTS*
D.LIGHT**
*Indicates exited investment
Map Source: United Nations Geospatial Information Section
**d.light currently distributes its products in more than 60 countries
SHREY*
20 COMPANIES$22.1 MILLION,
Ourenergyportfolio:
Acumen has invested in 20 companies in the lighting and power and cookstove sectors, including four companies we’ve exited to date.
Lighting and power company
Cookstove company
Chinese line Indian line
9ENERGY IS POWER
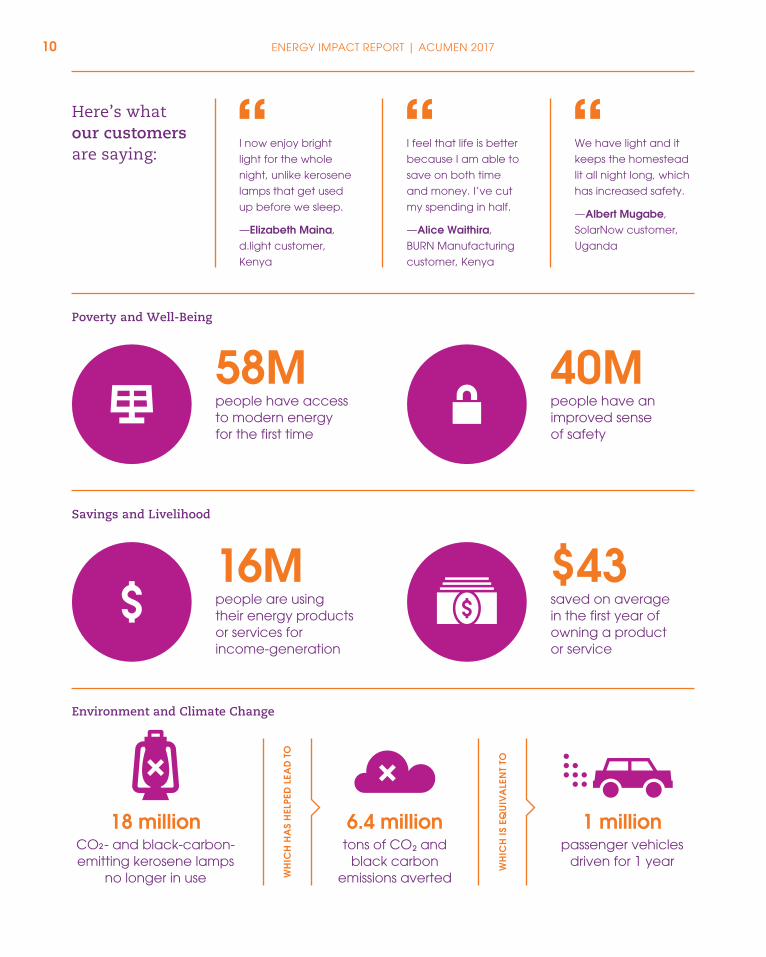
Poverty and Well-Being
Savings and Livelihood
Environment and Climate Change
Here’s what our customers are saying:
1 million
58M
CO2- and black-carbon-emitting kerosene lamps
no longer in use
I now enjoy bright
light for the whole
night, unlike kerosene
lamps that get used
up before we sleep.
—Elizabeth Maina,
d.light customer,
Kenya
I feel that life is better
because I am able to
save on both time
and money. I’ve cut
my spending in half.
—Alice Waithira,
BURN Manufacturing
customer, Kenya
We have light and it
keeps the homestead
lit all night long, which
has increased safety.
—Albert Mugabe,
SolarNow customer,
Uganda
“ “ “
people have access to modern energy for the first time
40Mpeople have an improved sense of safety
16Mpeople are using their energy products or services for income-generation
$43saved on average in the first year of owning a product or service
6.4 million18 milliontons of CO2 and
black carbon emissions averted
passenger vehicles driven for 1 year
WH
ICH
HA
S H
ELPE
D L
EAD
TO
WH
ICH
IS E
QU
IVA
LEN
T TO
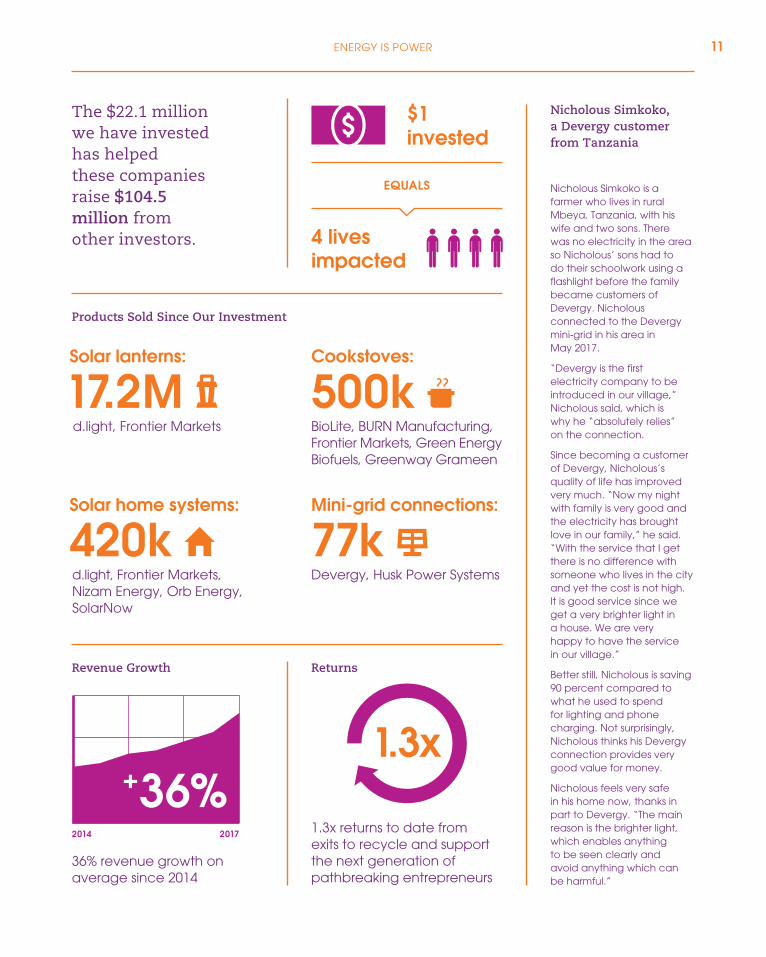
36% revenue growth on average since 2014
1.3x returns to date from exits to recycle and support the next generation of pathbreaking entrepreneurs
Nicholous Simkoko, a Devergy customer from Tanzania
Nicholous Simkoko is a farmer who lives in rural Mbeya, Tanzania, with his wife and two sons. There was no electricity in the area so Nicholous’ sons had to do their schoolwork using a flashlight before the family became customers of Devergy. Nicholous connected to the Devergy mini-grid in his area in May 2017.
“Devergy is the first electricity company to be introduced in our village,” Nicholous said, which is why he “absolutely relies” on the connection.
Since becoming a customer of Devergy, Nicholous’s quality of life has improved very much. “Now my night with family is very good and the electricity has brought love in our family,” he said. “With the service that I get there is no difference with someone who lives in the city and yet the cost is not high. It is good service since we get a very brighter light in a house. We are very happy to have the service in our village.”
Better still, Nicholous is saving 90 percent compared to what he used to spend for lighting and phone charging. Not surprisingly, Nicholous thinks his Devergy connection provides very good value for money.
Nicholous feels very safe in his home now, thanks in part to Devergy. “The main reason is the brighter light, which enables anything to be seen clearly and avoid anything which can be harmful.”
Products Sold Since Our Investment
d.light, Frontier Markets, Nizam Energy, Orb Energy, SolarNow
420k
The $22.1 million we have invested has helped these companies raise $104.5 million from other investors.
Revenue Growth Returns
$1invested
4 livesimpacted
2014 2017
1.3x+36%
BioLite, BURN Manufacturing, Frontier Markets, Green Energy Biofuels, Greenway Grameen
500k
Devergy, Husk Power Systems
77k
EQUALS
Solar lanterns: Cookstoves:
Solar home systems: Mini-grid connections:
d.light, Frontier Markets
17.2M
10 ENERGY IMPACT REPORT | ACUMEN 2017
Poverty and Well-Being
Savings and Livelihood
Environment and Climate Change
Here’s what our customers are saying:
1 million
58M
CO2- and black-carbon-emitting kerosene lamps
no longer in use
I now enjoy bright
light for the whole
night, unlike kerosene
lamps that get used
up before we sleep.
—Elizabeth Maina,
d.light customer,
Kenya
I feel that life is better
because I am able to
save on both time
and money. I’ve cut
my spending in half.
—Alice Waithira,
BURN Manufacturing
customer, Kenya
We have light and it
keeps the homestead
lit all night long, which
has increased safety.
—Albert Mugabe,
SolarNow customer,
Uganda
“ “ “
people have access to modern energy for the first time
40Mpeople have an improved sense of safety
16Mpeople are using their energy products or services for income-generation
$43saved on average in the first year of owning a product or service
6.4 million18 milliontons of CO2 and
black carbon emissions averted
passenger vehicles driven for 1 year
WH
ICH
HA
S H
ELPE
D L
EAD
TO
WH
ICH
IS E
QU
IVA
LEN
T TO
36% revenue growth on average since 2014
1.3x returns to date from exits to recycle and support the next generation of pathbreaking entrepreneurs
Nicholous Simkoko, a Devergy customer from Tanzania
Nicholous Simkoko is a farmer who lives in rural Mbeya, Tanzania, with his wife and two sons. There was no electricity in the area so Nicholous’ sons had to do their schoolwork using a flashlight before the family became customers of Devergy. Nicholous connected to the Devergy mini-grid in his area in May 2017.
“Devergy is the first electricity company to be introduced in our village,” Nicholous said, which is why he “absolutely relies” on the connection.
Since becoming a customer of Devergy, Nicholous’s quality of life has improved very much. “Now my night with family is very good and the electricity has brought love in our family,” he said. “With the service that I get there is no difference with someone who lives in the city and yet the cost is not high. It is good service since we get a very brighter light in a house. We are very happy to have the service in our village.”
Better still, Nicholous is saving 90 percent compared to what he used to spend for lighting and phone charging. Not surprisingly, Nicholous thinks his Devergy connection provides very good value for money.
Nicholous feels very safe in his home now, thanks in part to Devergy. “The main reason is the brighter light, which enables anything to be seen clearly and avoid anything which can be harmful.”
Products Sold Since Our Investment
d.light, Frontier Markets, Nizam Energy, Orb Energy, SolarNow
420k
The $22.1 million we have invested has helped these companies raise $104.5 million from other investors.
Revenue Growth Returns
$1invested
4 livesimpacted
2014 2017
1.3x+36%
BioLite, BURN Manufacturing, Frontier Markets, Green Energy Biofuels, Greenway Grameen
500k
Devergy, Husk Power Systems
77k
EQUALS
Solar lanterns: Cookstoves:
Solar home systems: Mini-grid connections:
d.light, Frontier Markets
17.2M
11ENERGY IS POWER
ACUMEN: INVESTING AS A MEANS, NOT AN END
We started Acumen in 2001 to change the way the world tackles poverty and solve some of the world’s toughest problems. We raise philanthropy to invest patient capital, in the form of equity and debt, in startups that share our commitment to making direct impact on the lives of low-income customers. These entrepreneurs are rooted in their values, deeply dedicated to social impact, and are willing, time and again, to do what is right, not what is easy.
WHY PHILANTHROPY?Acumen invests in new, untested markets, backing early-stage, high-risk, high-impact companies serving low-income customers. We’ve found that traditional investment capital targets financial returns and exit time horizons that are unrealistic for this strategy, given the dual challenge of building successful companies in these markets and of confronting weak infrastructure, fragile supply chains, unstable governments and corruption. While we aim for positive financial returns on each individual investment, at a portfolio level the returns are modest and do not fully financially compensate investors for the risks they take.
Philanthropy allows Acumen to take these risks and to orient ourselves squarely around solving big problems—problems like how to bring safe, clean, affordable light, power and cooking to more than a billion people living off the grid. It allows Acumen the time to accompany our entrepreneurs through ups and downs, staying focused on playing a catalytic role in creating transformative impact for underserved customers. The who, how and how much these lives change are the ultimate indicators of our success, and the financial returns from these investments get recycled to support the next wave of groundbreaking entrepreneurs.
WHY PATIENT CAPITAL?Our capital is patient because we know that it’s a long and difficult road to make lasting change. Fighting apathy, greed, compla-cency, and corruption demands both courage and persistence. Building new products, distribution systems, and payment mechanisms requires space to experiment, fail, and start again. Building trust with customers who have been let down for generations takes time.
12
CASE STUDY
ENERGY IMPACT REPORT | ACUMEN 2017
Our entrepreneurs are looking for partners who will stand by them when they make the tough decisions required to navigate these complex-ities, decisions that align with their values even when this means taking longer for them to reach profitability. We are this kind of partner.
WHAT DOES SUCCESS LOOK LIKE?The payoff comes when a successful business model is fueled by market forces and scales, creating impact that is exponentially greater than what traditional philanthropy can achieve alone. Across our energy portfolio, we have impacted four lives for every dollar invested. For our biggest winners, the numbers
are even more striking: 15 or more lives impacted for every dollar we invest, a number that will continue to grow as these companies scale. Furthermore, for every dollar we invest, others invest five additional dollars as follow- on capital to help our companies scale their customer impact.
WHAT ABOUT FINANCIAL RETURNS? To date, we have achieved a 1.3x return on our exited energy portfolio. When we model our full $22.1 million energy portfolio, we believe we are on track to achieve a 1x cash-on-cash return, which is appropriate given our level of risk and poverty focus.
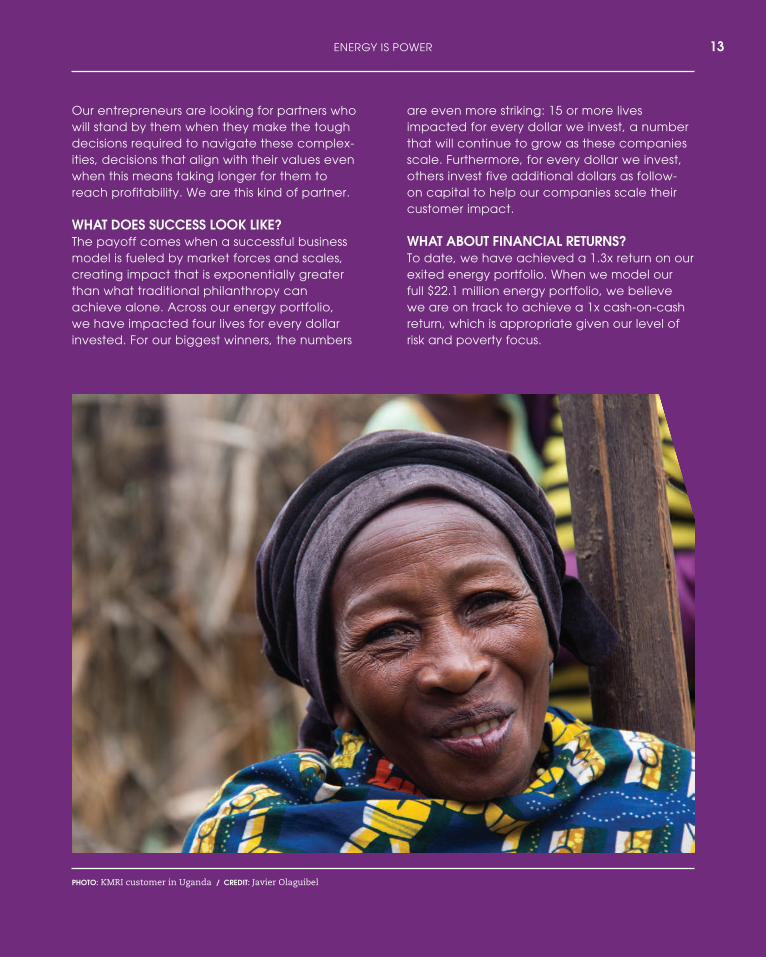
PHOTO: KMRI customer in Uganda / CREDIT: Javier Olaguibel
13ENERGY IS POWER
Acumen’s philosophy when entering a new sector is to have a high appetite for risk, an openness to failure, and a commitment to learn and evolve based on market feedback.
The evolution of our energy portfolio strategy and power sources is a case study of patient capital at work. We took early risks to support innovators across multiple sub-sectors; we hit some dead ends around business models, technologies, or enabling environments; and, over time, we developed a refined thesis that led us to support companies that have become leading players in the space, are serving tens of millions of customers, and are collectively building a major new market serving poor and low-income customers.
THENIn 2007, we did not know which renewable power sources were best suited to build sustain-able energy solutions for poor and low-income families: micro-hydro, biomass, solar devices and mini-grids all seemed to have potential. We made our first solar energy investment in d.light in 2007 when the company’s solar
lanterns cost more than $30. At the time, conventional solar panels with battery storage cost $1,000 or more, making the technology seemingly out of reach for the poor. It wasn’t even clear if solar and storage options could meet off-grid households’ full energy needs.
Meanwhile, micro-hydro looked to have great potential to provide affordable, 24-hour power, at least in locations with a sufficient supply of running water. Based on this thesis, in 2008 we invested in SHREY in Himachal Pradesh, India, our first investment in a micro-hydro mini-grid company. This kicked off five years of intense focus on this sub-sector. We worked with SHREY as the company navigated myriad regulations and approvals; we spent more than a year, starting in 2010, working on a larger micro- hydro equity investment in Kenya; and, in 2013, we invested in Aga Khan Rural Support Programme (AKRSP), a micro-hydro opportu-nity in the mountains of Chitral, Pakistan.
In 2010, we also made our first biomass mini-grid investment in India, in a company called Husk Power Systems. Husk was working in Bihar,
THEN AND NOW: SEEKING THE BEST POWER SOURCES
14
CASE STUDY
ENERGY IMPACT REPORT | ACUMEN 2017
400 in India and 200 in East Africa within the next five years, serving 240,000 households.
Meanwhile, d.light, our first solar investment, has flourished, and the company now sells a suite of products from $5 solar lanterns to home systems that provide access to multiple light points, phone charging, and TVs, reaching more than 75 million customers in 62 countries. Our belief in solar, and our capital deployed in the space, continues to grow. We have invested in six additional companies that use solar energy to power home systems and mini-grids in Tanzania, Kenya, India, Pakistan, Uganda, Sierra Leone, Cote d’Ivoire, and Ghana. The sector as a whole is supported by a strong tailwind of surging global demand for solar panels and batteries for night-time use, which has resulted in an 80 percent price drop from 2007 to 2017. This has made solar products much more affordable to our target market and has put larger systems within reach of millions.
one of the poorest states in India and a major rice producer: Bihar’s rice farms produce 1.8 billion kilograms of rice husks per year, with much of it rotting in landfills and emitting methane, a greenhouse gas.9 We were excited to work with Husk to turn these rice husks into a renewable, carbon-neutral fuel source. The company’s plants could use 50 kilograms of rice husk to produce 32 kilowatts of power per hour, enough to provide 500 homes with two light bulbs’ worth of power for less than $2 per month.
NOWFast forward to 2017, and all arrows point to solar.
In the micro-hydro space, despite our time, effort and capital, we did not see the progress we hoped for: SHREY never broke ground in India due to multiple shifts in the regulatory environment; the Kenyan transaction fell through when the company failed to raise sufficient debt capital; and AKRSP, while serving almost 28,000 Pakistani households, does not look scalable. These results have led us to conclude that micro-hydro, at present, is unlikely to be a viable, large-scale solution for low-income, off-grid energy customers.
Husk did become one of the larger mini-grid operators serving low-income and poor customers globally, but it did so by switching to a solar-biomass hybrid model. The original Husk business model had assumed free access to rice husks available in the village around each plant, yet a typical village had only enough raw material to produce five to seven hours of night-time power, and Husk’s customers were demanding power 24 hours a day. This drove Husk to begin buying rice from outside the village, which ultimately increased costs and hurt profitability. In this same period, the costs of solar dropped significantly. These two factors pushed the company to shift to solar as a complementary power source for its plants. Under this new, hybrid business model, Husk currently has 85 sites and plans to have
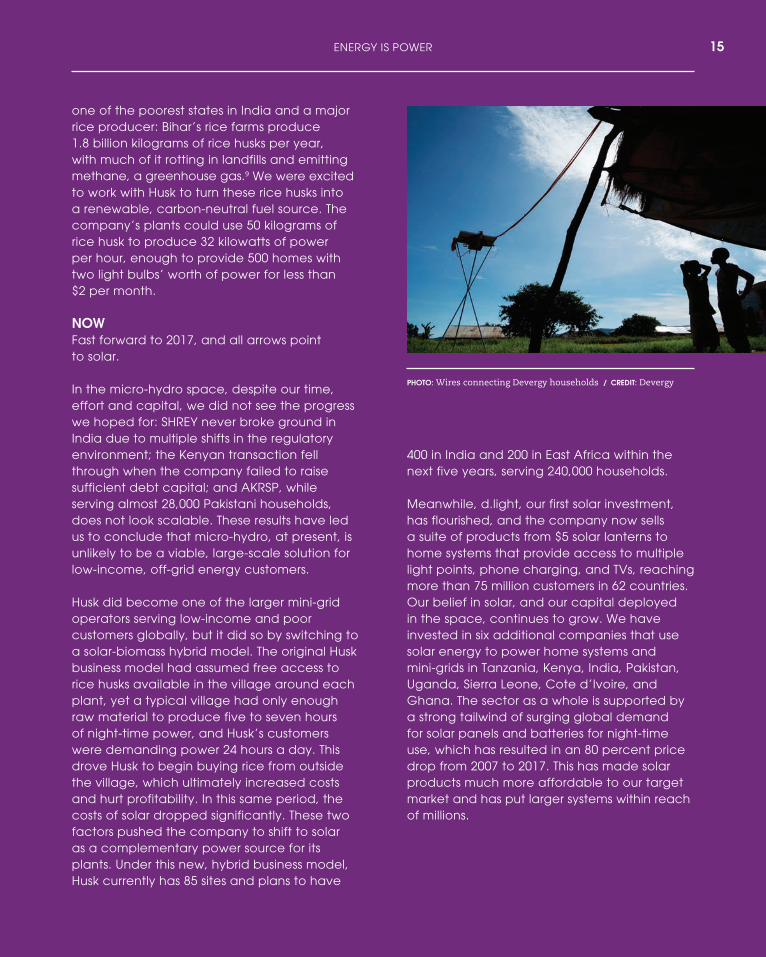
PHOTO: Wires connecting Devergy households / CREDIT: Devergy
15ENERGY IS POWER
2 CUSTOMER IMPACT
Measuring impact can be intimi-dating, perhaps something better left to researchers and academics.
The thing is, impact isn’t compli-cated at all to the customers our companies serve.
These customers know what is hard about their lives. Every day they experience things that are frustrating or wasteful or broken. It is not difficult for them to explain how their lives change when they get access to light, power, or an improved stove.10
With Lean Data, we provide a direct, unobtrusive and inexpen-sive way for these customers to communicate what impact means to them.
WHAT IS LEAN DATA?Lean Data is a way to listen to customers at scale. By amplifying customers’ voices, we empower them to tell us how access to improved products and services
does and does not make a differ-ence in their lives. With these data, we provide insights to our compa-nies while learning how we can better deploy our capital to make the greatest impact in people’s lives.
Lean Data is a radical departure, both in mindset and approach, from traditional ways of mea-suring impact. These approaches are typically top-down and use predetermined frameworks anchored in metrics that funders think are important. They are also expensive and slow, and they are not designed to strengthen the relationship between companies and their customers. This is why so many social enterprises and impact investors avoid traditional impact measurement approaches and resort to reporting basic operational measures, like units sold or customers reached, as their impact.11 At best, this gives a shallow assessment of impact based on assumptions. At worst, the results can be misleading: if a product is sold but not used, or if it is used but then breaks, it doesn’t have any impact at all, or it can have a negative impact.
Lean Data is different. It is fast, inexpensive, and designed to strengthen the relationship between companies and the customers they serve.
Acumen’s Lean Data team has driven down the cost of gathering information by investing heavily in remote data collection over cellphones. We are leaders in using phone calls, SMS, and online surveys for impact measurement, and we can get high-quality data from customers without knocking on their doors.
The first step for every survey we develop is to ask customers open-ended questions about how their lives have changed because of access to energy. This qualitative feedback identifies what matters most to customers, allowing us to build impact indicators and survey questions aligned with the issues and priorities import-ant to them.
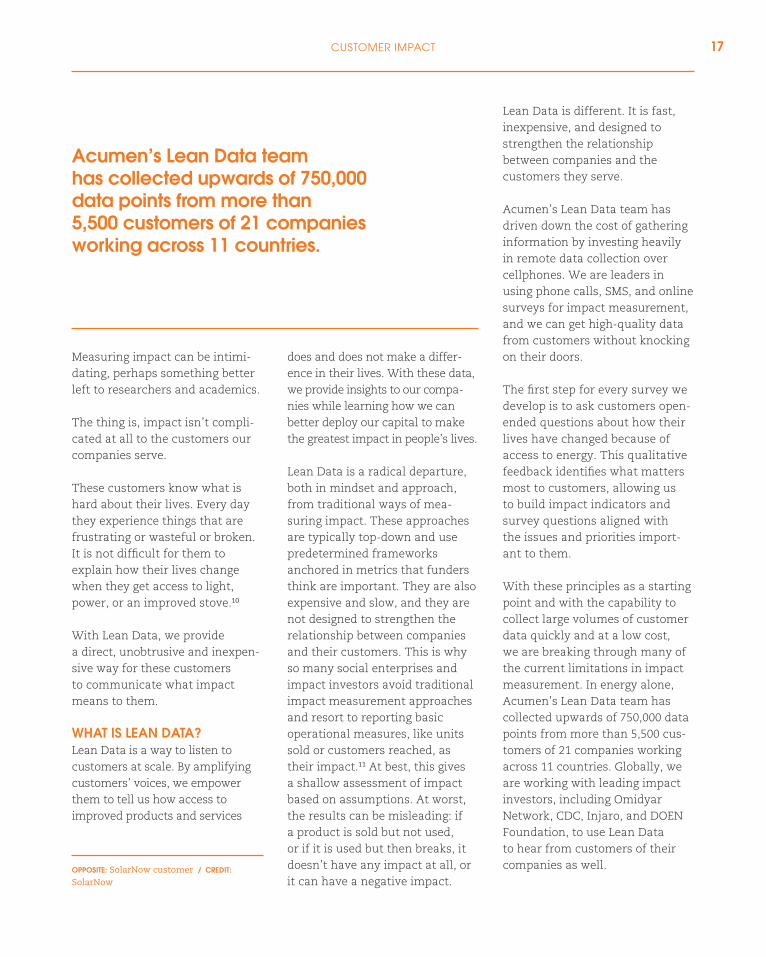
With these principles as a starting point and with the capability to collect large volumes of customer data quickly and at a low cost, we are breaking through many of the current limitations in impact measurement. In energy alone, Acumen’s Lean Data team has collected upwards of 750,000 data points from more than 5,500 cus-tomers of 21 companies working across 11 countries. Globally, we are working with leading impact investors, including Omidyar Network, CDC, Injaro, and DOEN Foundation, to use Lean Data to hear from customers of their companies as well.
Acumen’s Lean Data team has collected upwards of 750,000 data points from more than 5,500 customers of 21 companies working across 11 countries.
OPPOSITE: SolarNow customer / CREDIT: SolarNow
17CUSTOMER IMPACT
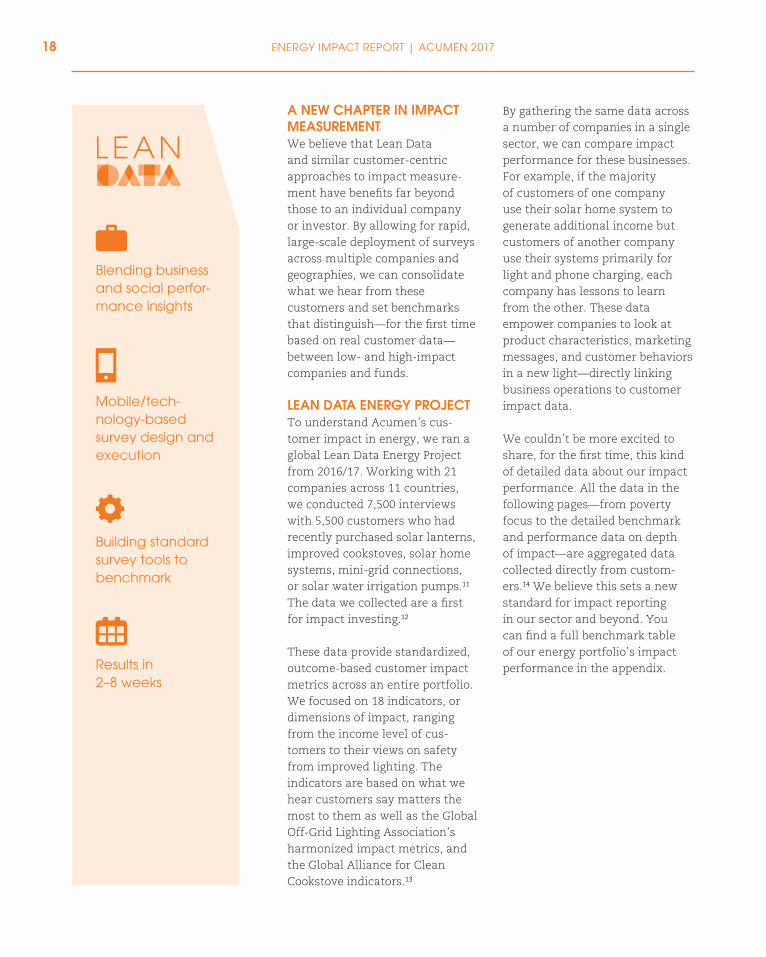
A NEW CHAPTER IN IMPACT MEASUREMENTWe believe that Lean Data and similar customer-centric approaches to impact measure-ment have benefits far beyond those to an individual company or investor. By allowing for rapid, large-scale deployment of surveys across multiple companies and geographies, we can consolidate what we hear from these customers and set benchmarks that distinguish—for the first time based on real customer data—between low- and high-impact companies and funds.
LEAN DATA ENERGY PROJECTTo understand Acumen’s cus-tomer impact in energy, we ran a global Lean Data Energy Project from 2016/17. Working with 21 companies across 11 countries, we conducted 7,500 interviews with 5,500 customers who had recently purchased solar lanterns, improved cookstoves, solar home systems, mini-grid connections, or solar water irrigation pumps.11 The data we collected are a first for impact investing.12
These data provide standardized, outcome-based customer impact metrics across an entire portfolio. We focused on 18 indicators, or dimensions of impact, ranging from the income level of cus-tomers to their views on safety from improved lighting. The indicators are based on what we hear customers say matters the most to them as well as the Global Off-Grid Lighting Association’s harmonized impact metrics, and the Global Alliance for Clean Cookstove indicators.13
By gathering the same data across a number of companies in a single sector, we can compare impact performance for these businesses. For example, if the majority of customers of one company use their solar home system to generate additional income but customers of another company use their systems primarily for light and phone charging, each company has lessons to learn from the other. These data empower companies to look at product characteristics, marketing messages, and customer behaviors in a new light—directly linking business operations to customer impact data.
We couldn’t be more excited to share, for the first time, this kind of detailed data about our impact performance. All the data in the following pages—from poverty focus to the detailed benchmark and performance data on depth of impact—are aggregated data collected directly from custom-ers.14 We believe this sets a new standard for impact reporting in our sector and beyond. You can find a full benchmark table of our energy portfolio’s impact performance in the appendix.
Mobile/tech-nology-based survey design and execution
Building standard survey tools to benchmark
Results in 2–8 weeks
Blending business and social perfor-mance insights
18 ENERGY IMPACT REPORT | ACUMEN 2017
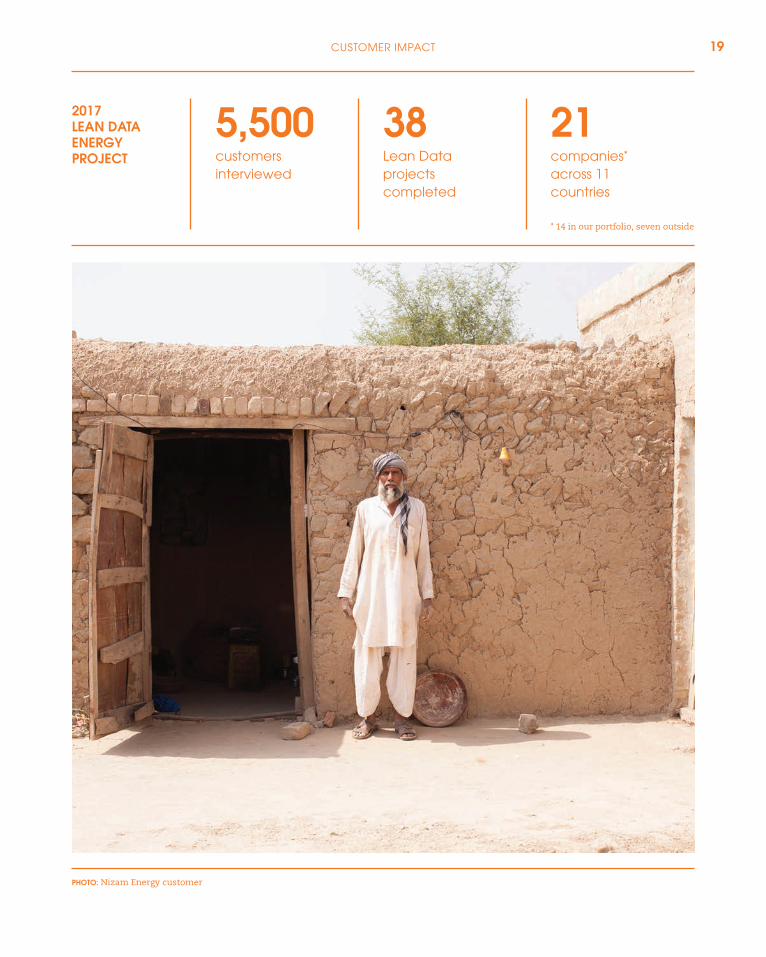
38Lean Data projects completed
5,500customers interviewed
21companies* across 11 countries
2017 LEAN DATA ENERGY PROJECT
PHOTO: Nizam Energy customer
* 14 in our portfolio, seven outside
19CUSTOMER IMPACT

POVERTY FOCUS
DEPTHBREADTH
ACUMEN’STARGET
ACUMEN’S IMPACT FRAMEWORK
Prior to 2012, most of our impact reporting focused on breadth of impact, with spotty or anecdotal data around poverty focus and depth of impact. With Lean Data we have made great strides in getting more rigorous data on the percentage and number of customers who are poor and low- income, and the various dimen-sions of depth of impact—from
changes in household spending and use of light to changes in perception of health and safety.
Today, Acumen’s framework for assessing customer impact has three dimensions, giving us focus while still allowing flexibility at a sector and company level. We target investments that achieve:
BREADTH OF IMPACTThe number of people reached by the business—81M for our energy portfolio.
POVERTY FOCUSThe number and percentage of customers who live below international poverty lines.
DEPTH OF IMPACTThe change in the well-being of the household using the product or service.
20 ENERGY IMPACT REPORT | ACUMEN 2017
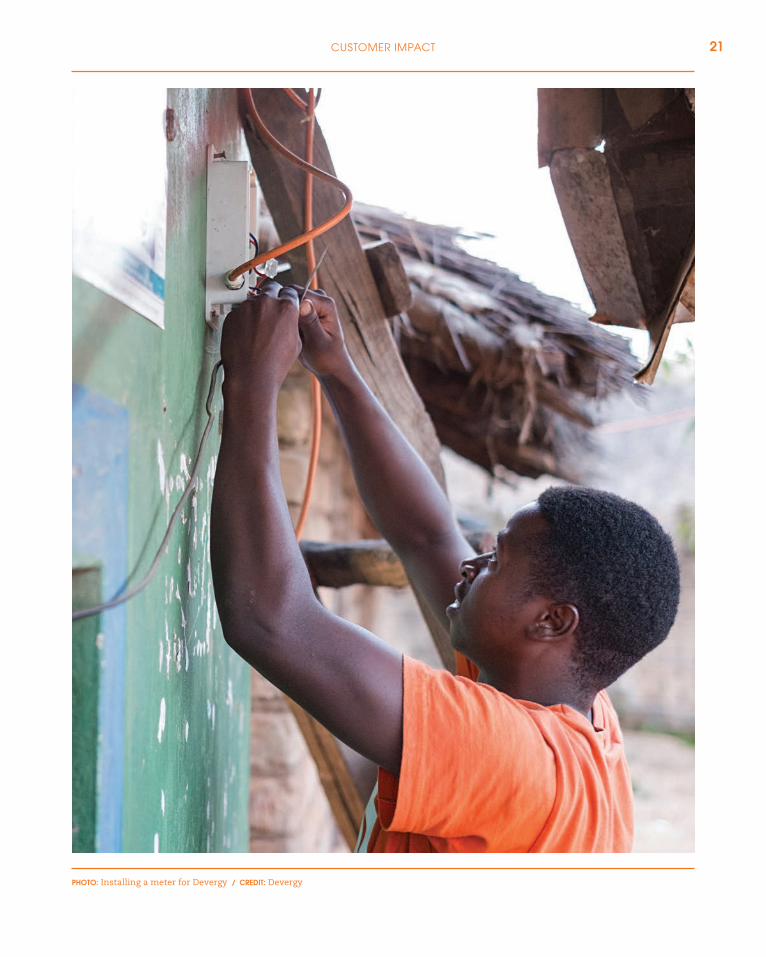
PHOTO: Installing a meter for Devergy / CREDIT: Devergy
21CUSTOMER IMPACT

POVERTY FOCUS
“A poor person just like me can easily buy this system because it’s on installments.
—Khuda Bux, Nizam
Energy, Pakistan
Acumen exists to tackle the challenges of poverty, and so, naturally, it’s important for us to understand if our lighting, power, and cookstove companies are reaching poor and low-income customers.
Most social enterprises and impact investors don’t collect poverty focus data and, if they do, they typically base these data on anecdotes—verbal interactions with a handful of customers— or loose proxies such as whether a company’s country or region
of operations is, in general, poor. These approaches are inaccurate, which is why we collect data directly from customers, using a modified version of the Poverty Probability Index® and other similar tools.
Based on these data, we’ve learned that 35 percent of the customers our companies serve live in poverty (under $3.10 a day) and 38 percent live between $3.10 and $6 a day (both 2011, PPP prices). In general, we see a similar concen-tration of poorer customers buying mini-grid connections, solar home systems, and improved cookstoves. Having 73 percent of customers be either poor or low-income gives us confidence that we are serving our target market. At the same time, we hope to see these numbers
improve, both in absolute and relative terms, and will continue working with our companies to gather data and find ways to deepen their reach into the most underserved segments of the population.
Part of the solution lies in increased affordability. Prices of solar sys-tems and mini-grid connections have both dropped dramatically in recent years, and there is an increase in customer demand for these high-quality, higher-power solutions. However, these systems
are still expensive for poorer families who can almost never pay outright for their full costs. Financing options, such as pay-as-you-go, are widely available, but deposits are often still too high for the poorest customers, and these consumers may not be good credit risks for providers.
Through Lean Data, we are gathering data on household spending so we can understand how to better serve these custom-ers. We intend to use these data to answer questions like: Where are the risks of over-indebtedness? What role can smart subsidies, either from private or government sources, play? And how can these data help in creating new financ-ing solutions that better meet customers’ variable cash flows?
Having 73% of customers be either poor or low-income gives us confidence that we are serving our target market.
22 ENERGY IMPACT REPORT | ACUMEN 2017

100%
80%
60%
40%
20%
0%
75% OF CUSTOMERSLIVE BELOW $6/DAY
66% OF CUSTOMERSLIVE BELOW $6/DAY
Below $3.10Below $1.90 Below $6 Below $8 Below $11 Below $15
PovertyExtreme Poverty Low Income Emerging Middle Class Middle to Wealthy
Acumen portfolio benchmark
Lighting and power company
100%
80%
60%
40%
20%
0%
Below $3.10Below $1.90 Below $6 Below $8 Below $11 Below $15
Per Person Income Line (PPP)
% o
f cu
sto
mer
s%
of
cust
om
ers
Acumen portfolio benchmark
Cookstove company
POVERTY FOCUS ACROSS OUR LIGHTING AND POWER COMPANIES15
POVERTY FOCUS ACROSS OUR COOKSTOVE COMPANIES15
23CUSTOMER IMPACT

DEPTH: INCOME SAVINGS AND CLIMATE CHANGE
DO CUSTOMERS SAVE MONEY AND REDUCE CARBON EMISSIONS WHEN THEY SWITCH TO SOLAR?We know that poorer households spend larger proportions of their income on energy than wealthier families. This implies that they experience the greatest proportional benefit from energy products that save them money.16
However, our data show that not all households immediately save money when they switch to solar. These differences in savings are the result of whether households stop spending on kerosene and other fuel sources, and, more importantly, the total cost of the improved energy product they purchase. Spending on an inex-pensive solar lantern is recouped the most quickly; cookstoves, in general, result in savings sooner as well; and, on average, house-holds that purchase solar home systems end up increasing their energy expenditure during the first year they are paying for the system (and sometimes beyond, depending on credit terms).
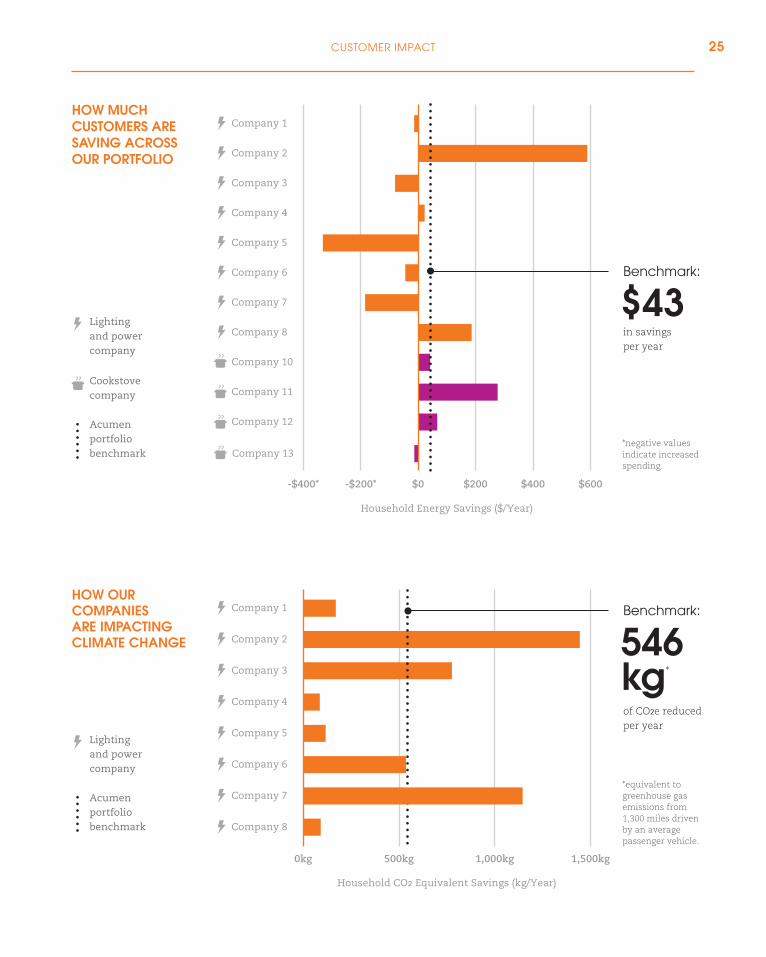
The chart on the opposite page shows the change in spending—and, as a result, savings—for customers in our energy portfolio. In this report, Companies 1 to 16 represent companies in our portfolio.17
As the benchmark shows, in their first year after buying a product, the average customer in our portfolio spends $43 less on energy. For the Lean Data Energy Project, we surveyed new customers, collecting baseline
information within one month of them purchasing their new prod-uct or service and following up with them three to four months later. This is important because the first year typically has the highest costs, as customers either pay for the product outright or are making deposits, down payments, and financing payments.
With Lean Data, we will continue to work with our companies to understand customer spending behavior and explore other hypotheses about the links between buying improved energy products and income levels, so that we can develop a more comprehensive understanding of product affordability and access.
AVERTING CARBON EMISSIONSWe know that low-income and poor households often use fuel sources like kerosene for lighting. We also know that kerosene lanterns emit carbon dioxide and black carbon, two of the biggest contributors to climate change. On average, customers of our lighting and power companies replace the regular use of one kerosene lamp when they pur-chase a solar home system, solar lantern, or mini-grid connection.18 This replacement means that a household, on average, averts nearly 550kg of carbon dioxide and carbon dioxide equivalent of black carbon every year—or the equivalent of what’s emitted when an average passenger vehicle drives over 1,000 miles.19
“We were using a lot of money on lighting but now we use this money to improve on our housing and food.
—David Otim,
SolarNow, Uganda
24 ENERGY IMPACT REPORT | ACUMEN 2017
Company 1
Company 2
Company 3
Company 4
Company 5
Company 6
Company 7
Company 8
Company 1
Company 2
Company 3
Company 4
Company 5
Company 6
Company 7
Company 8
Company 10
Company 11
Company 12
Company 13
$200$0-$200*-$400* $400 $600
Household Energy Savings ($/Year)
500kg0kg 1,000kg 1,500kg
Household CO2 Equivalent Savings (kg/Year)
*equivalent to greenhouse gas emissions from 1,300 miles driven by an average passenger vehicle.
*negative values indicate increased spending.
$43in savingsper year
Benchmark:
546kg*
of CO2e reducedper year
Benchmark:
Lighting and power company
Cookstove company
Acumen portfolio benchmark
Acumen portfolio benchmark
Lighting and power company
HOW MUCH CUSTOMERS ARE SAVING ACROSS OUR PORTFOLIO
HOW OUR COMPANIES ARE IMPACTING CLIMATE CHANGE
25CUSTOMER IMPACT
heterogeneous. For example, in India, where more customers have grid access but power is spotty or expensive, access to solar typically creates different impact than in Uganda, where customers generally live completely off the grid. In Uganda, access to solar results in significant reductions in kerosene use but sometimes requires increases in spending— at least in the short term. India’s government heavily subsidizes kerosene. This means, often, that families have an incentive to use kerosene for lighting, and it is affordable. Families may continue to buy kerosene but not use it (selling it on the black market).
This underlines the importance of collecting this type of firsthand data directly from customers instead of relying solely on assumptions. We need this kind of data if we are serious about understanding and improving customer impact, as well as supporting companies to grow and scale.
Our hope is that these data spur other impact funds and enter-prises to invest more in collecting customer data—not just because it’s the right thing to do or the only way to truly understand our impact, but because it’s the best way to create more value for companies and the customers they serve.
Spider charts can be an easy way to see multiple data points and interpret them quickly. The colored area of the charts shows how well the company creates impact across five impact dimen-sions—like change in hours with light or percentage of customers using their new product or service for income-generation—and allows for a visual comparison of these results against a benchmark (the grey area of the chart).20
Simply put, the bigger the colored area, the greater the impact. It should also be easy to spot areas where a company is over- and under-performing against the benchmark. The goal is to visually interpret our depth of impact data easily, compare these data across companies, and identify dimen-sions where we can work with our companies to improve customer impact. We hope you’ll get caught in the web with us!
HETEROGENEITY OF IMPACTThe differences in the shapes of these spider charts show differences in depth of impact. This might seem obvious, but when companies or investors only report number of products sold, the implication is that a product or service has similar depth of impact across different locations and customers. It doesn’t—if it did, the spider charts for compa-nies selling the same product or service would all look the same.
What we’re seeing is that the same product or service sold in different contexts or to different customers has different impacts, and the depth of impact is
DEPTH: HOUSEHOLD WELL-BEING
26 ENERGY IMPACT REPORT | ACUMEN 2017
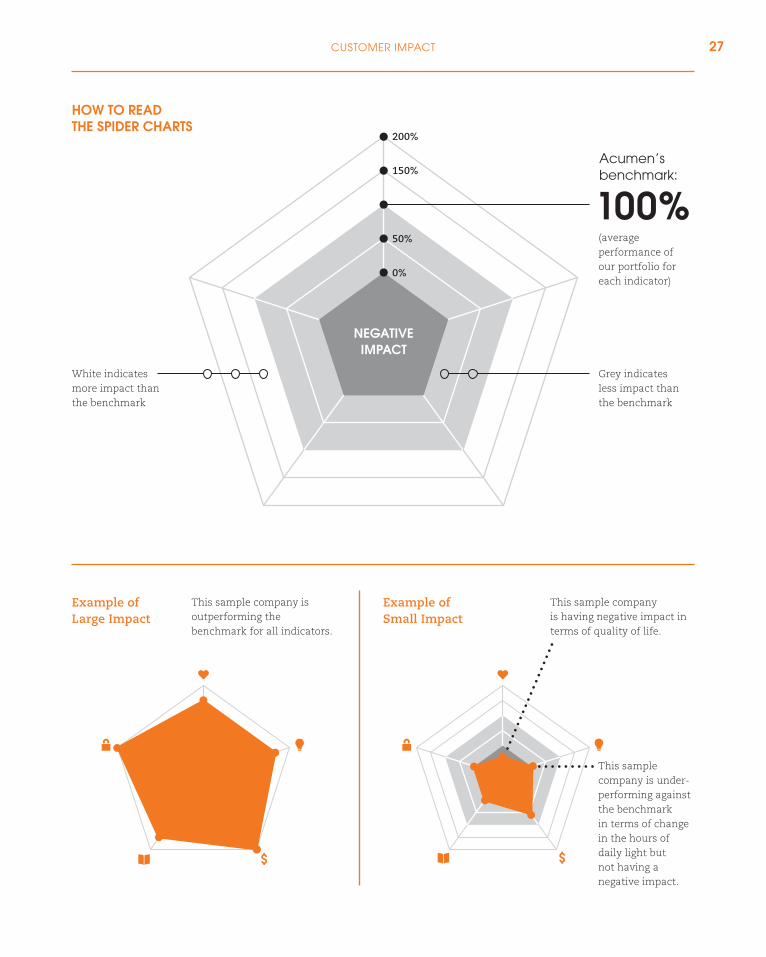
White indicates more impact than the benchmark
0%
50%
150%
200%
NEGATIVEIMPACT
Grey indicates less impact than the benchmark
This sample company is having negative impact in terms of quality of life.
This sample company is outperforming the benchmark for all indicators.
This sample company is under-performing against the benchmark in terms of change in the hours of daily light but not having a negative impact.
(average performance of our portfolio for each indicator)
100%Acumen’sbenchmark:
HOW TO READ THE SPIDER CHARTS
Example of Large Impact
Example of Small Impact
27CUSTOMER IMPACT
Company 1 Company 2
Company 4
Company 3
129%
-8%
102%60%
169%
50%
217%
449%
0%
77%
163%
108%
24%
134%
123%
65%
25%
24%74%
149%
Company 7
161%
242%
83%119%
193%
Company 5
131%
50%
102%
0%
119%
Company 9
134%
0%
68%
0%
0%
Company 8
55%
0%
434%
0%
167%
Company 6
101%
67%
54%
119%
81%
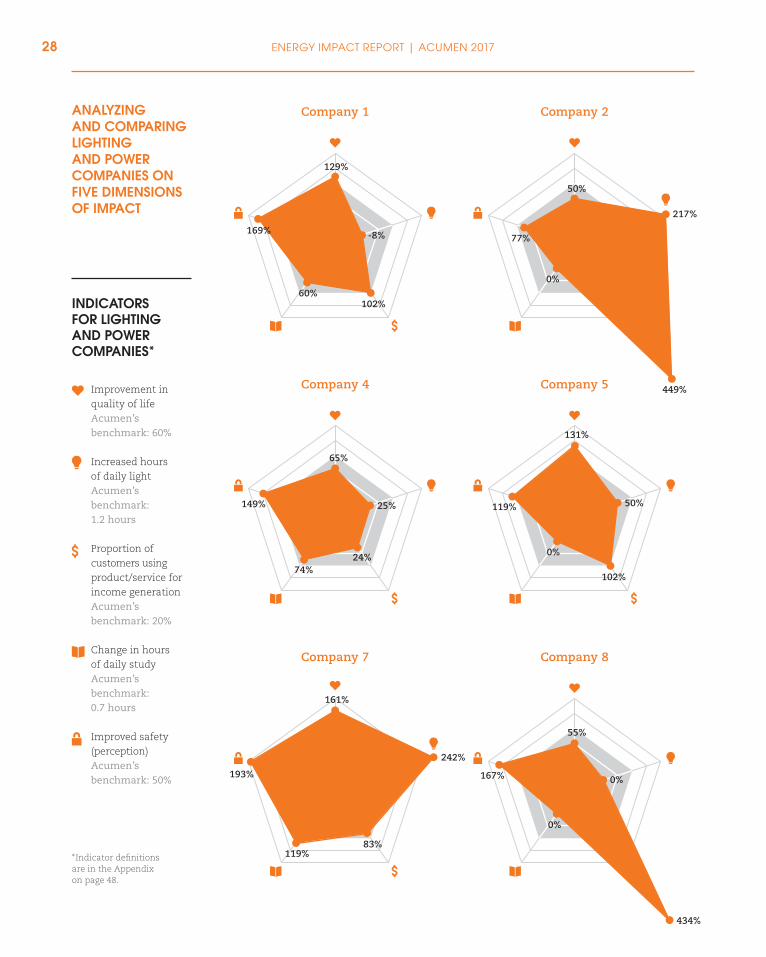
ANALYZING AND COMPARING LIGHTING AND POWER COMPANIES ON FIVE DIMENSIONS OF IMPACT
Improvement in quality of lifeAcumen’s benchmark: 60%
Increased hours of daily lightAcumen’s benchmark: 1.2 hours
Proportion of customers using product/service for income generationAcumen’s benchmark: 20%
Change in hours of daily studyAcumen’s benchmark: 0.7 hours
Improved safety (perception)Acumen’s benchmark: 50%
INDICATORS FOR LIGHTING AND POWER COMPANIES*
*Indicator definitions are in the Appendix on page 48.
28 ENERGY IMPACT REPORT | ACUMEN 2017
Company 1 Company 2
Company 4
Company 3
129%
-8%
102%60%
169%
50%
217%
449%
0%
77%
163%
108%
24%
134%
123%
65%
25%
24%74%
149%
Company 7
161%
242%
83%119%
193%
Company 5
131%
50%
102%
0%
119%
Company 9
134%
0%
68%
0%
0%
Company 8
55%
0%
434%
0%
167%
Company 6
101%
67%
54%
119%
81%
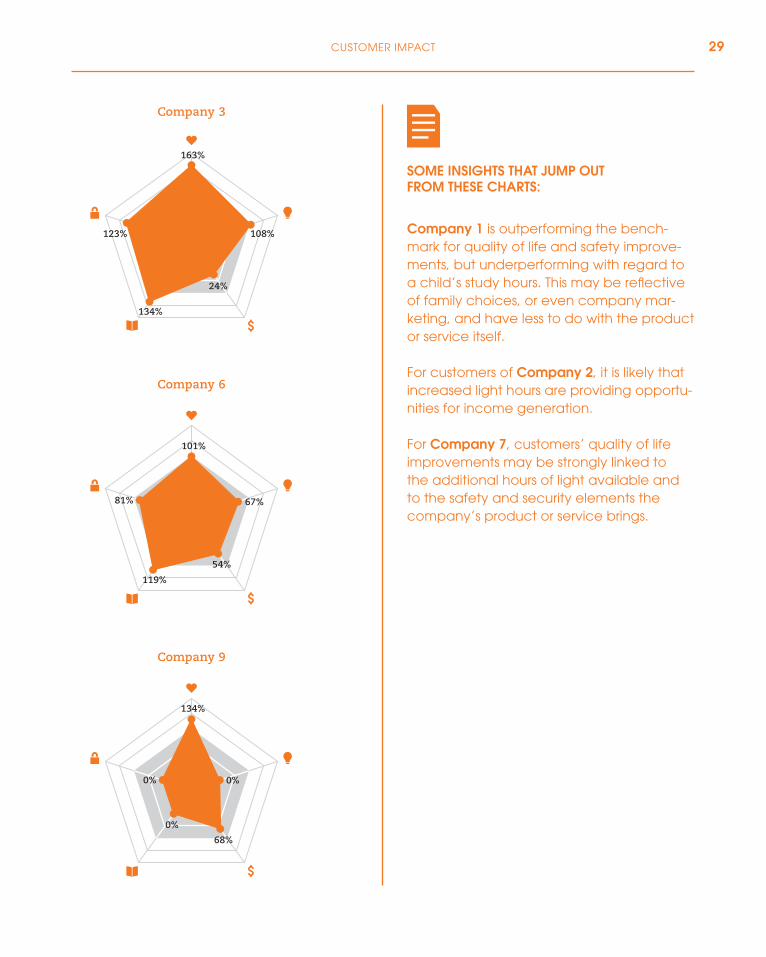
SOME INSIGHTS THAT JUMP OUT FROM THESE CHARTS:
Company 1 is outperforming the bench-mark for quality of life and safety improve-ments, but underperforming with regard to a child’s study hours. This may be reflective of family choices, or even company mar-keting, and have less to do with the product or service itself.
For customers of Company 2, it is likely that increased light hours are providing opportu-nities for income generation.
For Company 7, customers’ quality of life improvements may be strongly linked to the additional hours of light available and to the safety and security elements the company’s product or service brings.
29CUSTOMER IMPACT
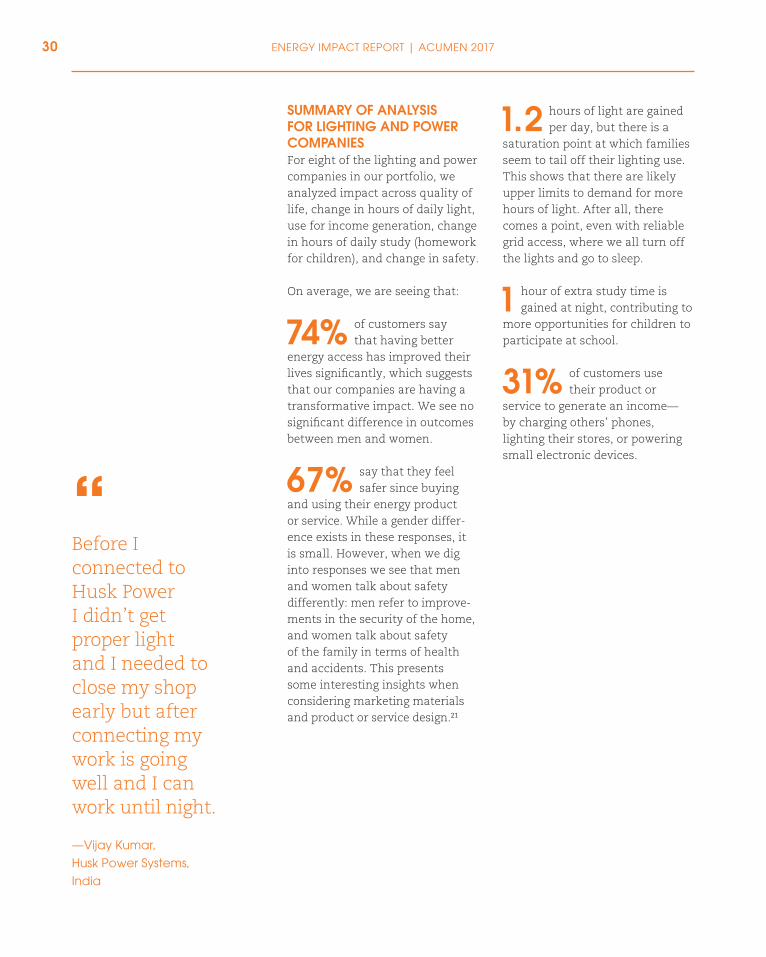
1.2 hours of light are gained per day, but there is a
saturation point at which families seem to tail off their lighting use. This shows that there are likely upper limits to demand for more hours of light. After all, there comes a point, even with reliable grid access, where we all turn off the lights and go to sleep.
1 hour of extra study time is gained at night, contributing to
more opportunities for children to participate at school.
31% of customers use their product or
service to generate an income— by charging others’ phones, lighting their stores, or powering small electronic devices.
SUMMARY OF ANALYSIS FOR LIGHTING AND POWER COMPANIESFor eight of the lighting and power companies in our portfolio, we analyzed impact across quality of life, change in hours of daily light, use for income generation, change in hours of daily study (homework for children), and change in safety.
On average, we are seeing that:
74% of customers say that having better
energy access has improved their lives significantly, which suggests that our companies are having a transformative impact. We see no significant difference in outcomes between men and women.
67% say that they feel safer since buying
and using their energy product or service. While a gender differ-ence exists in these responses, it is small. However, when we dig into responses we see that men and women talk about safety differently: men refer to improve-ments in the security of the home, and women talk about safety of the family in terms of health and accidents. This presents some interesting insights when considering marketing materials and product or service design.21
“Before I connected to Husk Power I didn’t get proper light and I needed to close my shop early but after connecting my work is going well and I can work until night.
—Vijay Kumar,
Husk Power Systems,
India
30 ENERGY IMPACT REPORT | ACUMEN 2017
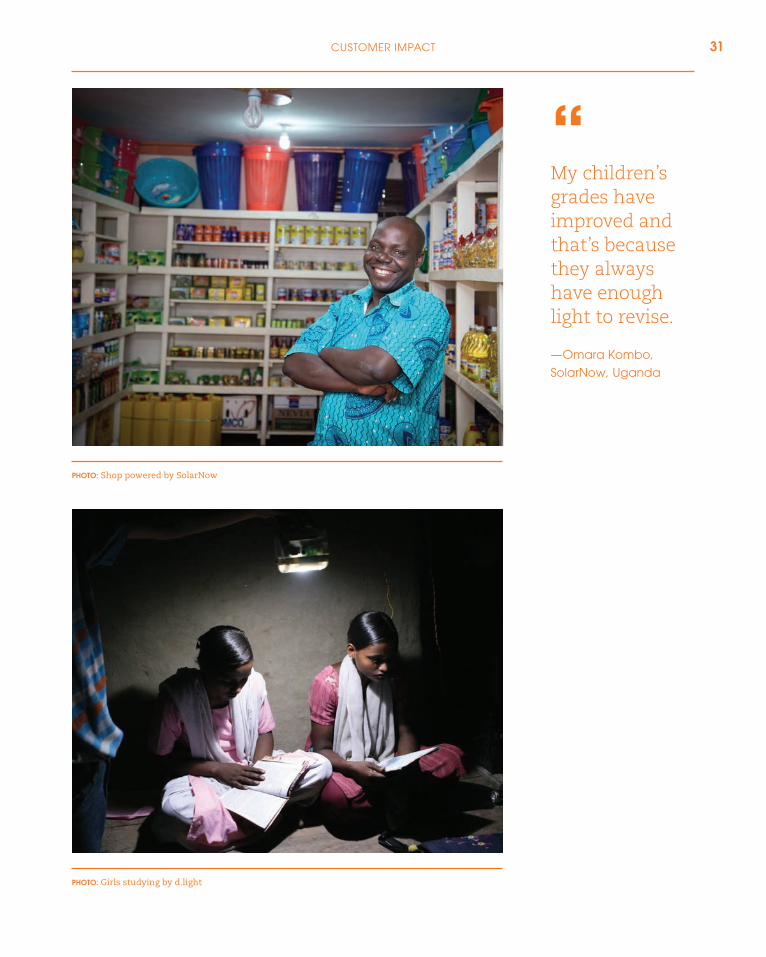
“My children’s grades have improved and that’s because they always have enough light to revise.
—Omara Kombo,
SolarNow, Uganda
PHOTO: Girls studying by d.light
PHOTO: Shop powered by SolarNow
31CUSTOMER IMPACT
Company 10 Company 11
Company 16
84%
9%
79%104%
101%
36%
9%
65%
-28%
0%
Company 15
78%
15%
0%0%
0%
Company 12
161%
213%
117%
-102%
21%
Company 13
70%
117%
131%
426%
0%
Company 14
66%
73%
0%0%
0%
113%
42%
92%
0%
0%
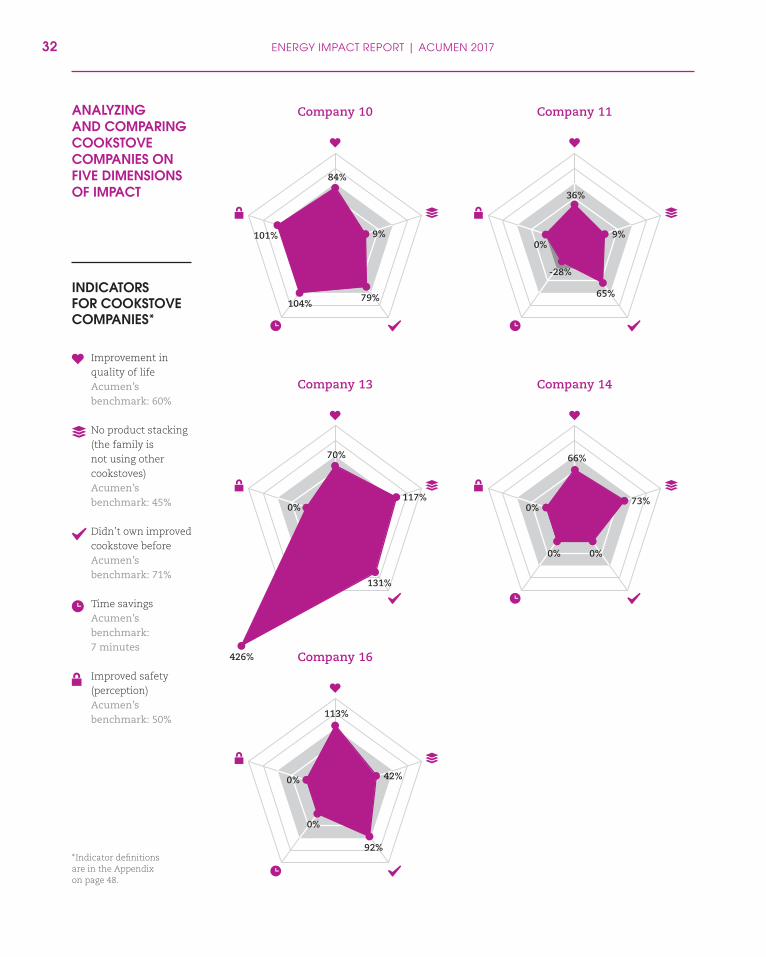
ANALYZING AND COMPARING COOKSTOVE COMPANIES ON FIVE DIMENSIONS OF IMPACT
Improvement in quality of lifeAcumen’s benchmark: 60%
No product stacking (the family is not using other cookstoves)Acumen’s benchmark: 45%
Didn’t own improved cookstove beforeAcumen’s benchmark: 71%
Time savingsAcumen’s benchmark: 7 minutes
Improved safety (perception)Acumen’s benchmark: 50%
*Indicator definitions are in the Appendix on page 48.
INDICATORS FOR COOKSTOVE COMPANIES*
ENERGY IMPACT REPORT | ACUMEN 201732

Company 10 Company 11
Company 16
84%
9%
79%104%
101%
36%
9%
65%
-28%
0%
Company 15
78%
15%
0%0%
0%
Company 12
161%
213%
117%
-102%
21%
Company 13
70%
117%
131%
426%
0%
Company 14
66%
73%
0%0%
0%
113%
42%
92%
0%
0%
LOOKING AT INDIVIDUAL COMPANIES, WE SEE THAT:
Company 10 is having the most well-rounded impact across these five dimen-sions. However, Company 10 is not meeting all household needs as many customers continue to use other stoves.
Relative to the benchmark, Companies 11 and 15 have room to improve across all the dimensions.
Company 12 outperforms for no stacking—meaning the stove is meeting more of the customers’ cooking needs—and for quality of life improvements. This confirms the importance of providing stoves that provide a complete solution to customers’ varied cooking needs.
We see that Company 13 is reaching, rela-tive to other companies, a higher proportion of customers who have never owned an improved cookstove. This may be why we see this cookstove outperforming the others in terms of time savings for families.
33CUSTOMER IMPACT
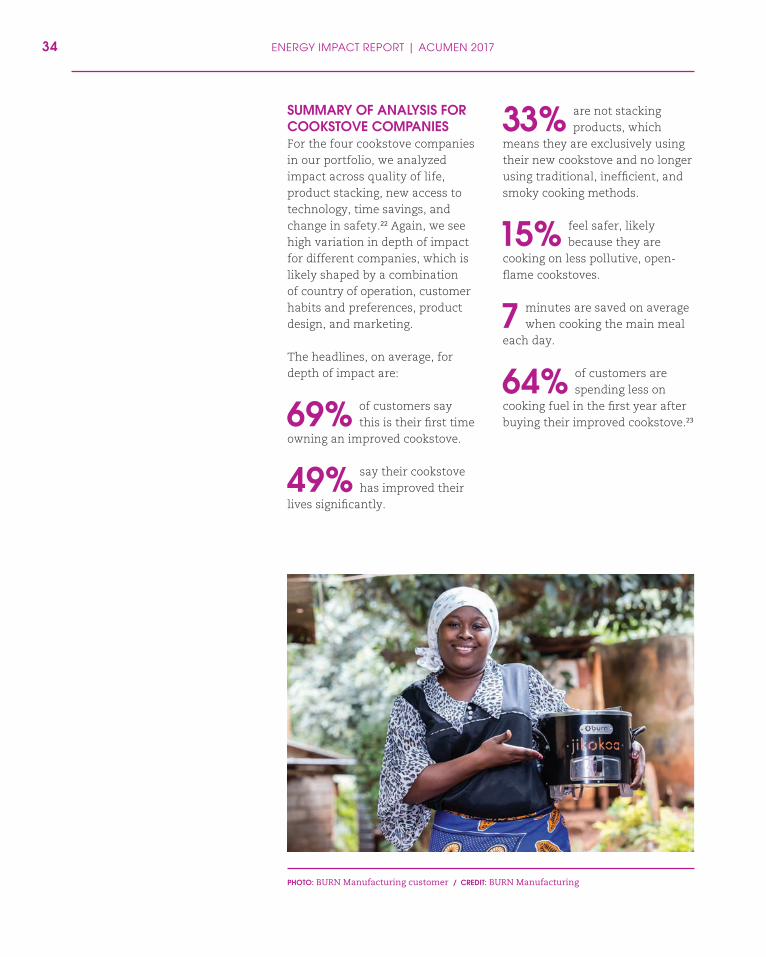
SUMMARY OF ANALYSIS FOR COOKSTOVE COMPANIESFor the four cookstove companies in our portfolio, we analyzed impact across quality of life, product stacking, new access to technology, time savings, and change in safety.22 Again, we see high variation in depth of impact for different companies, which is likely shaped by a combination of country of operation, customer habits and preferences, product design, and marketing.
The headlines, on average, for depth of impact are:
69% of customers say this is their first time
owning an improved cookstove.
49% say their cookstove has improved their
lives significantly.
33% are not stacking products, which
means they are exclusively using their new cookstove and no longer using traditional, inefficient, and smoky cooking methods.
15% feel safer, likely because they are
cooking on less pollutive, open-flame cookstoves.
7 minutes are saved on average when cooking the main meal
each day.
64% of customers are spending less on
cooking fuel in the first year after buying their improved cookstove.23
PHOTO: BURN Manufacturing customer / CREDIT: BURN Manufacturing
ENERGY IMPACT REPORT | ACUMEN 201734
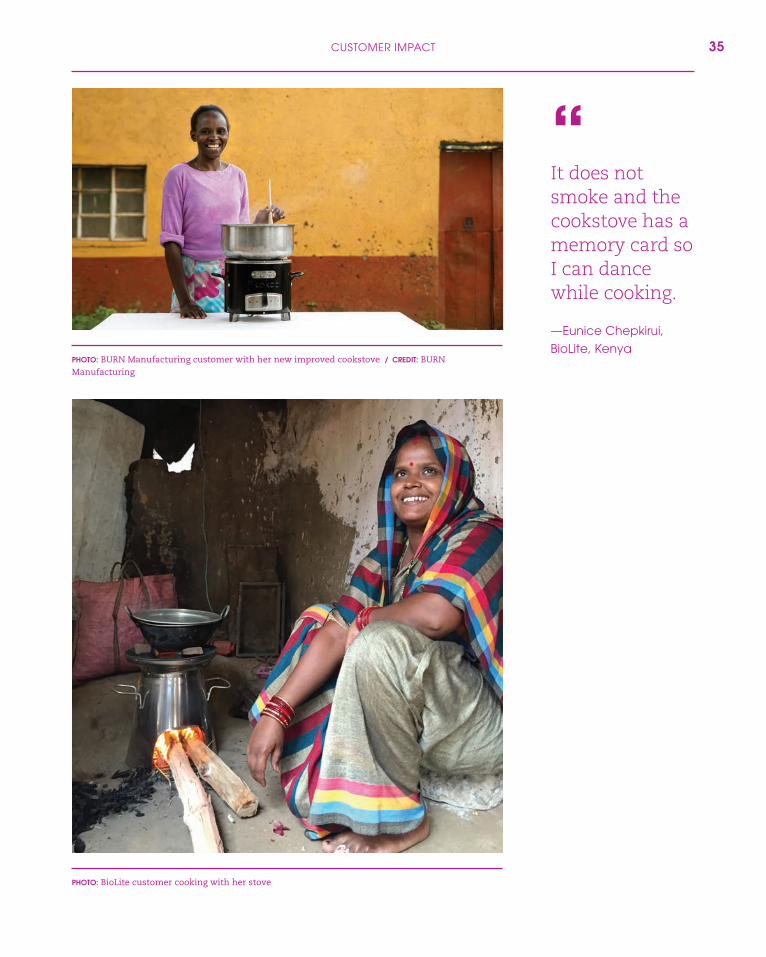
PHOTO: BioLite customer cooking with her stove
PHOTO: BURN Manufacturing customer with her new improved cookstove / CREDIT: BURN Manufacturing
“It does not smoke and the cookstove has a memory card so I can dance while cooking.
—Eunice Chepkirui,
BioLite, Kenya
35CUSTOMER IMPACT
It’s easy to see why improved cookstoves have been exciting in the fight to end energy poverty. Nearly three billion people cook using solid fuels like wood, charcoal, or crop waste on open fires or traditional stoves. Inefficient cooking produces high levels of household air pollution that contain a range of health-damaging pollutants such as fine particles and carbon monoxide. According to the World Health Organization, 4.3 million people die every year due to household air pollution, which is more than die of HIV and AIDS, tuberculosis, and malaria combined.
However, making the transition to an improved cookstove or fuel source presents a complex behavioral challenge. The ways people cook are closely connected to culture, ritual, and identity, and many improved cookstoves don’t meet all of customers’ cooking needs.
This is proven by our data that show that 69 percent of customers “stack” their product—meaning that they buy an improved cookstove while still using other cooking methods. Worse, nearly one-fifth (17 percent) of customers aren’t using their cookstoves after just three or four months. That’s a surprising outcome
for a supposedly improved product, and it’s reflected in negative customer feedback about the product’s size and its inability to cook specific foods, and requests for other features that would drive continued usage.
The indicator we are watching most closely for our cookstove companies is reduction in stacking and overall product acceptance. This is the prerequisite for stove sales to translate to reduced household air pollution, savings, and less pressures to cut down trees for firewood.
The good news is that one of our companies has achieved that ultimate goal of cutting out virtually all use of old, dirty and inefficient stoves: that company sees just three percent of its customers continuing to use other stoves alongside their new one. This suggests that, while by no means easy or certain, with the right product and marketing, cookstove companies can achieve transformative impact. When we see a positive outlier like this, we work to understand the product and business model so that we can share these lessons more broadly across our portfolio— all to create greater impact.
COOKSTOVES: A DEEPER LOOK
36
CASE STUDY
ENERGY IMPACT REPORT | ACUMEN 2017
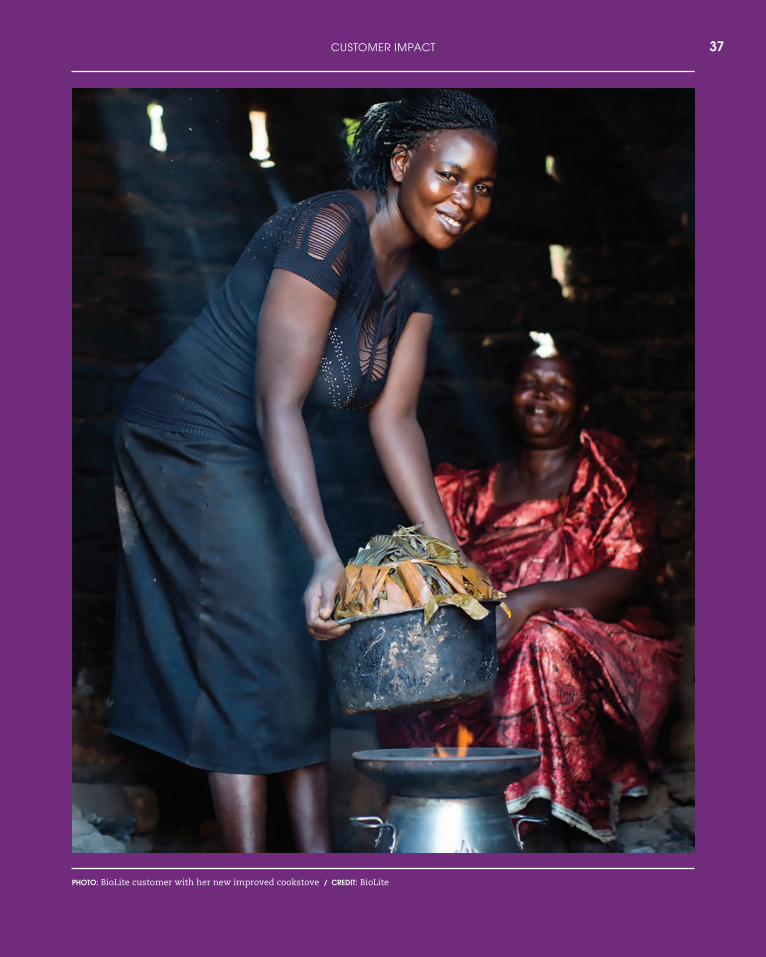
PHOTO: BioLite customer with her new improved cookstove / CREDIT: BioLite
37CUSTOMER IMPACT
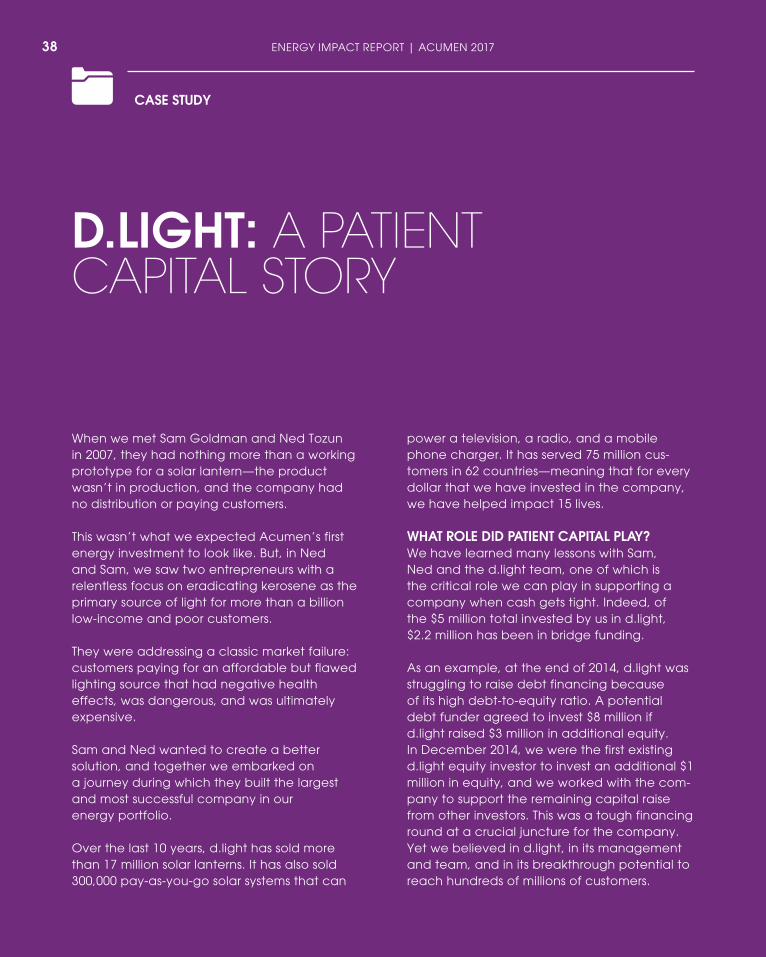
When we met Sam Goldman and Ned Tozun in 2007, they had nothing more than a working prototype for a solar lantern—the product wasn’t in production, and the company had no distribution or paying customers.
This wasn’t what we expected Acumen’s first energy investment to look like. But, in Ned and Sam, we saw two entrepreneurs with a relentless focus on eradicating kerosene as the primary source of light for more than a billion low-income and poor customers.
They were addressing a classic market failure: customers paying for an affordable but flawed lighting source that had negative health effects, was dangerous, and was ultimately expensive.
Sam and Ned wanted to create a better solution, and together we embarked on a journey during which they built the largest and most successful company in our energy portfolio.
Over the last 10 years, d.light has sold more than 17 million solar lanterns. It has also sold 300,000 pay-as-you-go solar systems that can
power a television, a radio, and a mobile phone charger. It has served 75 million cus-tomers in 62 countries—meaning that for every dollar that we have invested in the company, we have helped impact 15 lives.
WHAT ROLE DID PATIENT CAPITAL PLAY?We have learned many lessons with Sam, Ned and the d.light team, one of which is the critical role we can play in supporting a company when cash gets tight. Indeed, of the $5 million total invested by us in d.light, $2.2 million has been in bridge funding.
As an example, at the end of 2014, d.light was struggling to raise debt financing because of its high debt-to-equity ratio. A potential debt funder agreed to invest $8 million if d.light raised $3 million in additional equity. In December 2014, we were the first existing d.light equity investor to invest an additional $1 million in equity, and we worked with the com-pany to support the remaining capital raise from other investors. This was a tough financing round at a crucial juncture for the company. Yet we believed in d.light, in its management and team, and in its breakthrough potential to reach hundreds of millions of customers.
D.LIGHT: A PATIENT CAPITAL STORY
38
CASE STUDY
ENERGY IMPACT REPORT | ACUMEN 2017
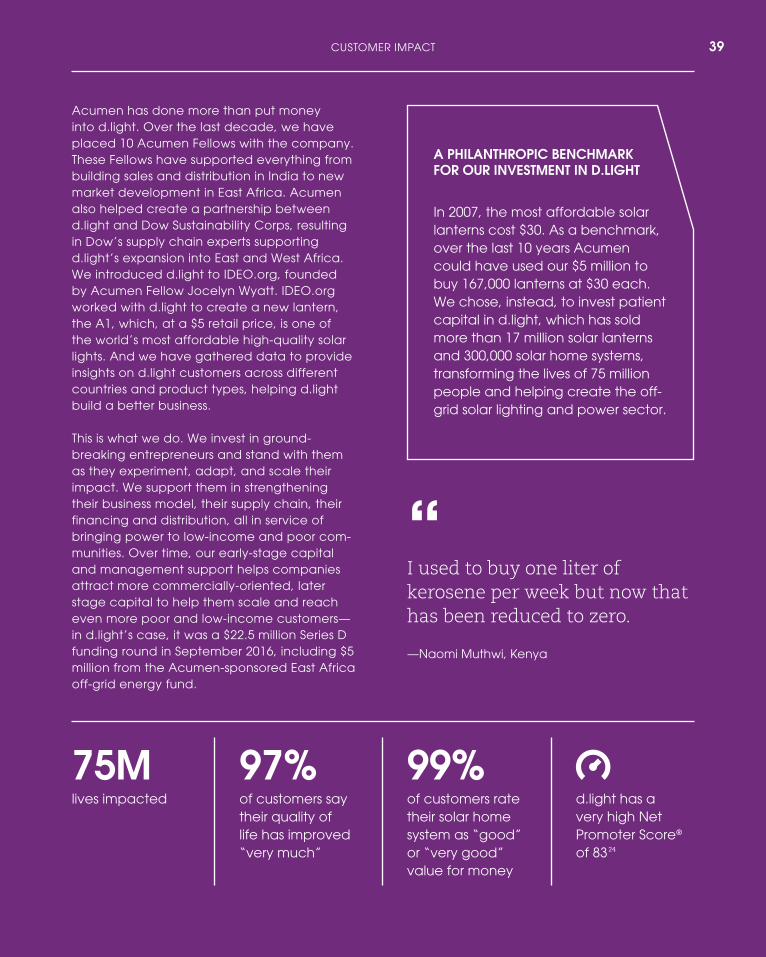
Acumen has done more than put money into d.light. Over the last decade, we have placed 10 Acumen Fellows with the company. These Fellows have supported everything from building sales and distribution in India to new market development in East Africa. Acumen also helped create a partnership between d.light and Dow Sustainability Corps, resulting in Dow’s supply chain experts supporting d.light’s expansion into East and West Africa. We introduced d.light to IDEO.org, founded by Acumen Fellow Jocelyn Wyatt. IDEO.org worked with d.light to create a new lantern, the A1, which, at a $5 retail price, is one of the world’s most affordable high-quality solar lights. And we have gathered data to provide insights on d.light customers across different countries and product types, helping d.light build a better business.
This is what we do. We invest in ground- breaking entrepreneurs and stand with them as they experiment, adapt, and scale their impact. We support them in strengthening their business model, their supply chain, their financing and distribution, all in service of bringing power to low-income and poor com-munities. Over time, our early-stage capital and management support helps companies attract more commercially-oriented, later stage capital to help them scale and reach even more poor and low-income customers—in d.light’s case, it was a $22.5 million Series D funding round in September 2016, including $5 million from the Acumen-sponsored East Africa off-grid energy fund.
A PHILANTHROPIC BENCHMARK FOR OUR INVESTMENT IN D.LIGHT
In 2007, the most affordable solar lanterns cost $30. As a benchmark, over the last 10 years Acumen could have used our $5 million to buy 167,000 lanterns at $30 each. We chose, instead, to invest patient capital in d.light, which has sold more than 17 million solar lanterns and 300,000 solar home systems, transforming the lives of 75 million people and helping create the off-grid solar lighting and power sector.
97%of customers say their quality of life has improved “very much”
75Mlives impacted
99%of customers rate their solar home system as “good” or “very good” value for money
d.light has a very high Net Promoter Score® of 8324
“I used to buy one liter of kerosene per week but now that has been reduced to zero.
—Naomi Muthwi, Kenya
39CUSTOMER IMPACT
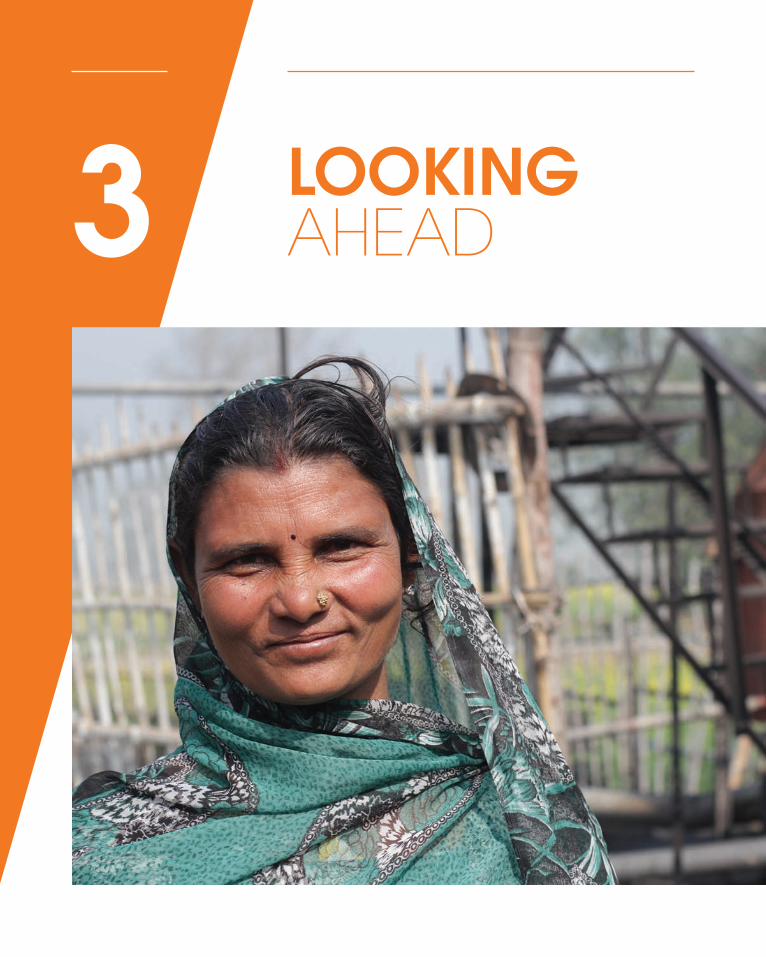
3 LOOKING AHEAD
Entrepreneurial energy companies, backed by patient capital, have made huge strides in creating a healthier, cleaner, more inclusive world. We know that, if done right, our investments will help contribute to achieving universal energy access by 2030, the United Nations Sustainable Development Goal 7.
Over the next five years, the following themes will guide our strategy:
1. A BIG BET ON SOLAR Of all the energy sources in which we have invested since 2007, solar has come out as the clear winner for providing decentralized renewable energy for low-income households. It is cost-effective, experiencing a global surge in demand that is fueling investment in technological improvements, and can be decentralized to a household level for lanterns, home systems and mini-grids in a way that many other energy sources cannot. Solar startups
will be well-positioned to take advantage of continual drops in both panel and battery prices and improvements in technology over the coming years, and they will be the primary focus of our energy investments going forward.25
2. PRODUCTIVE USEEnergy has the potential to spark increases in productivity, income generation, and access to information, but only if it provides enough power and flexibility for the devices people use for lighting a shop, cooking, farming, or even refrigeration.
Overall, 31 percent of our lighting and power customers use their purchase for some sort of productive purpose.26 However, there is an outlier: 92 percent of customers for one of our mini-grid companies are using energy for commercial purposes. This company has built its model around commercial clients who use the connection for their businesses, buying larger amounts of power for shops, small hotels, restaurants, and bars. With these anchors in place, the company has
more space to extend services to residential customers. These data are driving our ongoing interest in these companies, even though mini-grid business models are less proven than solar home system companies.
In addition to mini-grids, we continue to look for ways to create solar home solutions that provide more power at lower price points to support income generation. Finally, we are pushing beyond traditional energy production companies in search of opportu-nities that directly link power and productivity and optimize devices that people use, like solar water irrigation pumps and solar for cold storage.
3. AFFORDABILITY AND OVER-INDEBTEDNESSWe are proud that our companies are providing low-income and poor customers with high-quality off-grid energy products. However, we’ve also seen that, even with reductions in solar prices and the availability of pay-as-you-go financing, the initial down payments and ongoing financing costs of these systems can still be too high for lower-income fami-lies. This means that the demand for solar could lead to over-in-debtedness for some families, a potentially negative impact that could mirror some of the problems faced by microfinance lenders.
The good news is that we are gathering household spending information through Lean Data, and working with our companies to analyze spending patterns to protect against this risk. Based on
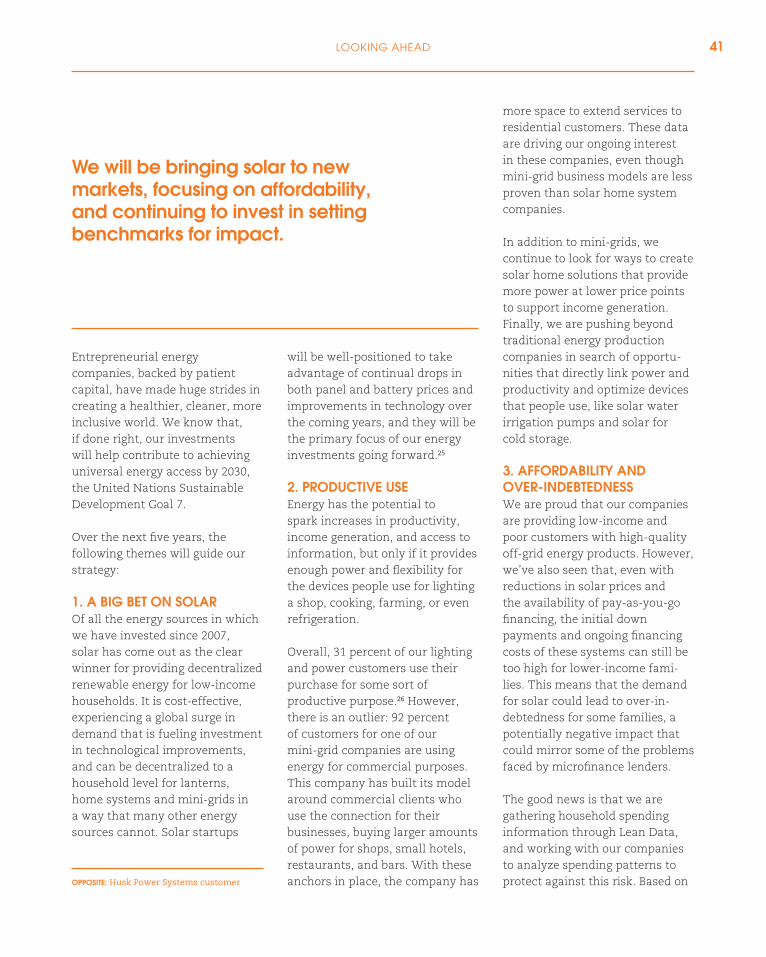
We will be bringing solar to new markets, focusing on affordability, and continuing to invest in setting benchmarks for impact.
OPPOSITE: Husk Power Systems customer
41LOOKING AHEAD

0
10 Billion
20 Billion
30 Billion
40 Billion
50 Billion
200M
Investment/year needed to meet 2030 universal energy access goals
Current annual global investment in energy access
Current annual global investment in off-grid energy
19.4B
45B
batch of high-growth solar home system companies—we need to continue to build the off-grid energy ecosystem. This means supporting business model inno-vation for mini-grid companies; finding and developing enabling technologies like smart metering solutions; and building a more robust financing ecosystem, both to support the working capital needs of our companies at an affordable cost and to lower financing costs to customers. All of this work must be grounded in ongoing conversation with customers to understand impact, so we can identify compa-nies that best meet their short- and long-term energy needs.
towards the development and rollout of energy solutions that make the most difference in customers’ lives.
5. OFF-GRID ENERGY AS A DESTINATIONTen years ago, the conventional wisdom was that a connection to the central electrical grid was the destination for every person on the planet. However, much like cellphones, we believe that off-grid solar has the potential to leapfrog the infrastructure-heavy power grid.
To build this out, we need to do much more than invest in the next
the data, we are working with our companies to develop new financ-ing solutions, including products with lower up-front deposits and longer payment plans, as well as flexible payment solutions that mirror the seasonality of income for many poorer customers. We are also focusing on product affordability and longevity, so customers might someday have years of worry- and payment-free solar power at their disposal.
4. BENCHMARKING IMPACT AND CONTINUING TO LEARNEnergy is the first sector in which, thanks to Lean Data, we have customer-based benchmarks of impact performance. This will be the foundation for our future impact measurement work in energy and beyond.
For the first time, we can differ-entiate between a high- and a low-performing company in terms of impact, and we will now be able to see how shifts in business models and product and financing characteristics result in changes in customers’ experiences and well-being.
As we continue to share these benchmarks, we will support further adoption of Lean Data tools amongst our peers, so the sector as a whole can learn faster using data grounded in customers’ lived experiences. Our hope is that this will lead to more capital going to the highest-impact businesses, more appetite on the part of investors to look at both social and financial results when rating their own performance, and, ultimately, a faster path
GAP IN INVESTMENTS NEEDED TO MEET 2030 UNIVERSAL ENERGY ACCESS GOALS
42 ENERGY IMPACT REPORT | ACUMEN 2017
It is only by building the full ecosystem that we will achieve our shared goal of having efficient, affordable, clean power meet the
full energy needs of the one billion customers still living off the grid, and the many more living with inadequate grid access.
LOOKING AHEADWe are proud of the progress we have made in off-grid energy over the last decade, the impact our companies have created for 81 million customers, and our catalytic role in building this sector. But our work is far from done.
We know there is momentum to build on, but the need is still enormous. It’s estimated that $45 billion in annual investment is required to meet the 2030 Sustainable Development Goal of universal electrification, yet the current pace of investment is just $19.4 billion per year. Worse, total financing for the off-grid decentralized energy sector totals just $200 million annually.27
We will continue to do our part to meet these important, audacious goals. We will continue to invest in companies, business models,
and ultimately, industries that will scale to transform the lives of hundreds of millions of custom-ers. Over time, we hope to show
the world that off-grid energy is a viable and less capital-intensive way to bring light, power, and improved cooking to millions.
In service of these goals, we’ve recently launched two new initiatives—one backed by philanthropic, pioneer capital, and the other backed by investment capital. Together, we believe these two initiatives will help us serve an additional 23 million poor and low-income customers over the next 10-15 years, and to work in Rwanda and Kenya to showcase examples of fully-developed off-grid energy ecosystems.
Our Pioneer Energy Investment Initiative (PEII) is a $20 million philanthropically-backed effort that will bring modern energy to under-penetrated markets in East and West Africa and parts of South Asia and Latin America and invest in new technologies and business models. The PEII seeks to impact eight million lives over the next 10 years by investing in solar home system companies in under-served markets; new innovations
It’s estimated that $45 billion in annual investment is required to meet the 2030 Sustainable Development Goal of universal electrification.
to boost energy access and use (technologies like energy-efficient appliances, solar applications in farming, and consumer financing mechanisms); and solar or hybrid mini-grid companies, which we believe have tremendous potential but for which there is no proven, viable, large-scale business model.
The second initiative, a fund sponsored by Acumen focused on Rwanda and Kenya, currently has $50 million in funding and will grow to $75-$100 million in invested capital. It is making larger, later-stage growth invest-ments in off-grid energy compa-nies with the aim of impacting 15 million lives over the next 15 years. Ultimately, we hope this fund can prove the viability of solar as a long-term solution to a significant portion of these countries’ power needs.
With these two initiatives, we are recommitting to using patient capital to build new markets and solutions, to vigorously stand by our mission of serving poor and low-income customers, and to keep sharing what we learn through Lean Data as part of our contribution to the evolution of the sector.
To all the funders, entrepreneurs, teams, Acumen Fellows, and, most of all, the customers who teach us so much every day, we thank you for coming on this journey with us, and we look forward to another decade of transformative impact.
43LOOKING AHEAD
9. Empowering Bihar by Gayle Boyle. Greenpeace India Society, October 2010. http://www.greenpeace.org/india/Global/india/report/Empowering-Bihar.pdf
10. Improved cookstoves are designed to reduce the fuel consumption per meal and to curb smoke emissions from open fires inside dwellings.
11. Customers reached can be calculated using units sold and a simple household size multiplier.
12. Companies included in full benchmark: ARED, Arnergy, Azimuth, BBOXX, BioLite, BURN, d.light, Devergy, Frontier Markets, Futurepump, Green Energy Biofuels, Greenway Grameen, Husk Power Systems, KopaGas, Nizam Bijili, Oolu Solar, Orb Energy, Pawame, PEG, SolarNow, SunCulture; Countries covered: Ghana, Haiti, India, Kenya, Nigeria, Pakistan, Rwanda, Senegal, Sierra Leone, Tanzania, Uganda.
13. The Global Off-Grid Lighting Association (GOGLA) is a neutral, independent, not-for-profit association created to promote lighting solutions that benefit society and businesses in developing and emerging markets. GOGLA acts as the industry advocate and supports the industry in growing and strengthening the market for clean, quality off-grid lighting and electrical systems. The Global Alliance For Clean Cookstoves is a public-private initiative to save lives, improve livelihoods, empower women, and protect the environment by creating a thriving global market for clean and efficient household cooking solutions.
14. For this report, we use the Acumen portfolio benchmark, which is the average performance of the 14 Acumen companies in the Lean Data Energy Project. In addition to running Lean Data projects with our own portfolio annually, we continue to run Lean Data projects with other organizations, and will incorporate their impact data into our database and benchmark. This growing data set will provide us with an increasingly comprehensive view of impact performance for different business models, geographies, products and technologies, and will enable us to learn more over time as we include new and different dimensions of impact.
15. International poverty levels are measured using Purchasing Power Parity (PPP). PPP is an economic theory that compares different countries’ currencies through a market “basket of goods” approach. According to this concept, two currencies are at par when a market basket of goods (taking into account the exchange rate) is priced the same in
APPENDIX
ENDNOTES
1. Based on the World Bank poverty lines, we define poor as people living on less than $3.10 per day, and low-income as people living on between $3.10 and $6 per day.
2. The Economic Impact of Solar Lighting: Results from a randomized field experiment in rural Kenya by Adina Rom, Isabel Gunther, Kat Harrison. ETH Zurich, Acumen, SolarAid, and Google, February 2017. https://acumen.org/wp-content/uploads/2017/09/Report-The-Economic-Impact-of-Solar-Lighting.pdf
3. World Health Organization: http://www.who.int/indoorair/guidelines/hhfc/Review_9.pdf
4. Accelerating access to electricity in Africa with off-grid solar: The impact of solar household solutions by Kat Harrison, Andrew Scott, and Ryan Hogarth. ODI, GOGLA, Practical Action SolarAid, January 2016. https://www.odi.org/sites/odi.org.uk/files/odi-assets/publications-opinion-files/10229.pdf
5. World Health Organization: http://www.who.int/mediacentre/factsheets/fs292/en/
6. World Bank: http://www.worldbank.org/en/topic/energy/overview
7. Solar home systems are standalone systems that use solar panels to harness energy from the sun to power homes and small businesses. Depending on their size, they can power anything from a few light bulbs and a radio to televisions; mini-grids are community level power generation systems; solar water pumps are pumps that run on solar power.
8. Please note that these numbers are estimates based on Lean Data results.
44 ENERGY IMPACT REPORT | ACUMEN 2017
both countries. This useful tool, maintained by the World Bank, allows us to get a sense of whether we are reaching the poorest people across the companies and countries in which we invest. Although this concept is highly useful to help compare like to like, collecting this kind of income data has challenges. The poorest often have variable, seasonal incomes which do not lend themselves to easy record-keeping or recollection. To gather high quality data for the poverty levels of our companies’ customers and suppliers, we use the Poverty Probability Index®. This easy-to-use survey tool uses asset and household indicators—like household size, or what the roof is made of—to estimate the likelihood that a respondent is poor or low-income.
16. An Evidence Review: How affordable is off-grid energy access in Africa? by Tom Adams and Kat Harrison. Acumen, March 2017. https://acumen.org/ wp-content/uploads/2017/07/Lean-Data-Report-Evdience-Review-On-Affordability.pdf
17. Company 3 and Company 4 are the same company in two different countries. Company 8 and Company 10 are the same company, for lighting/power and cookstoves. Company 11 and Company 15 are the same company in different countries. We don’t have spending data for Company 9 yet, which is why it is not included in the savings chart on p. 25.
18. This is an indicator that is shaped by geography. In places where there are kerosene subsidies in place, purchase and usage changes may look a little different. In addition, there has been an assumption that larger home systems replace more kerosene lamps, but this doesn’t seem to be the case. One reason for this is that solar home system or mini-grid connections offer household/ambient lighting, but lanterns are more suitable to task-lighting and/or outdoor/portable situations.
19. We collected data on the types of kerosene lamps families are using (single-wick, hurricane, pressurized). Each have different burn and emissions rates, and we were able to more accurately calculate carbon emissions averted based on actual usage in homes.
20. Some of the indicators may be descriptive rather than performance-based i.e. proportion of customers using products/services for income-generation shows us how companies may be creating opportunities for their customers, but more isn’t necessarily better than less as household-use of energy provides
well-being and other positive impact. We believe energy access is an end in itself, not just a means to an end.
21. We will continue to explore differentiated impact on women and men with Lean Data. In 2015, we developed a diagnostic tool to help companies assess how they are engaging women across their value chain—from employees to customers—and where there was room to improve. In 2017, we launched the first in a series of projects to use the diagnostic tool and work with our companies to build more inclusive businesses and communities.
22. Product stacking means that customers continue to use other sources of lighting, phone charging or cooking in addition to their purchase.
23. This doesn’t include the cost of purchasing their new cookstove, but even when we include this cost, 55 percent of families are saving money on cooking.
24. The Net Promoter Score is globally used as a gauge of customer satisfaction and loyalty. It asks customers to rate their likelihood to recommend a product/service to a friend, family member, or neighbor on a scale of 0 to 10 where 0 is least likely and 10 is most likely. The Net Promoter Score is calculated by taking the proportion of customers rating 9 to 10 out of 10 (promoters) and subtracting the proportion of customers rating 0 to 6 out of 10 (detractors).
25. We are placing lots of bets on solar, but we aren’t closed off to other energy sources and innovations. We recently approved an investment in a liquified petroleum gas distribution company, which has potential to change the way low-income customers cook.
26. The number for our cookstove companies is two percent, but this is not surprising since improved cookstoves are typically bought for personal, in-home use.
27. Energizing Finance: Scaling and Refining Finance in Countries with Large Energy Access Gaps, Sustainable Energy For All. http://www.se4all.org/sites/default/files/2017_SEforALL_FR4P.pdf
45APPENDIX
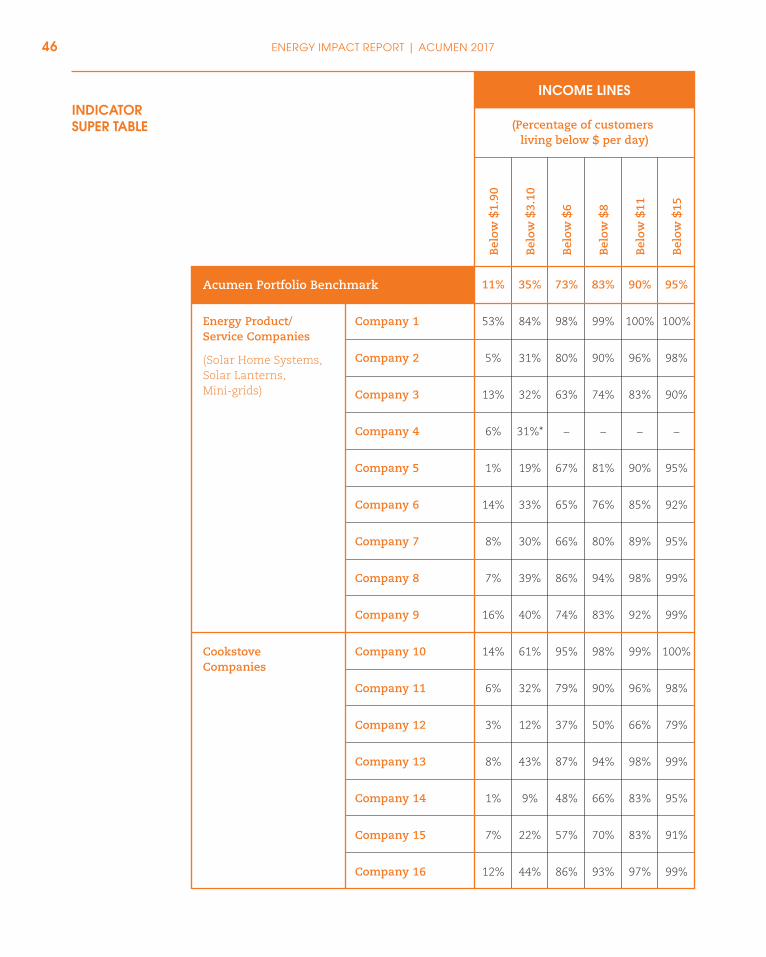
60% 74% 55% 50% 71% 83% 71% $43 64% 45% 20% -0.8 546 0.7 -7 1.2 50%
77% 78% 96% – 99% 70% 53% -$13 72% 66% 21% -0.2 172 0.4 – -0.1 84%
30% 92% 47% – 47% 87% 93% $590 30% 37% 92% -0.3 1,441 – – 2.6 38%
97% 63% 83% 67% 99% 96% 55% -$80 82% 84% 5% -1.5 776 0.9 – 1.3 61%
39% 48% -3% 72% 76% 82% 48% $22 52% 37% 5% -0.6 87 0.5 – 0.3 74%
78% 69% 79% 16% 35% 79% 89% -$331 38% 55% 21% -0.2 117 – – 0.6 59%
60% 57% 0% 8% 57% 83% 65% -$46 85% 73% 11% -1.3 532 0.8 – 0.8 40%
96% 86% 83% 70% 81% 84% 79% -$185 90% 45% 17% -2.1 1,147 0.8 – 2.9 96%
50% 82% 52% – 44% 80% 56% $41 – 4% 0% – – – -7 – 50%
21% 59% 46% 67% 56% 85% 46% $277 – 4% 2% – – – 2 – 0%
40% 50% -15% – 63% 76% – – – 33% 0% – – – – – –
67% 77% 94% 50% 98% 88% 65% – 65% 19% – – – – – – –
CUSTOMER INSIGHTS IMPACT INDICATORS
11%Acumen Portfolio Benchmark
Bel
ow $
1.90
Bel
ow $
3.10
Bel
ow $
6
Bel
ow $
8
Bel
ow $
11
35% 73% 83% 90% 95%
Company 1 53% 84% 98% 99% 100% 100%
Company 2 5% 31% 80% 90% 96% 98%
Company 3 13% 32% 63% 74% 83% 90%
Company 4 6% 31%* – – – –
Company 5 1% 19% 67% 81% 90% 95%
Company 6 14% 33% 65% 76% 85% 92%
Company 7 8% 30% 66% 80% 89% 95%
Company 10 14% 61% 95% 98% 99% 100%
Company 11 6% 32% 79% 90% 96% 98%
Company 14 1% 9% 48% 66% 83% 95%
Company 16 12% 44% 86% 93% 97% 99%
(Percentage of customers living below $ per day)
INCOME LINES
Bel
ow $
15
33% 82% 55% – 66% 74% 79% $187 38% 68% 89% 0.0 93 – – – 83%Company 8 7% 39% 86% 94% 98% 99%
96% 92% 95% – 98% 100% 83% $67 – 97% 9% – – – 7 – 11%Company 12 3% 12% 37% 50% 66% 79%
42% 88% 77% – 74% 82% 93% -$12 – 53% 2% – – – -29 0% 0%Company 13 8% 43% 87% 94% 98% 99%
Energy Product/Service Companies
(Solar Home Systems, Solar Lanterns, Mini-grids)
Imp
rove
men
t in
q
ual
ity
of l
ife
Cookstove Companies
No
chal
len
ges
exp
erie
nce
d
Net
Pro
mot
er
Sco
re®
Cu
stom
er E
ffor
t S
core
Val
ue
for
mon
ey
No
acce
ss t
o al
tern
ativ
es
Did
n’t
ow
n
tech
nol
ogy
bef
ore
Hou
seh
old
en
ergy
sa
vin
gs ($
/yea
r)
Ener
gy l
add
er
mov
emen
t
No
pro
du
ct
stac
kin
g
Use
for
in
com
e ge
ner
atio
n
Ker
osen
e la
mp
u
se c
han
ge
Hou
seh
old
CO
2e
savi
ngs
(kg/
year
)
Ch
ange
in
hou
rs
of d
aily
stu
dy
Tim
e sa
vin
gs
Incr
ease
d h
ours
of
dai
ly l
igh
t
Imp
rove
d s
afet
y (p
erce
pti
on)
80% 85% 54% – 86% 79% 89% – 83% – 14% – – – – – –Company 9 16% 40% 74% 83% 92% 99%
47% 74% 37% – 59% 89% – – – 7% – – – – – – –Company 15 7% 22% 57% 70% 83% 91%
INDICATOR SUPER TABLE
46 ENERGY IMPACT REPORT | ACUMEN 2017
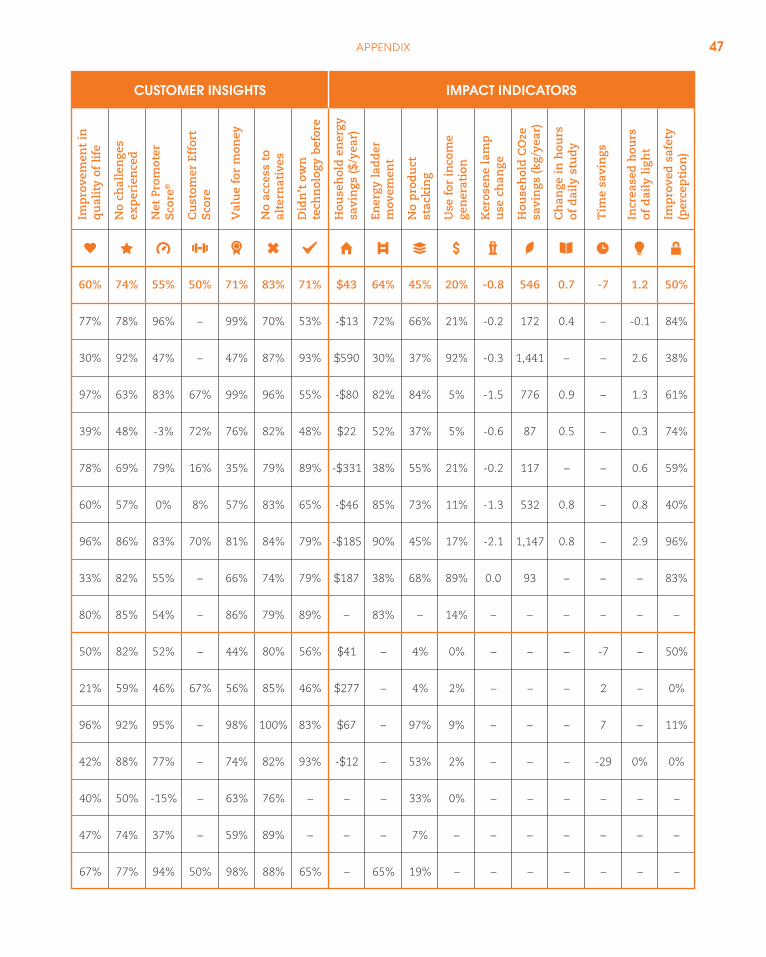
60% 74% 55% 50% 71% 83% 71% $43 64% 45% 20% -0.8 546 0.7 -7 1.2 50%
77% 78% 96% – 99% 70% 53% -$13 72% 66% 21% -0.2 172 0.4 – -0.1 84%
30% 92% 47% – 47% 87% 93% $590 30% 37% 92% -0.3 1,441 – – 2.6 38%
97% 63% 83% 67% 99% 96% 55% -$80 82% 84% 5% -1.5 776 0.9 – 1.3 61%
39% 48% -3% 72% 76% 82% 48% $22 52% 37% 5% -0.6 87 0.5 – 0.3 74%
78% 69% 79% 16% 35% 79% 89% -$331 38% 55% 21% -0.2 117 – – 0.6 59%
60% 57% 0% 8% 57% 83% 65% -$46 85% 73% 11% -1.3 532 0.8 – 0.8 40%
96% 86% 83% 70% 81% 84% 79% -$185 90% 45% 17% -2.1 1,147 0.8 – 2.9 96%
50% 82% 52% – 44% 80% 56% $41 – 4% 0% – – – -7 – 50%
21% 59% 46% 67% 56% 85% 46% $277 – 4% 2% – – – 2 – 0%
40% 50% -15% – 63% 76% – – – 33% 0% – – – – – –
67% 77% 94% 50% 98% 88% 65% – 65% 19% – – – – – – –
CUSTOMER INSIGHTS IMPACT INDICATORS
11%Acumen Portfolio Benchmark
Bel
ow $
1.90
Bel
ow $
3.10
Bel
ow $
6
Bel
ow $
8
Bel
ow $
11
35% 73% 83% 90% 95%
Company 1 53% 84% 98% 99% 100% 100%
Company 2 5% 31% 80% 90% 96% 98%
Company 3 13% 32% 63% 74% 83% 90%
Company 4 6% 31%* – – – –
Company 5 1% 19% 67% 81% 90% 95%
Company 6 14% 33% 65% 76% 85% 92%
Company 7 8% 30% 66% 80% 89% 95%
Company 10 14% 61% 95% 98% 99% 100%
Company 11 6% 32% 79% 90% 96% 98%
Company 14 1% 9% 48% 66% 83% 95%
Company 16 12% 44% 86% 93% 97% 99%
(Percentage of customers living below $ per day)
INCOME LINES
Bel
ow $
15
33% 82% 55% – 66% 74% 79% $187 38% 68% 89% 0.0 93 – – – 83%Company 8 7% 39% 86% 94% 98% 99%
96% 92% 95% – 98% 100% 83% $67 – 97% 9% – – – 7 – 11%Company 12 3% 12% 37% 50% 66% 79%
42% 88% 77% – 74% 82% 93% -$12 – 53% 2% – – – -29 0% 0%Company 13 8% 43% 87% 94% 98% 99%
Energy Product/Service Companies
(Solar Home Systems, Solar Lanterns, Mini-grids)
Imp
rove
men
t in
q
ual
ity
of l
ife
Cookstove Companies
No
chal
len
ges
exp
erie
nce
d
Net
Pro
mot
er
Sco
re®
Cu
stom
er E
ffor
t S
core
Val
ue
for
mon
ey
No
acce
ss t
o al
tern
ativ
es
Did
n’t
ow
n
tech
nol
ogy
bef
ore
Hou
seh
old
en
ergy
sa
vin
gs ($
/yea
r)
Ener
gy l
add
er
mov
emen
t
No
pro
du
ct
stac
kin
g
Use
for
in
com
e ge
ner
atio
n
Ker
osen
e la
mp
u
se c
han
ge
Hou
seh
old
CO
2e
savi
ngs
(kg/
year
)
Ch
ange
in
hou
rs
of d
aily
stu
dy
Tim
e sa
vin
gs
Incr
ease
d h
ours
of
dai
ly l
igh
t
Imp
rove
d s
afet
y (p
erce
pti
on)
80% 85% 54% – 86% 79% 89% – 83% – 14% – – – – – –Company 9 16% 40% 74% 83% 92% 99%
47% 74% 37% – 59% 89% – – – 7% – – – – – – –Company 15 7% 22% 57% 70% 83% 91%
47APPENDIX
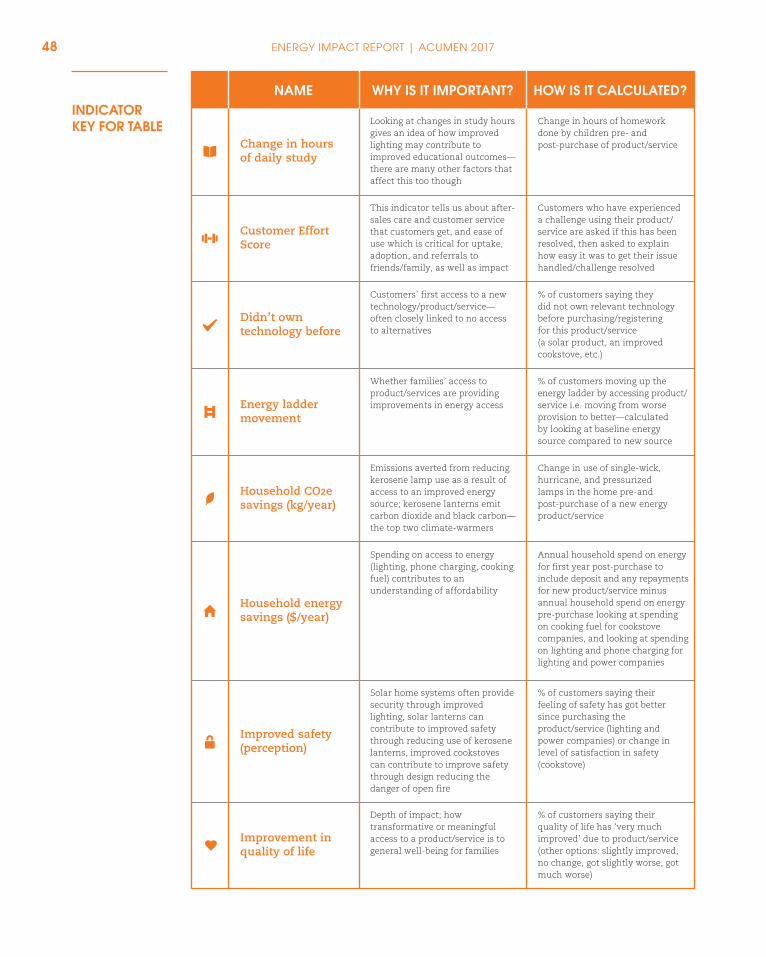
Whether the benefits of access to a product/service are deemed more valuable than the price paid
% of customers rating the product/service as good or very good value for money (other options: very poor, poor, fair)
Potential time-savings for households with access to improved cookstoves
Change in minutes taken to cook the main meal each day (cookstove only)
Products/services that meet all household energy or cooking needs often result in reduced spending and pollution
% of customers not using additional lighting or cookstoves after purchasing product/service
Where families are able to use their product/service for income-generation it may become more affordable, and also contributes to longer-term opportunities for increasing household income
% of customers using product/service for income-generating activities either in the home or at place of business
Potential changes in well-being, choice, and opportunities for family members
Change in average daily hours of light use per household (lighting and power companies only)
Reducing use of these kerosene lanterns can contribute to improved safety in the home, health benefits, and reduced pollution
Change in regular use of number of kerosene lamps in household before and after purchasing product/service
Widely used as a proxy for gauging customer loyalty and satisfaction, important for understanding customer experience and gathering feedback
% of customers rating their likelihood to recommend product/service to friends as 9 or 10 out of 10 minus % of customer rating likelihood from 0 to 6 out of 10
Availability of choice for customers and how critical the company is at providing access to products/services not available elsewhere
% of customers saying they could not easily find an alternative to the product/service
NAMENAME WHY IS IT IMPORTANT? HOW IS IT CALCULATED?
How easy a product/service is to use which affects satisfaction rates, likely referral rates, and importantly general impact
% of customers who have not experienced any challenges using their product/service (asked explicitly as yes/no question)
Depth of impact; how transformative or meaningful access to a product/service is to general well-being for families
% of customers saying their quality of life has ‘very much improved’ due to product/service (other options: slightly improved, no change, got slightly worse, got much worse)
Solar home systems often provide security through improved lighting, solar lanterns can contribute to improved safety through reducing use of kerosene lanterns, improved cookstoves can contribute to improve safety through design reducing the danger of open fire
% of customers saying their feeling of safety has got better since purchasing the product/service (lighting and power companies) or change in level of satisfaction in safety (cookstove)
Spending on access to energy (lighting, phone charging, cooking fuel) contributes to an understanding of affordability
Annual household spend on energy for first year post-purchase to include deposit and any repayments for new product/service minus annual household spend on energy pre-purchase looking at spending on cooking fuel for cookstove companies, and looking at spending on lighting and phone charging for lighting and power companies
Looking at changes in study hours gives an idea of how improved lighting may contribute to improved educational outcomes—there are many other factors that affect this too though
Change in hours of homework done by children pre- and post-purchase of product/service
Customers who have experienced a challenge using their product/service are asked if this has been resolved, then asked to explain how easy it was to get their issue handled/challenge resolved
Customers’ first access to a new technology/product/service—often closely linked to no access to alternatives
% of customers saying they did not own relevant technology before purchasing/registering for this product/service (a solar product, an improved cookstove, etc.)
Whether families’ access to product/services are providing improvements in energy access
% of customers moving up the energy ladder by accessing product/service i.e. moving from worse provision to better—calculated by looking at baseline energy source compared to new source
Improvement inquality of life
No challengesexperienced
Net PromoterScore®
Customer EffortScore
Value for money
No access toalternatives
Didn’t owntechnology before
Energy laddermovement
Use for income generation
Kerosene lampuse change
Time savings
Improved safety(perception)
NAMENAME
Change in hoursof daily study
Increased hoursof daily light
No productstacking
WHY IS IT IMPORTANT? HOW IS IT CALCULATED?
Household energy savings ($/year)
Emissions averted from reducing kerosene lamp use as a result of access to an improved energy source; kerosene lanterns emit carbon dioxide and black carbon—the top two climate-warmers
Change in use of single-wick, hurricane, and pressurized lamps in the home pre-and post-purchase of a new energy product/service
Household CO2e savings (kg/year)
This indicator tells us about after-sales care and customer service that customers get, and ease of use which is critical for uptake, adoption, and referrals to friends/family, as well as impact
INDICATOR KEY FOR TABLE
48 ENERGY IMPACT REPORT | ACUMEN 2017
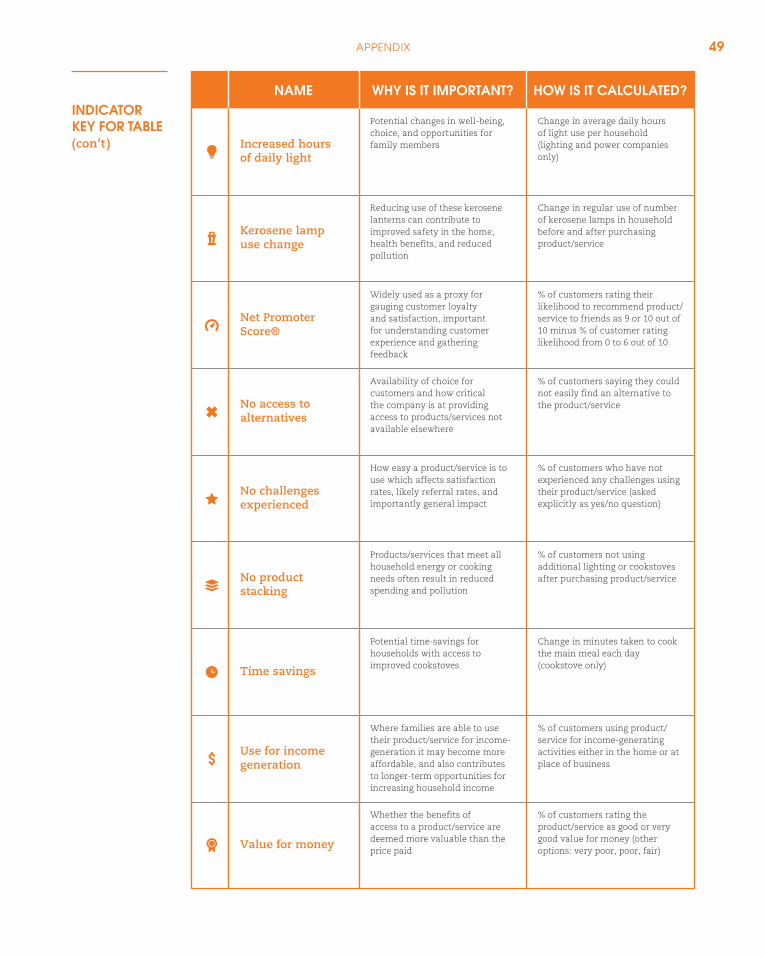
Whether the benefits of access to a product/service are deemed more valuable than the price paid
% of customers rating the product/service as good or very good value for money (other options: very poor, poor, fair)
Potential time-savings for households with access to improved cookstoves
Change in minutes taken to cook the main meal each day (cookstove only)
Products/services that meet all household energy or cooking needs often result in reduced spending and pollution
% of customers not using additional lighting or cookstoves after purchasing product/service
Where families are able to use their product/service for income-generation it may become more affordable, and also contributes to longer-term opportunities for increasing household income
% of customers using product/service for income-generating activities either in the home or at place of business
Potential changes in well-being, choice, and opportunities for family members
Change in average daily hours of light use per household (lighting and power companies only)
Reducing use of these kerosene lanterns can contribute to improved safety in the home, health benefits, and reduced pollution
Change in regular use of number of kerosene lamps in household before and after purchasing product/service
Widely used as a proxy for gauging customer loyalty and satisfaction, important for understanding customer experience and gathering feedback
% of customers rating their likelihood to recommend product/service to friends as 9 or 10 out of 10 minus % of customer rating likelihood from 0 to 6 out of 10
Availability of choice for customers and how critical the company is at providing access to products/services not available elsewhere
% of customers saying they could not easily find an alternative to the product/service
NAMENAME WHY IS IT IMPORTANT? HOW IS IT CALCULATED?
How easy a product/service is to use which affects satisfaction rates, likely referral rates, and importantly general impact
% of customers who have not experienced any challenges using their product/service (asked explicitly as yes/no question)
Depth of impact; how transformative or meaningful access to a product/service is to general well-being for families
% of customers saying their quality of life has ‘very much improved’ due to product/service (other options: slightly improved, no change, got slightly worse, got much worse)
Solar home systems often provide security through improved lighting, solar lanterns can contribute to improved safety through reducing use of kerosene lanterns, improved cookstoves can contribute to improve safety through design reducing the danger of open fire
% of customers saying their feeling of safety has got better since purchasing the product/service (lighting and power companies) or change in level of satisfaction in safety (cookstove)
Spending on access to energy (lighting, phone charging, cooking fuel) contributes to an understanding of affordability
Annual household spend on energy for first year post-purchase to include deposit and any repayments for new product/service minus annual household spend on energy pre-purchase looking at spending on cooking fuel for cookstove companies, and looking at spending on lighting and phone charging for lighting and power companies
Looking at changes in study hours gives an idea of how improved lighting may contribute to improved educational outcomes—there are many other factors that affect this too though
Change in hours of homework done by children pre- and post-purchase of product/service
Customers who have experienced a challenge using their product/service are asked if this has been resolved, then asked to explain how easy it was to get their issue handled/challenge resolved
Customers’ first access to a new technology/product/service—often closely linked to no access to alternatives
% of customers saying they did not own relevant technology before purchasing/registering for this product/service (a solar product, an improved cookstove, etc.)
Whether families’ access to product/services are providing improvements in energy access
% of customers moving up the energy ladder by accessing product/service i.e. moving from worse provision to better—calculated by looking at baseline energy source compared to new source
Improvement inquality of life
No challengesexperienced
Net PromoterScore®
Customer EffortScore
Value for money
No access toalternatives
Didn’t owntechnology before
Energy laddermovement
Use for income generation
Kerosene lampuse change
Time savings
Improved safety(perception)
NAMENAME
Change in hoursof daily study
Increased hoursof daily light
No productstacking
WHY IS IT IMPORTANT? HOW IS IT CALCULATED?
Household energy savings ($/year)
Emissions averted from reducing kerosene lamp use as a result of access to an improved energy source; kerosene lanterns emit carbon dioxide and black carbon—the top two climate-warmers
Change in use of single-wick, hurricane, and pressurized lamps in the home pre-and post-purchase of a new energy product/service
Household CO2e savings (kg/year)
This indicator tells us about after-sales care and customer service that customers get, and ease of use which is critical for uptake, adoption, and referrals to friends/family, as well as impact
INDICATOR KEY FOR TABLE(con’t )
49APPENDIX
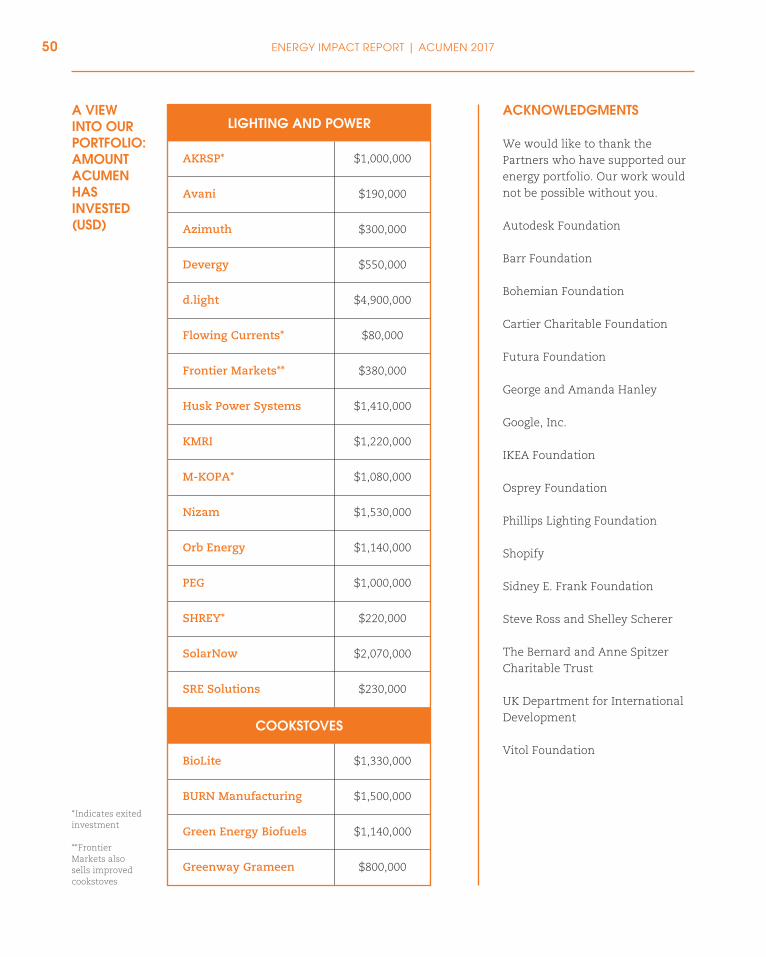
LIGHTING AND POWER
COOKSTOVES
d.light $4,900,000
Nizam $1,530,000
M-KOPA* $1,080,000
Orb Energy $1,140,000
SolarNow $2,070,000
SRE Solutions $230,000
AKRSP* $1,000,000
Avani $190,000
KMRI $1,220,000
Husk Power Systems $1,410,000
SHREY* $220,000
Frontier Markets** $380,000
Flowing Currents* $80,000
PEG $1,000,000
BioLite $1,330,000
BURN Manufacturing $1,500,000
Greenway Grameen $800,000
Green Energy Biofuels $1,140,000
*Indicates exited investment
**Frontier Markets also sells improved cookstoves
Devergy $550,000
Azimuth $300,000
ACKNOWLEDGMENTS
We would like to thank the Partners who have supported our energy portfolio. Our work would not be possible without you.
Autodesk Foundation
Barr Foundation
Bohemian Foundation
Cartier Charitable Foundation
Futura Foundation
George and Amanda Hanley
Google, Inc.
IKEA Foundation
Osprey Foundation
Phillips Lighting Foundation
Shopify
Sidney E. Frank Foundation
Steve Ross and Shelley Scherer
The Bernard and Anne Spitzer Charitable Trust
UK Department for International Development
Vitol Foundation
A VIEW INTO OUR PORTFOLIO:AMOUNT ACUMEN HAS INVESTED (USD)
50 ENERGY IMPACT REPORT | ACUMEN 2017
ACUMENFUND
@ACUMEN
@ACUMENORG ACUMEN.ORG