energy from the wind - switch€¦ · some of its radiant energy (light) reaches the earth’s...
TRANSCRIPT

Energy From the WindStudent Guide
INTERMEDIATE
2013-2014

2 EnergyFromtheWind
The Beaufort ScaleAt the age of 12, Francis Beaufort joined the British Royal Navy For more than twenty years he sailed the oceans and studied the wind, which was the main power source for the navy’s fleet. In 1805, he created a scale to rate the power of the wind based on observations of common things around him rather than instruments.
The Beaufort Scale ranks winds from 0–12 based on how strong they are, with each wind given a name from calm to hurricane. The Beaufort Scale can be used to estimate the speed of the wind.
WindWind is moving air. You cannot see air, but it is all around you. You cannot see the wind, but you know it is there.
You hear leaves rustling in the trees. You see clouds moving across the sky. You feel cool breezes on your skin. You witness the destruction caused by strong winds such as tornadoes and hurricanes. Wind has energy.
Wind resources can be found across the country. Science and technology are providing more tools to accurately predict when and where the wind will blow. This information is allowing people to use wind on small and large scales. Wind is an increasingly important part of the United States’ energy portfolio.
Introduction to Wind
Faster than 9.5 m/s (faster than 21.3 mph)7.6 to 9.4 m/s (17 to 21.2 mph)5.6 to 7.5 m/s (12.5 to 16.9 mph)0 to 5.5 m/s (0 to 12.4 mph)
Data: National Renewable Energy Laboratory
Average Wind Speed at 80 Meters Altitude
BEAUFORT SCALE OF WIND SPEED
BEAUFORT NUMBER NAME OF WIND LAND CONDITIONS WIND SPEED (MPH)
0 Calm Smoke rises vertically Less than 1
1 Light airDirection of wind shown by smoke drift but not by wind vanes
1 - 3
2 Light breezeWind felt on face, leaves rustle, ordinary wind vane moved by wind
4 - 7
3 Gentle breezeLeaves and small twigs in constant motion, wind extends light flag
8 - 12
4 Moderate breezeWind raises dust and loose paper, small branches move
13 - 18
5 Fresh breeze Small trees in leaf start to sway 19- 24
6 Strong breezeLarge branches in motion, whistling in telegraph wires, umbrellas used with difficulty
25 - 31
7 Near galeWhole trees in motion, inconvenient to walk against wind
32 - 38
8 Gale Twigs break from trees, difficult to walk 39 - 46
9 Strong galeSlight structural damage occurs, slates removed from roof
47 - 54
10 StormTrees uprooted, considerable structural damage occurs
55 - 63
11 Violent storm Widespread damage 64 - 7212 Hurricane Widespread damage Greater than 72
Source: National Oceanic and Atmospheric Administration
©2013TheNEEDProjectP.O.Box10101,Manassas,VA201081.800.875.5029www.NEED.org 3
Wind FormationThe energy in wind comes from the sun. When the sun shines, some of its radiant energy (light) reaches the Earth’s surface. The Earth near the Equator receives more of the sun’s energy than the North and South Poles.
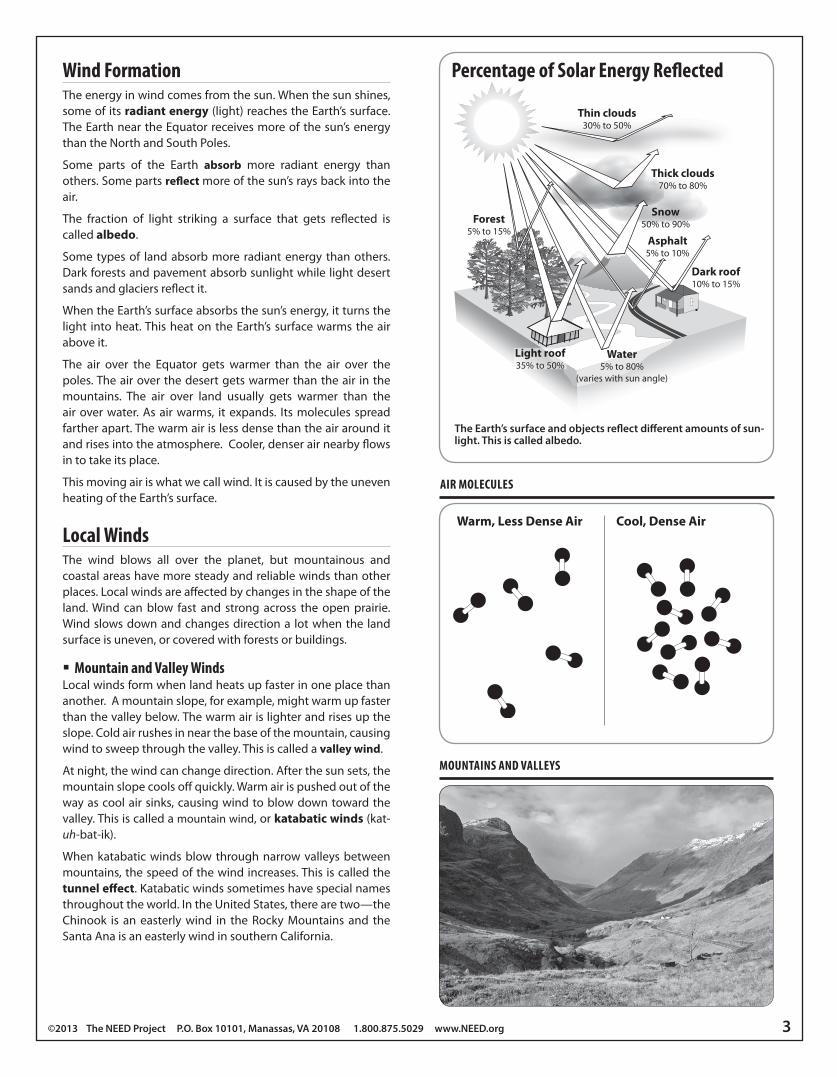
Some parts of the Earth absorb more radiant energy than others. Some parts reflect more of the sun’s rays back into the air.
The fraction of light striking a surface that gets reflected is called albedo.
Some types of land absorb more radiant energy than others. Dark forests and pavement absorb sunlight while light desert sands and glaciers reflect it.
When the Earth’s surface absorbs the sun’s energy, it turns the light into heat. This heat on the Earth’s surface warms the air above it.
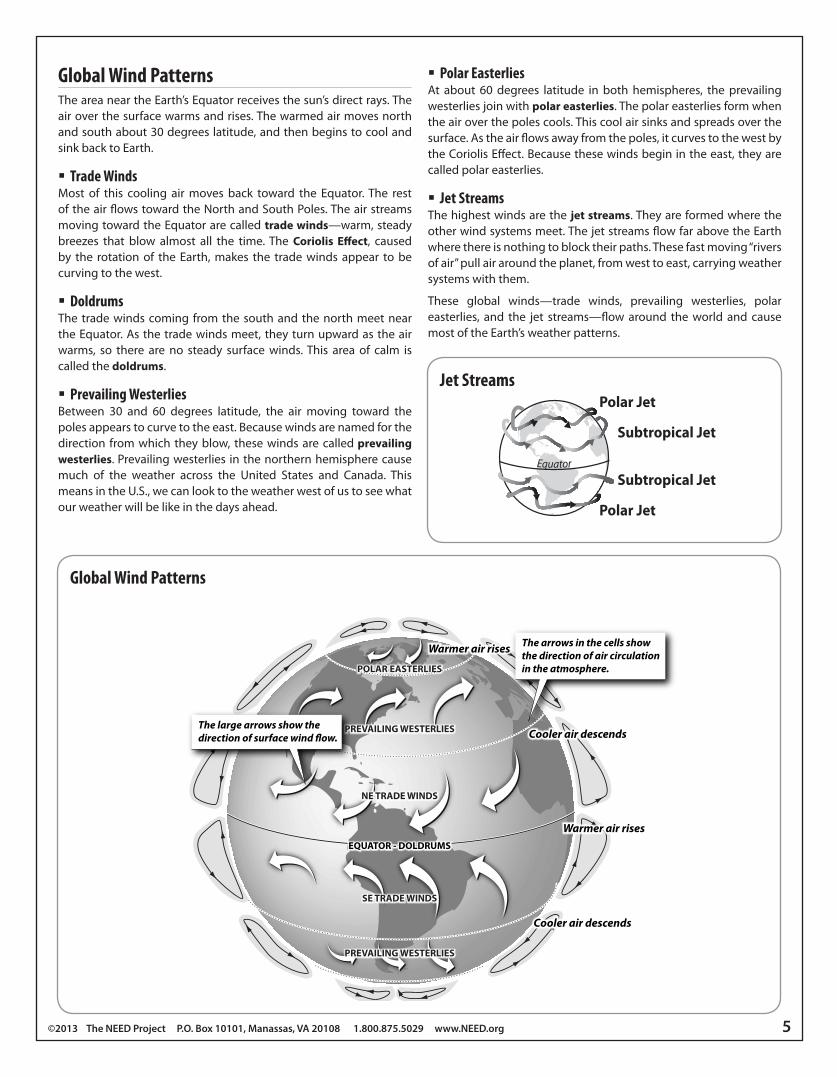
The air over the Equator gets warmer than the air over the poles. The air over the desert gets warmer than the air in the mountains. The air over land usually gets warmer than the air over water. As air warms, it expands. Its molecules spread farther apart. The warm air is less dense than the air around it and rises into the atmosphere. Cooler, denser air nearby flows in to take its place.
This moving air is what we call wind. It is caused by the uneven heating of the Earth’s surface.
Local WindsThe wind blows all over the planet, but mountainous and coastal areas have more steady and reliable winds than other places. Local winds are affected by changes in the shape of the land. Wind can blow fast and strong across the open prairie. Wind slows down and changes direction a lot when the land surface is uneven, or covered with forests or buildings.
Mountain and Valley WindsLocal winds form when land heats up faster in one place than another. A mountain slope, for example, might warm up faster than the valley below. The warm air is lighter and rises up the slope. Cold air rushes in near the base of the mountain, causing wind to sweep through the valley. This is called a valley wind.
At night, the wind can change direction. After the sun sets, the mountain slope cools off quickly. Warm air is pushed out of the way as cool air sinks, causing wind to blow down toward the valley. This is called a mountain wind, or katabatic winds (kat-uh-bat-ik).
When katabatic winds blow through narrow valleys between mountains, the speed of the wind increases. This is called the tunnel effect. Katabatic winds sometimes have special names throughout the world. In the United States, there are two—the Chinook is an easterly wind in the Rocky Mountains and the Santa Ana is an easterly wind in southern California.
MOUNTAINS AND VALLEyS
Forest5% to 15%
Water5% to 80%
(varies with sun angle)
Light roof35% to 50%
Dark roof10% to 15%
Asphalt5% to 10%
Thick clouds70% to 80%
Thin clouds30% to 50%
Snow50% to 90%
Albedo
TheEarth’ssurfaceandobjectsreflectdifferentamountsofsun-light.Thisiscalledalbedo.
Warm, Less Dense Air Cool, Dense Air
Percentage of Solar Energy Reflected
AIR MOLECULES

4 EnergyFromtheWind
Sea and Land BreezesDuring the day, the sun heats both land and water, but not to the same temperature. It takes more energy to heat water than it does land because they have different properties. When the sun shines, the land heats faster than the water. Land also gives up its heat faster than the water at night when the sun is not shining.
Since land changes temperature faster than water, during the day the air above land gets warmer than the air above water. The heated air above land rises, creating an area of low pressure. The air above the water is cooler, creating an area of higher pressure. The cooler air over the water moves to the area of low pressure over land. This is called a sea breeze because the breeze is coming from the sea.
At night, the land gives up its heat and cools more rapidly than water, which means the sea is now warmer than the shore. The air over the water becomes warmer than the air over the land. The warm, rising sea air creates an area of low pressure, and the cooler air above land creates an area of higher pressure. The air moves from higher to lower pressure, from the land to the water. This breeze is called a land breeze.
Land Breeze
Sea Breeze
©2013TheNEEDProjectP.O.Box10101,Manassas,VA201081.800.875.5029www.NEED.org 5
The large arrows show the direction of surface wind ow.
The arrows in the cells show the direction of air circulation in the atmosphere.
Warmer air rises
Cooler air descends
Cooler air descends
Warmer air rises
POLAR EASTERLIES
PREVAILING WESTERLIES
NE TRADE WINDS
PREVAILING WESTERLIES
SE TRADE WINDS
EQUATOR - DOLDRUMS
Global Wind PatternsThe area near the Earth’s Equator receives the sun’s direct rays. The air over the surface warms and rises. The warmed air moves north and south about 30 degrees latitude, and then begins to cool and sink back to Earth.
Trade WindsMost of this cooling air moves back toward the Equator. The rest of the air flows toward the North and South Poles. The air streams moving toward the Equator are called trade winds—warm, steady breezes that blow almost all the time. The Coriolis Effect, caused by the rotation of the Earth, makes the trade winds appear to be curving to the west.
DoldrumsThe trade winds coming from the south and the north meet near the Equator. As the trade winds meet, they turn upward as the air warms, so there are no steady surface winds. This area of calm is called the doldrums.
Prevailing WesterliesBetween 30 and 60 degrees latitude, the air moving toward the poles appears to curve to the east. Because winds are named for the direction from which they blow, these winds are called prevailing westerlies. Prevailing westerlies in the northern hemisphere cause much of the weather across the United States and Canada. This means in the U.S., we can look to the weather west of us to see what our weather will be like in the days ahead.
Polar EasterliesAt about 60 degrees latitude in both hemispheres, the prevailing westerlies join with polar easterlies. The polar easterlies form when the air over the poles cools. This cool air sinks and spreads over the surface. As the air flows away from the poles, it curves to the west by the Coriolis Effect. Because these winds begin in the east, they are called polar easterlies.
Jet StreamsThe highest winds are the jet streams. They are formed where the other wind systems meet. The jet streams flow far above the Earth where there is nothing to block their paths. These fast moving “rivers of air” pull air around the planet, from west to east, carrying weather systems with them.
These global winds—trade winds, prevailing westerlies, polar easterlies, and the jet streams—flow around the world and cause most of the Earth’s weather patterns.
Equator
Polar Jet
Polar Jet
Subtropical Jet
Subtropical Jet
Jet Streams
Global Wind Patterns

6 EnergyFromtheWind
Measuring Wind Direction and Speed Wind Direction
A weather vane, or wind vane, is used to show the direction of the wind. A wind vane points toward the source of the wind. Some locations, such as airports, use windsocks to show the direction in which the wind is blowing.
Wind direction is reported as the direction from which the wind blows, not the direction toward which the wind moves. A north wind blows from the north toward the south.
Wind SpeedIt is important in many cases to know how fast the wind is blowing. Wind speed can be measured using an instrument called a wind gauge, or anemometer.
One type of anemometer is a device with three arms that spin on top of a shaft. Each arm has a cup on its end. The cups catch the wind and spin the shaft. The harder the wind blows, the faster the shaft spins.
A device inside the anemometer counts the number of spins per minute and converts that figure into miles per hour or meters per second. A display attached to the anemometer shows the speed of the wind.
Wind Turbines yesterday and TodayThe earliest European windmills, built in the 1200s, were called postmills. They were built of wood and designed to grind grain between millstones. This is how windmills got their name. The entire body of the mill could be rotated when the direction of the wind changed. It was the miller’s job to rotate the body, or postmill, as it was called.
Between 1300 and the late 1500s, smockmills were invented. Sails were attached to the cap—or top—of the windmill and only the cap rotated. The miller still had to rotate the cap when the wind changed directions. These mills were bigger, heavier, and stronger since the building didn’t move.
In the 1500s, tower windmills were built in Spain, Greece, and the Mediterranean Islands. Tower windmills were small and made out of stone. They had many small sails that worked well in the lighter winds of southern Europe. They were used to pump water and grind grain.
In the 1600s, the Dutch began to use drainage windmills to pump water. The windmills dried out flooded land below sea level, doubling the size of the country.
In addition to grinding grain, windmills in the 1700s were used to grind cocoa, gunpowder, and mustard. Hulling mills removed the outer layer of rice and barley kernels. Oil mills pressed oil from seeds. Glue mills processed cowhides and animal bones. Fulling mills pounded wool into felt. Paint mills ground pigments for paint as well as herbs and chemicals for medicines and poisons.
Windmills were used for other work, too. Miners used windmills to blow fresh air into deep mine shafts. Windmills provided power to run sawmills and paper mills. Sawmills cut logs and paper mills made paper.
WIND VANE ANEMOMETER
POSTMILL
TOWER WINDMILL
SMOCkMILL
DRAINAGE WINDMILL

©2013TheNEEDProjectP.O.Box10101,Manassas,VA201081.800.875.5029www.NEED.org 7
Windmills in AmericaAs Europeans came to America in the mid-1600s, they brought with them their windmill designs. Windmills were a common sight in the colonies. American colonists used windmills to grind corn and wheat, as well as to cut wood at sawmills.
By the 1800s, settlers began to explore the West. Much of the land was too dry for farming. A new style of windmill was invented that pumped water.
In 1854, Daniel Halladay, a mechanic from Connecticut, invented the first windmill designed specifically for life in the West. The Halladay Windmill sat on a tall wooden tower. It had more than 12 thin wooden blades and turned itself into the wind. This windmill was less powerful than the old European ones. It was built to pump water, not grind grain. It really wasn’t a windmill at all, since it did not mill (grind) anything. Everyone called it a windmill anyway.
As the West was settled, railroads were built across the Great Plains. The steam locomotives burned coal for fuel. They needed lots of water to make the steam that ran the engines. Windmills were used to pump water into the locomotives at railroad stations.
Farmers built homemade windmills or purchased them from traveling salesmen. These windmills provided enough water for homes and small vegetable gardens. Ranchers used windmills to pump water for their livestock to drink.
In addition to pumping water, windmills in the American West were used to saw lumber, run cotton gins, hoist grain into silos, grind cattle feed, shell corn, crush ore, and even run printing presses.
In late 1888, Charles Brush finished building the country’s first wind turbine on his farm in Ohio. The turbine was 60 feet tall and weighed 80,000 pounds. With 144 blades, the rotor had a diameter of 17 meters. The shaft inside the tower turned pulleys and belts that ran the generator he had also built. Brush’s turbine generated 12 kilowatts of electricity, enough to light 350 incandescent lamps, two arc lights, and three electric motors.
While Brush showed that wind energy could be used to generate electricity, the idea did not take hold. In the 1900s, large power plants were built that burned coal and oil. Dams were built across rivers to make electricity from the energy in moving water. Power lines were built across America. People no longer needed individual wind turbines for electricity.
The idea of using wind to make electricity almost disappeared. Then, in the 1970s, oil prices skyrocketed and people became interested in wind energy as a source for producing electricity once again.
HALLADAy WINDMILL
BRUSH WIND TURBINE

8 EnergyFromtheWind
EnergyeWhat is Energy?Wind is an energy source, but what exactly is energy? Energy makes change; it does things for us. We use energy to move cars along the road and boats over the water. We use energy to bake a cake in the oven and keep ice frozen in the freezer. We need energy to light our homes and keep them a comfortable temperature. Energy helps our bodies grow and allows our minds to think. Scientists define energy as the ability to do work.
Energy is found in different forms such as light, heat, motion, sound, and electricity. There are many forms of energy, but they can all be put into two general categories: potential and kinetic.
Potential Energy Potential energy is stored energy and the energy of position. There are several forms of potential energy, including:
Chemical energy is energy that is stored in the bonds of atoms and molecules that holds these particles together. Biomass, petroleum, natural gas, and propane are examples of stored chemical energy.
Nuclear energy is energy stored in the nucleus of an atom. The energy can be released when the nuclei are combined (fusion) or split apart (fission). In both fission and fusion, mass is converted into energy.
Stored mechanical energy is energy stored in objects by the application of a force. Compressed springs and stretched rubber bands are examples of stored mechanical energy.
Gravitational potential energy is the energy of position or place. A rock resting at the top of a hill contains gravitational potential energy. Hydropower, such as water in a reservoir behind a dam, is an example of gravitational potential energy.
HILL
KineticEnergy
PotentialEnergy
Potential and Kinetic Energy
Chemical Motion
Radiant Chemical
Chemical Motion
Electrical Heat
Energy Transformations
kinetic EnergyKinetic energy is motion—the motion of waves, electrons, atoms, molecules, substances, and objects. There are several forms of kinetic energy, including:
Radiant energy is electromagnetic energy that travels in transverse waves. Radiant energy includes visible light, x-rays, gamma rays, and radio waves. Light is one type of radiant energy. Solar energy is an example of radiant energy.
Thermal energy, or heat, is the internal energy in substances—the vibration and movement of atoms and molecules within substances. The faster molecules and atoms vibrate and move within substances, the more energy they possess and the hotter they become. Geothermal energy is an example of thermal energy.
Motion energy is the movement of objects and substances from one place to another. Objects and substances move when a force is applied according to Newton’s Laws of Motion. Wind is an example of motion energy.
Sound energy is the movement of energy through substances in longitudinal (compression/rarefaction) waves. Sound is produced when a force causes an object or substance to vibrate and the energy is transferred through the substance in a wave. Echoes and music are examples of sound energy.
Electrical energy is the movement of electrons. Lightning and electricity are examples of electrical energy.
Conservation of EnergyConservation of energy can mean more than saving energy. The Law of Conservation of Energy says that energy is neither created nor destroyed. When we use energy, it doesn’t disappear. We simply change it from one form of energy into another. A car engine burns gasoline, converting the chemical energy in gasoline into motion energy. Solar cells change radiant energy into electrical energy. Energy changes form, but the total amount of energy in the universe stays the same, or is conserved.Potential and kinetic Energy

©2013TheNEEDProjectP.O.Box10101,Manassas,VA201081.800.875.5029www.NEED.org 9
Energy EfficiencyEnergy efficiency is the amount of useful energy you get out of a system compared to the energy input. A perfect, energy-efficient machine would change all the energy put in it into useful work—an impossible dream. Converting one form of energy into another form always involves a loss of usable energy, often as waste heat, or thermal energy.
Most energy transformations are not very efficient. The human body is a good example. Your body is like a machine, and the fuel for your machine is food. Food gives you the energy to move, breathe, and think. Your body is very inefficient at converting food into useful work. Most energy in your body is released as heat.
Sources of EnergyWe use many different sources to meet our energy needs every day. They are usually classified into two groups—renewable and nonrenewable.
Wind is energy in motion—kinetic energy—and it is a renewable energy source. Along with wind, renewable energy sources include biomass, geothermal energy, hydropower, and solar energy. They are called renewable sources because they are replenished in a short time. Day after day, the sun shines, the wind blows, and the rivers flow. Renewable sources only make up eight percent of the United States’ energy portfolio. We mainly use renewable energy sources to make electricity.
In the United States, almost 91 percent of our energy comes from nonrenewable sources. Coal, petroleum, natural gas, propane, and uranium are nonrenewable energy sources. They are used to make electricity, heat our homes, move our cars, and manufacture all kinds of products. They are called nonrenewable because their supplies are limited. Petroleum, for example, was formed hundreds of millions of years ago from the remains of ancient sea plants and animals. We cannot make more crude oil in a short time.
Data: Energy Information AdministrationNOTE: Sum of renewable and non-renewable energy consumption do not equal 100% due to independent rounding.
BIOMASS 4.5%Uses: heating, electricity,transportation
HYDROPOWER 3.3%Uses: electricity
NATURAL GAS 25.6%Uses: heating,manufacturing, electricity
PETROLEUM 34.7%Uses: transportation,manufacturing
PROPANE 1.6%Uses: heating,manufacturing
URANIUM 8.5%Uses: electricity
WIND 1.2%Uses: electricity
SOLAR 0.2%Uses: heating, electricity
Nonrenewable Sources
Nonrenewable Energy Sources and Percentage of Total Energy Consumption
Renewable Sources
Renewable Energy Sources and Percentage of Total Energy Consumption
90.6%9.4%
10% 20% 30% 40% 50% 60% 70% 80% 90% 100%0%PERCENTAGE OF UNITED STATES ENERGY USE
U.S. Consumption of Energy by Source, 2011
COAL 20.2%Uses: electricity,manufacturing
GEOTHERMAL 0.2%Uses: heating, electricity

10 EnergyFromtheWind
Electricity is a secondary energy source. We use primary energy sources, including coal, natural gas, petroleum, uranium, solar, wind, biomass, and hydropower, to convert motion energy to electrical energy. In the United States, coal generates 42.2 percent of our electricity. In 1989, wind contributed less than one tenth of a percent to U.S. electricity. Wind still represents a small fraction of electricity generation at 2.9 percent, however, wind generation increased 28 percent from 2009 to 2010. At the same time, electricity generation from coal increased by only 5.4 percent. Between 2010 and 2011, wind increased another 26%, while coal decreased by 6 percent. Wind’s two-year growth is over 60%, and could be an indictaion that wind could play an even bigger role in electricity generation.
Most people do not usually think of how electricity is generated. We cannot see electricity like we see the sun. We cannot hold it like we hold coal. We know when it is working, but it is hard to know exactly what it is. Before we can understand electricity, we need to learn about atoms.
AtomsEverything is made of atoms—every star, every tree, every animal, every person. The air and water are, too. Atoms are the building blocks of the universe. They are very, very tiny particles. Millions of atoms would fit on the head of a pin.
One model of an atom looks like the sun with the planets spinning around it. The center is called the nucleus. It is made of tiny protons and neutrons. Electrons move around the nucleus in clouds, or energy levels.
Electrons stay in their levels because an electric force holds them there. Protons and electrons are attracted to each other. We say protons have a positive charge (+) and the electrons have a negative charge (-). Opposite charges attract each other.
Electricity is Moving ElectronsThe electrons near the nucleus are held tight to the atom. Sometimes, the ones farthest away are not. We can push some of these electrons out of their levels. We can move them. Moving electrons is called electricity.
Electricity
PROTON
NEUTRONNUCLEUS
ELECTRON
Atom
Coal
Natural Gas
Uranium
Hydropower
Biomass
Wind
Geothermal
Solar
RENEWABLE
NONRENEWABLE
Petroleum
U.S. Electricity Net Generation, 201142.2%
24.8%
19.2%
7.8%
1.4%
2.9%
0.4%
<0.1%
0.7%
Data: Energy Information Administration
Other 0.5%
*Other: non-biogenic waste, fossil fuel gasses
Parts of an Atom
OUTER ENERGY LEVEL
Carbon AtomA carbon atom has six protons and six neutrons in the nucleus, two electrons in the inner energy level, and four electrons in the outer energy level.
INNER ENERGY LEVEL
PROTONS (+)
ELECTRONS (–)
NEUTRONS
NUCLEUS

©2013TheNEEDProjectP.O.Box10101,Manassas,VA201081.800.875.5029www.NEED.org 11
MagnetsIn most objects, all the atoms are in balance. Half of the electrons spin in one direction; half spin in the other direction. They are spaced randomly in the object.
Magnets are different. In magnets, the atoms are arranged so that the electrons are not in balance. The electrons do not move from one end to the other to find a balance. This creates a force of energy, called a magnetic field, around a magnet. We call one end of the magnet the north (N) pole and the other end the south (S) pole. The force of the magnetic field flows from the north pole to the south pole.
Have you ever held two magnets close to each other? They do not act like most objects. If you try to push the two north poles together, they repel each other. If you try to push the two south poles together, they repel each other.
Turn one magnet around and the north and the south poles attract. The magnets stick to each other with a strong force. Just like protons and electrons, opposites attract.
ElectromagnetismWe can use magnets to make electricity. A magnetic field can pull and push electrons to make them move. Some metals, like copper, have electrons that are loosely held. They are easily pushed from their levels. This is the reason copper is often used for wiring.
Magnetism and electricity are related. Magnets can create electricity and electricity can produce magnetic fields. Every time a magnetic field changes, an electric field is created. Every time an electric field changes, a magnetic field is created. Magnetism and electricity are always linked together; you cannot have one without the other. This phenomenon is called electromagnetism.
Like PolesLike poles of magnets (N-N or S-S) repel each other.
Opposite PolesOpposite poles of magnets (N-S) attract each other.
Bar Magnet
N S
Horseshoe Magnet

12 EnergyFromtheWind
GeneratorsA generator is a device that transforms kinetic energy—the energy of motion—into electricity. Power plants use generators with magnets and coils of copper wire to produce electricity.
Inside a generator is a turbine. A turbine is a machine that uses a flow of energy to turn blades attached to a shaft.
There are also magnets and coils of copper wire inside the generator. The magnets and coils can be designed in two ways—the turbine can spin the magnets inside the coils or it can spin coils inside the magnets. Either way, the electrons in the wire are moved by the magnetic field.
In the diagram on the right, coils of copper wire are attached to the turbine shaft. The shaft spins the coils of wire inside two magnets. The magnet on one side has its north pole to the front. The magnet on the other side has its south pole to the front.
The magnetic fields around these magnets push and pull the electrons in the copper wire as the wire spins. The electrons in the coil flow into transmission lines. These moving electrons are the electricity that flows to our houses.
Power plants use turbine generators to make the electricity we use in our homes and businesses. Power plants use many fuels to spin a turbine. They can burn coal, oil, or natural gas to make steam to spin a turbine. Or, they can split atoms of uranium to heat water into steam to spin a turbine. They can also use the power of rushing water from a dam or the energy in the wind to spin a turbine.
Transformersteps up voltagefor transmission
Neighborhood transformer
steps down voltage
Transmission line carries electricity long distances
on power towers
Transformer on polesteps down voltage
before entering house
Distribution linecarries electricity
to house
Transporting Wind Electricity
Wind generateselectricity
TO TRANSMISSION LINES
TURBINE
DIRECTION OF ELECTRIC CURRENT
Spinning Coil of Wire
TURBINE SPINS SHAFT
MAGNETM
AGNE
T
SouthPole
NorthPole
Turbine Generator
ImagecourtesyofSiemens
Transporting Wind Energy
TURBINE GENERATOR

©2013TheNEEDProjectP.O.Box10101,Manassas,VA201081.800.875.5029www.NEED.org 13
Wind Can Produce ElectricityWhen the wind blows, it pushes against the blades of the wind turbine, making them spin. They power a generator to produce electricity. Most turbines have the same basic parts: blades, shafts, gears, a generator, and a cable. (Some small turbines do not have gear boxes.) These parts work together to convert the wind’s energy into electricity.
1. The wind blows and pushes against the blades on top of the tower, making them spin.
2. The turbine blades are connected to a low-speed shaft. When the blades spin, the shaft turns. The shaft is connected to a gear box. The gears in the gear box increase the speed of the spinning motion on a high-speed shaft.
3. The high-speed shaft is connected to a generator. As the shaft turns inside the generator, it produces electricity.
4. The electricity is sent through a cable down the turbine tower to a transformer and then to a transmission line.
The amount of electricity a turbine produces depends on its size and the speed of the wind. Wind turbines come in many different sizes. A small turbine may help to power one home. Very large wind turbines can produce enough electricity to power up to 1,000 homes. Large turbines are sometimes grouped together to provide power to the electric grid. The grid is the network of power lines connected together across the entire country.
Wind FarmsWind power plants, or wind farms, are clusters of wind turbines grouped together to produce large amounts of electricity. These wind farms are usually not owned by public utilities like most coal and nuclear power plants are. Private companies own most wind farms and sell the electricity to utility companies.
Choosing the location of a wind farm is known as siting a wind farm. The wind speed and direction must be studied to determine where to put the turbines. As a rule, wind speed increases with height, and over open areas with no windbreaks—objects that decrease the force of the wind.
Turbines are usually built in rows facing into the prevailing wind. Placing turbines too far apart wastes space. However, if turbines are too close together, they block each other’s wind.
The site must have strong, steady winds. Experts measure the winds in an area for one to three years before choosing a site. The best sites for wind farms are on hilltops, on the open plains, through mountain passes, and near the coasts of oceans or large lakes. There are other things to think about when siting a wind farm, such as:
Whatistheweatherlike?Aretheretornadoes,hurricanes,oricestormsinthearea?Any of these may damage the wind turbines and other equipment.
Canworkersreachthearea?Donewroadsneedtobebuilt?It is very expensive to build new roads.
Canthesitebeconnectedtoexistingpowerlines? It is expensive to build power lines to get electricity to where people live.
Willthewindfarmimpactwildlifeinthearea? Wind farms cannot be built near large populations of birds or in areas where there are en-dangered species.
Wind and Electricity
WIND FARM
ImagecourtesyofNRELLandaroundawindfarmcancontinuetobeusedforgrowingcropsorgrazingforanimals.
Low-speed shaftRotor HubGear box
High-speed shaft
Generator
Low-spRotor Hub
GeGeGeneneraatot r
Blade
Blade Nacelle
Wind Turbine Diagram
Tower
14 EnergyFromtheWind
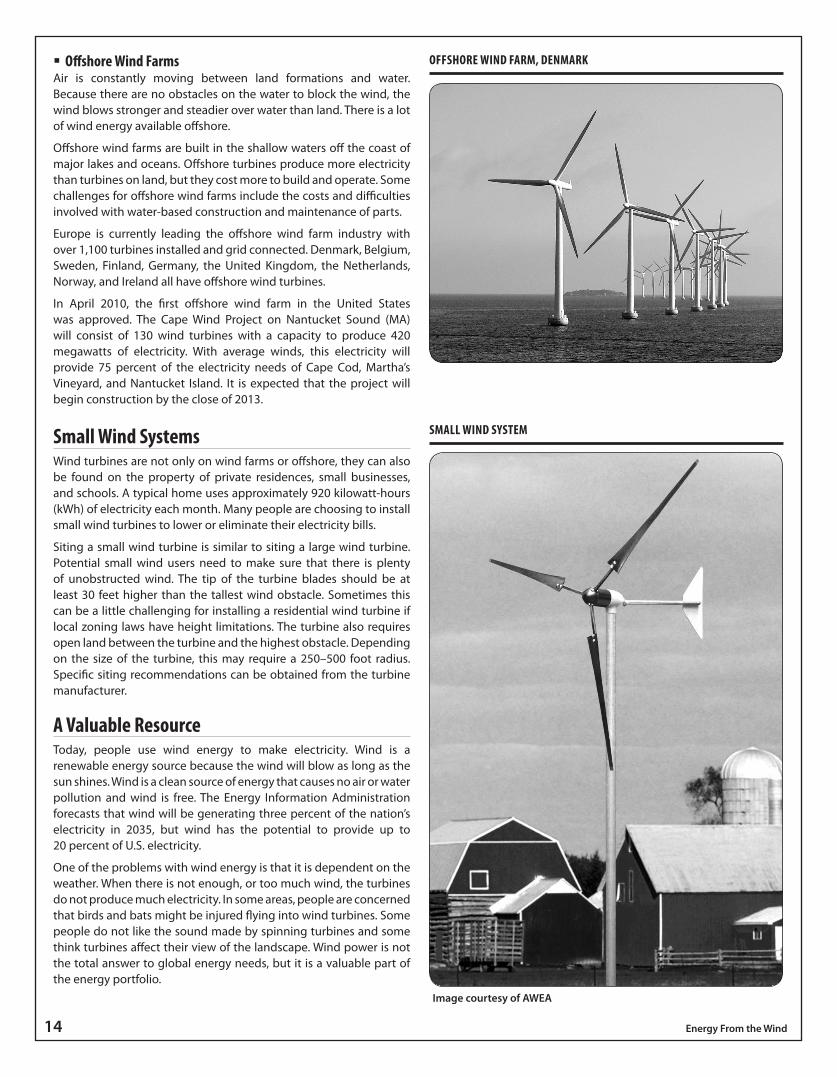
Offshore Wind FarmsAir is constantly moving between land formations and water. Because there are no obstacles on the water to block the wind, the wind blows stronger and steadier over water than land. There is a lot of wind energy available offshore.
Offshore wind farms are built in the shallow waters off the coast of major lakes and oceans. Offshore turbines produce more electricity than turbines on land, but they cost more to build and operate. Some challenges for offshore wind farms include the costs and difficulties involved with water-based construction and maintenance of parts.
Europe is currently leading the offshore wind farm industry with over 1,100 turbines installed and grid connected. Denmark, Belgium, Sweden, Finland, Germany, the United Kingdom, the Netherlands, Norway, and Ireland all have offshore wind turbines.
In April 2010, the first offshore wind farm in the United States was approved. The Cape Wind Project on Nantucket Sound (MA) will consist of 130 wind turbines with a capacity to produce 420 megawatts of electricity. With average winds, this electricity will provide 75 percent of the electricity needs of Cape Cod, Martha’s Vineyard, and Nantucket Island. It is expected that the project will begin construction by the close of 2013.
Small Wind SystemsWind turbines are not only on wind farms or offshore, they can also be found on the property of private residences, small businesses, and schools. A typical home uses approximately 920 kilowatt-hours (kWh) of electricity each month. Many people are choosing to install small wind turbines to lower or eliminate their electricity bills.
Siting a small wind turbine is similar to siting a large wind turbine. Potential small wind users need to make sure that there is plenty of unobstructed wind. The tip of the turbine blades should be at least 30 feet higher than the tallest wind obstacle. Sometimes this can be a little challenging for installing a residential wind turbine if local zoning laws have height limitations. The turbine also requires open land between the turbine and the highest obstacle. Depending on the size of the turbine, this may require a 250–500 foot radius. Specific siting recommendations can be obtained from the turbine manufacturer.
A Valuable ResourceToday, people use wind energy to make electricity. Wind is a renewable energy source because the wind will blow as long as the sun shines. Wind is a clean source of energy that causes no air or water pollution and wind is free. The Energy Information Administration forecasts that wind will be generating three percent of the nation’s electricity in 2035, but wind has the potential to provide up to 20 percent of U.S. electricity.
One of the problems with wind energy is that it is dependent on the weather. When there is not enough, or too much wind, the turbines do not produce much electricity. In some areas, people are concerned that birds and bats might be injured flying into wind turbines. Some people do not like the sound made by spinning turbines and some think turbines affect their view of the landscape. Wind power is not the total answer to global energy needs, but it is a valuable part of the energy portfolio.
OFFSHORE WIND FARM, DENMARk
SMALL WIND SySTEM
ImagecourtesyofAWEA

©2013TheNEEDProjectP.O.Box10101,Manassas,VA201081.800.875.5029www.NEED.org 15
Aerodynamics of Wind Turbine Blades
Why Turbine Blades MoveThere are two important reasons why wind turbine blades are able to spin in the wind: Newton’s Third Law and the Bernoulli Effect.
Newton’s Third Law states that for every action, there is an equal and opposite reaction. In the case of a wind turbine blade, the action of the wind pushing air against the blade causes the reaction of the blade being deflected, or pushed. If the blade has no pitch (or angle), the blade will simply be pushed backwards (downhill). But since wind turbine blades are set at an angle, the wind is deflected at an opposite angle, pushing the blades away from the deflected wind. This phenomenon can be viewed on a simple, flat blade set at an angle. If you push the blade with your finger from the direction of the oncoming wind, the blade will deflect away from your finger.
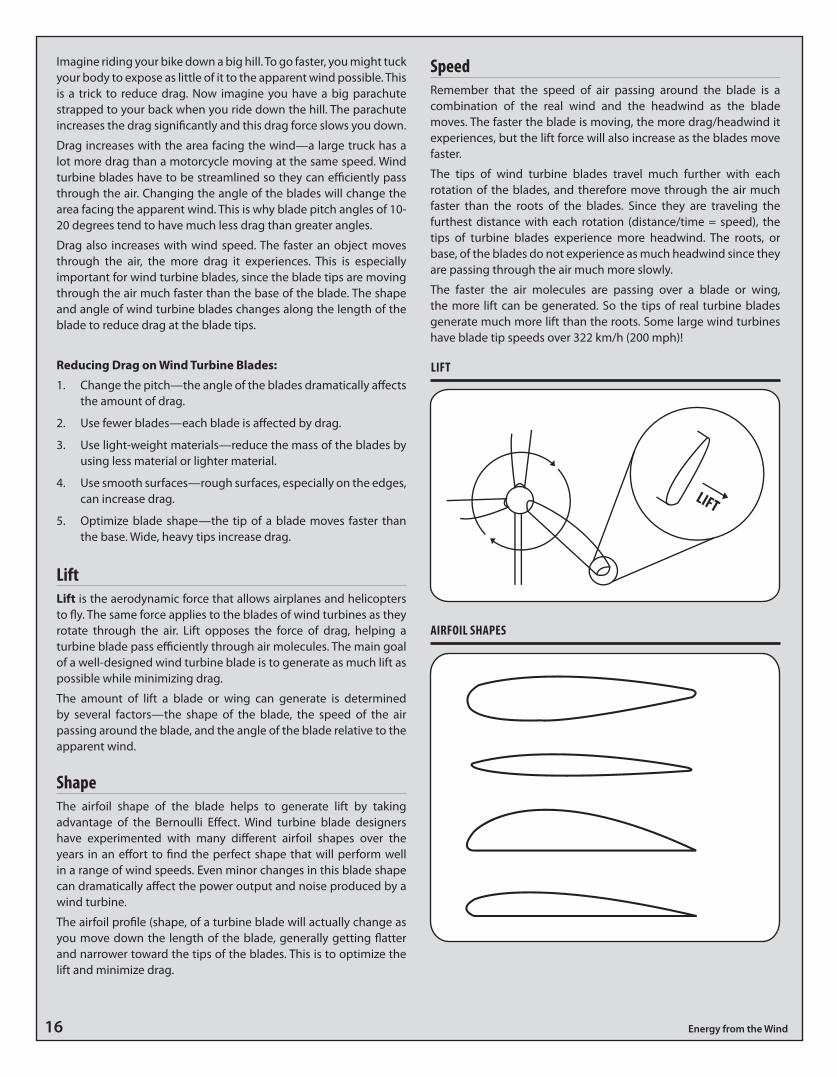
Bernoulli’s Principle tells us that faster moving air has lower pressure. Wind turbine blades are shaped so that the air molecules moving around the blade travel faster on the downwind side of the blade that those moving across the upwind side of the blade. This shape, known as an airfoil, is like an uneven teardrop. The downwind side of the blade has a large curve, while the upwind side is relatively flat. Since the air is moving faster on the curved, downwind side of the blade, there is low pressure on this side of the blade. This difference in pressure on the opposite sides of the blade causes the blade to be “lifted” towards the curve of the airfoil.
Slower air
Faster air
AIRFOIL SHAPE: A CROSS-SECTION
Understanding WindWind turbine blades must be optimized to efficiently convert oncoming winds into motion energy to rotate the main driveshaft. But when designing turbine blades, the real wind is only one part of a larger equation— good blades must also account for the apparent wind that is experienced as the blade passes through the air.
Imagine riding your bike on a day with a fresh breeze at your side. As you begin to ride and pick up speed, you feel this wind from the side, but also wind pushing back at you from the direction you are moving. When you stop riding, there is just the wind from the side again. This wind that is “created” as you are moving is known as headwind. The headwind, combined with the real wind, is known as apparent wind. A wind turbine blade experiences apparent wind as it passes through the air. This apparent wind is from a different direction than the “real” wind that has caused the blade to begin moving. Since the tips of large turbine blades may be moving through the air at speeds up to 322 km/h (200 mph), this apparent wind can be very significant!
AerodynamicsEfficient blades are a key part of generating power from a wind turbine. The efficiency of a wind turbine blade depends on the drag, lift, and torque produced by the blade. These factors are affected by the size and shape of the blades, the number of blades, and the blade pitch.
DragDrag is defined as the force on an object that resists its motion through a fluid. When the fluid is a gas such as air, the force is called aerodynamic drag, or air resistance. Drag is a force that is working against the blades, causing them to slow down. Drag is always important when an object moves rapidly through the air or water. Airplanes, race cars, rockets, submarines, and wind turbine blades are all designed to have as little drag as possible.
*Text and graphics adapted and used with permission from KidWind Project, Inc. For more information related to this topic, visit http://learn.kidwind.org
(A)
(A)
(H)
(R)
Real wind (R)+ Head wind (H)= Apparent wind (A)
APPARENT WIND
16 EnergyfromtheWind
Imagine riding your bike down a big hill. To go faster, you might tuck your body to expose as little of it to the apparent wind possible. This is a trick to reduce drag. Now imagine you have a big parachute strapped to your back when you ride down the hill. The parachute increases the drag significantly and this drag force slows you down.
Drag increases with the area facing the wind—a large truck has a lot more drag than a motorcycle moving at the same speed. Wind turbine blades have to be streamlined so they can efficiently pass through the air. Changing the angle of the blades will change the area facing the apparent wind. This is why blade pitch angles of 10-20 degrees tend to have much less drag than greater angles.
Drag also increases with wind speed. The faster an object moves through the air, the more drag it experiences. This is especially important for wind turbine blades, since the blade tips are moving through the air much faster than the base of the blade. The shape and angle of wind turbine blades changes along the length of the blade to reduce drag at the blade tips.
Reducing Drag on Wind Turbine Blades:
1. Change the pitch—the angle of the blades dramatically affects the amount of drag.
2. Use fewer blades—each blade is affected by drag.
3. Use light-weight materials—reduce the mass of the blades by using less material or lighter material.
4. Use smooth surfaces—rough surfaces, especially on the edges, can increase drag.
5. Optimize blade shape—the tip of a blade moves faster than the base. Wide, heavy tips increase drag.
LiftLift is the aerodynamic force that allows airplanes and helicopters to fly. The same force applies to the blades of wind turbines as they rotate through the air. Lift opposes the force of drag, helping a turbine blade pass efficiently through air molecules. The main goal of a well-designed wind turbine blade is to generate as much lift as possible while minimizing drag.
The amount of lift a blade or wing can generate is determined by several factors—the shape of the blade, the speed of the air passing around the blade, and the angle of the blade relative to the apparent wind.
ShapeThe airfoil shape of the blade helps to generate lift by taking advantage of the Bernoulli Effect. Wind turbine blade designers have experimented with many different airfoil shapes over the years in an effort to find the perfect shape that will perform well in a range of wind speeds. Even minor changes in this blade shape can dramatically affect the power output and noise produced by a wind turbine.
The airfoil profile (shape, of a turbine blade will actually change as you move down the length of the blade, generally getting flatter and narrower toward the tips of the blades. This is to optimize the lift and minimize drag.
SpeedRemember that the speed of air passing around the blade is a combination of the real wind and the headwind as the blade moves. The faster the blade is moving, the more drag/headwind it experiences, but the lift force will also increase as the blades move faster.
The tips of wind turbine blades travel much further with each rotation of the blades, and therefore move through the air much faster than the roots of the blades. Since they are traveling the furthest distance with each rotation (distance/time = speed), the tips of turbine blades experience more headwind. The roots, or base, of the blades do not experience as much headwind since they are passing through the air much more slowly.
The faster the air molecules are passing over a blade or wing, the more lift can be generated. So the tips of real turbine blades generate much more lift than the roots. Some large wind turbines have blade tip speeds over 322 km/h (200 mph)!
AIRFOIL SHAPES
LIFT

©2013TheNEEDProjectP.O.Box10101,Manassas,VA201081.800.875.5029www.NEED.org 17
AngleThe angle of the blades also greatly impacts how much lift is generated. On large wind turbines, the blade angle is constantly adjusted to give the blades the optimal angle into the apparent wind. The angle of the blade relative to the plane of rotation is known as the pitch angle. The angle of the blade relative to the apparent wind is called the angle of attack. The angle of attack is very important, but also complicated since it will change as the real wind changes as the real wind speed changes and the speed of the blade (headwind) changes. On most airfoil blade shapes, an angle of attack of 10-15 degrees creates the most lift with the least drag.
Real wind turbine blades typically have a twisted pitch — meaning the blade angle is steeper at the root of the blade and flatter further away from the hub. Once again this is due to the fact that the tips move so much faster through the air. By twisting the pitch, the blades are able to take advantage of a more ideal angle of attack down the length of each blade. The tips of a real turbine blade may have close to a 0 degree pitch angle, but this section of the blade generates a great deal of lift.
TorqueTorque is a force that turns or rotates something. When you use a wrench on a bolt or twist a screw loose with a screwdriver, you are generating torque. Torque is a lot like leverage. If you are trying to turn a wrench, sometimes you need a lot of leverage to loosen a tight bolt. Wind turbine blades are like big levers— but instead of your muscle turning them they use the force of the wind!
Torque is equal to the force multiplied by distance. This means that the longer your blades are, the more torque you can generate. For example, imagine someone trying to loosen a tight bolt. Pushing with all his might, he can exert 100 pounds of force. If his wrench was 1 foot long, he would be exerting 100 foot-pounds of torque. If he applied the same force to a 2 foot long wrench, he would be exerting 200 foot-pounds of torque on the bolt. This additional leverage makes it much easier to loosen the bolt.
*Text and graphics adapted and used with permission from KidWind Project, Inc. For more information related to this topic, visit http://learn.kidwind.org
MORE TORQUE
LESS TORQUE
15°
10°
5°
0°
HIGHER PITCH NEAR ROOT
LOWER PITCH NEAR TIP
BLADE PITCH
TORQUE

18 EnergyfromtheWind
Gearing Up For More PowerOn a real wind turbine, the long blades give the turbine a lot of leverage to provide power to the generator. Utility scale large turbines often have large gearboxes that increase the RPM of the rotor by 80 or 100 times. This big gear reduction demands a lot of leverage from the blades. Think about riding your bicycle—when you shift into high gear it may be harder to pedal. A higher gear demands more torque.
Power output is directly related to the speed of the spinning drive shaft (revolutions per minute or rpm) and how forcefully it turns. A large wind turbine has a rotor with blades, a gear box, and a generator. As the blades spin, the rotor rotates slowly with heavy torque. The generator has to spin much faster to generate power, but it cannot use all the turning force, or torque, that is on the main shaft. This is why a large wind turbine has a gear box.
Inside the gear box, there is at least one pair of gears, one large and one small. The large gear, attached to the main shaft, rotates at about 20 revolutions per minute with a lot of torque. This large gear spins a smaller gear, with less torque, at about 1,500 revolutions per minute. The small gear is attached to a small shaft that spins the generator at high speed, generating power. The relationship between the large and small gears is called the gear ratio. The gear ratio between a 1,500 rpm gear and a 20 rpm gear is 75:1.
Putting It All TogetherIncreasing the torque generated by the blades also often increases the drag they experience as they rotate. For example, longer blades will generate more torque and more drag. Increasing the blade pitch will generally increase the torque and increase the drag. Increasing the number of blades will generally give you more torque and more drag. For this reason, it is important to design blades to match the load application. If you are using a windmill to lift a bucket of weights, a slowly spinning rotor that generates lots of torque will be best. If you are using a turbine to light a string of LED bulbs wired in series, you will need a rotor that spins very rapidly with very little drag.
LESS TORQUEMORE TORQUE
MORE DRAG LESS DRAG

©2013TheNEEDProjectP.O.Box10101,Manassas,VA201081.800.875.5029www.NEED.org 19
Wind Energy Timeline
5000 B.C. Early Egyptians use wind to sail boats on the Nile River.
0 The Chinese fly kites during battle to signal their troops.
700s People living in Sri Lanka use wind to smelt (separate) metal from rock ore. They would dig large crescent-shaped furnaces near the top of steep mountainsides. In summer, monsoon winds blow up the mountain slopes and into a furnace to create a mini-tornado. Charcoal fires inside the furnace could reach 1200°C (2200°F). Archaeologists believe the furnaces enabled Sri Lankans to make iron and steel for weapons and farming tools.
500-900 A.D. The first windmills are developed in Persia (present day Iran). The windmills look like modern day revolving doors, enclosed on two sides to increase the tunnel effect. These windmills grind grain and pump water.
1200s Europeans begin to build windmills to grind grain.
1200s The Mongolian armies of Genghis Khan capture Persian windmill builders and take them to China to build irrigation windmills. Persian-style windmills are built in the Middle East. In Egypt, windmills grind sugar cane. Europeans built the first postmills out of wood.
1300s The Dutch invent the smockmill. The smockmill consists of a wooden tower with six or eight sides. The roof on top rotates to keep the sails in the wind.
1500s The tower windmill is developed in Spain, Greece, southern Europe, and France.
1600s The Dutch began to use drainage windmills to pump water. The windmills dried out flooded land below sea level, doubling the size of the country. European settlers begin building windmills in North America.
1700s By the early 1700s, both the Netherlands and England have over 10,000 windmills.
As a boy, Benjamin Franklin experiments with kites. One day, he floats on his back while a kite pulls him more than a mile across a lake.
1854 Daniel Halladay builds and sells the Halladay Windmill, which is the first windmill designed specifically for the West. It has thin wooden blades and turns itself into the wind.
1888 Charles F. Brush, a wealthy inventor and manufacturer of electrical equipment in Cleveland, OH, builds a giant windmill on his property. The windmill generates power for 350 incandescent lights in his mansion. In the basement, a battery room stores 408 battery cells (glass jars) filled with chemicals that store the electricity generated by the windmill. In later years, General Electric acquires Brush’s company, Brush Electric Co.
Late 1880s The development of steel blades makes windmills more efficient. Six million windmills spring up across America as settlers move west. These windmills pump water to irrigate crops and provide water for steam locomotives.
1892 Danish inventor Poul LaCour invents a Dutch-style windmill with large wooden sails that generates electricity. He discovers that fast-turning rotors with few blades generate more electricity than slow-turning rotors with many blades. By 1908, Denmark has 72 windmills providing low-cost electricity to farms and villages.
1898-1933 The U.S. Weather Service sends kites aloft to record temperature, humidity, and wind speed.
1900s Wilbur and Orville Wright design and fly giant box kites. These experiments lead them to invent the first successful airplane in 1903.
1920s G.J.M. Darrieus, a French inventor, designs the first vertical-axis wind turbine.
1934-1943 In 1934, engineer Palmer Putman puts together a team of experts in electricity, aerodynamics, engineering, and weather to find a cheaper way to generate electrical power on a large scale. In 1941, the first large-scale turbine in the United States begins operating.
In 1941, the Smith-Putnam wind turbine is installed on Grandpa’s Knob, a hilltop in Rutland, VT. The turbine weighs 250 tons. Its blades measure 175 feet in diameter. It supplies power to the local community for eighteen months until a bearing fails and the machine is shut down in 1943.
1945-1950s After World War II ends in 1945, engineers decide to start the Smith-Putnam turbine up again, even though it has formed cracks on the blades. Three weeks later, one of the blades breaks off and crashes to the ground. Without money to continue his wind experiments, Putman abandons the turbine. By the 1950s, most American windmill companies go out of business.
1971 The first offshore wind farm operates off Denmark’s coast.
LESS TORQUE
20 EnergyFromtheWind
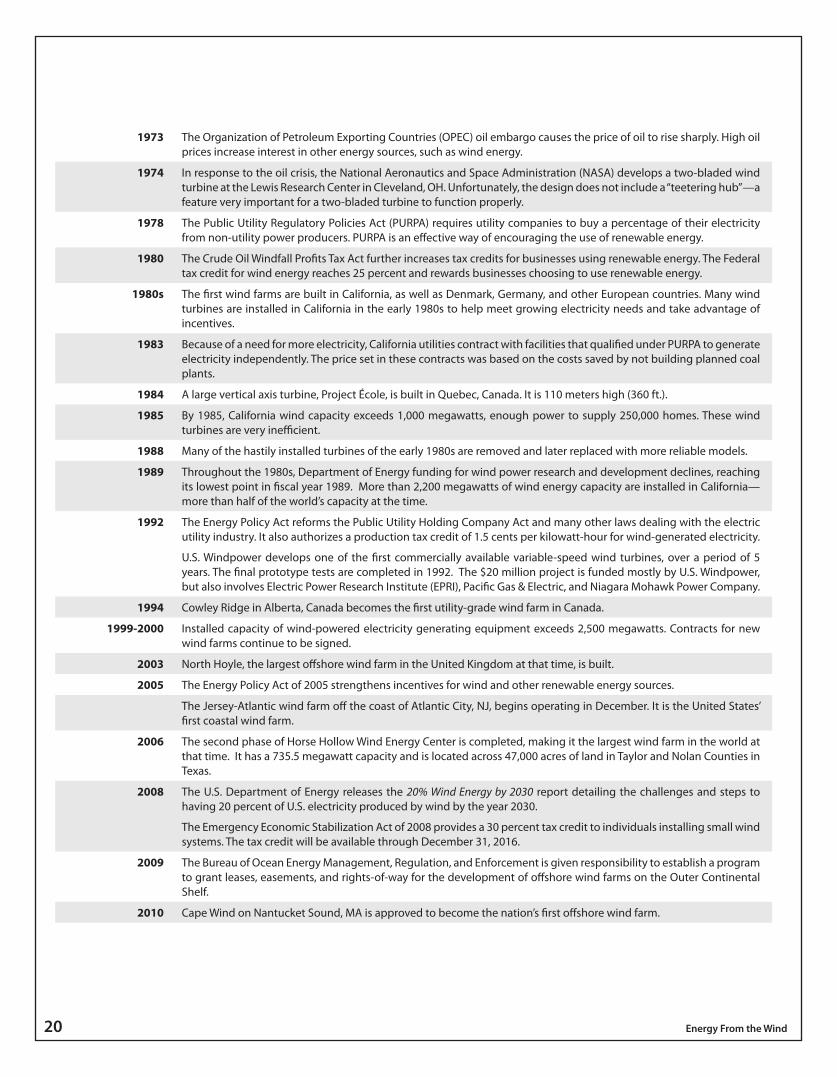
1973 The Organization of Petroleum Exporting Countries (OPEC) oil embargo causes the price of oil to rise sharply. High oil prices increase interest in other energy sources, such as wind energy.
1974 In response to the oil crisis, the National Aeronautics and Space Administration (NASA) develops a two-bladed wind turbine at the Lewis Research Center in Cleveland, OH. Unfortunately, the design does not include a “teetering hub”—a feature very important for a two-bladed turbine to function properly.
1978 The Public Utility Regulatory Policies Act (PURPA) requires utility companies to buy a percentage of their electricity from non-utility power producers. PURPA is an effective way of encouraging the use of renewable energy.
1980 The Crude Oil Windfall Profits Tax Act further increases tax credits for businesses using renewable energy. The Federal tax credit for wind energy reaches 25 percent and rewards businesses choosing to use renewable energy.
1980s The first wind farms are built in California, as well as Denmark, Germany, and other European countries. Many wind turbines are installed in California in the early 1980s to help meet growing electricity needs and take advantage of incentives.
1983 Because of a need for more electricity, California utilities contract with facilities that qualified under PURPA to generate electricity independently. The price set in these contracts was based on the costs saved by not building planned coal plants.
1984 A large vertical axis turbine, Project École, is built in Quebec, Canada. It is 110 meters high (360 ft.).
1985 By 1985, California wind capacity exceeds 1,000 megawatts, enough power to supply 250,000 homes. These wind turbines are very inefficient.
1988 Many of the hastily installed turbines of the early 1980s are removed and later replaced with more reliable models.
1989 Throughout the 1980s, Department of Energy funding for wind power research and development declines, reaching its lowest point in fiscal year 1989. More than 2,200 megawatts of wind energy capacity are installed in California—more than half of the world’s capacity at the time.
1992 The Energy Policy Act reforms the Public Utility Holding Company Act and many other laws dealing with the electric utility industry. It also authorizes a production tax credit of 1.5 cents per kilowatt-hour for wind-generated electricity.
U.S. Windpower develops one of the first commercially available variable-speed wind turbines, over a period of 5 years. The final prototype tests are completed in 1992. The $20 million project is funded mostly by U.S. Windpower, but also involves Electric Power Research Institute (EPRI), Pacific Gas & Electric, and Niagara Mohawk Power Company.
1994 Cowley Ridge in Alberta, Canada becomes the first utility-grade wind farm in Canada.
1999-2000 Installed capacity of wind-powered electricity generating equipment exceeds 2,500 megawatts. Contracts for new wind farms continue to be signed.
2003 North Hoyle, the largest offshore wind farm in the United Kingdom at that time, is built.
2005 The Energy Policy Act of 2005 strengthens incentives for wind and other renewable energy sources.
The Jersey-Atlantic wind farm off the coast of Atlantic City, NJ, begins operating in December. It is the United States’ first coastal wind farm.
2006 The second phase of Horse Hollow Wind Energy Center is completed, making it the largest wind farm in the world at that time. It has a 735.5 megawatt capacity and is located across 47,000 acres of land in Taylor and Nolan Counties in Texas.
2008 The U.S. Department of Energy releases the 20%WindEnergyby2030 report detailing the challenges and steps to having 20 percent of U.S. electricity produced by wind by the year 2030.
The Emergency Economic Stabilization Act of 2008 provides a 30 percent tax credit to individuals installing small wind systems. The tax credit will be available through December 31, 2016.
2009 The Bureau of Ocean Energy Management, Regulation, and Enforcement is given responsibility to establish a program to grant leases, easements, and rights-of-way for the development of offshore wind farms on the Outer Continental Shelf.
2010 Cape Wind on Nantucket Sound, MA is approved to become the nation’s first offshore wind farm.

©2013TheNEEDProjectP.O.Box10101,Manassas,VA201081.800.875.5029www.NEED.org 21
ObjectiveTo measure wind speed.
Materials 1 Pencil 5 Snow cone cups 2 Extra-long straws Masking tape Hole punch Scissors 1 Straight pin Marker Watch with second hand or stopwatch Ruler
Procedure1. Cut the end off one cup to make a hole big enough for the
pencil to fit in. Use the hole punch to make four holes in the top of the cup: two holes opposite each other very near the rim and two holes on opposite sides about a half-centimeter below the first holes, as shown in Diagram 1.
2. Slide the straws through the holes in the cup, as shown in Diagram 1.
3. Color one cup so that you can count the revolutions of the anemometer.
4. Use the hole punch to make two opposite holes in the other cups about 1 centimeter from the rim. Slide one cup onto the end of each straw, making sure the cups face in the same direction. Tape the cups to the straws.
5. Center the straws in the base cup. Slide the base cup over the pencil as shown in Diagram 2 and push the pin through the middle of both straws and into the pencil eraser as far as you can to anchor the apparatus. Lift the straws slightly away from the eraser on the pin so that the apparatus spins easily. You might need to stretch the pin holes in the straws by pulling gently on the straws while holding the pin in place.
6. Take your anemometer outside and measure the speed of the wind in several areas around the school by counting the number of revolutions in 10 seconds and using the chart to determine miles per hour (mph). Compare your results with those of other students in the class.
Conclusions 1. How did your data compare to that of your class? Why might classmates have differing results?
2. How could you change the design of your anemometer to make it more reliable?
0.5 cm
Build an Anemometer
REVOLUTIONS PER 10 SEC. MPH
2-4 15-7 28-9 310-12 413-15 516-18 619-21 722-23 824-26 927-29 1030-32 1133-35 1236-37 1338-40 1441-43 1544-46 1647-49 1750-51 1852-54 1955-57 20
Diagram1
Diagram2

22 EnergyFromtheWind
History of Harnessing the Wind’s Energy
Nam
e__________________________________________ Date______________________
DATEEVENT
HOW DID THIS EVENT COM
E TO BE?W
HAT HAPPENED AS A RESULT?

©2013TheNEEDProjectP.O.Box10101,Manassas,VA201081.800.875.5029www.NEED.org 23
? QuestionWhat is the maximum amount of paper clips that can be lifted all of the way to the top of the shaft?
Materials
Wind Can Do Work
4-BladeWindmillTemplate 1 Extra long straw 1 Small straw Masking tape 50 cm String Paper clips Large foam cup
1 Straight pin Binder clip Fan Ruler Hole punch Marker Scissors
Procedure1. Turn the cup upside down.
2. Cut the longer straw so that you have an 8 cm length, discard the other portion, or share it with another student or group. Tape the regular straw horizontally to the bottom of the cup (which is now the top) so that there is an equal amount of straw on both ends. Set this aside.
3. Prepare the windmill blades using the 4-BladeWindmillTemplate.
4. Measure 1.0 cm from the end of the small straw and make a mark. Insert a pin through the small straw at this mark. This is the front of the straw.
5. Slide the straw through the windmill blades until the back of the blades rest against the pin. Gently slide each blade over the end of the straw. Secure the blades to the straw using tape.
6. Insert the small straw into the larger straw on the cup.
7. Tape the string to the end of the small straw. Tie the other end of the string to a paper clip. Make sure you have 30 cm of string from the straw to the top of the paper clip.
8. On the very end of the small straw near where the string is attached, fasten a binder clip in place for balance and to keep the string winding around the straw.
9. Investigate: Keep adding paper clips one at a time to determine what is the maximum number that can be lifted all of the way to the top. Record your data.
Conclusions Draw a diagram of the system. Label the energy transformations that occurred in order for work to take place.
Extension1. How could you change the design of your windmill to produce more work from the sys-
tem?
2. What variables can you change in this investigation? Create a new investigation chang-ing one variable at a time.

24 EnergyFromtheWind
Observing a Genecon
ObjectiveTo observe the difference between a motor and a generator.
Observations1. How does the speed with which the handle turns affect the light?
2. How does reversing the direction you turn the handle affect the light?
3. What happens when the Genecon is connected to a battery?
4. What happens when the Genecon is attached to the model turbine?
5. How does the speed of the fan affect the Genecon?
Conclusions 1. Define generator and explain how a Genecon is a generator.
2. Define motor and explain how a Genecon is a motor.

©2013TheNEEDProjectP.O.Box10101,Manassas,VA201081.800.875.5029www.NEED.org 25
Measuring ElectricityIncluded in the kit are three tools to measure electricity—two multimeters and one voltmeter. The multimeter allows you to measure current, resistance, and voltage, and displays the reading numerically. The voltmeter measures voltage only, but displays a visual reading as higher electrical outputs illuminate more lights.
When using either meter it should be noted that some measurements will never “stay still” at a single repeatable value. This is the nature of the variables being monitored in some circumstances. For example, if you were to measure the resistance between your two hands with the ohmmeter setting on the multimeter (megohm range—millions of ohms), you would find that the values would continuously change. How tightly you squeeze the metal probes and how “wet” or “dry” your skin is can have a sizable effect on the reading that you obtain. In this situation you need a protocol or standardized method to allow you to record data.
We recommend that you discuss with your class the variability of measurement and let them come up with a standard for collecting data. They may decide to go with the lowest reading, the highest reading, or the reading that appears most frequently in a certain time period.
Digital Multimeter Visual Voltmeter
Directions:1. Switch the tab over to 5V.
2. Press down on the “GND” button. Insert one wire from the turbine into the hole on the bottom. Release the button to secure the wire in place.
3. Repeat step two with the other wire on the “V+ Input” side.
4. Turn on the voltmeter.
5. Place the turbine in front of the fan. The lights on the voltmeter will light indicating how much electricity is being generated.
Notes: • If the“ReversePolarity” lightflashes,switchthewires inthe
“GND”and“V+Input”locations.
• Thevoltmeter’slowestreadingis0.25volts.Ifyoudonotseeanylights,connecttheturbinetothemultimeterforsmallerreadings.
Directions:DC Voltage1. Connect RED lead to VΩmA jack and BLACK to COM.
2. Set ROTARY SWITCH to highest setting on DC VOLTAGE scale (1000).
3. Connect leads to the device to be tested using the alligator clips provided.
4. Adjust ROTARY SWITCH to lower settings until a satisfactory reading is obtained.
5. With the wind turbine, usually the 20 DCV setting provides the best reading.
DC Current (mustincludealoadinthecircuit)
1. Connect RED lead to VΩmA jack and BLACK to COM.
2. Set ROTARY SWITCH to 10 ADC setting.
3. Connect leads to the device to be tested using the alligator clips provided. Note:ThereadingindicatesDCAMPS;areadingof0.25ampsequals250mA(milliamps).
YOUR MULTIMETER MIGHT BE SLIGHTLY DIFFERENT FROM THE ONE SHOWN. BEFORE USING THE MULTIMETER, READ THE OPERATOR’S
INSTRUCTION MANUAL INCLUDED IN THE BOX FOR SAFETY INFORMATION AND COMPLETE OPERATING INSTRUCTIONS.
26 EnergyFromtheWind
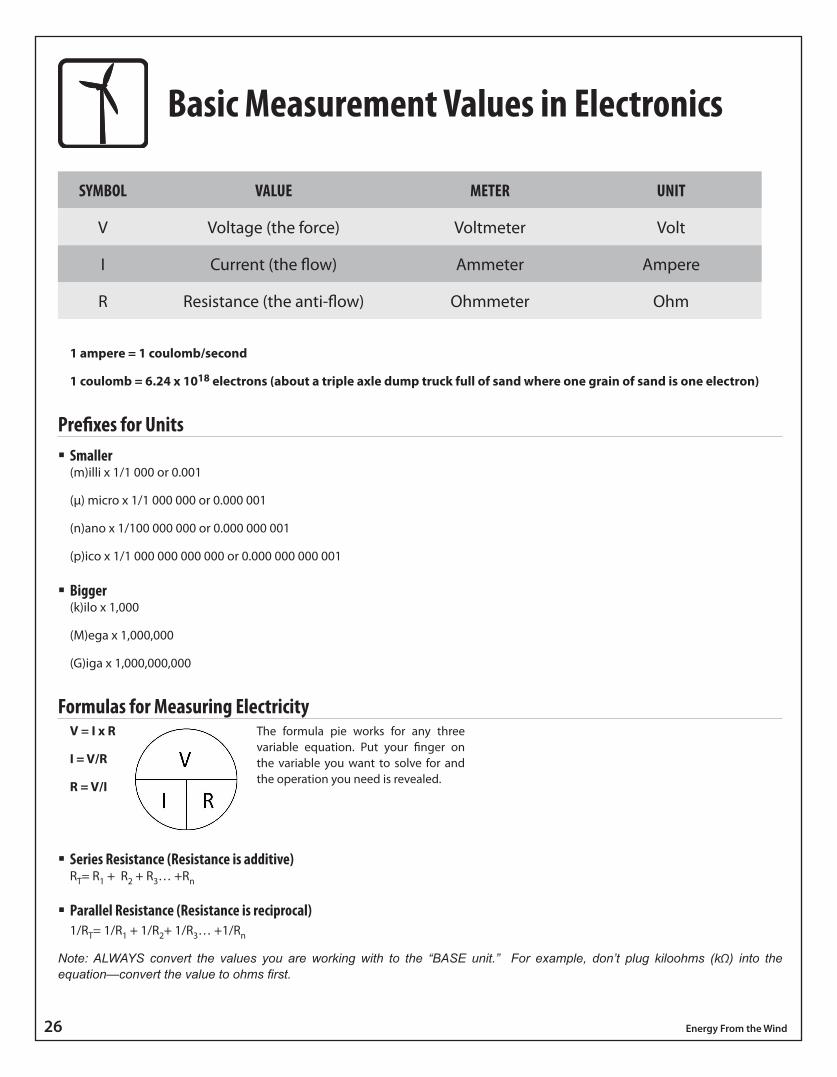
Basic Measurement Values in Electronics
SyMBOL VALUE METER UNIT
V Voltage (the force) Voltmeter Volt
I Current (the flow) Ammeter Ampere
R Resistance (the anti-flow) Ohmmeter Ohm
1 ampere = 1 coulomb/second
1 coulomb = 6.24 x 10¹⁸ electrons (about a triple axle dump truck full of sand where one grain of sand is one electron)
Prefixes for Units Smaller(m)illi x 1/1 000 or 0.001
(µ) micro x 1/1 000 000 or 0.000 001
(n)ano x 1/100 000 000 or 0.000 000 001
(p)ico x 1/1 000 000 000 000 or 0.000 000 000 001
Bigger(k)ilo x 1,000
(M)ega x 1,000,000
(G)iga x 1,000,000,000
Formulas for Measuring ElectricityV = I x R
I = V/R
R = V/I
Series Resistance (Resistance is additive)RT= R1 + R2 + R3… +Rn
Parallel Resistance (Resistance is reciprocal)1/RT= 1/R1 + 1/R2+ 1/R3… +1/Rn
Note: ALWAYS convert the values you are working with to the “BASE unit.” For example, don’t plug kiloohms (kΩ) into the equation—convert the value to ohms first.
The formula pie works for any three variable equation. Put your finger on the variable you want to solve for and the operation you need is revealed.
©2013TheNEEDProjectP.O.Box10101,Manassas,VA201081.800.875.5029www.NEED.org 27
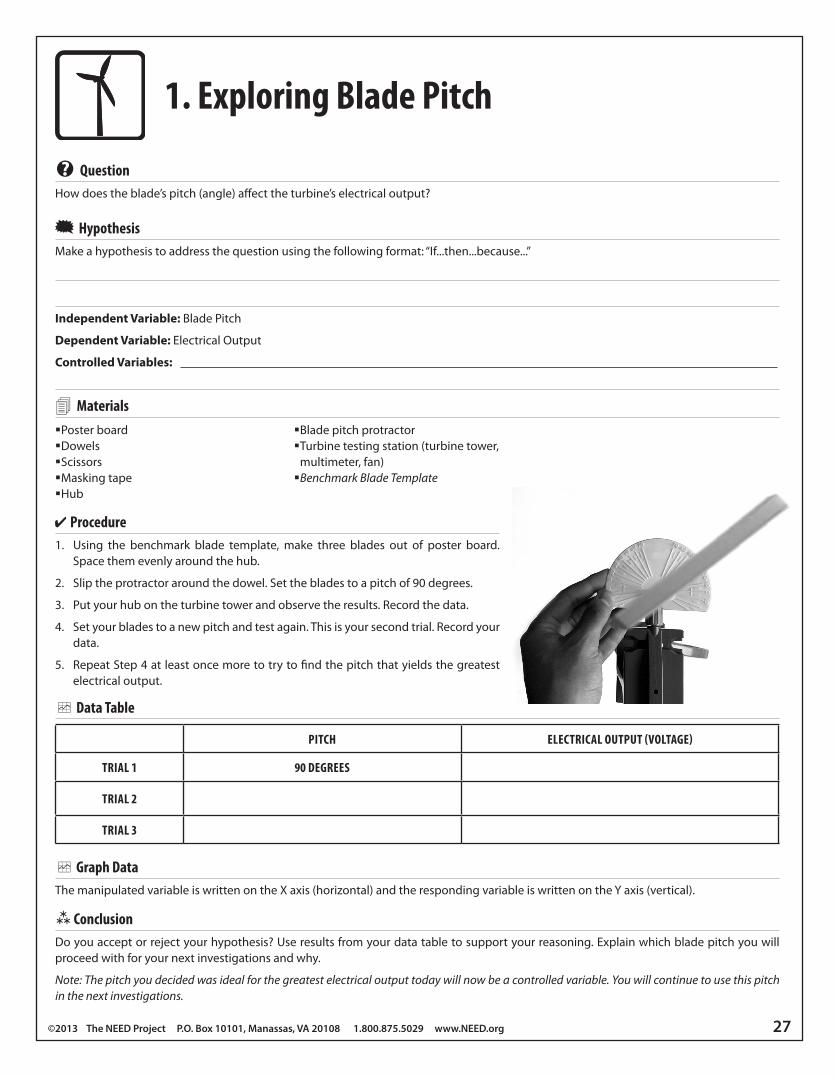
? QuestionHow does the blade’s pitch (angle) affect the turbine’s electrical output?
HypothesisMake a hypothesis to address the question using the following format: “If...then...because...”
Independent Variable: Blade Pitch
Dependent Variable: Electrical Output
Controlled Variables:
Materials
1. Exploring Blade Pitch
Poster board Dowels Scissors Masking tape Hub
Blade pitch protractor Turbine testing station (turbine tower, multimeter, fan)BenchmarkBladeTemplate
Procedure1. Using the benchmark blade template, make three blades out of poster board.
Space them evenly around the hub.
2. Slip the protractor around the dowel. Set the blades to a pitch of 90 degrees.
3. Put your hub on the turbine tower and observe the results. Record the data.
4. Set your blades to a new pitch and test again. This is your second trial. Record your data.
5. Repeat Step 4 at least once more to try to find the pitch that yields the greatest electrical output.
Data Table
PITCH ELECTRICAL OUTPUT (VOLTAGE)
TRIAL 1 90 DEGREES
TRIAL 2
TRIAL 3
Graph DataThe manipulated variable is written on the X axis (horizontal) and the responding variable is written on the Y axis (vertical).
ConclusionDo you accept or reject your hypothesis? Use results from your data table to support your reasoning. Explain which blade pitch you will proceed with for your next investigations and why.
Note:Thepitchyoudecidedwasidealforthegreatestelectricaloutputtodaywillnowbeacontrolledvariable.Youwillcontinuetousethispitchinthenextinvestigations.

28 EnergyFromtheWind
? QuestionHow do the number of blades on a turbine affect electrical output?
HypothesisMake a hypothesis to address the question using the following format: “If...then...because...”
Independent Variable: Number of Blades
Dependent Variable: Electrical Output
Controlled Variables:
Materials
2. Exploring Number of Blades
Benchmark blades Poster board Dowels Scissors
Masking tape Hub Turbine testing station Blade pitch protractor
Procedure1. Decide how many blades you will be testing and make enough blades for the maximum number you will be testing.
2. In the data table, put down the greatest electrical output from the blade pitch investigation.
3. Put the number of blades you want to test into the hub. They should have the same pitch as in the previous investigation.
4. Put your hub onto the turbine tower and test the number of blades. Record the results as trial 1.
5. Repeat steps 3-4 at least two more times to try to find the ideal number of blades for the greatest electrical output.
Data Table
NUMBER OF BLADES ELECTRICAL OUTPUT (VOLTAGE)
BENCHMARk 3 BLADES
TRIAL 1
TRIAL 2
TRIAL 3
Graph DataThe manipulated variable is written on the X axis (horizontal) and the responding variable is written on the Y axis (vertical).
ConclusionDo you accept or reject your hypothesis? Use results from your data table to support your reasoning and explain how many blades are ideal for a turbine.
Note:Thenumberofbladeswiththegreatestelectricaloutputshouldbecomethebenchmarkbladesforyournextinvestigation.

©2013TheNEEDProjectP.O.Box10101,Manassas,VA201081.800.875.5029www.NEED.org 29
? QuestionHow does the surface area of a turbine blade affect electrical output?
HypothesisMake a hypothesis to address the question using the following format: If (manipulated variable) then (responding variable) because ...
Independent Variable: Area of Blades
Dependent Variable: Electrical Output
Controlled Variables:
Materials
3. Exploring Surface Area
Benchmark blades Poster board Dowels Scissors Masking tape
Hub Turbine testing station Blade pitch protractor Ruler
Procedure1. Calculate the surface area of the benchmark blade. In the data table, record the surface area and the greatest electrical output from
your previous investigation of the benchmark blades. The formula for finding the area of a trapezoid is one half the sum of both bases, multiplied by the height or, a=1/2 (b1 + b2) h.
2. Keep the same shape as the benchmark blade, but change the length and/or width. This will change the surface area of the blade.
3. Make your new blades. You should have the same number of blades that you found had the best results in your previous investigation.
4. Find the surface area for each of your new blades.
5. Put your blades into the hub and onto the turbine tower. Test for electrical output and record your data.
6. Repeat steps 2-5 at least two more times to try to find the best surface area for the greatest electrical output.
Data Table
SURFACE AREA ELECTRICAL OUTPUT (VOLTAGE)
BENCHMARk
TRIAL 1
TRIAL 2
TRIAL 3
Graph DataThe manipulated variable is written on the X axis (horizontal) and the responding variable is written on the Y axis (vertical).
Conclusion Do you accept or reject your hypothesis? Use results from your data table to support your reasoning and explain how surface area affects the electrical output. Why do you think this is?
Note: The blades with the surface area that achieved the greatest electrical output should become the benchmark blades used for your nextinvestigation.
Formula
Area of a trapezoid = ½(b1 + b2) h
b1
h
b2

30 EnergyFromtheWind
? QuestionHow does adding mass to the blades affect the turbine’s electrical output?
How does adding mass to the blades affect the turbine’s electrical output?
HypothesisMake a hypothesis to address the questions using the following format: “If...then...because...”
Independent Variable: Mass of Blades
Dependent Variable: Electrical Output
Controlled Variables:
Materials Benchmark blades from previous investigation Pennies (or other mass) Masking tape Turbine testing station Blade pitch protractor
Procedure1. In the data table, record your results from your previous investigation on the row with zero grams.
2. Tape one penny near the base of each blade, an equal distance from the center of the hub.
3. Test and record the electrical output. Repeat, adding another penny. If adding mass increases the output, add more pennies one at a time until you determine the ideal mass for the greatest electri-cal output.
4. Distribute the pennies on the blades at different distances from the hub until you determine the ideal distribution of mass for the greatest electrical output.
Data Table
ADDITIONAL MASS ELECTRICAL OUTPUT (VOLTAGE)
BENCHMARk 0 GRAMS
TRIAL 1
TRIAL 2
TRIAL 3
Graph DataThe manipulated variable is written on the X axis (horizontal) and the responding variable is written on the Y axis (vertical).
Conclusion Do you accept or reject your hypothesis? Use results from your data table to support your reasoning and explain how mass and mass distribution affect the electrical output. Why do you think this is?
Note:Thebladeswiththemassthatachievedthegreatestelectricaloutputshouldbecomethebenchmarkbladesforyournextinvestigation.
4. Exploring Mass
1c1c
1c1c
1c1c
1c1c
Blade
Pennies
Tape
Dowel

©2013TheNEEDProjectP.O.Box10101,Manassas,VA201081.800.875.5029www.NEED.org 31
! ChallengeThe engineers at Wind for Tomorrow Turbine Co. want help to optimize their turbine blades for higher energy output. They are accepting bids from companies to design blades that more effectively convert kinetic energy than their current blade design.
! ExploreUsing data from your previous investigations and data from other groups, explore ideas for the best blade design.
Make a PlanIn your science notebook, sketch your design, list the materials you will need, and detail the steps you will take to make the blades. Construct blades that will give you the greatest electrical output.
DataTest and record the electrical output from your new blades. Compare your data to the benchmark blades in Blade Investigation #1 and your blades in Blade Investigation #4.
Data Table
BLADES ELECTRICAL OUTPUT (VOLTAGE)
ORIGINAL BENCHMARk BLADES
INVESTIGATION #4 BENCHMARk BLADES
1ST DESIGN
2ND DESIGN
AnalysisHow did the output of your newly designed blades compare to the output of the #4 benchmark blades and the benchmark blades? In your science notebook, explain why your blade design is more or less effective than the comparison blades.
New PlanUsing your data from the data table above, draw and describe specific changes you will make to your blade design to increase its electrical output and why you will make these changes.
RedesignUsing your changes, alter the design of your blades, test, and record your data.
Analysis How did the outcome of your re-designed blades compare to the output of the benchmark blades, the #4 benchmark blades, and your first design? Explain your results.
ReportWrite a report to the Wind for Tomorrow Turbine Co. detailing your best blade design. Use data to explain why the company should or should not go with your design.
5. Designing Optimum Blades
32 EnergyFromtheWind
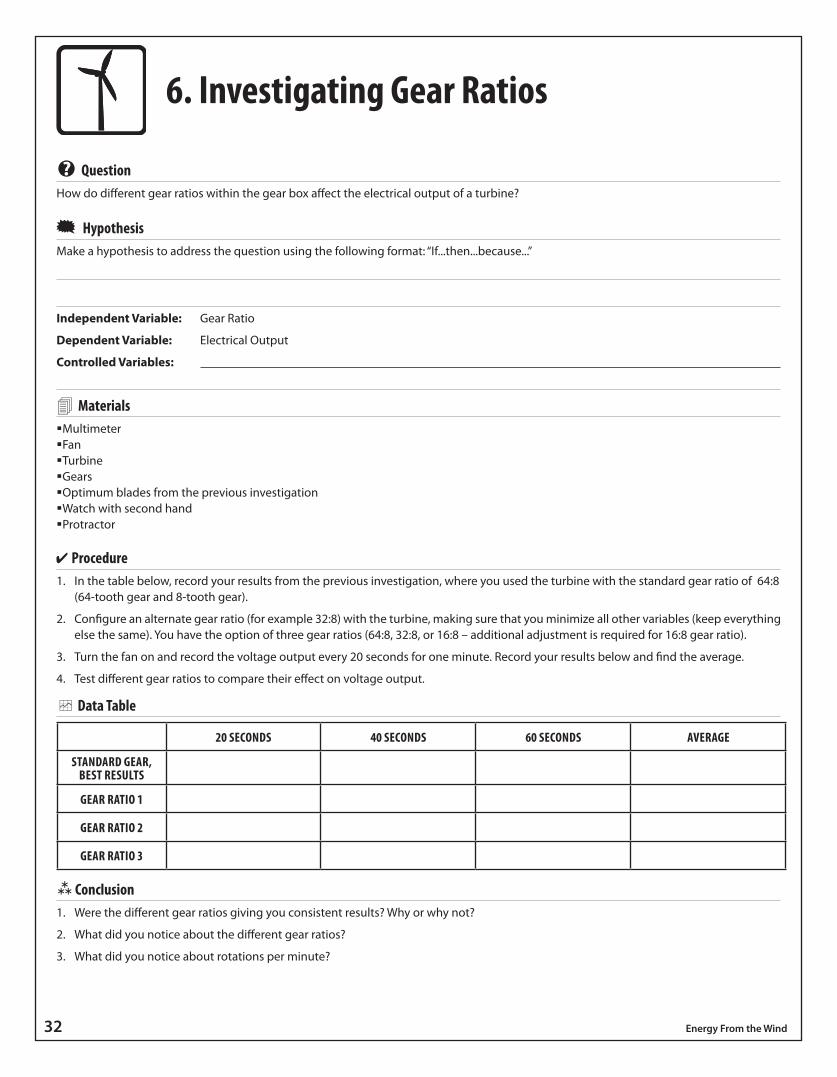
6. Investigating Gear Ratios
? QuestionHow do different gear ratios within the gear box affect the electrical output of a turbine?
HypothesisMake a hypothesis to address the question using the following format: “If...then...because...”
Independent Variable: Gear Ratio
Dependent Variable: Electrical Output
Controlled Variables:
Materials Multimeter Fan Turbine Gears Optimum blades from the previous investigation Watch with second hand Protractor
Procedure1. In the table below, record your results from the previous investigation, where you used the turbine with the standard gear ratio of 64:8
(64-tooth gear and 8-tooth gear).
2. Configure an alternate gear ratio (for example 32:8) with the turbine, making sure that you minimize all other variables (keep everything else the same). You have the option of three gear ratios (64:8, 32:8, or 16:8 – additional adjustment is required for 16:8 gear ratio).
3. Turn the fan on and record the voltage output every 20 seconds for one minute. Record your results below and find the average.
4. Test different gear ratios to compare their effect on voltage output.
Data Table
20 SECONDS 40 SECONDS 60 SECONDS AVERAGE
STANDARD GEAR, BEST RESULTS
GEAR RATIO 1
GEAR RATIO 2
GEAR RATIO 3
Conclusion 1. Were the different gear ratios giving you consistent results? Why or why not?
2. What did you notice about the different gear ratios?
3. What did you notice about rotations per minute?
©2013TheNEEDProjectP.O.Box10101,Manassas,VA201081.800.875.5029www.NEED.org 33
DRAG
LIFT
TORQUE
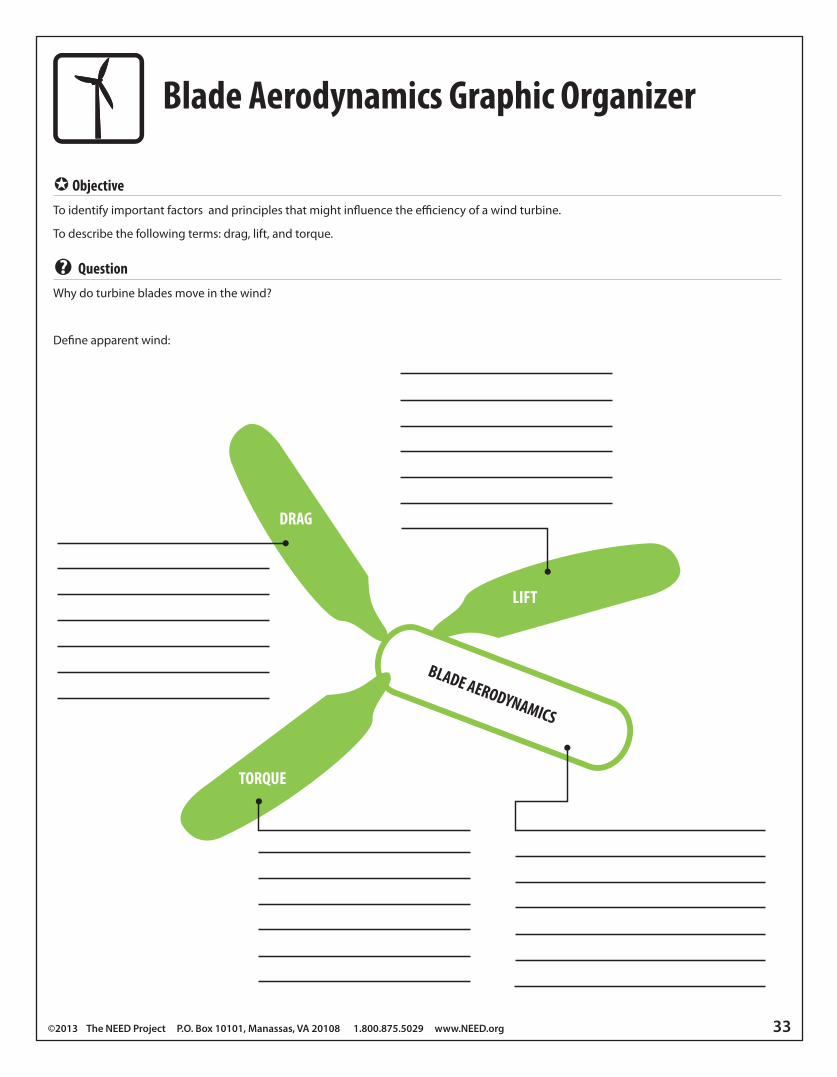
ObjectiveTo identify important factors and principles that might influence the efficiency of a wind turbine.
To describe the following terms: drag, lift, and torque.
? QuestionWhy do turbine blades move in the wind?
Define apparent wind:
Blade Aerodynamics Graphic Organizer

34 EnergyFromtheWind
ObjectiveTo describe how aerodynamics of blades can affect the turbine’s efficiency.
ObservationsHow does the shape of the blade in this demonstration differ from your original benchmark blades?
How many airfoil blades were used to provide the highest electrical output? Compare this to your findings from the previous explorations, and explain any similarity or difference.
How is blade pitch affected when using an airfoil blade? Compare to your findings from previous explorations, and explain any similarity or difference.
Describe how mass and surface area may be affected when using airfoil blades. Cite evidence from previous investigations in your answer.
Blade Aerodynamics
Conclusion 1. Would you choose to use an airfoil shape if designing the most efficient blade? Why or why not?
2. Describe what your plan might look like if you were to design the best blades for your classroom turbine.
3. Explain how your classroom turbine might differ from an actual turbine placed at your school or in your community?
.

©2013TheNEEDProjectP.O.Box10101,Manassas,VA201081.800.875.5029www.NEED.org 35
? QuestionHow do you calculate wind power?
Materials Fan Wind gauge Turbine with benchmark blades Meter stick
Formula
Power = ½ ρAV3
where ρ = air density (ρ = 1.2 kg/m3 at standard ambient temperature and pressure); A = swept area (A = πr2 ; π = 3.1416); V = velocity
Watts = ½ (kg/m3) x (m2) x (m/s)3
Procedure1. Measure the radius of the turbine blade assembly and calculate the area swept by the blades.
(A = πr2)
2. Use the wind gauge to measure the wind velocity at a distance of 1 meter from the fan on low and high speeds. Convert the measure-ments from miles per hour to meters per second (m/s).
(1 mile = 1609.344 meters)
Wind Velocity at Low Speed - 1 meter: ____________ mph = ____________m/s
Wind Velocity at High Speed - 1 meter: ____________ mph = ____________m/s
3. Use the formula above to calculate the power of the wind in watts at both fan speeds.
Wind Power at Low Speed - 1 meter: ____________W
Wind Power at High Speed - 1 meter: ____________W
4. Vary the distance from the fan and calculate the power on low and high speeds.
Wind Power at ___________m (distance A) on Low Speed: ___________W
Wind Power at ___________m (distance A) on High Speed: ___________W
Wind Power at ___________m (distance B) on Low Speed: ___________W
Wind Power at ___________m (distance B) on High Speed: ___________W
Conclusion 1. Compare the power at different distances from the fan and on different fan speeds.
2. Explain the relationships between the different variables and the power produced.
Calculating Wind Power
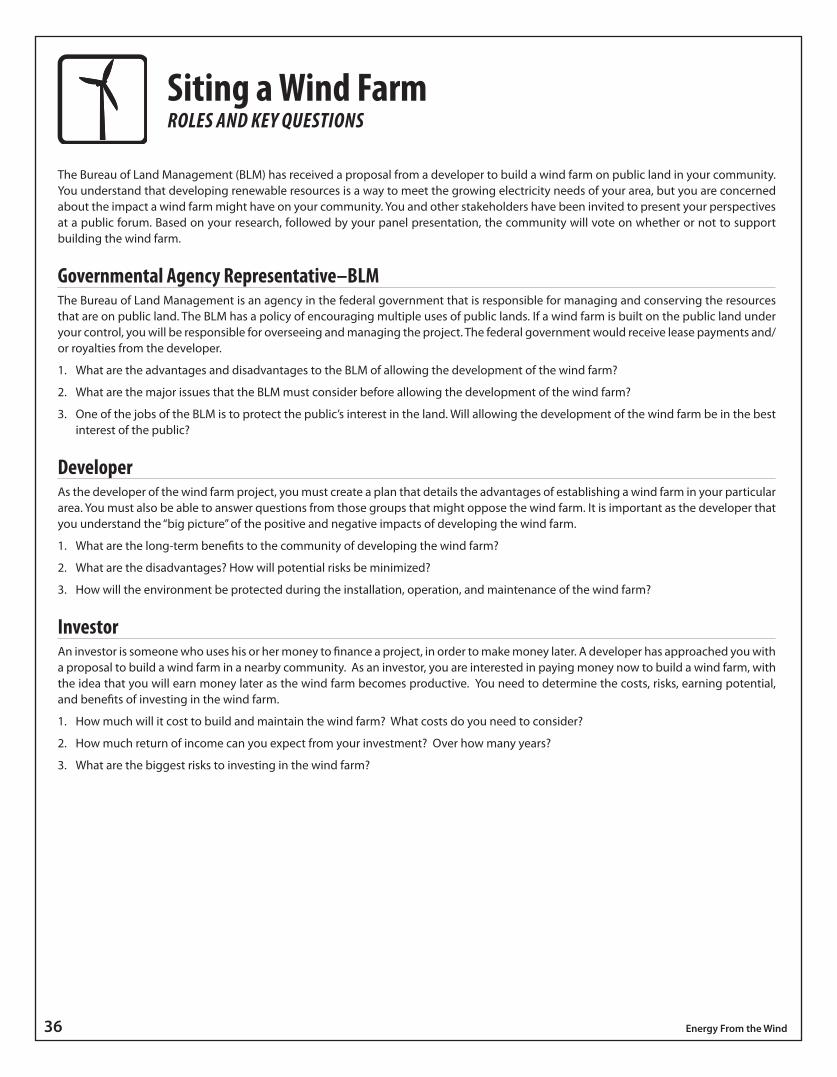
36 EnergyFromtheWind
The Bureau of Land Management (BLM) has received a proposal from a developer to build a wind farm on public land in your community. You understand that developing renewable resources is a way to meet the growing electricity needs of your area, but you are concerned about the impact a wind farm might have on your community. You and other stakeholders have been invited to present your perspectives at a public forum. Based on your research, followed by your panel presentation, the community will vote on whether or not to support building the wind farm.
Governmental Agency Representative –BLMThe Bureau of Land Management is an agency in the federal government that is responsible for managing and conserving the resources that are on public land. The BLM has a policy of encouraging multiple uses of public lands. If a wind farm is built on the public land under your control, you will be responsible for overseeing and managing the project. The federal government would receive lease payments and/or royalties from the developer.
1. What are the advantages and disadvantages to the BLM of allowing the development of the wind farm?
2. What are the major issues that the BLM must consider before allowing the development of the wind farm?
3. One of the jobs of the BLM is to protect the public’s interest in the land. Will allowing the development of the wind farm be in the best interest of the public?
DeveloperAs the developer of the wind farm project, you must create a plan that details the advantages of establishing a wind farm in your particular area. You must also be able to answer questions from those groups that might oppose the wind farm. It is important as the developer that you understand the “big picture” of the positive and negative impacts of developing the wind farm.
1. What are the long-term benefits to the community of developing the wind farm?
2. What are the disadvantages? How will potential risks be minimized?
3. How will the environment be protected during the installation, operation, and maintenance of the wind farm?
InvestorAn investor is someone who uses his or her money to finance a project, in order to make money later. A developer has approached you with a proposal to build a wind farm in a nearby community. As an investor, you are interested in paying money now to build a wind farm, with the idea that you will earn money later as the wind farm becomes productive. You need to determine the costs, risks, earning potential, and benefits of investing in the wind farm.
1. How much will it cost to build and maintain the wind farm? What costs do you need to consider?
2. How much return of income can you expect from your investment? Over how many years?
3. What are the biggest risks to investing in the wind farm?
Siting a Wind FarmRoles and Key Questions

©2013TheNEEDProjectP.O.Box10101,Manassas,VA201081.800.875.5029www.NEED.org 37
Site PlannerThe site planner of a wind farm considers many factors to determine the best location for a wind farm. You must take into consideration the important concerns that community members have. You need to determine the optimum areas for the turbines in regard to local weather patterns. You must also take into consideration any other environmental factors that might affect the siting of the wind farm.
1. What information about local and global weather patterns and wind technology must you research before siting a wind farm?
2. What environmental factors must you consider before siting a wind farm?
3. What other factors must you consider? Are there roads and power lines nearby?
Farmer/RancherYou are a farmer and rancher who has a long-term lease of 10,000 acres of public land that you use to grow crops and graze your cattle. The Bureau of Land Management has informed you that it is considering a proposal to allow a wind farm to be built on part of the land. You think that using renewable energy and having multiple uses of the land are good ideas, but you are concerned about the impact of a wind farm on your crops and animals.
1. What impacts will siting, building, and operating a wind farm have on your crops and cattle?
2. Will you have to reduce the acres of crops you grow or the number of cattle that graze on the land?
3. Are there any benefits to you of building the wind farm on your leased land?
Consumer/NeighborYou are a neighbor of the farmer/rancher on whose land the wind farm might be built. You have heard that large wind turbines generate a great deal of noise and that concerns you because the chinchillas you raise are very sensitive to noise. You are aware that there have been predictions of blackouts in the near future in your area because of a lack of electricity capacity. You are also wondering how the price of electricity in your area might be affected if a wind farm was installed.
1. How much noise do wind turbines generate?
2. How would a wind farm affect the property values of the surrounding properties?
3. How would local electricity rates be affected by the installation of a wind farm?
EnvironmentalistYou are very concerned with protecting the environment. You would like to know how wind energy impacts the environment during the manufacture, installation, maintenance, and removal of the wind turbines. Also, there have been reports in the past of wind turbines injuring birds and bats that fly into them. You would like to know how wind energy installations might affect birds and animals in your area.
1. How would the manufacture and installation of wind turbines affect the local environment?
2. How would the operation of the wind turbines affect the surrounding environment and the plants and animals in the area?
3. Would the amount of electricity generated by the wind turbines be enough to offset the “cost” to the environment?

38 EnergyFromtheWind
EconomistAn economist is a person who can analyze the financial impacts of actions. The community that will be affected by the development of the wind farm has consulted you. They have asked you to determine the costs of generating electricity from fossil fuels and wind energy and to do a comparison study. This includes comparing construction costs, transmission costs, generation costs, and potential tax credits available for using wind.
1. How does the cost of using wind to generate electricity compare to other sources?
2. What economic advantages/disadvantages would the wind farm bring to the area?
3. Will the wind farm impact the economy of the area by bringing more jobs to the area?
Utility Company RepresentativeYou are an employee of the local utility company and are responsible for making sure that your utility has the necessary capacity to provide electricity to all of your customers. There is increased demand for electricity in your community and you know you must secure reliable sources of additional generation in the near future. You would be the main purchaser of electricity from the wind farm.
1. How expensive would the electricity be from the wind farm?
2. Will the wind farm produce enough electricity with reliability to meet the growing needs of the community?
3. Will there be additional costs to the utility company that might be passed along to consumers?
Member of the County CommissionThe County Commission manages the public services of the community and determines how they are paid for. The County Commission is a political group and must take into consideration all political sides of the issue. You must consider the impacts on the community if the BLM allows the wind farm to be developed in the area.
1. What impacts would the wind farm have on the need to provide local services?
2. What economic impacts would the wind farm have on the local community and taxes?
3. What political impact would supporting the wind farm have on your community?
Useful sites to visit when conducting researchAmerican Wind Energy Association: www.awea.org
Energy Information Administration: www.eia.gov
Bureau of Land Management: www.blm.gov
U.S. Department of Energy - Wind: www.doe.gov/science-innovation/energy-sources/renewable-energy/wind
U.S. Department of Energy - Energy Efficiency: www.doe.gov/science-innovation/energy-efficiency
U.S. Department of Energy, Energy Efficiency and Renewable Energy, Wind Program: www1.eere.energy.gov/wind
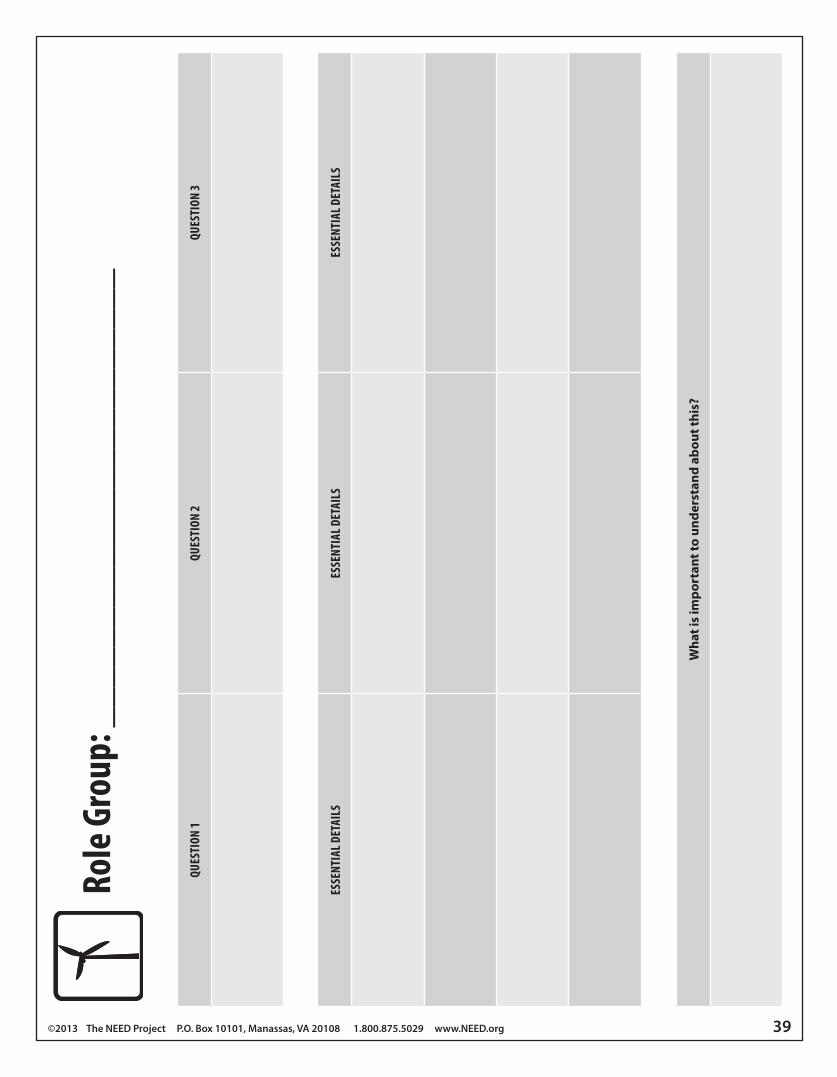
©2013TheNEEDProjectP.O.Box10101,Manassas,VA201081.800.875.5029www.NEED.org 39
QUES
TION
1QU
ESTI
ON 2
QUES
TION
3
Wha
t is
impo
rtan
t to
unde
rsta
nd a
bout
this
?
ESSE
NTIA
L DET
AILS
ESSE
NTIA
L DET
AILS
ESSE
NTIA
L DET
AILS
Role
Gro
up: _
____
____
____
____
____
__
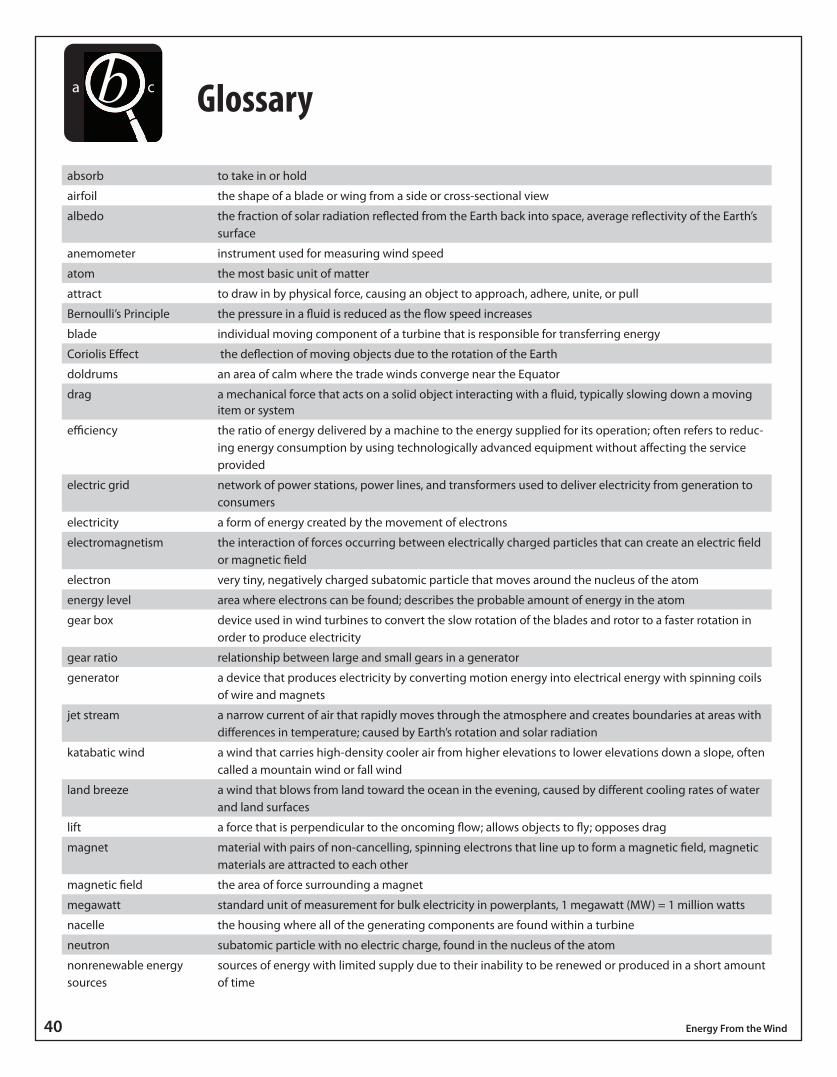
40 EnergyFromtheWind
Glossary
absorb to take in or hold
airfoil the shape of a blade or wing from a side or cross-sectional view
albedo the fraction of solar radiation reflected from the Earth back into space, average reflectivity of the Earth’s surface
anemometer instrument used for measuring wind speed
atom the most basic unit of matter
attract to draw in by physical force, causing an object to approach, adhere, unite, or pull
Bernoulli’s Principle the pressure in a fluid is reduced as the flow speed increases
blade individual moving component of a turbine that is responsible for transferring energy
Coriolis Effect the deflection of moving objects due to the rotation of the Earth
doldrums an area of calm where the trade winds converge near the Equator
drag a mechanical force that acts on a solid object interacting with a fluid, typically slowing down a moving item or system
efficiency the ratio of energy delivered by a machine to the energy supplied for its operation; often refers to reduc-ing energy consumption by using technologically advanced equipment without affecting the service provided
electric grid network of power stations, power lines, and transformers used to deliver electricity from generation to consumers
electricity a form of energy created by the movement of electrons
electromagnetism the interaction of forces occurring between electrically charged particles that can create an electric field or magnetic field
electron very tiny, negatively charged subatomic particle that moves around the nucleus of the atom
energy level area where electrons can be found; describes the probable amount of energy in the atom
gear box device used in wind turbines to convert the slow rotation of the blades and rotor to a faster rotation in order to produce electricity
gear ratio relationship between large and small gears in a generator
generator a device that produces electricity by converting motion energy into electrical energy with spinning coils of wire and magnets
jet stream a narrow current of air that rapidly moves through the atmosphere and creates boundaries at areas with differences in temperature; caused by Earth’s rotation and solar radiation
katabatic wind a wind that carries high-density cooler air from higher elevations to lower elevations down a slope, often called a mountain wind or fall wind
land breeze a wind that blows from land toward the ocean in the evening, caused by different cooling rates of water and land surfaces
lift a force that is perpendicular to the oncoming flow; allows objects to fly; opposes drag
magnet material with pairs of non-cancelling, spinning electrons that line up to form a magnetic field, magnetic materials are attracted to each other
magnetic field the area of force surrounding a magnet
megawatt standard unit of measurement for bulk electricity in powerplants, 1 megawatt (MW) = 1 million watts
nacelle the housing where all of the generating components are found within a turbine
neutron subatomic particle with no electric charge, found in the nucleus of the atom
nonrenewable energy sources
sources of energy with limited supply due to their inability to be renewed or produced in a short amount of time
a cb
©2013TheNEEDProjectP.O.Box10101,Manassas,VA201081.800.875.5029www.NEED.org 41
north pole the end of a magnet that freely points towards the Earth’s north magnetic pole
nucleus the center of an atom, composed of protons and neutrons and houses the majority of the atom’s mass
pitch the angle of the blade on a turbine, can be adjusted to reduce drag
polar easterlies dry, cold winds that begin in the east and flow in a westerly direction away from the poles
prevailing westerlies winds that blow from west to east and occur in temperate zones of the Earth
proton subatomic particle with a positive electric charge, found in the nucleus of an atom
radiant energy energy that travels in electromagnetic waves like light or x-rays
reflect to cast or bend back from a surface, experienced by radiant energy, thermal energy, and sound energy
renewable energy sources sources of energy with a more constant supply because they are replenished in a short amount of time
repel to resist or keep away from
rotor hub structure connecting the blades of the turbine to the generator shaft
sea breeze a wind that blows from the ocean to land during the day, caused by different cooling rates of water and land surfaces
secondary energy source often called an energy carrier, secondary energy sources require another source, like coal, to be converted for creation; electricity and hydrogen are examples
shaft a turning or rotating part that connects the turbine to the generator
siting the process of choosing a location for a wind turbine or farm
south pole the end of a magnet that freely points towards the Earth’s south magnetic pole
tower structural support of the turbine
torque the tendency of a force to rotate an object about its axis or pivot, a twist
trade winds warm, steady easterly breeze flowing towards the Equator in tropical latitudes
transformer a device that changes the voltage of electricity
transmission line power lines that carry electricity at higher voltages long distances
tunnel effect when air becomes compressed in narrow spaces and its speed increases
turbine a machine of blades that converts kinetic energy of a moving fluid to mechanical power
valley wind a wind that blows up the slope of a mountain allowing cooler air to sweep into the valley
wind moving air created by uneven heating of Earth’s surface
wind farm groups or clusters of wind turbines that produce large amounts of electricity together
wind turbine a system that converts motion energy from the wind into electrical energy
wind vane an instrument used to show the direction of the wind

42 EnergyFromtheWind
NEED’s Online Resources
ENERGY EXCHANGE ANDCAREER CURRENTS NEWSLETTERSNEED publishes two newsletters. Energy Exchange is published to keep teachers and partners informed about new curriculum materials, current energy issues, and opportunities available for teachers and students. Career Currents is published to provide students with information about a variety of careers in the energy industry. The newsletters are distributed to all NEED teachers, partners, and sponsors. The latest edition of each newsletter and archived editions are available on the NEED web site at www.NEED.org.
NEED’S SMUGMUG GALLERYhttp://need-media.smugmug.com/
You can fi nd pictures of other NEED students learning and teaching about energy. You can also fi nd pictures from NEED workshops, and photos of energy from around the country that were submitted for the Great American Energy Scavenger Hunt. Would you like to submit images or videos to NEED’s gallery?
E-mail [email protected] for more information.
Use SmugMug for the following resources:
VideosNeed a refresher on The Science of Energy? Watch the Science of Energy videos. Also check out our Energy Chants videos!
Find videos produced by NEED students teaching their peers and community members about energy.
Online Graphics LibraryWould you like to use NEED’s graphics in your own classroom presentations? Download graphics for easy use in your classroom.
NEED Energy BooklistLooking for extra background reading on energy? NEED’s booklist provides an extensive list of fi ction and nonfi ction titles for all grade levels to support energy units in the science, social studies, or language arts setting. Check it out at www.NEED.org.
U.S. Energy GeographyMaps are a great way to visualize the energy picture in the United States. This set of maps will support your energy discussion and energy activities.
Go to www.NEED.org/maps to see energy production, consumption, and reserves all over the country!
E-PUBLICATIONS
The NEED Project now offers e-publication versions of various guides for in-classroom and at-home use. Go to www.NEED.org/. Don’t see what you’re looking for? Check back often, as new e-pubs will be added throughout the year.
SOCIAL MEDIAStay up-to-date with NEED, “like” us on Facebook! Search for The NEED Project.
Follow us on Twitter. We share the latest energy news from around the country, @NEED_Project.
Read the latest from the NEED family in our blog! Visit it at www.NEED.org.
NEED ANNUAL REPORTNEED’s Annual Report gives summaries of the best state and national Youth Awards projects for 2012–2013, as well as information about The NEED Project and our state programs.
Annual Report Upon Request
Online at www.NEED.org
B L A N k P A G E

©2013TheNEEDProjectP.O.Box10101,Manassas,VA201081.800.875.5029www.NEED.org 43
NEED’s Online Resources
ENERGY EXCHANGE ANDCAREER CURRENTS NEWSLETTERSNEED publishes two newsletters. Energy Exchange is published to keep teachers and partners informed about new curriculum materials, current energy issues, and opportunities available for teachers and students. Career Currents is published to provide students with information about a variety of careers in the energy industry. The newsletters are distributed to all NEED teachers, partners, and sponsors. The latest edition of each newsletter and archived editions are available on the NEED web site at www.NEED.org.
NEED’S SMUGMUG GALLERYhttp://need-media.smugmug.com/
You can fi nd pictures of other NEED students learning and teaching about energy. You can also fi nd pictures from NEED workshops, and photos of energy from around the country that were submitted for the Great American Energy Scavenger Hunt. Would you like to submit images or videos to NEED’s gallery?
E-mail [email protected] for more information.
Use SmugMug for the following resources:
VideosNeed a refresher on The Science of Energy? Watch the Science of Energy videos. Also check out our Energy Chants videos!
Find videos produced by NEED students teaching their peers and community members about energy.
Online Graphics LibraryWould you like to use NEED’s graphics in your own classroom presentations? Download graphics for easy use in your classroom.
NEED Energy BooklistLooking for extra background reading on energy? NEED’s booklist provides an extensive list of fi ction and nonfi ction titles for all grade levels to support energy units in the science, social studies, or language arts setting. Check it out at www.NEED.org.
U.S. Energy GeographyMaps are a great way to visualize the energy picture in the United States. This set of maps will support your energy discussion and energy activities.
Go to www.NEED.org/maps to see energy production, consumption, and reserves all over the country!
E-PUBLICATIONS
The NEED Project now offers e-publication versions of various guides for in-classroom and at-home use. Go to www.NEED.org/. Don’t see what you’re looking for? Check back often, as new e-pubs will be added throughout the year.
SOCIAL MEDIAStay up-to-date with NEED, “like” us on Facebook! Search for The NEED Project.
Follow us on Twitter. We share the latest energy news from around the country, @NEED_Project.
Read the latest from the NEED family in our blog! Visit it at www.NEED.org.
NEED ANNUAL REPORTNEED’s Annual Report gives summaries of the best state and national Youth Awards projects for 2012–2013, as well as information about The NEED Project and our state programs.
Annual Report Upon Request
Online at www.NEED.org

National Sponsors and PartnersAmerican Electric PowerAmerican Wind Energy AssociationAppalachian Regional CommissionArizona Public ServiceArizona Science CenterArkansas Energy OceArmstrong Energy CorporationAssociation of Desk & Derrick ClubsAudubon Society of Western PennsylvaniaBarnstable County, MassachusettsRobert L. Bayless, Producer, LLCBPBP AlaskaBlue Grass EnergyBrady TraneCape Light Compact–MassachusettsL.J. and Wilma CarrCenter for Teacher SuccessChabot Space and Science CenterChevronChevron Energy SolutionsColumbia Gas of MassachusettsComEdConEdison SolutionsConocoPhillipsConstellationDaniel Math and Science CenterDavid Petroleum CorporationDenver Public SchoolsDePaul UniversityDesk and Derrick of Roswell, NMDominionDonorsChoose.orgDuke EnergyEast Kentucky PowerEastern Kentucky UniversityEl Paso CorporationE.M.G. Oil PropertiesEncanaEncana Cares FoundationEnergy Education for MichiganEnergy Training SolutionsFirst Roswell CompanyFJ Management. Inc. Foundation for Environmental EducationFPLThe Franklin InstituteFrontier AssociatesGeorgia Environmental Facilities AuthorityGeorgia PowerGovernment of Thailand–Energy MinistryGreen Power EMCGuam Energy OceGuilford County Schools – North CarolinaGulf Power
Harvard PetroleumHawaii EnergyGerald Harrington, GeologistHouston Museum of Natural ScienceHoustonWorksHydro Research FoundationIllinois Clean Energy Community FoundationIndependent Petroleum Association of AmericaIndependent Petroleum Association of New MexicoIndiana Michigan PowerInterstate Renewable Energy CouncilKentucky Clean Fuels CoalitionKentucky Department of EducationKentucky Department of Energy Develop-ment and IndependenceKentucky Power – An AEP CompanyKentucky River Properties LLCKentucky Utilities CompanyLinn County Rural Electric CooperativeLlano Land and ExplorationLouisiana State University Cooperative ExtensionLouisville Gas and Electric CompanyMaine Energy Education ProjectMaine Public Service CompanyMarianas Islands Energy OceMassachusetts Division of Energy ResourcesMichigan Oil and Gas Producers Education FoundationMiller EnergyMississippi Development Authority–Energy DivisionMontana Energy Education CouncilNADA ScienticNASANational Association of State Energy OcialsNational FuelNational GridNational Hydropower AssociationNational Ocean Industries AssociationNational Renewable Energy LaboratoryNebraska Public Power DistrictNew Mexico Oil CorporationNew Mexico Landman’s AssociationNRG Energy, Inc.NSTAROCI EnterprisesOshore Energy CenterOshore Technology ConferenceOhio Energy ProjectPacic Gas and Electric CompanyPaxton ResourcesPECOPecos Valley Energy Committee
Petroleum Equipment Suppliers AssociationPhillips 66PNMRead & Stevens, Inc. Rhode Island Oce of Energy ResourcesRiverWorks DiscoveryRobert ArmstrongRoswell Geological SocietySandia National LaboratorySaudi AramcoSchneider ElectricScience Museum of VirginiaC.T. Seaver TrustShellShell ChemicalsSnohomish County Public Utility District–WASociety of Petroleum EngineersDavid SorensonSouthern CompanySouthern LNGSouthwest GasSpace Sciences University–Laboratory of the University of California BerkeleyTennessee Department of Economic and Community Development–Energy DivisionTioga EnergyToyotaTri-State Generation and TransmissionTXU EnergyUnited Parcel ServiceUnited States Energy AssociationUnited Way of Greater Philadelphia and Southern New JerseyUniversity of Nevada–Las Vegas, NVUniversity of TennesseeUniversity of Texas - AustinUniversity of Texas - TylerU.S. Department of EnergyU.S. Department of Energy–Hydrogen ProgramU.S. Department of Energy–Oce of Energy Eciency and Renewable EnergyU.S. Department of Energy–Oce of Fossil EnergyU.S. Department of Energy–Wind for SchoolsU.S. Department of Energy–Wind Powering AmericaU.S. Department of the Interior–Bureau of Land ManagementU.S. Energy Information AdministrationVan Ness FeldmanVestasVirgin Islands Energy OceWest Bay ExplorationW. Plack Carr CompanyYates Petroleum Corporation
©2013 The NEED Project P.O. Box 10101, Manassas, VA 20108 1.800.875.5029 www.NEED.org