energy filtered electron microscopy (efem) of overbased reverse micelles
TRANSCRIPT

Ultramicroscopy 30 (1989) 321-328 321 North-Holland, Amsterdam
ENERGY FILTERED ELECTRON MICROSCOPY (EFEM) OF OVERBASED REVERSE MICELLES
J.M. MARTIN, J.L. MANSOT and M. HALLOUIS
Ecole Centrale de Lyon, Laboratoire de Technologie des Surfaces, UA CNRS 855, 36 Avenue Guy de Collongue, BP 163, F-69131 Ecully Cedex, France
Received 15 February 1989
Overbased calcium alkylaryl sulfonate reverse micelles of core diameter 10-15 nm are examined by energy filtered electron microscopy (EFEM). Both selected area EELS spectra and electron spectroscopic images (ESIs) are obtained and discussed. Low-loss imaging permits high resolution inelastic images showing good chemical resolution of the calcium-rich core and of the organic shell (2-3 nm thick). Core-loss imaging of carbon and calcium edges confirms the location of these different elements. EELS spectra on core edge regions are interpretated in terms of electronic transitions of core levels to antibonding molecular orbitals. With these assumptions, the EELS spectrum of overbased micelles is in good agreement with the molecular structure of the different elements constituting the colloid. Inelastic imaging of reverse micelles is mainly interpreted by double elastic/inelastic scattering of fast electrons considering both the micelle material and the supporting film.
1. Introduction 2. Experiment
Reverse micellar system have wide applications in many technological fields (catalysis, detergency, lubrication, etc.). Such systems are generally dis- persion, in hydrocarbons, of organometallic re- verse micelles, consisting mainly of a mineral core surrounded (or encapsulated) by an organic shell made up of amphiphilic molecules such as organic acids, alkylaryl sulfonic acids.
The micelles studied in this paper, by means of electron energy filtered imaging on a transmission electron microscope (TEM Zeiss 902), are mainly made up of a calcium carbonate core (diameter 10-15 nm) surrounded by didodecylbenzene sulfonic molecules (17 ,~ length). These specimens are studied not only in pure elastic imaging mode but also in inelastic imaging mode using both low-loss (plasmon region) and core-loss imaging, showing capabilities of inelastic imaging in the field of colloid science.
2.1. Products
The systems studied in this paper are anticorro- sive additives, consisting of a dispersion in hexane of overbased calcium alkylarylsulfonate. Such
?0A
Fig. 1. Schematic representation of an overbased calcium al- kylaryl sulfonate micelle.
0304-3991/89/$03.50 © Elsevier Science Publishers B.V. (North-Holland Physics Publishing Division)

322 J.M. Martin et al. / E F E M of overbased reverse rnicelles
compounds can be schematically drawn as in fig. 1. The mineral core, mainly made up of amorphous calcium carbonate [1], has a mean diameter of 12 nm and is surrounded by an organic shell of didodecylarylsulfonyl radicals.
For this study the anticorrosive additive is purified by centrifugation and dialysis in hexane through an elastomer membrane in order to eliminate solid particles and impurities. The re- maining colorless dispersion is used for the TEM studies.
2.2. Specimen preparation
Two preparations are used for the analytical TEM studies: - Preparation for high resolution spectroscopy. In this case, some drops of highly diluted micellar dispersion are deposited at the water surface in a Langmuir trough. The pressure collapse is ob- tained by reduction of the area occupied by the micelles after hexane evaporation, and a mono- micellar film is deposited on the holey carbon grid by dipping it into the water. - Preparation for imaging. For this purpose one drop of highly diluted micellar dispersion in hexane is deposited onto the holey carbon grid (thickness 150 4). After evaporation of hexane the micelles stick on the carbon film by Van der Waals interaction.
2.3. Experimental procedure for inelastic imaging
For the whole study inelastic imaging has been performed after EELS spectra recording on the specimen in order to identify the inelastic signals and interpret the resulting contrast in inelastic imaging.
EELS spectra were sequentially recorded on a Zeiss CEM 902 transmission electron microscope equipped with a prism mirror prism spectrometer and an electron detector (photomultiplier). EELS spectra were recorded in diffraction coupling mode at a magnification of 250,000, the maximum scattering angle being 17 mrad and the energy resolution being 1.5 eV (measured on the elastic peak). The analyses were performed on 120
diameter zone, the 3 mm entry aperture of the photomultiplier acting as a selected-area aperture.
Mainly two energy loss regions have been in- vestigated: - low-loss region including carbon plasmon exci- tation (24 eV) and M2. 3 calcium edge; - core-loss region including the K absorption edge of carbon (284 eV) and the L2. 3 edge of calcium (347 eV).
3. Results and discussion
3.1. Low-loss region
Fig. 2 shows a comparison between spectra obtained with a 120 A probe diameter on different areas of the sample, namely on the core of the micelle (1) including the mineral core, the organic layer and the carbon support, the organic shell (2)
" ~ carbon support
~ E ~ 2 5 e V
j l
o s o 1;~o e v
Fig. 2. Electron energy-loss spectra obtained on a micelle deposited on a carbon film (area analysed 12 nm); (1) calcium-rich core region (including organic shell and carbon support; (2) organic shell region (including the carbon support);
(3) carbon film only.
J.M. Martin et aL / E F E M of overbased reverse micelles 323
including also the support, and the carbon film alone (3).
Comparison of the spectra shows clearly that at the level of the carbon plasmon loss, around 25 eV, the inelastic signal coming from the micellar ~naterial is higher than that due to the carbon ;upport only. In the case of the signal coming !rom the organic shell (area 2) the increase can be :xplained as a simple thickness effect, the organic tayer being essentially made of hydrocarbon material and the thickness probed being of the order of the carbon film thickness.
In the case of the spectrum coming from the mineral core region (1), the inelastic signal corre- sponds to a "composite structure" including the carbon film (--- 150 A thick) twice the thickness of the organic layer ( ~ 34 A) and the size of the calcium carbonate core (---120 ,~). The low-loss peak near 25 eV is also due to a combination of low-loss signals coming from hydrocarbons, the carbon layer and the calcium carbonate core.
Fig. 3 presents low-loss EELS spectra of a carbon layer (a), pure calcium carbonate (b), and the micellar film (c). The resulting peak on the mineral core presents only a small enlargement in the low-energy range and a slight decrease of its maximum amplitude near 25 eV compared to the spectrum obtained on the area 2 (organic shell
Ca M2, 3
:j ! I I r " ~ e v
0 25 50 75
Fig. 3. Low-loss EELS spectra of reference compounds: (a) amorphous carbon; (b) calcium carbonate as calcite; (c) film of
micelles.
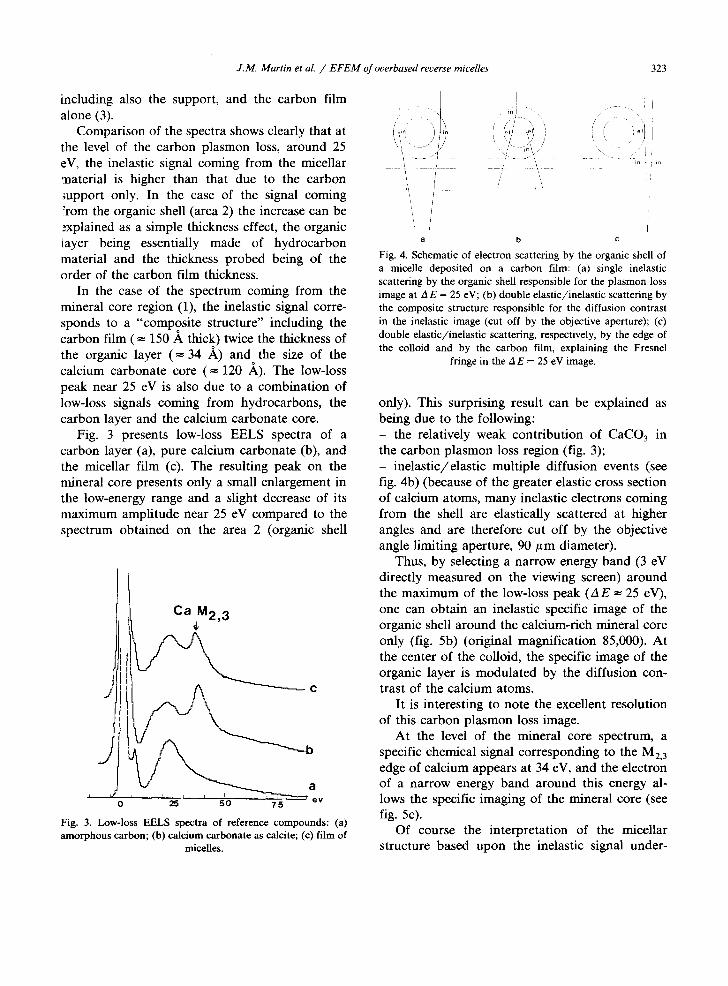
I
t , , ..... J,,/
a
I !
\
• , in " l /
7
, ,, }
t ' ii; oi
b c
Fig. 4. Schematic of electron scattering by the organic shell of a micelle deposited on a carbon film: (a) single inelastic scattering by the organic shell responsible for the plasmon loss image at z~ E = 25 eV; (b) double elastic/inelastic scattering by the composite structure responsible for the diffusion contrast in the inelastic image (cut off by the objective aperture); (c) double elastic/inelastic scattering, respectively, by the edge of the colloid and by the carbon film, explaining the Fresnel
fringe in the A E = 25 eV image.
only). This surprising result can be explained as being due to the following: - the relatively weak contribution of CaCO3 in the carbon plasmon loss region (fig. 3); - inelast ic/elast ic multiple diffusion events (see fig. 4b) (because of the greater elastic cross section of calcium atoms, many inelastic electrons coming from the shell are elastically scattered at higher angles and are therefore cut off by the objective angle limiting aperture, 90/~m diameter).
Thus, by selecting a narrow energy band (3 eV directly measured on the viewing screen) around the maximum of the low-loss peak (AE = 25 eV), one can obtain an inelastic specific image of the organic shell around the calcium-rich mineral core only (fig. 5b) (original magnification 85,000). At the center of the colloid, the specific image of the organic layer is modulated by the diffusion con- trast of the calcium atoms.
It is interesting to note the excellent resolution of this carbon plasmon loss image.
At the level of the mineral core spectrum, a specific chemical signal corresponding to the M2, 3 edge of calcium appears at 34 eV, and the electron of a narrow energy band around this energy al- lows the specific imaging of the mineral core (see fig. 5c).
Of course the interpretation of the micellar structure based upon the inelastic signal under-

324 J.M. Martin et al. / E F E M of overbased ret~erse micelles
Fig. 5. Low-loss electron spectroscopic imaging (ESI) of an overbased micelle (original magnification ×85000): (a) elastic bright field; (b) carbon plasmon loss image A E = 25 eV -4- 2 eV; (c) calcium M 2.3 edge image A E = 34 + 2 eV.
standing can be related to the structure deduced from the pure elastic image (fig. 5a), the interpre- tation being in this case made in terms of elastic cross section differences between carbon and calcium, the mineral core (in dark) constituted of calcium carbonate producing a higher amplitude contrast than the carbon shell.
It is also interesting to note that with the very narrow selecting slit ( - - 3 eV) the phase contrast of the carbon layer can be preserved in the inelas- tic image• The white fringe around the particle (fig. 5b) is also attributed to the diffraction of electrons by the edge (Fresnel fringe); it cannot be confused with a surface or interface plasmon loss image, the energy of which should be inferior to 25 eV. Because there is no obvious correlation between elastic and inelastic events, the atom (nucleus) entering in elastic collision with a fast electron ignores previous inelastic collisions with
other atomic electrons. So it can be thought that the inelastic electrons contain the same ratio of scattering contrast as the purely elastic ones [2]. Nevertheless, the observation of phase contrast with inelastic imaging is limited by several factors: - the size of the objective aperture as in the conventional TEM; - the value of the energy loss for imaging (due to the drastic decrease of the inelastic signal, only the low-loss region can be effectively used (AE < 40 eV) to choose the defocus of the objective lens on the viewing screen);
- the energy width of the selecting slit in the back focal plane of the spectrometer (due to the chro- matic aberration, a narrow slit (3-5 eV) is neces- sary to preserve the resolution of the objective lens, but this also limits drastically the signal in the final image); for example, one can estimate that the inelastic signal to obtain the image fig. 5b

J.M. Martin et al. / E F E M of overbased reverse micelles 325
is one hundredth of the total elastic signal (fig. 5a).
Nevertheless, in our case there is an advantage in imaging phase contrasts in the inelastic mode; as strong single elastic diffusion contrast of calcium atoms has been eliminated by filtering in the spectrometer, the A E = 25 eV image appears as if the elastic image was spatially processed. Phase contrast due to the colloid is much more visible. The Ca M2. 3 image is too noisy to observe diffraction contrast.
Taking into account these different facts, the thickness of the organic layer a round the mineral core can be estimated to vary between 2.5 and 3 nm (neglecting the edge fringe). As the theoretical length of the surfactant molecule is only 1.7 nm, the discrepancy can be attr ibuted to solvant mole- cules interpenetrated in the shell. This effect is well known in light scattering experiments (pho- ton correlation) on this kind of compound [3].
In future work, it will be interesting to try to obtain low-loss images on the surface plasmon peak of calcium carbonate ( A E = 18 eV) and the ~r/~r* transition of the aromatic part of the mole- cule ( A E = 7 eV).
2 . C o r e - l o s s i m a g i n g
The spectrum obtained in the range 250-400 eV on a thin film of micelles is shown in fig. 6c. Classically, the near edge structure of the carbon K edge can be interpreted in terms of electronic transitions from the ls level to ant ibonding molec- ular orbitals of the different compounds constitut- ing the micelles [4] (see table 1). Figs. 6a and 6b present the K edges of carbon in graphitic carbon and in calcium carbonate (calcite). In the first case the edge presents mainly two structures, one sharp at 284 eV corresponding to the electronic transi- tion from ls level to ant ibonding ~rg* molecular orbital corresponding to double bonds of carbon (sp2 hybridation), the other more extended struc- tu re presenting a max imum at 291 eV corresponds to the electronic transition ls to o~ due to the existence of single covalent C - C bonds structures (including edge effects in graphitic carbon planes).
1s/a'C_ 0
1 * . s/~ C-O ,/~ + / \
ls/~*C-C ~" -~ '~--~ C ,/ i , /\
f rl e i
" ~ ~- - - b
.! ~ - \
L ] ~ a ~,[ r / ; 1
I ?
? ----1--/ J ' ) e V
280 3 0 0 Fig. 6. (Core loss EELS spectra of: (a) carbon K edge in graphitic carbon; (b) carbon K edge in CaCO 3 (calcite); (c)
carbon K edge in the overbased micelle.
In the case of calcium carbonate (fig. 6b), the carbon K edge presents also two sharp structures at 288 and 299 eV corresponding respectively to the ls-~r* and l s - o * transit ion of the ls electron of carbon in the carbonyl group (sp2 hybridation). The shift between these two transitions compar ing to carbon K edge in amorphous carbon is due to the chemical shift in t roduced by the highly elec- tronegative oxygen atoms.
The fine structure of the K absorpt ion edge of carbon in micelles (fig. 6c) can be considered as a linear combina t ion of the spectra of carbon in
Table 1 Electronic transitions from the ls level to antibonding molecu- lar orbitals in different chemical bonding of carbon (the energy loss corresponds to the maximum of peaks)
Electronic Energy loss Reference transition (eV) compound
ls ~ vr * c-c 284 Graphite ls ~ o* c-c 291 Graphite ls --, Ir * c-o 288 CaCO 3 (calcite) ls ~ a* c-o 299 CaCO 3 (calcite)

326 J.M. Martin et aL / E F E M of overbased reverse mieelles
hydrocarbon compounds and of carbon in calcium carbonate form. We found effectively all the elec- tronic transition previously described in the stan- dard compounds. This interpretation leads one to envisage the possibility of the quantification of carbon in the carbonyl group upon carbon in hydrocarbons.
At 347 eV the spectrum of micelles presents two sharp peaks corresponding to the L23 edges of calcium (2pl/2 2p3/2 --, 3d transition).
Taking into account the understanding of the inelastic signal in the range 250-400 eV and the fact that the jump ratio is sufficiently high to do imaging, the simple Ottensmeyer method has been used in the Zeiss microscope [5]: at the level of the K absorption edge of carbon two images with a selecting slit of 10 eV were recorded at 275 _+ 5 eV and 295 + 5 eV respectively and subtracted in order to obtain the "carbon net distribution". The same process has been employed for the L2, 3 Ca absorption edge at 340 + 5 eV and 355 + 5 eV to
Fig. 7. Core-loss electron spectroscopic images (ESIs) of over- based micelles: (a) carbon net distribution (AE = 284 eV); (b)
calcium net distribution (zl E = 347 eV).
obtain the calcium distribution. The two inelastic images are presented in fig. 7. Comparison of these chemical images with the low-loss ones (fig. 5) shows an excellent agreement for the location of carbon and calcium in the micelles.
4. Conclusion
Overbased calcium alkylaryl sulfonate micelles deposited on a thin carbon film were studied by energy filtered electron microscopy (EFEM) at 80 kV in the Zeiss 902 Transmission Electron Micro- scope.
The collection of electron energy-loss spectra allowed us a complete interpretation of inelastic signals from this material and led to well ex- plained electron spectroscopic images both in the low-loss and the core-loss regions.
The main results are the following: The high amplitude of the signal in the low-loss
region permitted high resolution inelastic imaging of the distribution of hydrocarbons and calcium atoms in the micelle. The plasmon-loss image of carbon gives a definite picture of the organic shell surrounding the calcium-rich mineral core.
Phase contrasts can be preserved in low-loss inelastic images by using small energy-selection apertures. - Core-loss EELS spectra were obtained from a Langmuir film of micelles. The analysis of fine structures in both carbon K edge and calcium L23 edge was made on the basis of electronic transi- tions from core levels to molecular orbitals in the material. The assignment of peaks was in good agreement with the expected molecular structure of the elements in the micelle. - Core-loss images were obtained from carbon and calcium edges. The net distributions of ele- ments correspond to low-loss images and confirm the location of carbon and calcium atoms in the micelle. - The different contrasts observed were success- fully interpreted in terms of double inelast ic / elastic diffusion processes, considering the effect of both the micelle material and the carbon sup- port. The specific image of the organic shell corre- sponds to a mass thickness effect modulated by

J.M. Martin et al. / EFEM of overbased reverse miceUes 327
diffusion contrast of calcium atoms and phase contrast existing in the zero-loss image.
Future work will include specific images of the aromatic par t of the molecule (Tr orbital imaging) and the examinat ion of smaller micelles.
for valuable help concerning the interpretat ion of electron spectroscopic images.
References
Acknowledgements
The authors thank E L F C o m p a n y for financial support and D. Faure and P. Hoornaer t for their helpful comments and for providing reference compounds .
The authors thank also Dr. R. Bauer f rom Zeiss
[1] J.M. Martin, M. Belin and J.L. Mansot, J. Physique 47 (1986) 887.
[2] Z.L. Wang, in: Proc. 46th Annual EMSA Meeting, Milwaukee, 1988, Ed. G.W. Bailey (San Francisco Press, San Francisco, 1988) p. 818.
[3] I. Markovic et al., Colloid Polymer Sci. 262 (1984) 648. [4] R.D. Leapman, P.L. Fejes and J. Silcox, Phys. Rev. B28
(1983) 2361. [5] R.F. Egerton, EELS in the Electron Microscope (Plenum,
New York, 1986).
