energy & environmental science - national renewable … · ... profits are too small relative...
TRANSCRIPT
2122 | Energy Environ. Sci., 2016, 9, 2122--2129 This journal is©The Royal Society of Chemistry 2016
Cite this: Energy Environ. Sci.,
2016, 9, 2122
Economically sustainable scaling of photovoltaicsto meet climate targets†
David Berney Needleman,*a Jeremy R. Poindexter,a Rachel C. Kurchin,a
I. Marius Peters,a Gregory Wilsonb and Tonio Buonassisi*a
To meet climate targets, power generation capacity from photovoltaics (PV) in 2030 will have to be
much greater than is predicted from either steady state growth using today’s manufacturing capacity or
industry roadmaps. Analysis of whether current technology can scale, in an economically sustainable
way, to sufficient levels to meet these targets has not yet been undertaken, nor have tools to perform
this analysis been presented. Here, we use bottom-up cost modeling to predict cumulative capacity as a
function of technological and economic variables. We find that today’s technology falls short in two
ways: profits are too small relative to upfront factory costs to grow manufacturing capacity rapidly
enough to meet climate targets, and costs are too high to generate enough demand to meet climate
targets. We show that decreasing the capital intensity (capex) of PV manufacturing to increase manufacturing
capacity and effectively reducing cost (e.g., through higher efficiency) to increase demand are the most
effective and least risky ways to address these barriers to scale. We also assess the effects of variations
in demand due to hard-to-predict factors, like public policy, on the necessary reductions in cost. Finally,
we review examples of redundant technology pathways for crystalline silicon PV to achieve the necessary
innovations in capex, performance, and price.
Broader contextTo reduce CO2 emissions enough over the next fifteen years and avoid the worst effects of climate change will require dramatic increases in the deployment ofrenewable energy, photovoltaics (PV) in particular. Climate action plans call for 2–10 terawatts (TW) of PV by 2030. Current manufacturing capacity couldsupply enough for 1 TW of cumulative installations at the end of this period, implying that growth in manufacturing capacity is necessary. Industry roadmapsproject up to 2.6 TW but largely fail to assess whether these targets are economically feasible with today’s PV module technology. Addressing the question ofwhat technological innovations, if any, would enable rapid manufacturing scale-up requires a conceptual advance in modeling methodology. We address thischallenge by coupling three industry-validated models: a bottom-up cost model, an economically sustainable growth-rate calculator, and a constrainingdemand curve. This approach enables us to determine the sensitivity of PV industry growth to specific technological and economic variables, considering boththeir effect on the ratio of up-front factory costs to revenue and demand as a function of PV module price. Shifting the demand curve enables us to consider theeffects of different policy decisions, like a carbon tax or deployment subsidies.
1. Climate-driven deployment targetsfor photovoltaics
Recent studies show that carbon dioxide (CO2) emissions must peakin the next fifteen years to ensure a high probability of limitingaverage global warming to less than 1.5–2 1C above pre-industriallevels1–5 and thereby avoid the worst effects of climate change.
As global energy demand is expected to rise significantly over thesame period,1–2,6 achieving this goal will require the deploymentof terawatts of new low-carbon energy generation, comparedwith less than 1 TW of non-hydro renewables today.
Photovoltaics (PV) have several advantages compared with otherlow-carbon technologies: the vast size of the solar resource,6,7
the proven track record of reliability8–10 and bankability11 of PVinstallations, the rapidity with which new manufacturing capacitycan be brought online and projects developed and built,12 and theirmodular nature, which allows deployment in areas that may lackelectric grid infrastructure. Concordantly, aggressive PV deploymenttargets, ranging from 2–10 TW by 2030, are widely viewed as vitalto mitigate climate change (Fig. 1, green symbols/line).1,2,13–15
a Massachusetts Institute of Technology, Cambridge, MA 02139, USA.
E-mail: [email protected], [email protected] National Center for Photovoltaics, National Renewable Energy Laboratory, Golden,
CO 80401, USA
† Electronic supplementary information (ESI) available. See DOI: 10.1039/c6ee00484a
Received 16th February 2016,Accepted 11th April 2016
DOI: 10.1039/c6ee00484a
www.rsc.org/ees
Energy &EnvironmentalScience
PAPER
Ope
n A
cces
s A
rtic
le. P
ublis
hed
on 2
1 A
pril
2016
. Dow
nloa
ded
on 1
0/06
/201
6 20
:35:
27.
Thi
s ar
ticle
is li
cens
ed u
nder
a C
reat
ive
Com
mon
s A
ttrib
utio
n 3.
0 U
npor
ted
Lic
ence
.
View Article OnlineView Journal | View Issue
This journal is©The Royal Society of Chemistry 2016 Energy Environ. Sci., 2016, 9, 2122--2129 | 2123
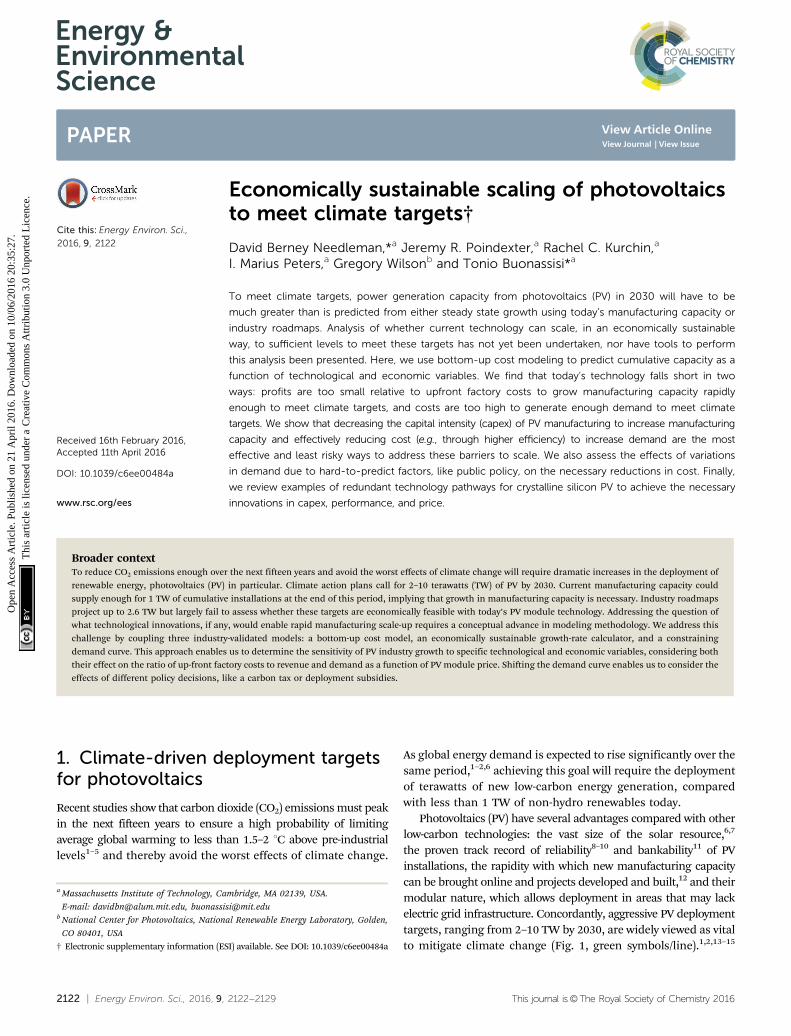
We consider a range of climate and CO2 reduction scenarios,which results in a range of PV deployment targets. The high endprovides the lowest risk to the climate.
Future deployment of PV depends on a number of factors. Wewill focus this discussion on the upper bound imposed by onetechnical constraint, the annual manufacturing capacity for PVmodules, and one market constraint, total demand for PV.Manufacturing capacity limits annual installed capacity, whichin turn limits cumulative installed capacity each year. Demandfor PV modules has a strong dependence on public policy and thecost of competing (e.g., fossil fuel) and supporting (e.g., balance-of-systems, energy storage) technologies. However, under a givenset of assumptions about the economic and technology environ-ment, total demand can be given as a function of PV moduleprice. This relationship is called a demand curve.
As shown by the pink curve in Fig. 1, current PV manu-facturing capacity16 is sufficient to produce just under 1 TW inthe next 15 years. Thus, growth in manufacturing capacity‡ isneeded to meet climate-driven deployment targets. Accordingto market research,16 under the current cost structure for PVmodules, total demand would be less than 1 TW even if theirprice was equal to their variable cost of production.
Several PV industry projections15,17–26 (Fig. 1, blue symbols/lines) predict deployment comparable to some climate-driventargets. The most aggressive projections fall well short of targetsthat minimize climate risks, but even these projections implysignificant growth in manufacturing capacity and easing ofdemand constraints. However, most publicly available projections
do not establish whether current technology can reach thesetargets and fail to identify effective pathways to achieve thenecessary manufacturing capacity and demand.
In this work, we use bottom-up cost modeling to determine(1) if current crystalline silicon PV module technology canachieve growth rates commensurate with climate targets with-out external financial support and (2) what innovation-drivencost reductions are needed for sufficient demand to achievethese targets. We find that dramatic reductions in the capitalintensity and cost of PV module manufacturing are needed. Thetechnology pathways we identify to achieve these goals are alsolikely to greatly reduce the energy and CO2 payback times forPV modules.27
2. PV manufacturing cost andgrowth models
Our cost model,§ 28,29 presented schematically in Fig. 2, producesa discounted cash flow for a hypothetical PV manufacturer bysumming the individual cost components of the manufacturingprocess and subtracting these from revenues and financing. Insimple terms, the ‘‘cash in’’ variables are (1) net revenues from PVmodule sales, expressed per unit as operating margin (margin),and (2) debt financing. Because debt typically leverages equitywithin the company, we use the variable debt/equity ratio, whichwe hold constant over time.
The ‘‘cash out’’ variables (before taxes and interest on debtare paid) are the fixed costs of new factories and equipment(expressed as capex) and the variable costs of production. Becausewe are interested in the cost per unit power, not per panel, wedivide both fixed and variable costs by the power produced by themodule. We use efficiency as a proxy variable for module power,dollars per watt as the unit of cost, and dollars per watt of installedannual capacity as the unit of capex.28,70 To estimate an upperbound for manufacturing capacity growth rate, we assume that nodividends are paid and all profits (after taxes and interest on debt)are reinvested in expansion.28
The ratio of ‘‘cash in’’ (margin and debt) to capex determineshow quickly new factories can be built and therefore how quicklyPV manufacturing capacity can grow. Thus, increases in ‘‘cashin’’ or decreases in capex increase growth rate. To set an upperbound on cumulative installed capacity, we assume 100% utiliza-tion of manufacturing capacity. Because we consider a 15-yeartime horizon while PV panels typically last at least 20 years, wefurther assume no replacement. Therefore, cumulative installedcapacity is just the sum of the previous year’s cumulative capacityand the manufacturing capacity in the current year. Manufacturingcapacity in the current year is manufacturing capacity in theprevious year times one plus the growth rate.
The growth rate calculator begins by assuming a constantmargin. The product of this margin and the sum of fixed andvariable costs sets a selling price. If cumulative capacity exceeds
Fig. 1 PV deployment targets consistent with average warming less than2 1C above pre-industrial levels (green symbols and line), industry projec-tions of PV deployment (blue symbols and lines), and upper bound offuture installations with no additional manufacturing capacity (pink line).If data was represented as lines in the source, it is represented as lines here.If it was reported as individual data points in the source, it is represented bysymbols here. Sources for specific data can be found in ESI,† Fig. S1.
‡ The growth rate of cumulative installed capacity is often quoted for the PV industry.In this paper, we will use ‘‘growth’’ and ‘‘growth rate’’ to refer only to growth ofmanufacturing capacity (i.e. annual, not cumulative, installations).
§ The cost model is available for download as an Excel file in the ESI,† as are theMatlab scripts used to calculate manufacturing growth rate and thereby annualand cumulative installations over time.
Paper Energy & Environmental Science
Ope
n A
cces
s A
rtic
le. P
ublis
hed
on 2
1 A
pril
2016
. Dow
nloa
ded
on 1
0/06
/201
6 20
:35:
27.
Thi
s ar
ticle
is li
cens
ed u
nder
a C
reat
ive
Com
mon
s A
ttrib
utio
n 3.
0 U
npor
ted
Lic
ence
.View Article Online
2124 | Energy Environ. Sci., 2016, 9, 2122--2129 This journal is©The Royal Society of Chemistry 2016
demand at this price, the calculator takes the price correspondingto this capacity on the demand curve, and uses the (lower) marginimplied by this price. This reduced margin limits growth. If pricefalls below variable cost, production ceases altogether. For thiswork, we use a power law fit to a demand curve from ref. 16containing historical data on PV module sales and projecteddemand as a function of price (see Fig. 2). We fit the data becausethe historical data is not single-valued. For more details on thesevariables, calculations, and the demand curve, see ESI† and ref. 29.
We perform a sensitivity analysis on each of the variables inour cash flow to discern which have the greatest potential toincrease growth rate and ease the demand constraint. For ourbaseline calculation, around which we vary these parameters, weuse current industry data for variable costs, capex, and efficiency,set margin such that the net profit is equal to the cost ofcapital,30 and use a debt/equity ratio of 1 : 1. These baselineparameters are listed in Table S1 in the ESI,† and details of howthey were selected are in ESI† and ref. 28 and 29.
We model crystalline silicon because it represents over 90%of the PV market,31 has dominated for decades,32 has a largeexisting manufacturing base, is sufficiently abundant to scale totens of terawatts,33 and reliable cost data is available. However,our sustainable growth modeling methodology, and thereforethe capex and cost implications, could apply to any technology.This includes commercially available thin-film technologies likecadmium telluride and copper (indium, gallium) diselenide,if they are not limited by the availability of Te and In.14,34,35 Giventhe aggressive capex, variable cost, and efficiency improvementsdemanded by the advanced scenario, non-silicon technologies havethe challenge of scaling from a lower baseline, but an opportunityto gain market share through significantly higher margins andlower capex; further discussion is provided in ESI.†
3. Sensitivity analysis of cost andgrowth model variables
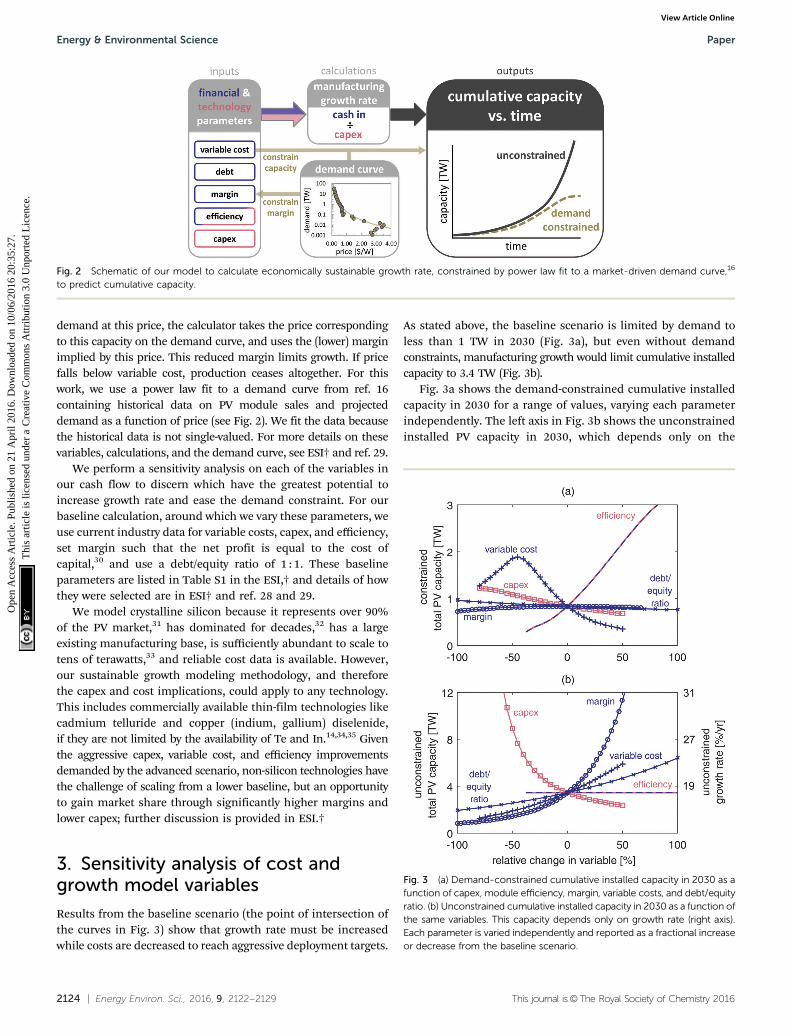
Results from the baseline scenario (the point of intersection ofthe curves in Fig. 3) show that growth rate must be increasedwhile costs are decreased to reach aggressive deployment targets.
As stated above, the baseline scenario is limited by demand toless than 1 TW in 2030 (Fig. 3a), but even without demandconstraints, manufacturing growth would limit cumulative installedcapacity to 3.4 TW (Fig. 3b).
Fig. 3a shows the demand-constrained cumulative installedcapacity in 2030 for a range of values, varying each parameterindependently. The left axis in Fig. 3b shows the unconstrainedinstalled PV capacity in 2030, which depends only on the
Fig. 2 Schematic of our model to calculate economically sustainable growth rate, constrained by power law fit to a market-driven demand curve,16
to predict cumulative capacity.
Fig. 3 (a) Demand-constrained cumulative installed capacity in 2030 as afunction of capex, module efficiency, margin, variable costs, and debt/equityratio. (b) Unconstrained cumulative installed capacity in 2030 as a function ofthe same variables. This capacity depends only on growth rate (right axis).Each parameter is varied independently and reported as a fractional increaseor decrease from the baseline scenario.
Energy & Environmental Science Paper
Ope
n A
cces
s A
rtic
le. P
ublis
hed
on 2
1 A
pril
2016
. Dow
nloa
ded
on 1
0/06
/201
6 20
:35:
27.
Thi
s ar
ticle
is li
cens
ed u
nder
a C
reat
ive
Com
mon
s A
ttrib
utio
n 3.
0 U
npor
ted
Lic
ence
.View Article Online
This journal is©The Royal Society of Chemistry 2016 Energy Environ. Sci., 2016, 9, 2122--2129 | 2125
growth rate. The right axis in Fig. 3b shows the correspondinggrowth rates.
This sensitivity analysis shows that three of our variables(margin, debt/equity ratio, and capex) can increase growth ratebut have little potential to reduce cost and increase demand,while the other two (variable costs and efficiency) can reducecost but have little potential to increase growth rate.
Increasing margin increases growth rate by increasingrevenue from sales (a major component of ‘‘cash in’’). However,PV modules have become a commodity with little productdifferentiation. Module manufacturers are therefore price-takerswith little ability to impact margin,36,37 and we see little practicalopportunity to increase growth rate by increasing margins.
Increased debt without significant reductions in cost willincrease growth temporarily. Ultimately, however, once thedemand ceiling is reached, margin will be eroded, leading toreduced revenue, reduced growth and lower total installed capacity.The increased debt approach is therefore risky for manufacturers.Increased debt is also a weaker lever on growth than reducingcapex, which reduces the cost for a new factory. Assuming constant‘‘cash in,’’ reduced capex increases the rate at which new factoriescan be built and manufacturing capacity added.
In our growth model, the only positive effect reducing variablecost has on installed capacity is triggering a reduction of pricedue to the assumption of constant margin. We assume marginsare constant because technology diffusion and the treatment ofPV modules as a commodity by consumers and installers drivedown prices in response to reduced variable costs. Lower pricesmean lower revenue (‘‘cash in’’). At constant capex, that meansslower growth. Therefore, while reducing variable costs eases thedemand constraint on total installed PV capacity, it reducesgrowth rate as well. This trade-off leads to the maximum in thevariable costs curve in Fig. 3a.
Increasing efficiency, on the other hand, reduces both fixed andvariable costs (per unit power). Assuming efficiency increases whilecapex and variable costs per module remain constant, higherefficiency can ease the demand constraint while maintaining aconstant growth rate. This constant growth rate is indicated by theflat efficiency curve in Fig. 3b.
In certain instances, the financial incentives experienced byan individual company can oppose the goal of maximizing PVdeployment. For example, to maximize short-term revenue, acompany is motivated to reduce costs, striving for first-moveradvantage or struggling to keep up with competitors. However,once a cost-reducing innovation spreads throughout the entireindustry and prices are reduced across the board, lower pricesdecrease margins in absolute dollars.38 Thus, the so-called ‘‘race tothe bottom’’ generally results in decreased sustainable manufac-turing growth rates, except for the first movers. In contrast, across-the-board increases in sustainable manufacturing growth rates canbe achieved by reducing capex. Note that even if the entire industrylowers capex, the sustainable growth rate will increase for allcompanies, as new factories cost less money to build. However,the longer-term investment in capex reduction does not have asstrong an impact on short-term revenue as other cost-reductionmeasures; thus, capex reduction is often not prioritized in
industry roadmaps. Other trade-offs between the techno-economicinputs shown in Fig. 3 are analyzed in Fig. S3 in the ESI.†
4. PV deployment scenarios
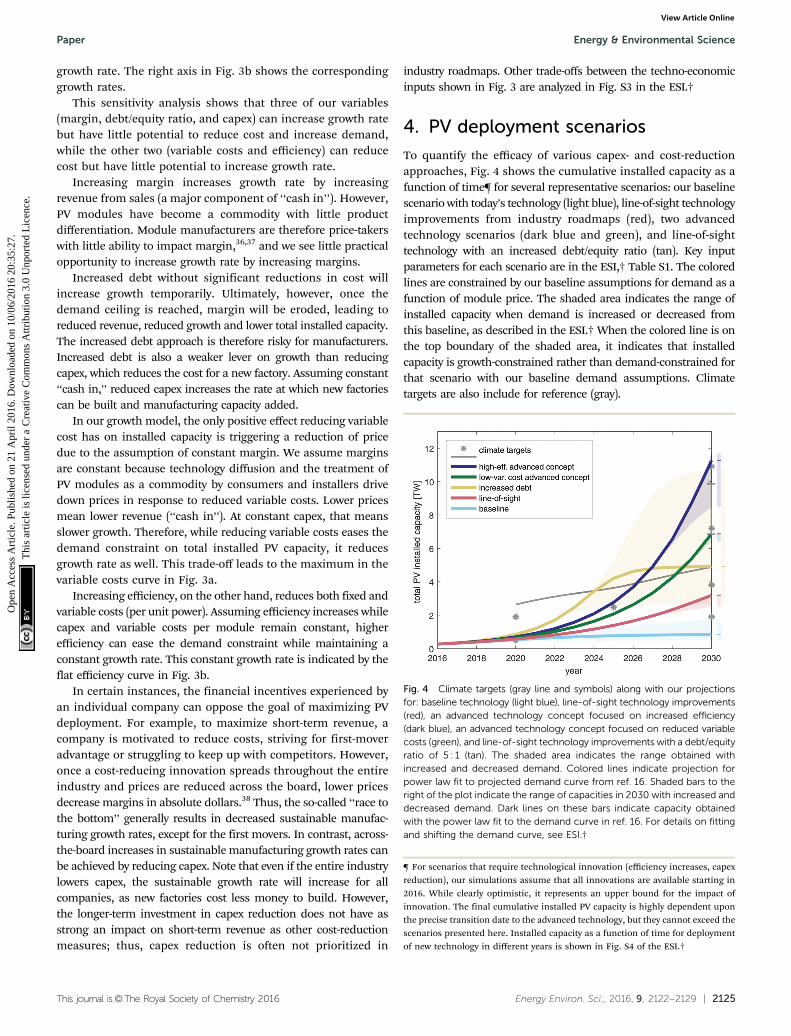
To quantify the efficacy of various capex- and cost-reductionapproaches, Fig. 4 shows the cumulative installed capacity as afunction of time¶ for several representative scenarios: our baselinescenario with today’s technology (light blue), line-of-sight technologyimprovements from industry roadmaps (red), two advancedtechnology scenarios (dark blue and green), and line-of-sighttechnology with an increased debt/equity ratio (tan). Key inputparameters for each scenario are in the ESI,† Table S1. The coloredlines are constrained by our baseline assumptions for demand as afunction of module price. The shaded area indicates the range ofinstalled capacity when demand is increased or decreased fromthis baseline, as described in the ESI.† When the colored line is onthe top boundary of the shaded area, it indicates that installedcapacity is growth-constrained rather than demand-constrained forthat scenario with our baseline demand assumptions. Climatetargets are also include for reference (gray).
Fig. 4 Climate targets (gray line and symbols) along with our projectionsfor: baseline technology (light blue), line-of-sight technology improvements(red), an advanced technology concept focused on increased efficiency(dark blue), an advanced technology concept focused on reduced variablecosts (green), and line-of-sight technology improvements with a debt/equityratio of 5 : 1 (tan). The shaded area indicates the range obtained withincreased and decreased demand. Colored lines indicate projection forpower law fit to projected demand curve from ref. 16. Shaded bars to theright of the plot indicate the range of capacities in 2030 with increased anddecreased demand. Dark lines on these bars indicate capacity obtainedwith the power law fit to the demand curve in ref. 16. For details on fittingand shifting the demand curve, see ESI.†
¶ For scenarios that require technological innovation (efficiency increases, capexreduction), our simulations assume that all innovations are available starting in2016. While clearly optimistic, it represents an upper bound for the impact ofinnovation. The final cumulative installed PV capacity is highly dependent uponthe precise transition date to the advanced technology, but they cannot exceed thescenarios presented here. Installed capacity as a function of time for deploymentof new technology in different years is shown in Fig. S4 of the ESI.†
Paper Energy & Environmental Science
Ope
n A
cces
s A
rtic
le. P
ublis
hed
on 2
1 A
pril
2016
. Dow
nloa
ded
on 1
0/06
/201
6 20
:35:
27.
Thi
s ar
ticle
is li
cens
ed u
nder
a C
reat
ive
Com
mon
s A
ttrib
utio
n 3.
0 U
npor
ted
Lic
ence
.View Article Online
2126 | Energy Environ. Sci., 2016, 9, 2122--2129 This journal is©The Royal Society of Chemistry 2016
Line-of-sight technology reduces wafer thickness from 180 mmwith 130 mm of kerf (sawdust) to 120 mm with 130 mm of kerf.Additional modest reductions in capex and variable costs and anincrease in efficiency are included as well. In this scenario, a totalinstalled capacity of 3.2 TW is achievable by 2030. Gains in growthrate due to reduced capex are offset by reductions in revenue dueto reduced variable costs, so the line-of-sight technology actuallyhas a slightly lower unconstrained growth rate than baseline.Total installed capacity is limited by both price (3.2 TW) andgrowth rate (3.3 TW) for line-of-sight technology, indicating aneed to reduce both capex and cost further.
We therefore consider scenarios for two advanced PV techno-logy concepts. In both scenarios, wafer thickness and kerf arereduced to 20 mm each (the equivalent of 40 mm-thick kerflesswafers), which significantly reduces both capex and variablecosts. Further deep reductions in capex are then coupled toeither (1) a further large reduction of variable cost and the sameincrease in efficiency as in the line-of-sight scenario, or (2) amodest further reduction of variable costs and a large increase inefficiency (which further reduces both capex and variable costs).Scenario 1 represents direct reduction of variable costs byreducing the cost of inputs to production like electricity andsilver, either through price reductions, quantity reductions, orreplacement. This approach results in reduced revenue, whichlimits growth rate, and a cumulative installed capacity in 2030 of6.9 TW. Scenario 2, which drives cost reduction primarily byincreasing efficiency, results in faster growth and a cumulativeinstalled capacity in 2030 of 11.2 TW.
There are clear and redundant pathways to achieve thereductions in capex and variable costs, as well as the improve-ments in efficiency described in the advanced scenarios. Over 30%of the capex in PV module manufacturing is in the production ofpolysilicon. Therefore, reduction of the silicon wafer thicknessfrom its current value of about 180 mm to 10–20 mm (withequivalent reductions in kerf loss, or 30–50 mm with no kerfloss) would eliminate 90% of this capex. Multiple technologiesexist, some of which have already demonstrated high efficiencyon wafers as thin as 35 mm, including silicon grown epitaxiallydirectly from vapor sources,39 silicon wafers produced directlyfrom molten silicon without casting and wire-sawing,40 andthinner wire saws.41–43 Thinner wafers also contribute to higherthroughput processing, further reducing capex. Specifically, thethroughput of crystal growth, ingot cropping, wire sawing, andwet chemical steps are increased by having thinner wafers.
Czochralski growth of monocrystalline silicon is very capital-intensive, representing over 15% of the capex in a monocrystallinesilicon PV module.29 Directional solidification of multicrystallinesilicon is relatively low capex, and recent results on ‘‘high-performance’’ multicrystalline silicon offer promising routes tohigh efficiency.39,44 The capex associated with multicrystallinesilicon could be reduced by planned moves to larger ingots31,45
(further increasing throughput). Czochralski growth could bereplaced by multicrystalline silicon, one of the growth techni-ques mentioned above, or another technique like kyropolisgrowth, which has demonstrated good material quality withpotentially low capex.46
Further capex reductions are available through a variety ofprocess modifications. Some examples follow. Replacing slurrywire sawing with structured or diamond wire eliminates equip-ment for slurry collection and increases throughput.41 Kerflesswafering would also eliminate this equipment and the equip-ment used to recondition scrap silicon. The throughput ofemitter formation can be increased in the case of batch process-ing with a gas dopant source (e.g., POCl3) by depositing at lowerpressure.47 This process can also be completely replaced by ionimplantation48,49 or chemical vapor deposition (CVD) either of adopant source,50 a doped epitaxial silicon layer,51 or a polysiliconlayer.52 CVD and implant emitter formation also obviate theneed for edge isolation because they are single-sided processes.The capex associated with contact firing can be reduced for atraditional belt furnace process by increasing the throughput ofthe entire manufacturing process (the throughput of a beltfurnace is just determined by the belt length). Belt furnace firingcan also be replaced by laser-firing53–55 or another more efficientfurnace.56,57 On the module level, capex can be reduced byeliminating the aluminum frame27,58,59 and simplified tabbingand stringing of cells together.60
Combined, the processes mentioned above represent over75% of the capex of producing a monocrystalline PV module.29
As discussed in the main text, increasing efficiency also pro-portionally reduces capex (in dollars per watt). Additionally, theprocesses mentioned above represent over 70% of the embeddedenergy and CO2 of a PV module,61,62 and efficiency is inverselyproportional to energy payback time. Thus, the advanced con-cepts described would drastically reduce PV systems’ embeddedCO2 and energy payback times,27,63 mitigating the risk of sub-stantial added electrical loads for PV system production atelevated manufacturing capacities;64 see further discussion inESI.† Variable cost reductions up to 40% are on industry road-maps as described in detail in ref. 28 and 31.
Multiple technologies, including passivated emitter and rearlocal contacts, heterojunctions, interdigitated back contact designs,and fully passivated contacts, have demonstrated efficiencies over25%,39 and roadmaps exist up to 26–29%.31,65,66 There is alsopromising work to reduce cell-to-module losses.67–69
The price constraint on installed capacity depends strongly onthe demand curve for PV. The demand curve in turn depends ona multitude of factors unrelated to PV module technology.8 Tocapture the uncertainty in these factors over a period of decades,we shift the demand curve to simulate increased and decreaseddemand at a given PV module price (see ESI† for details) andrecalculate installations over time for each of our technologyscenarios. As stated above, the range of installed capacity withincreased and decreased demand is indicated by the shaded
8 Some example of these factors are: grid constraints and electricity markets,including utility tariff structures, ancillary services markets, and electric gridtechnology; energy and climate policy, including carbon pricing, fossil fuel sub-sidies, and supply- and demand-side PV subsidies like feed-in-tariffs, investmenttax credits, renewable portfolio standards, low/zero-interest loans, subsidizedland and equipment and the cost of supporting or competing technologies likefossil fuels, energy storage, PV balance-of-systems, and labor for manufacturingand installation.
Energy & Environmental Science Paper
Ope
n A
cces
s A
rtic
le. P
ublis
hed
on 2
1 A
pril
2016
. Dow
nloa
ded
on 1
0/06
/201
6 20
:35:
27.
Thi
s ar
ticle
is li
cens
ed u
nder
a C
reat
ive
Com
mon
s A
ttrib
utio
n 3.
0 U
npor
ted
Lic
ence
.View Article Online

This journal is©The Royal Society of Chemistry 2016 Energy Environ. Sci., 2016, 9, 2122--2129 | 2127
areas in Fig. 4. These results show that relatively small changesin demand can have dramatic impacts on installed capacity. Forthe high-efficiency advanced technology concept, a 25% (rel.)change in the price at which a given capacity is demanded canincrease installed capacity to 11.5 TW or reduce it to 8.5 TW.
Debt can also be used to increase growth rate. However,it must come with significant reductions in cost to reach highinstalled capacity. To illustrate this point, a scenario with line-of-sight technology improvements and a debt/equity ratio of 5 : 1 isalso shown in Fig. 4. As with the line-of-sight scenario with adebt/equity ratio of 1 : 1, installed capacity is limited to less than5 TW. In addition, the demand curve has a much stronger effecton this scenario than on technology innovations, with the highdemand case yielding 11 TW of PV but the low demand case lessthan 3 TW. This leads to a large range in the total amount of debtthat would have to be sourced in such a scenario, ranging from$0.9 trillion to $3.7 trillion with baseline projected demandrequiring $1.6 trillion. Finally, the interest rate on debt also hasa significant impact on the installed capacity in the increaseddebt scenario. An increase from 5% (baseline assumption) to10% reduces installed capacity in the high-demand case from11 to 7 TW. This data is shown in Fig. S5 of the ESI.†
5. Conclusions
In summary, we find that further innovation is necessary toreach cumulative installed PV capacities commensurate withtargets for keeping average global temperatures below 1.5–2 1Cabove pre-industrial levels without external subsidies. Line-of-sight technology improvements are insufficient to reach aggres-sive targets, which give the highest likelihood of preventingcatastrophic climate change. To meet these targets will requiredramatic reductions in capex along with significant increasesin efficiency and/or hefty reductions in variable costs. Becausereductions in variable costs also reduce growth rate under theassumption of fixed operating margins, we find that increasedefficiency is preferred.
Finally, demand for PV, which limits total deployment at agiven price, is strongly dependent on policy decisions. Installersprice PV and consumers demand PV as an alternative to existingelectricity options. Many policy decisions affect the relative pricesof PV and fossil fuel alternatives, including utility tariff structures,ancillary services markets, electric grid technology, carbon pricing,renewable portfolio standards, fossil fuel subsidies, supply- anddemand-side PV subsidies like feed-in-tariffs, investment taxcredits, low and zero-interest loans, and subsidized land andequipment. Decisions about these policies will either increaseor decrease dramatically the innovation and R&D investmentrequired to achieve climate-driven PV deployment targets.
Acknowledgements
We thank P. Mints (SPV Market Research), R. Fu, M. Woodhouse,and K. Horowitz (NREL), D. Weiss and R. Garabedian (FirstSolar), BJ Stanbery (Siva Power), and L. Sekaric (U.S. DOE) for
fruitful discussions, J. D. Jenkins (MIT), W. Tumas, N. M. Haegel,P. A. Basore, and S. Kurtz (NREL), and G. R. Sherman (PACEFinancial Services) for critical reading of the manuscript, andF. Frankel (MIT) for advice regarding formatting of the figures.This material is based upon work supported by the EngineeringResearch Center Program of the National Science Foundationand the Office of Energy Efficiency and Renewable Energy of theDepartment of Energy (DOE) under NSF Cooperative AgreementNo. EEC-1041895. D. Berney Needleman acknowledges thesupport of the Department of Defense (DoD) through theNational Defense Science & Engineering Graduate (NDSEG)Fellowship program.
References
1 IPCC Core Writing Team, Climate Change 2014, SynthesisReport, Contribution of Working Groups I, II and III to theFifth Assessment Report of the Intergovernmental Panel onClimate Change, Geneva, Switzerland, IPCC, 2014.
2 International Energy Agency, Energy and Climate Change:World Energy Outlook Special Report, 2015.
3 P. Friedlingstein, R. M. Andrew, J. Rogelj, G. P. Peters,J. G. Canadell and R. Knutti, et al. Persistent growth ofCO2 emissions and implications for reaching climate targets,Nat. Geosci., 2014, 7, 709–715.
4 J. Rogelj, W. Hare, J. Lowe, D. P. van Vuuren, K. Riahi andB. Matthews, et al. Emission pathways consistent with a 2 1Cglobal temperature limit, Nat. Clim. Change, 2011, 1, 413–418.
5 UNFCCC, Conference of the Parties (COP), Adoption of theParis Agreement, Proposal by the President [Internet], Paris,France, 2015 [cited 2015 Dec 18], available from: http://unfccc.int/resource/docs/2015/cop21/eng/l09r01.pdf.
6 P. Moriarty and D. Honnery, What is the global potential forrenewable energy?, Renewable Sustainable Energy Rev., 2012,16, 244–252.
7 M. Z. Jacobson and M. A. Delucchi, A Path to SustainableEnergy by 2030, Sci. Am., 2009, 301, 58–65.
8 M. D. Kempe, Ultraviolet light test and evaluation methodsfor encapsulants of photovoltaic modules, Sol. Energy Mater.Sol. Cells, 2010, 94, 246–253.
9 E. Hasselbrink, M. Anderson, Z. Defreitas, M. Mikofski,Y.-C. Shen and S. Caldwell, et al. Validation of the PVLifemodel using 3 million module-years of live site data[Internet], in: Photovoltaic Specialists Conference (PVSC),2013 IEEE 39th. IEEE, 2013 [cited 2016 Jan 9], page 0007–12,available from: http://ieeexplore.ieee.org/xpls/abs_all.jsp?arnumber=6744087.
10 D. C. Jordan and S. R. Kurtz, Reliability and GeographicTrends of 50 000 Photovoltaic Systems in the USA [Internet],in: 29th European PV Solar Energy Conference and Exhibition,2014 [cited 2016 Jan 9], available from: http://www.nrel.gov/docs/fy14osti/62801.pdf.
11 W. Hoffmann, PV solar electricity industry, Market growthand perspective, Sol. Energy Mater. Sol. Cells, 2006, 90,3285–3311.
Paper Energy & Environmental Science
Ope
n A
cces
s A
rtic
le. P
ublis
hed
on 2
1 A
pril
2016
. Dow
nloa
ded
on 1
0/06
/201
6 20
:35:
27.
Thi
s ar
ticle
is li
cens
ed u
nder
a C
reat
ive
Com
mon
s A
ttrib
utio
n 3.
0 U
npor
ted
Lic
ence
.View Article Online
2128 | Energy Environ. Sci., 2016, 9, 2122--2129 This journal is©The Royal Society of Chemistry 2016
12 U.S. Energy Information Admistration, Annual Energy Out-look 2015 [Internet], 2015 [cited 2015 Dec 18], availablefrom: www.eia.gov/forecasts/aeo.
13 M. Z. Jacobson and M. A. Delucchi, Providing all globalenergy with wind, water, and solar power, Part I: Technol-ogies, energy resources, quantities and areas of infrastruc-ture, and materials, Energy Policy, 2011, 39, 1154–1169.
14 A. Feltrin and A. Freundlich, Material considerations forterawatt level deployment of photovoltaics, J. RenewableEnergy, 2008, 33, 180–185.
15 R. C. Pietzcker, D. Stetter, S. Manger and G. Luderer, Usingthe sun to decarbonize the power sector: The economicpotential of photovoltaics and concentrating solar power,Appl. Energy, 2014, 135, 704–720.
16 P. Mints, Price Point and other Ecomomic Levers Required forOver 1-TWp of PV, SPV Market Research, 2015.
17 J. Mayer, S. Philipps, N. S. Hussein, T. Schlegl andC. Senkpiel, Current and Future Cost of Photovoltaics: Long-term Scenarios for Market Development, System Prices andLCOE of Utility-Scale PV Systems, Fraunhofer ISE, Freiburg,Germany, 2015.
18 S. Henbest, New Energy Outlook 2015, Bloomberg FinanceLP, 2015.
19 Solar PV Module Value Chain – Market Size, Average Price,Market Share and Key Country Analysis to 2020, GlobalData,2014.
20 S. Wilkinson, J. Berg and S. von Aichberger, Marketbuzz, IHSTechnology, 2015.
21 A. Metz, G. Demenik, A. Richter, T. Vlasenko, I. Buchovskaya,M. Zwegers, H. Xu, A. Luan, R. Wertz, A. Stassen, H. Forstner,W. Jooss, J. Haase, E. Dornberger, S. Raithel, J. Szlufcik,G. Coletti, W. Sinke, P. Wyers, J. Zhu, S. Zhang, A. Guo,L. Maosheng, J. Xia, Z. Yujun, J. Dong, C. Jian, S. Li,J. Yunpeng, X. Aimin, G. Xing, M. Fischer, P. Engelhardt,A. Gerlach, K. Petter, T. Spieß, A. Mette, M. Mette, K. Wang,C.-C. Li, Y. Wan, G. Li, K. C. Lin, L. Yong, S. Julsrud,Technology Roadmap: Solar Photovoltaic Energy, InternationalEnergy Agency, Paris, France, 2014.
22 M. Rekinger and F. Thies, Global Market Outlook for SolarPower 2015–2019, SolarPower Europe.
23 A. James, Global PV Demand Outlook 2015–2020, ExploringRisk in Downstream Solar Markets, GTM Research.
24 P. Gunjan, Global Solar Power Market, Frost & Sullivan, 2014.25 Solar PV Market Analysis And Segment Forecasts to 2020,
San Francisco, CA, Grand View Research, 2014.26 PV Market Alliance, Global PV Market Report, 2015.27 S. A. Mann, M. J. de Wild-Scholten, V. M. Fthenakis,
W. G. J. H. M. van Sark and W. C. Sinke, The energy paybacktime of advanced crystalline silicon PV modules in 2020: aprospective study, Prog. Photovoltaics, 2014, 22, 1180–1194.
28 D. M. Powell, M. T. Winkler, A. Goodrich and T. Buonassisi,Modeling the Cost and Minimum Sustainable Price ofCrystalline Silicon Photovoltaic Manufacturing in theUnited States, IEEE J. Photovolt., 2013, 3, 662–668.
29 D. M. Powell, R. Fu, K. Horowitz, P. A. Basore, M. Woodhouseand T. Buonassisi, The capital intensity of photovoltaics
manufacturing: barrier to scale and opportunity for innova-tion, Energy Environ. Sci., 2015 [cited 2015 Sep 16], availablefrom: http://pubs.rsc.org/en/Content/ArticleLanding/2015/EE/C5EE01509J.
30 R. Fu, T. L. James and M. Woodhouse, Economic Measure-ments of Polysilicon for the Photovoltaic Industry: MarketCompetition and Manufacturing Competitiveness, IEEEJ. Photovolt., 2015, 5, 515–524.
31 ITRPV Working Group, International Technology Roadmapfor Photovoltaic (ITRPV), 2014 Results [Internet], SEMI PVGroup, 2015, available from: http://itrpv.net/.cm4all/iproc.php/Reports%20downloads/ITRPV_2015_Roadmap_Results_2014_150428.pdf?cdp=a.
32 B. Burger, K. Kiefer, C. Kost, S. Nold, S. Philipps and R. Preu,et al. Photovoltaics Report [Internet], Freiburg, Germany,Fraunhofer Institute for Solar Energy Systems, 2015 [cited2016 Jan 14], available from: https://www.ise.fraunhofer.de/en/downloads-englisch/pdf-files-englisch/photovoltaics-report-slides.pdf.
33 C. Wadia, A. P. Alivisatos and D. M. Kammen, MaterialsAvailability Expands the Opportunity for Large-ScalePhotovoltaics Deployment, Environ. Sci. Technol., 2009, 43,2072–2077.
34 M. A. Green, Estimates of Te and In prices from directmining of known ores, Prog. Photovoltaics, 2009, 17, 347–359.
35 M. Woodhouse, A. Goodrich, R. Margolis, T. James,R. Dhere and T. Gessert, et al. Perspectives on the pathwaysfor cadmium telluride photovoltaic module manufacturersto address expected increases in the price for tellurium, Sol.Energy Mater. Sol. Cells, 2013, 115, 199–212.
36 C. Zheng and D. M. Kammen, An innovation-focused road-map for a sustainable global photovoltaic industry, EnergyPolicy, 2014, 67, 159–169.
37 T. Voituriez and X. Wang, Real challenges behind theEU–China PV trade dispute settlement, Clim. Policy, 2015,15, 670–677.
38 M. Bazilian, I. Onyeji, M. Liebreich, I. MacGill, J. Chase andJ. Shah, et al. Re-considering the economics of photovoltaicpower, J. Renewable Energy, 2013, 53, 329–338.
39 M. A. Green, K. Emery, Y. Hishikawa, W. Warta and E. D.Dunlop, Solar cell efficiency tables (version 47), Prog. Photo-voltaics, 2016, 24, 3–11.
40 Hanwha Q CELLS confirms 19.1% cell efficiencies with1366’s ‘‘Direct Wafer’’ technology [Internet], PV-Tech2015[cited 2015 Nov 8], available from: http://www.pv-tech.org/news/hanwha_q_cells_confirms_19.1_cell_efficiencies_with_1366s_direct_wafer_tech.
41 A. Goodrich, P. Hacke, Q. Wang, B. Sopori, R. Margolis andT. L. James, et al. A wafer-based monocrystalline siliconphotovoltaics road map: Utilizing known technologyimprovement opportunities for further reductions in manu-facturing costs, Sol. Energy Mater. Sol. Cells, 2013, 114,110–135.
42 B. Terheiden, T. Ballmann, R. Horbelt, Y. Schiele, S. Serenand J. Ebser, et al. Manufacturing 100-mm-thick silicon solarcells with efficiencies greater than 20% in a pilot production
Energy & Environmental Science Paper
Ope
n A
cces
s A
rtic
le. P
ublis
hed
on 2
1 A
pril
2016
. Dow
nloa
ded
on 1
0/06
/201
6 20
:35:
27.
Thi
s ar
ticle
is li
cens
ed u
nder
a C
reat
ive
Com
mon
s A
ttrib
utio
n 3.
0 U
npor
ted
Lic
ence
.View Article Online
This journal is©The Royal Society of Chemistry 2016 Energy Environ. Sci., 2016, 9, 2122--2129 | 2129
line: Manufacturing 100-mm-thick Si solar cells with effi-ciencies greater than 20%, Phys. Status Solidi A, 2015, 212(1),13–24.
43 C. Gay, Significant research and technical paths for silicon:beyond DOE Sunshot goals, 2015.
44 F. Schindler, B. Michl, A. Kleiber, H. Steinkemper, J. Schonand W. Kwapil, et al. Potential Gain in Multicrystalline SiliconSolar Cell Efficiency by n-Type Doping, IEEE J. Photovolt.,2015, 5, 499–506.
45 G. Fisher, M. R. Seacrist and R. W. Standley, Silicon CrystalGrowth and Wafer Technologies, Proc. IEEE, 2012, 100,1454–1474.
46 M. Kivambe, D. M. Powell, S. Castellanos, M. Ann Jensen,A. E. Morishige and K. Nakajima, et al. Minority-carrierlifetime and defect content of n-type silicon grown by thenoncontact crucible method, J. Cryst. Growth, 2014, 407,31–36.
47 M. Muhlbauer, A. Piechulla, C. Voyer, M. Citro, R. Dahl andP. Fath, Industrial low-pressure phosphorus diffusionfor high performance and excellent uniformity, in: 26thEuropean International Conference on Photovoltaic SolarEnergy, 5–9 Sept. 2011, WIP – Renewable Energies, 2011,2028–2030.
48 M. Sheoran, M. Emsley, M. Yuan, D. Ramappa andP. Sullivan, Ion-implant doped large-area n-type Czochralskihigh-efficiency industrial solar cells, in: 2012 38th IEEEPhotovoltaic Specialists Conference (PVSC), 2012, 0022547.
49 E. Cho, Y. Ok, K. Ryu, B. Rounsaville, A. D. Upadhyaya andV. Upadhyaya, et al. Comparison of POCl3 diffusion withphosphorus ion implantation for Czochralski and Quasi-mono silicon solar cells, in: Photovoltaic Specialist Confer-ence (PVSC), 2014 IEEE 40th, 2014, 2966–2968.
50 J. Engelhardt, A. Frey, S. Gloger, G. Hahn and B. Terheiden,Passivating boron silicate glasses for co-diffused high-efficiency n-type silicon solar cell application, Appl. Phys.Lett., 2015, 107(4), 042102.
51 T. Rachow, N. Milenkovic, B. Steinhauser, J. Benick, S. Janzand M. Hermle, et al. Solar Cells with Epitaxial or Gas PhaseDiffused Emitters above 21% Efficiency, in: 5th InternationalConference on Silicon Photovoltaics, SiliconPV 2015, March25, 2015 – March 27, 2015, Elsevier Ltd, 2015, 540–545.
52 P. G. Borden, L. Xu, B. McDougall, C. P. Chang, D. Pyschand P. Voisin, et al. Polysilicon tunnel junctions as alter-nates to diffused junctions, in: Proceedings of the 23rdEuropean Photovoltaic Solar Energy Conference, Valencia,Spain, 2008.
53 E. Schneiderlochner, R. Preu, R. Ludemann and S. W.Glunz, Laser-fired rear contacts for crystalline silicon solarcells, Prog. Photovoltaics, 2002, 10, 29–34.
54 J. He, S. Hegedus, U. Das, Z. Shu, M. Bennett and L. Zhang,et al. Laser-fired contact for n-type crystalline Si solar cells:Laser-fired contact for Si solar cells, Prog. Photovoltaics,2015, 23, 1091–1099.
55 M. Graf, J. Nekarda, F. L. Togny, A. Streek, R. Bohme andR. Preu, Comprehensive Simulation and Acceleration of the
Foil-metallization Laser Process, Energy Procedia, 2015, 77,694–700.
56 S. Peters, Rapid Thermal Processing of Crystalline SiliconMaterials and Solar Cells, 2004.
57 Breakthrough Furnace can Cut Solar Industry Costs[Internet], Golden, CO, USA, National Renewable EnergyLaborartory, 2013, available from: http://www.nrel.gov/docs/fy13osti/59012.pdf.
58 Plug and Play: Purchase, Install, and Connect ResidentialSolar Power in Hours [Internet], Energy.gov [cited 2016 Jan 26],available from: http://energy.gov/eere/success-stories/articles/plug-and-play-purchase-install-and-connect-residential-solar-power.
59 DUOMAX Series Dual Glass Module | Trina Solar USA[Internet], [cited 2016 Jan 26], available from: http://www.trinasolar.com/us/product/PDG5.html.
60 T. Buck, R. Kopecek, J. Libal, R. Petres, K. Peter and I. Rover,et al. Large Area Screen Printed N-Type MC-SI Solar cellsWith B-Emitter: Efficiencies Close to 15% and InnovativeModule Interconnection, in: Conference Record of the 2006IEEE 4th World Conference on Photovoltaic Energy Conver-sion, 2006, 1060–1063.
61 T. Wetzel and F. Feuerstein, Update of energy payback timedata for crystalline silicon PV modules, in: Proceedings ofthe 26th European Photovoltaic Solar Energy Conference,Hamburg, Germany, 2011.
62 V. M. Fthenakis and H. C. Kim, Photovoltaics: Life-cycleanalyses, Sol. Energy, 2011, 85, 1609–1628.
63 V. Fthenakis, How long does it take for photovoltaics toproduce the energy used?, Natl Assoc Prof Eng Mag, 2012,16–17.
64 S. B. Darling and F. You, The case for organic photovoltaics,RSC Adv., 2013, 3, 17633–17648.
65 R. M. Swanson, Approaching the 29% limit efficiency ofsilicon solar cells, in: Conference Record of the Thirty-firstIEEE Photovoltaic Specialists Conference, 2005, 889–894.
66 Energy Department Announces $12 Million to AccelerateRecord-Breaking Solar Cell Efficiency [Internet], [cited 2015Dec 29], available from: http://apps1.eere.energy.gov/news/progress_alerts.cfm/news_id=20465.
67 I. Haedrich, M. Wiese, B. Thaidigsman, D. Eberlein,F. Clement and U. Eitner, et al. Minimizing the OpticalCell-to-module Losses for MWT-modules, Energy Procedia,2013, 38, 355–361.
68 I. Haedrich, U. Eitner, M. Wiese and H. Wirth, Unifiedmethodology for determining CTM ratios: Systematic pre-diction of module power, Sol. Energy Mater. Sol. Cells, 2014,131, 14–23.
69 J. Muller, D. Hinken, S. Blankemeyer, H. Kohlenberg,U. Sonntag and K. Bothe, et al. Resistive Power Loss Analysisof PV Modules Made From Halved 15.6 � 15.6 cm2 SiliconPERC Solar Cells With Efficiencies up to 20.0%, IEEEJ. Photovolt., 2015, 5, 189–194.
70 P. A. Basore, Paths to future growth in photovoltaics manu-facturing, Prog. Photovoltaics, 2016, DOI: 10.1002/pip.2761.
Paper Energy & Environmental Science
Ope
n A
cces
s A
rtic
le. P
ublis
hed
on 2
1 A
pril
2016
. Dow
nloa
ded
on 1
0/06
/201
6 20
:35:
27.
Thi
s ar
ticle
is li
cens
ed u
nder
a C
reat
ive
Com
mon
s A
ttrib
utio
n 3.
0 U
npor
ted
Lic
ence
.View Article Online