energy efficiency associates – energy audit report
TRANSCRIPT

8/14/2019 Energy Efficiency Associates – Energy Audit Report
http://slidepdf.com/reader/full/energy-efficiency-associates-energy-audit-report 1/53
Energy Efficiency Associates – Energy Audit Report 1
Energy Audit Report
28 Mansfield Street, Allston, MA
Author: Michael B. DuclosStatus: Draft
Revision: 1.0Date: December 20, 2009

8/14/2019 Energy Efficiency Associates – Energy Audit Report
http://slidepdf.com/reader/full/energy-efficiency-associates-energy-audit-report 2/53
Energy Efficiency Associates – Energy Audit Report 2
TABLE OF CONTENTS
1 Introduction ................................................................................................................. 4 1.1 Energy Auditor ..................................................................................................... 4 1.2 Method of Investigation ....................................................................................... 5
2 Homeowner Interview ................................................................................................ 6 2.1 Homeowner Articulated Issues ............................................................................ 7
2.1.1 Issue #1 – Guidance on Home Renovation Plans ......................................... 7 3 Energy Bill Analysis ................................................................................................... 9 4 Building Inspection ................................................................................................... 10
4.1 Exterior Inspection Highlights ........................................................................... 10 5 Testing Sequence – Infrared and Blower Door ......................................................... 12
5.1 Infrared Imagery - Overview .............................................................................. 12 5.2 Infrared Imagery Without Blower Door Operating............................................ 13 5.3 Blower Door Test Results .................................................................................. 16 5.4 Infrared Imagery With Blower Door Operating ................................................. 17 5.5 Basement ............................................................................................................ 22 5.6 Rim Joist ............................................................................................................. 24 5.7 Attic .................................................................................................................... 25
6 Mechanicals .............................................................................................................. 26 6.1 Mechanicals List ................................................................................................ 26
6.1.1 Boiler........................................................................................................... 27 6.1.2 Heat Distribution System ............................................................................ 27 6.1.3 Domestic Hot Water (DHW) ...................................................................... 28 6.1.4 Air Conditioning ......................................................................................... 29
7 Electricity Consumption ........................................................................................... 29 7.1 Electrical Use Tutorial ....................................................................................... 29 7.2 Dehumidifier ...................................................................................................... 30 7.3 Air Conditioning ................................................................................................ 31 7.4 Refrigerator ........................................................................................................ 31 7.5 “Phantom Loads” ............................................................................................... 31 7.6 Measuring Electricity Use – Kill A Watt ........................................................... 32
7.6.1 Remote Outlet On – Off Switching ............................................................ 33 7.7 Computers .......................................................................................................... 33
8 Suggested Improvements .......................................................................................... 35 8.1 Renovation Discussion ....................................................................................... 35
8.1.1 Comfort vs. Energy Use – A Trade Off ...................................................... 36 8.1.2 Air Infiltration ............................................................................................. 36 8.1.3 Basement Insulation .................................................................................... 37 8.1.4 Rim Joist ..................................................................................................... 37 8.1.5 Above Grade Walls ..................................................................................... 37 8.1.6 Roof............................................................................................................. 38
8.1.6.1 Attic Floor as Air and Thermal Boundary ........................................... 38 8.1.6.2 Rafters as Air and Thermal Boundary ................................................. 38
8.1.7 Mechanicals ................................................................................................ 39

8/14/2019 Energy Efficiency Associates – Energy Audit Report
http://slidepdf.com/reader/full/energy-efficiency-associates-energy-audit-report 3/53
Energy Efficiency Associates – Energy Audit Report 3
8.1.7.1 Dual Furnace and Standing Pilot DHW Heater Approach .................. 39 8.1.7.2 Boiler with Hydro Air Approach ......................................................... 40 8.1.7.3 Boiler with Hydronic Convectors Approach ....................................... 40 8.1.7.4 Boiler or Furnace with Mini Split Approach ....................................... 40 8.1.7.5 Mechanicals Summary ........................................................................ 41
8.1.8
Window Replacement Discussion .............................................................. 41
8.1.9 Air Sealing Discussion ................................................................................ 44 8.1.10 Overall Impressions .................................................................................... 45 8.1.11 Heat or Energy Recovery Ventilation System ............................................ 46 8.1.12 Miscellaneous ............................................................................................. 47
9 Renewable Energy Assessment ................................................................................ 49 10 Thermal and Air Barrier Overview ........................................................................... 50 11 Radiant Temperature Overview ................................................................................ 52 12 References ................................................................................................................. 52

8/14/2019 Energy Efficiency Associates – Energy Audit Report
http://slidepdf.com/reader/full/energy-efficiency-associates-energy-audit-report 4/53
Energy Efficiency Associates – Energy Audit Report 4
1 Introduction
Energy Efficiency Associates provides investigative, consulting, training and reviewservices to address issues related to comfort and energy efficiency in the home.
Energy Efficiency Associates is a third party, independent consulting service.
Energy Efficiency Associates does not provide air sealing, insulation, HVAC or othercontractor services.
This Energy Audit Report is a summary of the on-site investigation conducted December16, 2009.
1.1 Energy Auditor
This audit was conducted by Mike Duclos:
• An ITC Certified Building Science Infrared Thermographer, ITC #19880http://www.infraredtraining.com/courses/building_sciences.asp
• A Certified Passive House Consultant: www.passivehouse.us
• A Certified Home Energy Rating System (HERS) Rater, # EAM-111http://www.natresnet.org/
• A Massachusetts EnergyStar Partner: www.energystarhomes.com
• A RESNET Certified Green Rater: www.natresnet.org/directory/raters.aspx
• BS Electrical Engineering, University of Massachusetts, Lowell
• Member, Institute of Electronic and Electrical Engineers, IEEE, # 06689541
• US Patent 5,943,338, Aug 24, 1999 - Redundant ATM Interconnect
• US Patent 6,965,565, Nov 15, 2005 - Use of SAR PDU Header to Transmit ErrorStatus

8/14/2019 Energy Efficiency Associates – Energy Audit Report
http://slidepdf.com/reader/full/energy-efficiency-associates-energy-audit-report 5/53
Energy Efficiency Associates – Energy Audit Report 5
1.2 Method of Investigation
Energy Efficiency Associates Energy Audit for this particular home, client interests andgoals is a process comprised of the following steps:
Utility Bill Analysis – Utility bills were analyzed and energy intensity per square foot of heated livings space (KBTU/SF/Yr) was calculated prior to the audit.
Infrared Camera Scan – An assessment of conductive heat loss in the buildingenvelope, and insulation and air sealing quality due to stack effect only.
Blower Door Infiltration Test – An objective measurement of impact of air infiltrationon building heating costs and air quality
Infrared Camera Scan In Combination with Blower Door Infiltration Diagnostic –Comparative analysis of IR scan with blower door to pre-blower door IR scan facilitatesvisualization of new point sources of cooling, i.e. air infiltration caused by the BlowerDoor. This process facilitates ‘scanning’ of large areas to locate points of air infiltration.
Written Report – This documents findings, relative importance, proposed strategies toaddress issues, and an approximate monetization of improvements.
Consulting Services – The Energy Audit only has value if recommendations are actuallyimplemented which make the building more comfortable and save energy.
Traditional issues with home energy audits are described in the following article:
Home Energy Magazine – Massachusetts Audits: More Smiles Than Savingshttp://www.homeenergy.org/archive/hem.dis.anl.gov/eehem/98/980711.html
At least one additional hour of consulting time via phone or email is included as part of this Audit Package to assist the homeowner in selecting improvement measuresappropriate to their home and situation, etc. researching products and techniques,investigating issues, and in general to help to achieve their goals of increased comfort and
reduced energy use.

8/14/2019 Energy Efficiency Associates – Energy Audit Report
http://slidepdf.com/reader/full/energy-efficiency-associates-energy-audit-report 6/53
Energy Efficiency Associates – Energy Audit Report 6
2 Homeowner Interview
A summary of the key points noted during the homeowner interview and subsequent
investigation of the home, and follow-up communications are listed here
Year Built – Circa 1890 according to Assessors on-line database at:http://www.cityofboston.gov/assessing/search/default.asp?mode=attr&pid=2201348000
How Long Owned – 15 years
Number of Occupants – 5
Age of Roof – Greater than 15 years
Recent and Planned Renovations & Dates – Energy Efficiency upgrade planning inprogress.
Use of Basement Space – Presently workshop/storage, to become living space
Use of Attic Space – Small attic not in use
Day of Audit Conditions – About 30 degrees with a light breeze, at 7:30 AM arrival,
indoor temperature was about 65F at the single thermostat on the first floor.
Number of Fireplaces – 1 woodstove installed in first floor fireplace
Winter Day/Evening Thermostat Settings
Winter – Daytime 62, Evenings off Summer – No central A/C
Estimated Conditioned Space Area
From assessor’s on-line database – 2119 sf – This was used as the basis for the energyintensity calculation (above). If this is not correct there will be a difference in the energyintensity calculation.

8/14/2019 Energy Efficiency Associates – Energy Audit Report
http://slidepdf.com/reader/full/energy-efficiency-associates-energy-audit-report 7/53
Energy Efficiency Associates – Energy Audit Report 7
2.1 Homeowner Articulated Issues
2.1.1 Issue #1 – Guidance on Home Renovation Plans
The prime goal of this audit was to gather information about the existing home, and to
consult on the various possibilities being explored in the renovation.
Resale value of the renovations is not of primary importance.
Increasing comfort in the building as a result of renovation work cost effectively
addressing comfort issues is the primary goal.
Renovation areas presently under consideration:
1. Basement Insulation – Insulating the basement walls and slab, creating usefuland comfortable living space.
2. Third Floor – The third floor is finished, but is uncomfortable, and the desire isto provide comfortable living space here.
3. Roof – There may be work done on the roof, insulating the rafter plane is underconsideration.
4. Window Replacement - Windows were replaced by the homeowner, but are notof high quality and window installation is suspect.
5. Heating System – Currently steam by natural gas, no A/C, attic and basement
Forced Hot Air (FHA) furnaces are under consideration.
6. Siding - There is no plan to remove the siding which is presently shingles overclapboard.
This is discussed further near the end of this report under the heading Renovation
Discussion.
There are several areas in the home the owner reported comfort issues, these include theroom above the front porch, the third floor and the first floor pantry.
Energy is saved as a result of not heating the building to a temperature range more typicalof the building stock in general. The owner wishes to live more comfortably.
This is interpreted to mean a higher indoor air temperature, fewer drafts and higherexternal wall interior surface temperatures.

8/14/2019 Energy Efficiency Associates – Energy Audit Report
http://slidepdf.com/reader/full/energy-efficiency-associates-energy-audit-report 8/53
Energy Efficiency Associates – Energy Audit Report 8
Since conducted heat loss is proportional to surface area, temperature differential andthermal resistance, an increase in the temperature differential (inside temperature less theoutside temperature) would need to be balanced by an increase in the thermal resistanceof the building envelope, as well as a decrease in air infiltration induced heat loss.
Guidance on renovation possibilities is given under Recommended Improvements below.

8/14/2019 Energy Efficiency Associates – Energy Audit Report
http://slidepdf.com/reader/full/energy-efficiency-associates-energy-audit-report 9/53
Energy Efficiency Associates – Energy Audit Report 9
3 Energy Bill Analysis
Energy bill data were analyzed in the context of the building’s conditioned floor area, and
this resulted in approximately 36.5 KBTU/SF/Yr for the single year of full data.
The graph below was created from fuel bill analysis of more than 140 homes in theBoston area. The number of homes in each 10 KBTU/SF/Yr ‘bin’ is on the ‘Y’ (vertical)axis, and the KBTU/SF/Yr of each ‘bin’ is on the ‘X’ (horizontal) axis
Here is this home’s energy intensity.
The number of KBTUs /SF / Yr is subject to variables like building geometry, microclimate, occupant behavior, etc. and should be used as a ‘rough guide’ for comparison.
The energy use of this building has been very heavily influenced by occupant behavior,
and perhaps to a much lesser extent by shielding from wind due to the proximity of theneighboring buildings.
This is a very low energy use for a conventional building, and is attributed to very carefulattention to energy conservation.
This is demonstrated by the average monthly electricity use data of about 225KHWR/month, and the absence of the use of heating overnight reported by the owner.

8/14/2019 Energy Efficiency Associates – Energy Audit Report
http://slidepdf.com/reader/full/energy-efficiency-associates-energy-audit-report 10/53
Energy Efficiency Associates – Energy Audit Report 10
4 Building Inspection
4.1 Exterior Inspection Highlights
This home is a three story wood framed structure on top of a rubble foundation which isan average of approximately two feet above grade.
This home is on a fairly level, and small lot.
There is no visible exterior, intentional, attic ventilation.
There is an area of cantilevered floor in the room above the front porch, as shown below.
.

8/14/2019 Energy Efficiency Associates – Energy Audit Report
http://slidepdf.com/reader/full/energy-efficiency-associates-energy-audit-report 11/53
Energy Efficiency Associates – Energy Audit Report 11
The third floor in general was reported to have comfort issues.
The other single room that was noted as having the most severe comfort issues is thepanty.

8/14/2019 Energy Efficiency Associates – Energy Audit Report
http://slidepdf.com/reader/full/energy-efficiency-associates-energy-audit-report 12/53
Energy Efficiency Associates – Energy Audit Report 12
5 Testing Sequence – Infrared and Blower Door
An infrared scan was performed with the blower door not operating first, to locateconducted and stack effect heat loss areas and to become familiar with the building.
A blower door measurement was performed to measure air infiltration
An infrared scan was performed with the blower door operating to locate areas of airinfiltration, and assess their magnitude.
5.1 Infrared Imagery - Overview
Interpretation of building infrared imagery is best left to individuals with an in-depthunderstanding of building construction, materials, standards and practices of the buildingindustry at various periods in building technology development, proper training,experience and, a conservative approach to the interpretation of these images.
Thermal images are best used as a trigger to further investigation before taking action.
That said, some generalizations can be made that can be used to facilitate understanding,as well as to highlight the locations to address.
The images in this report are in black and white, darker colors mean lower temperaturesand lighter colors mean higher temperatures (see scale at the right side of the image).
However, most professional Building Science Infrared Thermographers prefer to use
black and white imagery to facilitate interpretation of the image.
Color IR images can have a large emotional impact to those not trained in the use of infrared imagery in Building Science investigations. This impact is inconsistent with arealistic and credible interpretation of the thermal and air flow significance of theseimages.
Also, the discontinuities of color images do not clearly convey the continuum of temperature variation as does grayscale. “White hot” gray scale pallet is used throughoutthis report.
When looking at exterior walls from the inside of a building with a lower outside thaninside temperature, the studs will (generally) be a darker color than the cavities.
If the cavity is empty, the studs have a greater resistance to heat transfer than the studcavities, and so will (generally) be a lighter color than the cavities.
With the above cautions in mind, some images are presented below to illustrate the natureof the anomalies, and their location in the home.

8/14/2019 Energy Efficiency Associates – Energy Audit Report
http://slidepdf.com/reader/full/energy-efficiency-associates-energy-audit-report 13/53
Energy Efficiency Associates – Energy Audit Report 13
5.2 Infrared Imagery Without Blower Door Operating
The owner reported the home had ‘blown cellulose’ installed by a low cost contractor,and IR imagery indicated that there may have been a lack of attention to detail in the
installation process, since the apparent absence of insulation above and below windowswas consistent throughout the building. Some partially filled cavities were also apparent.
In the image pair below, apparently the cavities above the windows behind the plasterand lath were not insulated, while the full height cavities just to the right were insulated.

8/14/2019 Energy Efficiency Associates – Energy Audit Report
http://slidepdf.com/reader/full/energy-efficiency-associates-energy-audit-report 14/53
Energy Efficiency Associates – Energy Audit Report 14
There were also apparent defects in the insulation in other areas:

8/14/2019 Energy Efficiency Associates – Energy Audit Report
http://slidepdf.com/reader/full/energy-efficiency-associates-energy-audit-report 15/53
Energy Efficiency Associates – Energy Audit Report 15
There were areas of stack effect driven air infiltration in many areas of the home,especially in the rim joist area in the basement.

8/14/2019 Energy Efficiency Associates – Energy Audit Report
http://slidepdf.com/reader/full/energy-efficiency-associates-energy-audit-report 16/53
Energy Efficiency Associates – Energy Audit Report 16
5.3 Blower Door Test Results
Air infiltration in this home was measured at the front door.
The dog entry door was found to be leaking air, and so it was taped, which resulted in a
reduction of about 300 CFM50
The measurement was 4300 CFM50 with the basement door closed prior to correction forindoor to outdoor temperature difference.
The temperature corrected value is about 4450 CFM50.
The measurement was 4600 CFM50 with the basement door closed prior to correction forindoor to outdoor temperature difference.
The temperature corrected value is about 4760 CFM50.
This is significant, but not extraordinary air infiltration for a building of this size andvintage.
Changing nothing else in this home but reducing blower door infiltration could saveapproximately 7 Therms of gas per year for each 100 CFM50 of blower door measuredreduction.
So a 2000 CFM50 reduction could save about 140 therms of gas in a ‘typical’ building
operation scenario (i.e. 65 F indoor temperature).
A greater air infiltration reduction is possible in this building with careful air sealingwork.
Better comfort in terms of greater humidity and less of a ‘drafty’ feeling in the winter andlower humidity in the summer can result from lowering air infiltration.
Air infiltration reduction is often the most cost effective approach to increasing comfortand decreasing energy costs.

8/14/2019 Energy Efficiency Associates – Energy Audit Report
http://slidepdf.com/reader/full/energy-efficiency-associates-energy-audit-report 17/53
Energy Efficiency Associates – Energy Audit Report 17
5.4 Infrared Imagery With Blower Door Operating
With the blower door operating the impact of air infiltration was more evident.
The apparently partially filled stud cavities were more vivid with the blower dooroperating.

8/14/2019 Energy Efficiency Associates – Energy Audit Report
http://slidepdf.com/reader/full/energy-efficiency-associates-energy-audit-report 18/53
Energy Efficiency Associates – Energy Audit Report 18
The pervasive nature of air infiltration became more evident with the blower dooroperating, the ceiling had not previously displayed such a vivid pattern prior to using theblower door.

8/14/2019 Energy Efficiency Associates – Energy Audit Report
http://slidepdf.com/reader/full/energy-efficiency-associates-energy-audit-report 19/53
Energy Efficiency Associates – Energy Audit Report 19
These patterns characteristic of air infiltration were amplified and more vivid with theblower door operating.

8/14/2019 Energy Efficiency Associates – Energy Audit Report
http://slidepdf.com/reader/full/energy-efficiency-associates-energy-audit-report 20/53
Energy Efficiency Associates – Energy Audit Report 20
The blower door revealed window installations that had not been well air sealed.

8/14/2019 Energy Efficiency Associates – Energy Audit Report
http://slidepdf.com/reader/full/energy-efficiency-associates-energy-audit-report 21/53
Energy Efficiency Associates – Energy Audit Report 21
The attic access hatch would benefit from both a well sealing gasket and insulation.
Multiple layers of rigid foam board is one common attic hatch insulation technique.

8/14/2019 Energy Efficiency Associates – Energy Audit Report
http://slidepdf.com/reader/full/energy-efficiency-associates-energy-audit-report 22/53
Energy Efficiency Associates – Energy Audit Report 22
5.5 Basement
The foundation is rubble with mortar, which is relatively intact with respect to air sealing,but has a few areas in which it is cracked and will admit air under blower door testpressure.
There is a concrete slab that is also relatively intact.
There is a significant area of the chase framing which not air sealed to the masonry, andso this is likely a significant bypass to the attic.

8/14/2019 Energy Efficiency Associates – Energy Audit Report
http://slidepdf.com/reader/full/energy-efficiency-associates-energy-audit-report 23/53
Energy Efficiency Associates – Energy Audit Report 23
There was a significant number of first floor penetrations, which appeared to leak a fairbit of air between the basement and first floor.

8/14/2019 Energy Efficiency Associates – Energy Audit Report
http://slidepdf.com/reader/full/energy-efficiency-associates-energy-audit-report 24/53
Energy Efficiency Associates – Energy Audit Report 24
5.6 Rim Joist
The rim joist is often the highest leverage item to be addressed, if it is easily accessible,
since it is located in a high stack effect are of the building, and is often uninsulated.
The rim joist appears to be fairly typically leaky for a home of this age.
8/14/2019 Energy Efficiency Associates – Energy Audit Report
http://slidepdf.com/reader/full/energy-efficiency-associates-energy-audit-report 25/53
Energy Efficiency Associates – Energy Audit Report 25
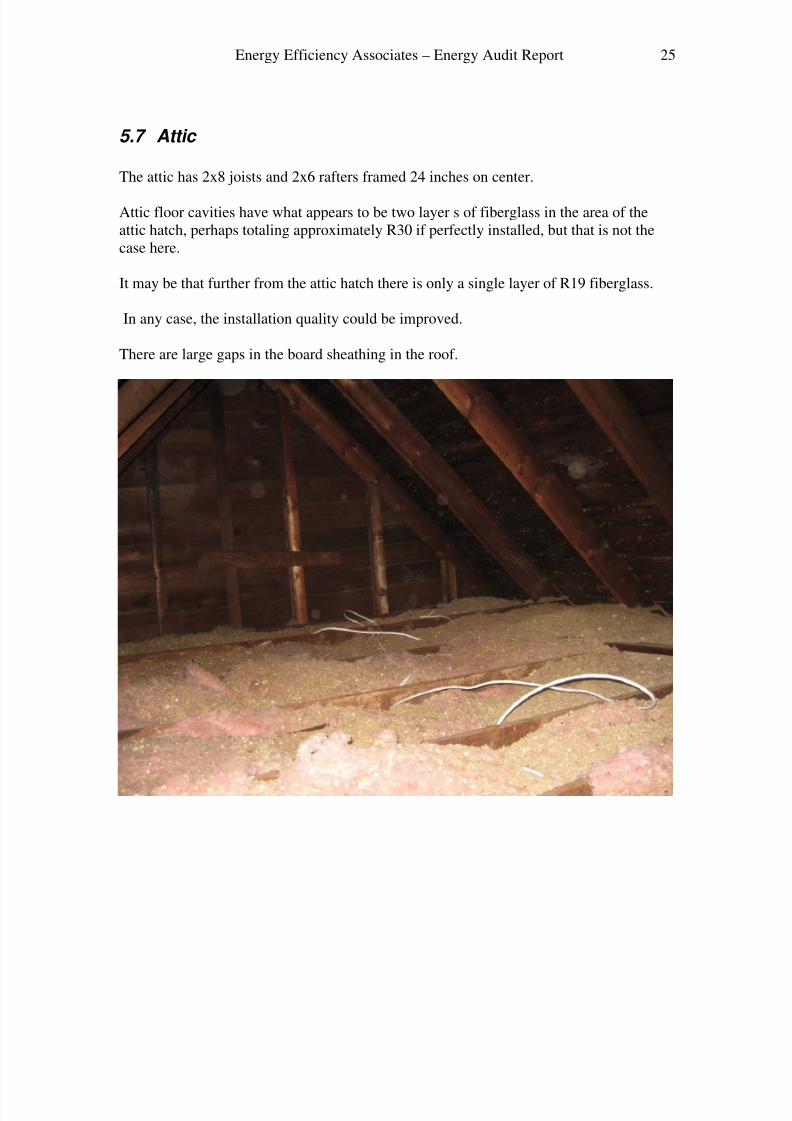
5.7 Attic
The attic has 2x8 joists and 2x6 rafters framed 24 inches on center.
Attic floor cavities have what appears to be two layer s of fiberglass in the area of theattic hatch, perhaps totaling approximately R30 if perfectly installed, but that is not thecase here.
It may be that further from the attic hatch there is only a single layer of R19 fiberglass.
In any case, the installation quality could be improved.
There are large gaps in the board sheathing in the roof.

8/14/2019 Energy Efficiency Associates – Energy Audit Report
http://slidepdf.com/reader/full/energy-efficiency-associates-energy-audit-report 26/53
Energy Efficiency Associates – Energy Audit Report 26
6 Mechanicals
The term Mechanicals is used to collectively refer to the systems which heat and cool the
building, create Domestic Hot Water (DHW), and provide for an assured supply of ventilation air.
A traditional heating system typically consists of two components, a mechanism whichburns fossil fuel and transfers heat energy to a heat transportation fluid (air or water, orboth):
1. A furnace (air is the heat transportation fluid) or boiler (hot water or steam is theheat transportation fluid) which burns fossil fuels and transfers the heat producedto the heat transportation fluid.
2. A heat distribution system (ducts when air is the heat transportation fluid) (pipesand radiators or convectors, radiant floor, etc. when water or steam is the heattransportation fluid). Systems which use either liquid water or steam are called‘hydronic’.
3. A ‘hybrid’ system, sometimes called ‘hydro air’ uses a boiler to heat water, whichis piped to an ‘air handler’ in which a coil similar to a radiator in a car is located.The air handler moves air through the coil transferring the heat from the waterinto the air, and the air serves as the final heat (and perhaps cooling) distributionmedia.
6.1 Mechanicals List
This home has a natural gas fired steam boiler, and a separate standing pilot DomesticHot Water (DHW) heater.
Heat distribution via steam uses cast iron radiators.
There is no central A/C.

8/14/2019 Energy Efficiency Associates – Energy Audit Report
http://slidepdf.com/reader/full/energy-efficiency-associates-energy-audit-report 27/53
Energy Efficiency Associates – Energy Audit Report 27
6.1.1 Boiler
The natural gas steam boiler has an AFUE rating of 80.6, which means that on a seasonal
basis it should convert approximately 80 percent of the input fuel energy to useful heat.
This boiler has an electrically controlled damper intended to reduce ‘idle loss’ of heatfrom the boiler up the chimney by closing the flue to reduce heat loss.
6.1.2 Heat Distribution System
The home has a steam heat distribution system which uses single pipe radiators. Somesteam pipe insulation was observed in the basement.

8/14/2019 Energy Efficiency Associates – Energy Audit Report
http://slidepdf.com/reader/full/energy-efficiency-associates-energy-audit-report 28/53
Energy Efficiency Associates – Energy Audit Report 28
6.1.3 Domestic Hot Water (DHW)
A standing pilot natural gas DHW heater of unidentified manufacture (because it was
wrapped in insulation) is used, the efficiency is unknown.

8/14/2019 Energy Efficiency Associates – Energy Audit Report
http://slidepdf.com/reader/full/energy-efficiency-associates-energy-audit-report 29/53
Energy Efficiency Associates – Energy Audit Report 29
6.1.4 Air Conditioning
There is no central A/C. Adding A/C is potentially part of the renovation plan:
7 Electricity Consumption
Electric utility bill analysis indicates very low electricity use, averaging approximately225 KWHr per month.
In the spirit of ‘anything can be made better’, here is some boilerplate background forreference.
However, do examine “Refrigerator” below, it could be responsible for about 1/3 of thecurrent electricity use !
7.1 Electrical Use Tutorial
If there are any lights or appliances that are operating 24 hours a day, they can have asignificant impact on electricity use over a year.
There are 24 hours in a day, and 365 days per year, for a total of 8760 hours per year.
For the purpose of the following discussion assume electricity is priced at about $0.15 perKillowatt Hour (abbreviated KWHr)
One KWHr is the use of 1000 watts of electrical power for a period of one hour.
To calculate the cost of an electrical load which is on 24 hours per day, 365 days peryear, do the following:
Take the number of watts the device uses and divide by 1000 to get Kilowatts,Multiply by 8760, the number of hours in a yearMultiply by the cost of electricity per KWHr, for example, $0.l5 per KWHr
The use of some lights or appliances may be unavoidable, but where ever possible‘always on’ devices should be avoided.
There are a number of incandescent light bulbs used in the building. To the extentpossible, replacing the ones with a ‘high duty cycle’ (i.e. that are on for a relatively largenumber of hours per day) with Compact Fluorescent Lights (CFLs) is a very costeffective, quick return on investment (typically within one year). CFLs also last much

8/14/2019 Energy Efficiency Associates – Energy Audit Report
http://slidepdf.com/reader/full/energy-efficiency-associates-energy-audit-report 30/53
Energy Efficiency Associates – Energy Audit Report 30
longer than incandescent so they cost less in the long run not only in energy saved, but inbulb replacement cost.
There are a wide variety of CFLs on the market, some of which have the same formfactor as traditional incandescent light bulbs.
One source is Energy Federation Inc. in Westboro: www.efi.org
Also see: http://www.energyfederation.org/consumer/default.php See: Lighting BulbsClick on Standard Bulbs and see Capsules for a form factor very similar to conventionalincandescent light bulbs.
CFLs use approximately 1/4th
the electrical energy for the same amount of light output,when compared to incandescent lighting.
High CRI (Color Rendition Index) CFLs are now available for more critical applications
and users who would choose lighting that more closely match the light spectrumproduced by incandescent.
Look for the lower color temperature bulbs (e.g. 2700 degrees Kelvin) for a ‘warmer’looking light. Higher color temperatures tend to be more blue/violet in color.
7.2 Dehumidifier
There was no dehumidifier present.
Managing moisture in basement or below grade areas is important to avoid mold andmildew, and damage to building assemblies.
General strategies to consider are managing water near the foundation via gutters andlong downspouts to transport water as far away from the foundation, grading the soil so itslopes away from the foundation, embedding a water impervious layer around thefoundation perimeter (e.g. plastic) which slopes away from the foundation, etc.
Minimizing basement moisture loading will minimize the need for dehumidification, andtherefore the use of electricity.
In general, controlling moisture in basements by a comprehensive source managementstrategy, (i.e. try to control the source of the problem, rather than dealing with theproblem that results) is the most cost effective and practical approach for the long term.
So, reduce the amount of moisture entering the basement both through the foundation aswell as via warm summer air entering the basement.

8/14/2019 Energy Efficiency Associates – Energy Audit Report
http://slidepdf.com/reader/full/energy-efficiency-associates-energy-audit-report 31/53
Energy Efficiency Associates – Energy Audit Report 31
Recall the Psychrometric Chart illustrates that as air cools, its’ ability to hold moisturedecreases.
So warm and moist summertime air will deposit liquid water on the cool surfaces in abasement such as the slab and lower portions of the foundation.
So in general, ventilating basements in the summer will increase the amount of moisturecontributing to mold and mildew formation.
7.3 Air Conditioning
Air Conditioning can be a significant use of electricity in a building.
This home does not have air conditioning.
7.4 Refrigerator
Refrigerators are high ‘duty cycle’ electricity users since they are required to remain cold24 hours a day, 365 days per year.
There are a few refrigerator savings calculator available at:http://www.energystar.gov/index.cfm?c=refrig.pr_refrigerators
One in particular can find the estimated energy use from your model number, typicallylocated on a label inside the refrigerator or freezer compartment.
http://www.energystar.gov/index.cfm?fuseaction=refrig.calculator
There is a refrigerator in the kitchen, unfortunately the EnergyStar website does not havethis model Whirlpool 21BFA96, but given the configuration and estimated age, thisrefrigerator could use about 900 KWHR/Year, or 75 KWHR/month, which is about athird of the monthly electricity use of 225 KHWR/Year.
An EnergyStar replacement refrigerator of similar size could easily save $65 per year,paying for itself in energy savings in a relatively short period of time.
7.5 “Phantom Loads”
Frequently, electronic devices are not really ‘off’ when the ‘off button’ is pressed.
These devices are said to use ‘standby power’ sometimes called a ‘phantom load’because it is not apparent that they are actually using electricity.

8/14/2019 Energy Efficiency Associates – Energy Audit Report
http://slidepdf.com/reader/full/energy-efficiency-associates-energy-audit-report 32/53
Energy Efficiency Associates – Energy Audit Report 32
Another example is ‘wall warts’ the small, typically black, transformers that plug directlyinto the wall outlet and have a low voltage cord used to charge everything from electrictoothbrushes and shavers to portable vacuums, tools, computer peripherals and displays,etc.
These draw power even if there is nothing plugged into them.
When possible, use a ‘power strip’ with an on / off switch to avoid ‘phantom loads’.
TVs, VCR/DVDs, etc. with remote controls all present phantom loads that can be verysignificant when taken together.
7.6 Measuring Electricity Use – Kill A Watt
It is easy to calculate the cost of two 60 watt outdoor porch lights left on 24 hours a day,365 days per year:
There are 24 hours in a day, and 365 days per year, for a total of 8760 hours per year.
Assume electricity is priced at about $0.15 per Kilowatt Hour (abbreviated KWHr)
One KWHr is the use of 1000 watts of electrical power for a period of one hour.
To calculate the cost of an electrical load which is on 24 hours per day, 365 days peryear, do the following:
Take the number of watts the device uses and divide by 1000 to get Kilowatts,Multiply by 8760, the number of hours in a yearMultiply by the cost of electricity per KWHr, for example, $0.l5 per KWHr
So for the example of two 60 watt porch light bulbs:
So 2 times 60 watts = 120 watts120 watts divided by 1000 = 0.12 KW0.12 KW times 8760 Hours / year = 1051.2 KWHRs
1051.2 KWHrs times $0.15 per KWHr = $157.68 per year
But what can you do about electrical devices that are not on 24 hours a day?
If you know the power that they use when they are on (say a 1000 watt electric heater,which therefore uses 1 KW) you can estimate the percentage of time they are in use,

8/14/2019 Energy Efficiency Associates – Energy Audit Report
http://slidepdf.com/reader/full/energy-efficiency-associates-energy-audit-report 33/53
Energy Efficiency Associates – Energy Audit Report 33
(sometimes called the ‘duty cycle’) and then multiply that ‘duty cycle’ by the number of hours per year to get the total number of KWHrs used.
For the case of a 1 KW heater used 10% of the time:
8760 times 1/10 duty cycle = 876 hours per year876 times 1 KW = 876 KWHrs876 KWHrs times $0.15 = $131.40 per year
But what about ‘wall warts, TVs, computers, etc that are supposed to be ‘off’ ?
You can purchase an inexpensive device called the Kill A Watt at Amazon.com for $25http://www.amazon.com/P3-International-P4400-Electricity-Monitor/dp/B00009MDBU/ref=pd_bbs_sr_1?ie=UTF8&s=electronics&qid=1229825143&sr=8-1
Plug the Kill-A-Watt into the wall outlet, then plug the device you want to measure intothe Kill-A-Watt.
You could, for example, monitor air conditioner use, dehumidifier use, freezer use,electric resistance heat use, etc.
7.6.1 Remote Outlet On – Off Switching
An easy way to switch power to an absolute minimum is with a product called Bye Bye
Standby, which plugs into a wall and then you plug the device to be controlled into it.
The remotes use a tiny amount of power compared to the device you are controlling andyou don’t have to bend over to throw the switch on a power strip. Not yet evaluated, butlooks to be an interesting product.
7.7 Computers
Personal computers can use a surprising amount of power when left on.
Put computers into ‘sleep mode’ or turn them off with a hard (e.g. wall outlet) switch or
power strip when possible.
Choose EnergyStar rated computers when possible.
There is a product called “Smart Strip” that is a power strip into which you plug yourcomputer into in one particular outlet.

8/14/2019 Energy Efficiency Associates – Energy Audit Report
http://slidepdf.com/reader/full/energy-efficiency-associates-energy-audit-report 34/53
Energy Efficiency Associates – Energy Audit Report 34
When that outlet ‘senses’ the computer has gone to sleep or standby, the ‘smart strip’turns off all the other outlets, into which you can plug your peripheral devices like LCDmonitors, printers, scanners, fax, PDA power, and all other computer associated ‘wallwart’ transformer devices, power is removed when the computer is not in use.

8/14/2019 Energy Efficiency Associates – Energy Audit Report
http://slidepdf.com/reader/full/energy-efficiency-associates-energy-audit-report 35/53

8/14/2019 Energy Efficiency Associates – Energy Audit Report
http://slidepdf.com/reader/full/energy-efficiency-associates-energy-audit-report 36/53
Energy Efficiency Associates – Energy Audit Report 36
8.1.1 Comfort vs. Energy Use – A Trade Off
An increase in the inside temperature (to increase comfort) will cause additional heatloss.
This additional heat loss can be compensated for by increasing the thermal resistance of the building envelope, decreasing air infiltration, improving the efficiency of mechanicals, improving insolation, using renewable energy, etc.
One approach to the goal of increasing comfort would be a Deep Energy Retrofit (DER),but this was excluded from consideration due to cost. This approach would use computermodeling to determine the level of insulation, air sealing, mechanical systems changes,etc. which would achieve a desired, very low, annual energy consumption goal.
In this case, the most cost effective comfort related strategies consistent with the goals of enhancing living space in the basement and third floor are discussed here.
The absence of a computer model of energy use in this home makes it difficult to sayprecisely, but it appears this approach will likely not entirely balance out the energy useof this building, if it is to be operated in a more ‘typical’ way with respect to thermostatset-points.
So energy use will likely increase to achieve greater comfort, but the livable space willincrease also.
Energy efficiency measures can reduce the energy use ‘cost’ of making the home morecomfortable.
8.1.2 Air Infiltration
In general, the cause of the most heat loss in our homes is air infiltration.
So part of the strategy should be to reduce air infiltration as cost effectively as possible.
This means implementing air infiltration reduction in all that is done to the home.
This begins with a well designed and aggressive air sealing plan, and if the air infiltration
reduction plan is sufficiently successful, it will likely require some form of mechanicalventilation.
A simple exhaust fan on a timer controller could be used, but superior results could beachieved in terms of energy efficiency by using an ERV, and this would also serve tokeep winter time humidity higher (and summertime humidity lower, if it is used then).

8/14/2019 Energy Efficiency Associates – Energy Audit Report
http://slidepdf.com/reader/full/energy-efficiency-associates-energy-audit-report 37/53

8/14/2019 Energy Efficiency Associates – Energy Audit Report
http://slidepdf.com/reader/full/energy-efficiency-associates-energy-audit-report 38/53
Energy Efficiency Associates – Energy Audit Report 38
The plan to dense pack the band joists from the outside, and to address the apparentlyempty cavities above and below the windows will help reduce air infiltration, as well asconducted heat loss.
The option for air sealing the above grade walls should be considered for some future
time when siding replacement presents this opportunity.
Improving the dense pack cellulose work that was done will reduce energy use due toconducted heat loss and air infiltration, and will help increase comfort due to higher wallsurface temperatures.
The areas above and below the windows, the band joists, and large areas of the third floorwalls and ceiling, and especially the enclosed knee-wall areas should be investigated forair sealing and dense packing improvements.
Insulation and air sealing will be key to increasing comfort and decreasing energy use on
the third floor.
8.1.6 Roof
Presently the attic is the uppermost thermal and air boundary.
8.1.6.1 Attic Floor as Air and Thermal Boundary
It would be possible to air seal the attic floor and use it as the air and thermal boundary,
with the addition of a large amount of inexpensive cellulose it could be a highperformance part of the building for a comparatively low cost.
But the desire to locate an air handler in this space strongly indicates the need to bring theattic into the thermal and air boundary. Ducts located outside the thermal envelope canlose a great deal of energy (even when insulated), leak air, and are otherwise problematic.
Avoid placing ducts outside the thermal envelope whenever possible.
8.1.6.2 Rafters as Air and Thermal Boundary
This will be considerably more expensive than using the attic floor, since it representsboth a larger surface area (perhaps on the order of 1.5 times), as well as requiring highercost materials to insulate. So a much larger R Value per square foot will be necessary forinsulation at the roof, as compared to the attic floor. Also consider that for a given areaand R Value, cellulose is less expensive than foam.

8/14/2019 Energy Efficiency Associates – Energy Audit Report
http://slidepdf.com/reader/full/energy-efficiency-associates-energy-audit-report 39/53
Energy Efficiency Associates – Energy Audit Report 39
There are (at least) two ways to insulate the roof assembly, with foam under the boardsheathing (ccSPF, ocSPF) and rigid foam board on the outside, and insulation in the raftercavities.
There are large gaps in the existing roof board sheathing. ocSPF has a tendency to
expand very quickly, making voids and imperfect air sealing more likely. So if ocSPFwas to be used, a ‘flash coat’ of ccSPF might be used to air seal, followed by applicationof the lower cost ocSPF. The issue of thermal bridging of the roof rafters could beaddressed by over-spraying them. Check with building codes, the issue of an ignitionbarrier might need to be addressed with respect to uncovered foam.
Placing rigid foam board on the exterior and air sealing it there is an alternative, theissues with working on any roof would need to be addressed.
In either approach the issue of air sealing the roof assembly to the above grade walls
should be addressed in detail.
8.1.7 Mechanicals
Apparently the steam heat distribution system is not satisfactory, and/or air conditioningis desired. Consider investigating if it could be ‘tuned up’ by someone knowledgeable insteam heating systems.
If the heating system is changed, this is an opportunity to decrease energy use for thesame amount of heating delivered, by choosing veryenergy efficient mechanicals.
The existing natural gas steam boiler is not particularly efficient.
Some mechanical concepts are presented here for consideration.
8.1.7.1 Dual Furnace and Standing Pilot DHW Heater Approach
There is a proposal to install a furnace in the attic to serve the third (and second ?) floors,and a furnace in the basement to serve the first floor.
Purchasing two condensing (i.e. 92% to 95% AFUE) furnaces might be expensive.
It would then be necessary to have a mechanism to make Domestic Hot Water (DHW),the standing pilot tank now used might have issues with a well air sealed building.
A high efficiency instantaneous DHW heater could be used, at additional cost.

8/14/2019 Energy Efficiency Associates – Energy Audit Report
http://slidepdf.com/reader/full/energy-efficiency-associates-energy-audit-report 40/53
Energy Efficiency Associates – Energy Audit Report 40
8.1.7.2 Boiler with Hydro Air Approach
One alternative approach would be hydro/air.
A single condensing boiler (e.g. 92% to 95% AFUE) could be used with an indirect
DHW tank in an ‘hydro air’ setup so that only hot water heating pipes (e.g. ¾” PEX) andrefrigerant lines (for A/C) and the necessary electrical connections are required to reachthe air handler in the attic. This would reduce the mechanicals count from 3 to 1 (insteadof a DHW heater, and two furnaces) and might be more cost effective as well.
8.1.7.3 Boiler with Hydronic Convectors Approach
If the use of air conditioning were not necessary, another approach could be used whichwould eliminate the need to go to the rafters with the thermal boundary in the main partof the attic.
Starting with the boiler / indirect DHW tank system described above, hydronic unforcedand forced air convectors could be used, at least on the third floor, to eliminate the needfor the air handler in the attic.
Toe kick heaters are commonly used, and these could be installed in the insulated kneewall areas in the third floor corner rooms. It might be possible to install such convectorson the second floor as well, and the first floor might be served by conventionalbaseboards.
8.1.7.4 Boiler or Furnace with Mini Split Approach
If air conditioning were desired it might be worth considering yet another alternative thatcould leave the attic floor as the thermal boundary: ductless (or even ducted) mini-splitair source heat pumps to serve the third floor, in conjunction with one of the furnace orboiler based approaches described above to serve the first and second floors.
It might even be possible to put a couple of ducted mini-split units in the attic (providingaccess for repair, perhaps enclosing them in a rigid foam board box) and burying the ductsystem in cellulose.
It might be that in the summer the third floor is much warmer than the floors below, soA/C would be most beneficial there.
It would be possible to put a ducted mini split in the dining/kitchen area for summercomfort.

8/14/2019 Energy Efficiency Associates – Energy Audit Report
http://slidepdf.com/reader/full/energy-efficiency-associates-energy-audit-report 41/53
Energy Efficiency Associates – Energy Audit Report 41
8.1.7.5 Mechanicals Summary
These are some mechanical system concepts to consider.
But key to low energy bills is purchasing the most efficient mechanicals economically
viable, to make up for the additional energy needed to make the home comfortable.
In essence, greater energy efficiency can be used to ‘buycomfort’.
8.1.8 Window Replacement Discussion
The existing windows in the above grade walls have not been optimally installed, and arenot of the highest quality.
However, they are double pane windows with storms, that is, there are three layers of
glazing, and surface films are a large portion of the conducted heat loss performance of windows.
The following is a ‘back of the envelope’ calculation which is expected to be areasonable approximation to actual performance under standard conditions of homeoperation. Note that this calculation is approximate, and uses a constant indoortemperature of 65F.
Since the homeowner could not provide the performance specifications for the existingdouble pane windows, from the CSG Library used with REMRate we have the following
for a generic double pane window with an exterior storm window:U = 0.310, SHGC = 0.460
The actual area of glazing in this building was not available for this report.
Assuming a glazing to conditioned floor area ratio of 20%, we have 0.2 * 2119 = 425 sf of glazing.
Equation #1
Q = U * A * (Ti-To) * Time (in hours)
Heat (BTU) = U (BTU/SF*HR*F) * A(SF) * deltaT (F) * time(Hrs)
Substituting for (Ti-To)*Time) Heating Degree Days @ 65F = 5500 * 24/hours / day =132,000 Heating Degree Hours / Yr
We then have 0.310 * 425 * 132,000 = 17,391 KBTU/ Yr

8/14/2019 Energy Efficiency Associates – Energy Audit Report
http://slidepdf.com/reader/full/energy-efficiency-associates-energy-audit-report 42/53
Energy Efficiency Associates – Energy Audit Report 42
Given the conversion efficiency of the existing steam boiler is about 80%, the annualsource fuel requirement is about
1.2*17,391 KBTU/ Yr = 20.870 KBTU/Yr,
and so at 100 KBTU/Therm,
208.7 therms of gas a year.
Next steps:
1. Compare this to a good quality triple glazed window with U = 0.202. Calculate expected fuel savings.3. Evaluate the savings over the useful lifetime of the improvement.
Assume for this the improvement lifetime is 30 years, windows cost $15,000
…

8/14/2019 Energy Efficiency Associates – Energy Audit Report
http://slidepdf.com/reader/full/energy-efficiency-associates-energy-audit-report 43/53
Energy Efficiency Associates – Energy Audit Report 43
Rather than present these equations in text, the spreadsheet below is used to organize andcalculate this data:
Window Heat Loss Calcs Now What If …28 Mansfield, Allston
Q=U*A*(Ti-To) * Time (basic conducted heat transfer)
Heating Degree Days (BOS) 5500
Hours in a day 24
Heating Degree Hours (BOS) 132000
Conditioned Floor Area 2119
Percent glazed of floor area 0.2
Glazed area 423.8
Present case U Value 0.31 0.2
Annual Heat Loss Windows (KBTU/Yr) 17341.896 11188.32Heating System Efficiency 0.8 0.8
Annual Source Fuel Requirement (KBTU/Yr) 21677.37 13985.4
KBTU/Therm 100 100
Therms used annually 216.7737 139.854
Price per therm $2.00 $2.00
Annual heating fuel cost $433.55 $279.71
Annual heating fuel cost difference $153.84
Service life of Improvement 30
Fuel cost savings over improvement service life $4,615.18
Cost of improvement $15,000
Simple cost to benefit ratio 3.25
So the (simple) time to improvement payback exceed s the cost of the improvement by afactor of more than three.
NPV will make this worse.
Window ‘tune up’ might improve air sealing somewhat. Air sealing of the existingwindows is not seen as a major contribution to heat loss in this building, there are othermore cost effective opportunities to reduce air infiltration. It is a comfort consideration insome places in the home.
Perhaps a larger concern is the quality of the installation of the windows and theiroperability, but it may be possible to address this relatively inexpensively.
So it is likely that rather than spending money on new windows, this money might bebetter spent on air sealing. This is discussed next.

8/14/2019 Energy Efficiency Associates – Energy Audit Report
http://slidepdf.com/reader/full/energy-efficiency-associates-energy-audit-report 44/53
Energy Efficiency Associates – Energy Audit Report 44
8.1.9 Air Sealing Discussion
It is difficult to estimate the cost of air sealing without having the air sealing cost estimate
available. In fact, it is difficult to estimate what a given amount of air sealing will cost,this comes with a great deal of experience.
Design and execution of a good air sealing plan is key to good results.
However, the following is an example, using an educated guess:
Air Infiltration Reduction BenefitNumber of Therms of gas saved per 100 CFM50reduction 7
Estimate of air sealing blower door reduction (CFM 50) 2000
Number of Therms of gas saved annually 140
Price per Therm $2.00
Annual fuel Cost Savings $280.00
Service life of improvement 30
Fuel cost savings over improvement service life $8,400.00
Cost of improvement $5,000
Simple cost to benefit ratio 0.5952381
So this improvement will pay for itself in approximately six tenths of the improvementsservice lifetime.
This is about five times more cost effective than the window scenario outlined above.
If the air infiltration is reduced sufficiently a ventilation system should be used.
Some would argue that a ventilation system is a good idea in any case.
A ‘ventilation system’ could be something as simple as a bathroom exhaust fan on acontroller, or better still an ERV which would recover some (or even most) of the energyfrom the outgoing air stream, as well as working toward optimal indoor air humidity.
A 2000 CFM50 reduction on the blower door test would mean, very approximately,closing what amounts to a 200 square inch hole to outside.
By increasing the interior temperature setting, and reducing heating energy losses due toair infiltration, greater energy efficiency is being used to ‘buy comfort’.
8/14/2019 Energy Efficiency Associates – Energy Audit Report
http://slidepdf.com/reader/full/energy-efficiency-associates-energy-audit-report 45/53
Energy Efficiency Associates – Energy Audit Report 45
8.1.10 Overall Impressions
The measured air infiltration in this home is not as bad as some, but there is substantialroom for reduction.
Without exposing the above grade walls, a 2000 CFM50 reduction should be possible byaddressing the basement and attic plane (or roof plane) with good blower door driven airsealing technique, and some strategic dense packing in the above grade walls (especiallyabove and below windows) and band joists.
Air sealing the rim joist alone could be worth 200-300 CFM50.
Air sealing should be considered a key factor to increase comfort and decrease energy
use.
When air sealing a building, consider the combustion air needed by the mechanicalsystems, this is a safety issue. The domestic hot water heater appears to have evidence of flame ‘rollout’.
8/14/2019 Energy Efficiency Associates – Energy Audit Report
http://slidepdf.com/reader/full/energy-efficiency-associates-energy-audit-report 46/53
Energy Efficiency Associates – Energy Audit Report 46
8.1.11 Heat or Energy Recovery Ventilation System
Traditionally built homes have no provision for ventilation air, this happens ‘accidently’
due to the manner in which homes were built.
Continuous, assured ventilation has not been traditionally considered in the design of most homes.
For this reason, stack effect ventilation is the default for most homes, resulting inexcessive or insufficient air exchange, air infiltration from an undesirable portion of thehome ( i.e. a place in which mold, mildew, mechanical systems, radon / soil gas, etc.,exists) the basement.
The EnergyStar program in Massachusetts recognizes this as a serious flaw, and requires
mechanical ventilation. Exhaust ventilation (which typically uses basement air) is anacceptable solution.
It is a good idea to provide for a sufficient amount of ventilation, an energy efficientcontinuously operating bathroom exhaust fan on the second floor could accomplish this.
It is better to control both the source and destination of that air, as well as recoveringsome of the heat energy in the exhaust air stream.
The best solution for a number of reasons including quality of the incoming air, as well asminimizing energy use and filtration, is a heat or energy recovery ventilator.
The amount of ventilation air is typically determined by the ASHRAE 62.2 calculation,(Number of bedrooms + 1) * 7.5 + 0.01* conditioned floor area(4+1) * 7.5 + (0.01*2119) = 60 CFM continuous.
The heating and cooling cost of this amount of air is largely determined by the heat andenergy recovery efficiency of the HRV or ERV.
The electrical efficiency of the fans used in the HRV or ERV is also an importantconsideration, since they typically operate 24 x 7 x 52 = 8760 hours per year.
An HRV or ERV system uses ducts which should be carefully designed, ACCA ManualD is a useful tool in the design and verification of duct systems.

8/14/2019 Energy Efficiency Associates – Energy Audit Report
http://slidepdf.com/reader/full/energy-efficiency-associates-energy-audit-report 47/53
Energy Efficiency Associates – Energy Audit Report 47
8.1.12 Miscellaneous
8.1.12.1.1 Steam Convectors
Consider removing covers over steam heat convectors to determine if this improvescomfort immediately.
8.1.12.1.2 Room Above Front Porch
Consider creating access to the front porch ceiling and aggressively air sealing here,perhaps adding at least one inch of rigid foam board as a thermal break.
There was not a large amount of air movement observed here, but at least inspecting thequality of the cellulose installation by removing one of the plugs in the porch ceilingshould be considered.
Create access to the ceiling in the room over the front porch and assess air sealing andinsulation.
There was not a large amount of air movement observed here, but consider makingaccess and inspecting this area.
Try removing the box covering the steam convector in this room.
8.1.12.1.3 Comfort In The Kitchen
Consider removing baseboard in the area of the kitchen table (and perhaps kitchen ingeneral) to address air sealing (see IR and visible image above illustrating air infiltrationin this area). This might be helpful in assessing the framing technique used in the area of the rim joist, which could be valuable when designing the air sealing detail here.
This area might or might not be addressed by the planned basement rim joist ccSFP
This is both a comfort and energy loss issue, if you are sitting near sites of air infiltrationyou will be less comfortable.

8/14/2019 Energy Efficiency Associates – Energy Audit Report
http://slidepdf.com/reader/full/energy-efficiency-associates-energy-audit-report 48/53
Energy Efficiency Associates – Energy Audit Report 48
8.1.12.1.4 Window Installation
Consider removing the trim around the windows and air sealing the installation.
See IR and visible images above for an illustration of the air infiltration in these locations
under blower door test pressure.
Prioritize windows in areas near where people spend time sitting.
8.1.12.1.5 Attic Access Hatch
Air sealing and insulation of the attic hatch could be improved, see IR and visible imagesabove. People in bathrooms are especially susceptible to drafts.
8.1.12.1.6 Basement Chimney Chase
If the chimney is not removed for use as a chase, air seal the chimney chase framing tothe chimney using code approved materials and techniques. See Insulate and Weatherize(References, below) for suggestions.
8.1.12.1.7 Refrigerator
Measure electricity use of the refrigerator with a Kill-A-Watt meter (see Referencesbelow) and use the EnergyStar refrigerator replacement calculator (see References below)to consider a new, energy efficient refrigerator (shop using the EnergyStar Appliance
Efficiency Ratings see References below).
Due to the current very low electricity use, the refrigerator may be responsible for up to1/3 of the current electricity use (see Refrigerator, above).

8/14/2019 Energy Efficiency Associates – Energy Audit Report
http://slidepdf.com/reader/full/energy-efficiency-associates-energy-audit-report 49/53
Energy Efficiency Associates – Energy Audit Report 49
9 Renewable Energy Assessment
When applying renewable energy sources to a building, there is a sequence driven byeconomics and other practical considerations that is usually followed:
1. Improve the building envelope2. Improve the mechanical s systems3. Add renewable energy sources as a final improvement
The two renewable technologies most appropriate for this home are solar photovoltaic(PV - electricity made from the sun) and solar thermal (domestic hot water made from thesun).
This building is reasonably well oriented for roof mounted solar devices, solar DHWwould likely be the most advantageous, PV could also be considered.
There appears to be sufficient South facing roof area for a combination of Solar Thermaland PV.
The initial investigation into solar renewable energy should include a shading assessment.

8/14/2019 Energy Efficiency Associates – Energy Audit Report
http://slidepdf.com/reader/full/energy-efficiency-associates-energy-audit-report 50/53
Energy Efficiency Associates – Energy Audit Report 50
10 Thermal and Air Barrier Overview
According to the American Society of Heating and Refrigeration Engineers (ASHRAE)
Fundamentals Handbook, from 20% to 50% of a building’s thermal load (the amount of heat that must be supplied to compensate for heat loss) is due to air infiltration.
Whenever the outdoor temperature is significantly lower than the inside temperature,stack effect causes cold, relatively humid winter air to enter the building where itincreases in temperature, and therefore decreases in humidity (see: Psychrometric Chart)
The image below is for reference for the following discussion.

8/14/2019 Energy Efficiency Associates – Energy Audit Report
http://slidepdf.com/reader/full/energy-efficiency-associates-energy-audit-report 51/53
Energy Efficiency Associates – Energy Audit Report 51
This image is from the EnergyStar website:http://www.energystar.gov/index.cfm?c=home_sealing.hm_improvement_sealing
Blue arrows indicate cold air entering the building envelope in the lower, negative
pressure area of the house.
Orange arrows indicate heated air pushing out the upper, positive pressure area of thebuilding envelope, exiting via chimney and plumbing chases, recessed lights, attic hatch,whole house fans, etc.
Minimizing air infiltration will reduce drafts and cold wall/ceiling temperatures that areuncomfortable, will reduce heating bills and facilitate wintertime humidity control.
Controlling stack effect will also minimize vapor transport and the associated buildingdegradation when water vapor condenses on cold surfaces consistently over a long period
of time without sufficient opportunity to properly dry out.
However, since stack effect also has the effect of ‘dehydrating’ the building, managingbuilding moisture issues such as a frequently damp or wet basement must be consideredbefore significantly changing air infiltration.
The heating and cooling system in a building is intended to condition a ‘BuildingEnvelope’ or ‘Thermal Boundary’ which contains the heating and cooling, so as toprovide a comfortable environment for the occupants.
The red in the image above outlines the thermal boundary for a home in which thebasement is inside the thermal boundary.
For proper building comfort, energy performance, and building durability, the thermaland air boundaries of a building should be coincident and well executed.
The value of insulation is widely appreciated, but the importance of and the reasons forair infiltration control are not so widely understood and valued.

8/14/2019 Energy Efficiency Associates – Energy Audit Report
http://slidepdf.com/reader/full/energy-efficiency-associates-energy-audit-report 52/53
Energy Efficiency Associates – Energy Audit Report 52
11 Radiant Temperature Overview
Perceived comfort is not entirely defined by air temperature and air motion (e.g. drafts).
Surfaces which are at a lower temperature than the air temperature both cool the air andcan (if the temperature difference is great enough, like windows on very cold days) createconvection currents that feel like drafts.
But the surfaces which are at a lower temperature also radiate less infrared radiation. Sowhen you are in an environment with an otherwise acceptable air temperature, you mayfeel uncomfortably cool near a cold wall or window, because that surface emits lessinfrared radiation to warm you.
12 References
Insulate and Weatherize, Bruce Harley – Excellent overview of all aspects of homeenergy improvement, written by an experienced professional, with numerous illustrations,many important details. Available from Amazon for about $14
AHRI - Air Conditioning, Heating and Refrigeration Institute - Directory of manymechanicals, find input, output, power AFUE, etc.http://www.ahridirectory.org/ahridirectory/pages/home.aspx
Chimney Balloon – For fireplaces with stuck or otherwise inoperable dampers which area clear path for stack effect airflow. See: www.chimneyballoon.us
CoolSmart – Air Conditioning Service – Properly charged and serviced air conditioningunits use less energy and perform better. www.mycoolsmart.com
Commonwealth Solar – In Massachusetts significant rebates are available forPhotovoltaic arrays, learn how to estimate your costs, benefits and how to apply:www.masstech.org/SOLAR
EFI – Energy Federation Inc – A Westborough, MA based company dealing in a widevariety of energy efficiency related products. Source for one and two part air sealing
foam, attic hatch covers, an extensive range of Compact Fluorescent Lights (CFLs),QLON weather-stripping, Panasonic Whisper Green bath and ventilation fans, HeatRecovery Ventilators (HRV), etc. www.efi.org/
EnergyStar on Air Sealing and Insulation – Numerous resources here including a DIY(Do It Yourself) Gide to Air Sealing and Insulating with EnergyStarhttp://www.energystar.gov/index.cfm?c=home_sealing.hm_improvement_sealing

8/14/2019 Energy Efficiency Associates – Energy Audit Report
http://slidepdf.com/reader/full/energy-efficiency-associates-energy-audit-report 53/53
Energy Efficiency Associates – Energy Audit Report 53
EnergyStar Appliance Efficiency Ratings – Look here when purchasing newappliances to determine energy use for all EnergyStar listed appliances.http://www.energystar.gov/index.cfm?c=appliances.pr_appliances
Energy Savings Reality Check – Michael Blasnik does statistical analysis of large scale
weatherization efforts to discover ‘What Works and What Doesn’t Work”. Learn aboutthe energy savings measures that are effective, and which have little payback.www.nliec.org/2007%20Conference/Presentations/MBlasnik_Energy%20Conservation.pdf
OilHeatAssociates.com – Free oil fired mechanicals consulting. Call and ask questionsabout any oil fired mechanical system questions (tell them I sent you!):www.oilheatassociates.com
Field Controls makes a number of control and venting products that can be applied to
boilers and furnaces. These include the Field Controls AirBoot, and the Air VentDamper. See: http://www.fieldcontrols.com/
Psychrometric Chart – Use this to determine the humidity change for a temperaturechange only, etc. Available free at: http://www.linric.com/free4me.htm
Tax Credits – For a description of Federal tax credits available for energy efficiencyimprovements, see:http://www.energystar.gov/index.cfm?c=tax_credits.tx_index
Kill-A-Watt - You can purchase an inexpensive device called the Kill A Watt atAmazon.com for $25http://www.amazon.com/P3-International-P4400-Electricity-Monitor/dp/B00009MDBU/ref=pd_bbs_sr_1?ie=UTF8&s=electronics&qid=1229825143&sr=8-1