energy efficiency and conservation strategy · energy efficiency and conservation strategy this...
TRANSCRIPT
ENERGY EFFICIENCY AND CONSERVATION STRATEGY
This project has been funded through a grant from: United States Department of Energy - American Recovery and Reinvestment Act
Submitted to the Department of Energy December 4, 2009
Original Draft Completed By: 11/25/2009
3950 Sparks Drive SE Grand Rapids, MI 49546
(616) 574-8500
Revised By: Kent County Energy Steering Committee 12/3/2009
TABLE OF CONTENTS
Executive Summary
I. Purpose
II. Methodology
III. Baseline Energy Use
IV. Green House Gas (GHG) Inventory
V. Recommendations for GHG Credits
VI. Energy Usage GHG Forecast
VII. General Recommendations
VIII. Timeline for Implementation
IX. Leveraging/Coordination of Funds
X. Monitoring and Evaluation
XI. Recommendations for Unfunded Activities
XII. Energy Efficiency Block Grant Reporting
XIII. Sustaining Energy Efficiency Projects in Kent County
XIV. Recycling and Disposal
XV. Conclusion
XVI. Attachments: A: Kent County Facility List B. Project Prioritization Matrix C. Baseline Energy Use Summary E. Baseline GHG Emissions Summary F. Consumers Energy Rebate Program Guidelines G. Non-Funded EECS Projects H. Terms and Conversion Factors I. Kent County Energy Tracking Form J. EECBG Activity Work Sheets
Kent County EECBG Page 2 of 42

I. Executive Summary
In 2009, Kent County received a $2,796,700 formula grant through the Department of Energy - Energy Efficiency and Conservation Block Grant (EECBG). To plan for the implementation of these funds and to meet the Department of Energy (DOE) Funding requirements, Kent County developed this Energy Efficiency and Conservation Strategy to guide the short-term use of these funds as well as a longer-term strategy for energy conservation and cost avoidance.
Prior to the award of funds from the DOE, Kent County had been actively working on initiatives aimed at energy efficiency. This document builds upon those activities and through this grant the County has identified projects that will result in long-term benefits to the County. Funding for these initiatives combined with the educational components is estimated to yield the County an energy savings of at least $131,390 in 2010, $390,733 in 2011, $399,407 in 2012, and $416,753 in 2013. In addition, the City of Grand Rapids will also benefit from the County funded projects to the tune of $27,555 in 2010 and $130,954 each year thereafter assuming that all projects proposed are implemented and fully funded. The County will also benefit from the projects that are funded by the City through their EECBG as a result of shared infrastructure and mechanical systems.
This strategy reviewed 13 Kent County Facilities and completed a baseline study of energy use and greenhouse gas emissions in each of these facilities. In addition, the study also reviewed the greenhouse gas emissions from the County’s fleet of vehicles. The study concluded that four of ten County facilities are currently operating within energy use standards as calculated by the Energy Star Portfolio Manager tool, while the remaining six facilities will benefit from the projects identified to be funded through the EECBG.
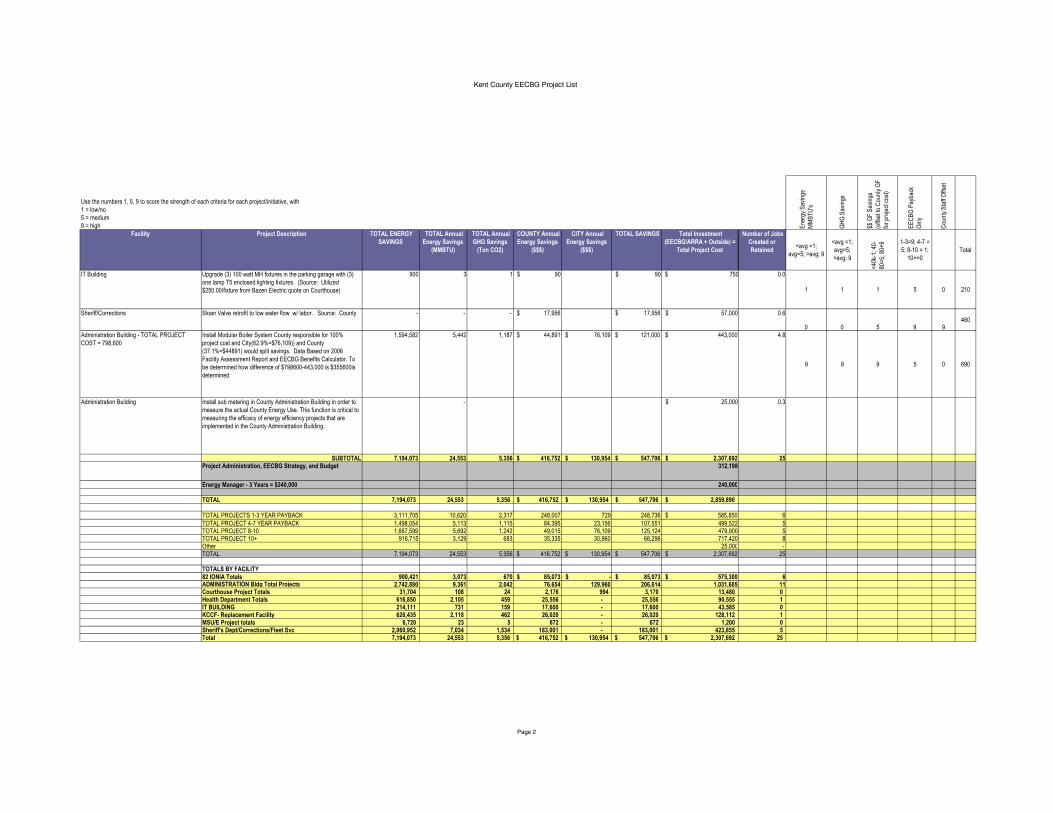
Overall, this Strategy is recommending the funding of 24 energy projects at a total cost of $2,307,692 which is projected to annually save 7,194,073 kwh and result in annual cost savings/avoidance of $547,707 for both the City and the County when all projects are fully implemented in 2013. Ten percent of the total project EECBG costs have been set-aside as a contingency. If these funds remain unused, they will be reallocated to fund additional energy efficiency projects. The Strategy also provides funding for the County to consider hiring an energy manager and also provides a nominal amount of funding to cover the costs associated with the federal reporting process and administration of the grant.
The Strategy recommends the following for Kent County: • Implement the 24 Energy Efficiency Projects funded through the EECBG. • Consider establishing an Energy Manager to oversee and administer the
implementation of this Strategy. • Monitor technical advancements and building performance. • Continue to develop the work of the Energy Steering Committee. • Install sub-metering in the Administration Building. • Conduct a review of energy use at the Sheriff’s Department Community
Reentry Center. • Join Energy Star as a governmental entity.
Kent County EECBG Page 3 of 42

• Continue to implement Kent County’s Employee Information and Awareness Initiatives.
Through the implementation of the EECBG funded project and the longer-term strategies for energy conservation and reduction, Kent County stands to significantly benefit by developing an effective program that will monitor, report, and evaluate the efficacy of the DOE grant.
Kent County EECBG Page 4 of 42
ENERGY EFFICIENCY AND CONSERVATION STRATEGY
I. Purpose
In 2009 Kent County was awarded a $2,796,700 formula grant through the Department of Energy – Energy Efficiency Block Grant (EECBG). This grant became possible as a result of the American Recovery and Reinvestment Act which has been developed to assist in both stimulating the economy as well as providing local governmental units with opportunities to implement projects related to energy that will result in multiple benefits, which include:
• Reduction in energy use • Job creation • Reducing and/or improving the environmental impact of local government
operations • Cost avoidance and cost containment
Together these elements build upon the findings defined by the Kent County Energy Use Reduction Workgroup Report on Energy Use1.The following EECBG Strategy was designed to provide Kent County with the following:
• Baseline analysis of energy use as greenhouse gas emissions. • Development of Goals and Objectives for the following metrics:
o Jobs created/retained o Energy use reduction o Renewable energy capacity o GHG emissions reduced o Cost savings o Energy saved o Funds leveraged
• Framework for evaluation, monitoring, and verification of the Strategy. • Recommendations on the activities to be funded by the EECBG. • Recommendations on the activities not funded by the EECBG but important.
to sustaining the longer-term strategy of energy savings and cost avoidance. • Recommendations on trading GHG credits. • Process for quarterly and annual reports. • Strategies to leverage other funds.
1 County of Kent. Kent County Energy Use Reduction Workgroup – Report and Recommendations. December 12, 2008.
Kent County EECBG Page 5 of 42

• Plan for how activities will be sustained beyond the grant period.
This Strategy, when combined with the work of the Energy Steering Committee, identifies opportunities for the County to implement improvements in existing and sometimes aged infrastructure.
II. Methodology
To meet the 120-day requirement of the Department of Energy to complete an Energy Efficiency and Conservation Strategy, Kent issued an RFP to retain a consultant to assist in the development of the Strategy.
This Strategy reviews infrastructure improvements in 13 Kent County facilities which include:
• Kent County Administration Building • Kent/MSU Cooperative Extension • 17th Circuit Court • Fleet Services • Kent County Health Department • Information Technology (IT) Building • Juvenile Detention Center • 82 Ionia • KCH Boiler Plant • Sheriff’s Department, Administration Building • Sheriff’s Department, Community Reentry Center • Sheriff’s Department, Honor Camp • Sheriff’s Department, Kent County Correctional Facility
Although the American Recovery and Reinvestment Act prohibited the use of funds at Zoo facilities, this Strategy did review information and projects related to the John Ball Zoological Park; however, there are no recommendations related to the funding of projects at the Zoo.
In recent years, Kent County has constructed several buildings including the 63rd District Court, Kent County Animal Shelter, and Kent County Human Services Complex with energy efficiency strategies in mind. Currently, the County is planning and designing a new correctional facility that will combine energy savings strategies funded through the EECBG with energy saving strategies in the design and construction phases that will jointly work to reduce energy consumption, improve energy utilization, and result in cost containment and cost avoidance for the County.
To complete this Strategy the consultants reviewed existing County work products such as recent energy audits, energy (electricity, natural gas, purchased steam) and fleet fuel usage spreadsheets, and energy plans/programs, etc. Facilities Management staff were also interviewed to determine what energy conservation projects cited in the recent
Kent County EECBG Page 6 of 42
energy audits have been implemented and any programmed changes and/or growth that is anticipated.
A GHG inventory and baseline indicator of energy consumption and greenhouse gas emission inventories was developed for the County buildings.
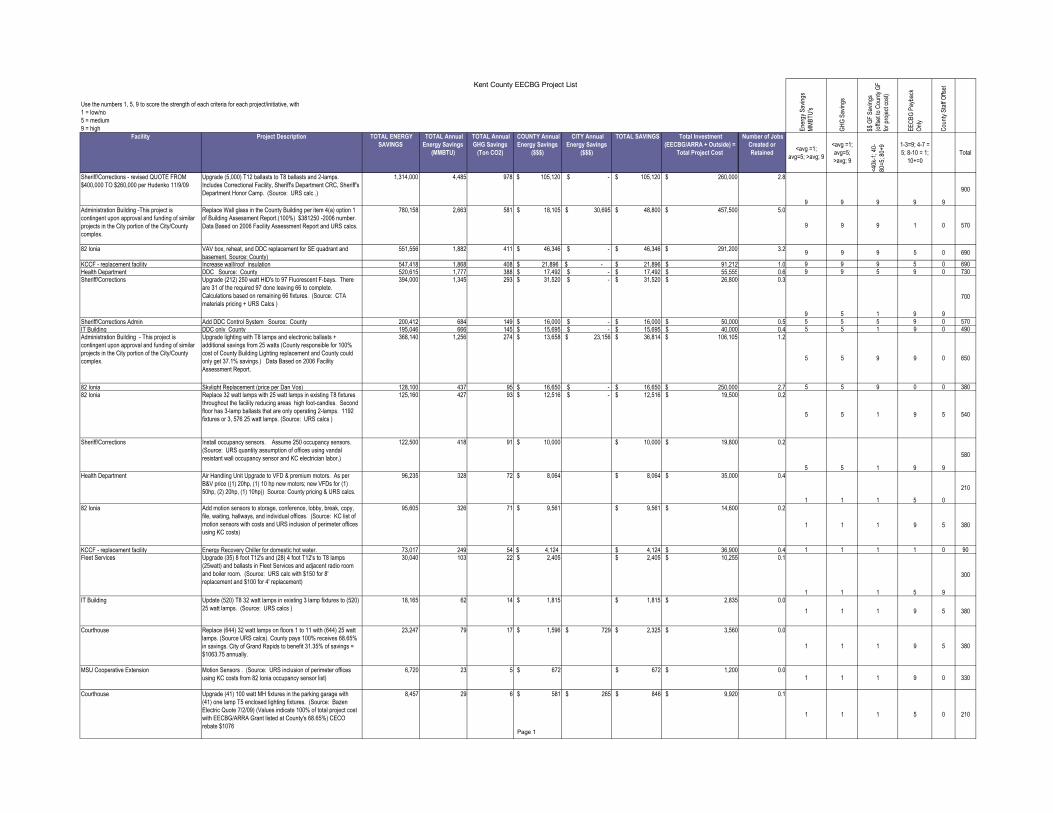
Throughout this process, there were specific projects identified that were subsequently compiled into a prioritization matrix as reflected in Attachment B. Each project was evaluated and assessed an estimate for the amount of energy savings (kwh), greenhouse gas savings, jobs created, and a variety of other factors. To prioritize these projects, County staff identified five variables that were weighted and scored to subsequently determine the order of priority. Each project had a possible score of 900. The variables evaluated included:
• Amount of Energy Savings (MMBTU's): Projects were compared against one another based upon the average of all projects. If below average, the project scored a 1; if near average the project scored a 5; if above average the project scored a 9.
• Annual Greenhouse Gas Savings (Ton CO2): Projects were compared against one another based upon the average of all projects. If below average, the project scored a 1; if near average the project scored a 5; if above average the project scored a 9.
• Annual amount of General Fund ($$) savings as a result of energy efficiencies: Due to the large range in projects savings, those projects saving less than $40,000 scored a 1; $40,000-$80,000 were scored a 5; above $80,000 in annual savings projects were scored a 9.
• Payback: Each project was assessed a score based upon the length of the payback. For those projects with a payback period of 0-3 years scored a 9; 4-7 years a 5; 8-10 years a 1; 10+ years = 0
• County staff off-set: For those projects where the County employs staff qualified
to perform the labor for the projects identified, the County intends to bill these costs as a part of the project cost. This scoring was determined with facility managers and was assessed based upon the availability of staff to perform the labor as well as having the appropriate qualifications to perform the labor. These funds will assist in retaining current Kent County employees.
Following the completion of the prioritization matrix, the County was able to identify the appropriate projects to be implemented through this DOE grant. To meet DOE requirements, this Strategy also contains specific project activity worksheets outlining each project, goals, objectives, and estimated savings.
III. Baseline Energy Use
Kent County maintains an energy database which provides energy use information and provides for tracking of electricity, natural gas, steam and gasoline usage. This database,
Kent County EECBG Page 7 of 42

together with additional energy usage information supplied by Kent County, provided the basis for the energy analysis. The database and this analysis have established the calendar year 2007 as the Baseline for tracking the energy use and GHG inventories and forecasts.
This database converts all energy recorded to a British Thermal Unit (BTU) basis and calculates the change in overall BTU usage for the buildings being tracked on a Degree Day basis. A heating degree day is a quantitative index designed to reflect the demand for energy needed to heat a building. A cooling degree day reflects the amount of energy used to cool a building. These indices are derived from daily temperature observations.
Tracking energy usage on a Degree Day basis can be useful in normalizing energy usage data for weather conditions making it possible to compare data from one year with data from another year. However, it is also important to track absolute energy usage, as is being done in the individual worksheets to compare the energy efficiency of buildings during the same month of the year, as well as to understand energy usage patterns and trends. Energy efficiency improvements should be tracked by considering the trends in energy usage over time as projects are implemented.
The US EPA Energy Star program Portfolio Manager tool was utilized to determine the energy intensity for the buildings. Energy intensity is a measure of the energy used in a particular building per square foot. It can be used to compare building energy performance against other similar buildings and against national averages. The Boiler Plant building was not entered into the tool, since the building type is not represented in the Portfolio Manager database. The data for the Zoo also was not entered into the tool, since the Zoo data represent numerous small buildings. The following table shows the energy intensity for ten of the County buildings, along with the corresponding national average energy intensity for similar buildings, as calculated by the Energy Star Portfolio Manager tool. Note that the County’s energy use database tracks the Correctional Facility, Sheriff’s Administration, and Fleet Services together resulting in data reflecting ten facilities. The data below indicates that some buildings are performing better/lower than the national average, while other facilities are performing at a rate worse/higher than national averages.
Kent County Energy Intensity – Baseline Data
Building Name Energy Period Ending Date
Site Energy Intensity
(kBtu/Sq. Ft.)
National Average Site EUI (kBtu/Sq.
Ft.)
Sheriff's Dept. Community Reentry Center 12/31/2007 243.2 87
IT Building 12/31/2007 193.3 104
Juvenile Detention Center 12/31/2007 148.9 138.2
Sheriff's Dept. Correctional Facility/Fleet Services 12/31/2007 137.1 168.8
Administration Building 12/31/2007 133.6 89.8
Health Department* 12/31/2008 100.1 93.9
Sheriff's Dept Honor Camp 12/31/2007 97.6 96.9
Courthouse 12/31/2007 96.9 109.9
82 Ionia Building 12/31/2007 67.4 96.6
Cooperative Extension 11/30/2007 63.3 67 *Based on 2008 data (11 months Electric prorated to 12-months and 12-months Nat. Gas) as 2007 data was not available.
Kent County EECBG Page 8 of 42
As seen in the table on the prior page, the Administration Building, IT Building, Honor Camp, Juvenile Detention Center, Community Reentry Center, and Health Department are operating at a rate above the national average for buildings of comparable use and size. As it relates to the County Administration building, the County and City have their own facilities but the facilities share some of the mechanical systems. As a result, the City and County share energy costs based upon the square footage of each facility. Under this agreement the County is assessed 37.1% of the total energy used by the City-County building complex versus the amount actually expended within that portion of the complex. As for the high energy intensity of the IT Building, a current energy-related project is underway in the facility and estimated to bring that facility back in alignment with the national average for this type of facility. The excessive energy intensity for the Community Reentry Center requires a more in-depth facility evaluation to determine whether it is a construction issue, inefficient use of energy issue, or merely a matter of inaccurate data recording.
During the development of the GHG inventory and energy use baseline, it appeared that a portion of the utility data for the Health Department may not be tracked correctly. In fact, it was later determined that prior to 2008, the facility’s utilities were part of the total campus metering, not metered separately as would be required to be properly tracked. For that reason, 2008 utility information was used at the baseline usages rather 2007 data as used for all other buildings.
It is recommended that Kent County prioritize energy efficiency and conservation projects based on energy intensity performance, giving higher priority to the buildings which perform below average. Energy costs per square foot were not determined, but will follow the same trend as energy intensity.
IV. Green House Gas (GHG) Inventory
A spreadsheet was created to show both GHG emissions (Scope 1 and 2) for the buildings in the scope of this project which included emissions from the county-owned vehicle fleet.
Scope 1 GHG emissions are direct emissions from the combustion of fuel at County buildings or in County equipment. Scope 2 GHG emissions are indirect emissions that occur at power plants not owned by the County, and are caused by the usage of steam and electricity in the County buildings. The summation of these Scope 1 and Scope 2 emissions represents the GHG Inventory, also called the Carbon Footprint, for the eleven facilities being addressed as well as the associated vehicle fleets.
The following table shows the ranking of the Scope 1 and 2 GHG emission intensities for all buildings except for the KCH Boiler Plant. It is not appropriate to rank the KCH Boiler Plant on a GHG emission intensity basis, since the energy output from this facility is used to provide heat to buildings that are out of the scope of this study. A completed spreadsheet output is attached as attachments entitled “Energy Use Baseline” and “GHG Summary Inventory.”
Kent County EECBG Page 9 of 42
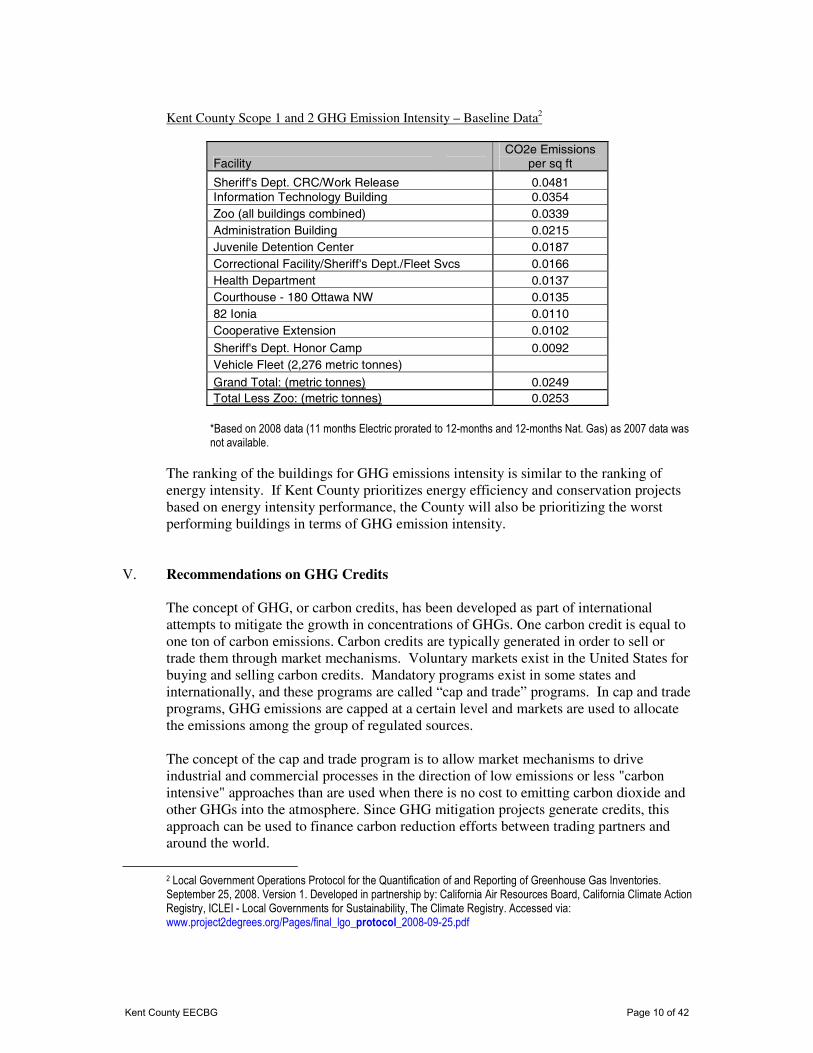
Kent County Scope 1 and 2 GHG Emission Intensity – Baseline Data2
Facility CO2e Emissions
per sq ft
Sheriff's Dept. CRC/Work Release 0.0481 Information Technology Building 0.0354 Zoo (all buildings combined) 0.0339 Administration Building 0.0215 Juvenile Detention Center 0.0187 Correctional Facility/Sheriff's Dept./Fleet Svcs 0.0166 Health Department 0.0137 Courthouse - 180 Ottawa NW 0.0135 82 Ionia 0.0110 Cooperative Extension 0.0102
Sheriff's Dept. Honor Camp 0.0092 Vehicle Fleet (2,276 metric tonnes)
Grand Total: (metric tonnes) 0.0249 Total Less Zoo: (metric tonnes) 0.0253
*Based on 2008 data (11 months Electric prorated to 12-months and 12-months Nat. Gas) as 2007 data was not available.
The ranking of the buildings for GHG emissions intensity is similar to the ranking of energy intensity. If Kent County prioritizes energy efficiency and conservation projects based on energy intensity performance, the County will also be prioritizing the worst performing buildings in terms of GHG emission intensity.
V. Recommendations on GHG Credits
The concept of GHG, or carbon credits, has been developed as part of international attempts to mitigate the growth in concentrations of GHGs. One carbon credit is equal to one ton of carbon emissions. Carbon credits are typically generated in order to sell or trade them through market mechanisms. Voluntary markets exist in the United States for buying and selling carbon credits. Mandatory programs exist in some states and internationally, and these programs are called “cap and trade” programs. In cap and trade programs, GHG emissions are capped at a certain level and markets are used to allocate the emissions among the group of regulated sources.
The concept of the cap and trade program is to allow market mechanisms to drive industrial and commercial processes in the direction of low emissions or less "carbon intensive" approaches than are used when there is no cost to emitting carbon dioxide and other GHGs into the atmosphere. Since GHG mitigation projects generate credits, this approach can be used to finance carbon reduction efforts between trading partners and around the world.
2 Local Government Operations Protocol for the Quantification of and Reporting of Greenhouse Gas Inventories. September 25, 2008. Version 1. Developed in partnership by: California Air Resources Board, California Climate Action Registry, ICLEI - Local Governments for Sustainability, The Climate Registry. Accessed via: www.project2degrees.org/Pages/final_lgo_protocol_2008-09-25.pdf
Kent County EECBG Page 10 of 42

One key consideration in evaluating whether a carbon credit can be created through a GHG mitigation project is the concept of “additionality.” In order to generate a carbon credit, the GHG mitigation project must meet an additionality test: would the GHG mitigation have happened anyway in the absence of the carbon credit transaction? In other words, would or should the GHG mitigation activity have happened in a business-as-usual case.
As applied to energy efficiency and conservation projects, the fact that the projects result in a desirable economic payback from energy savings is used as a basis to determine that the resulting GHG reductions are not additional and therefore are not “creditable” reductions. There are exceptions, particularly when the energy efficiency or conservation project is large and would not have been undertaken without the additional revenue made available by the generation and sale of carbon credits.
Four of the most prominent voluntary offset programs in the United States are the Chicago Climate Exchange (CCX), The Gold Standard (GS), the Climate Action Reserve (CAR), and the Voluntary Carbon Standard (VCS).
The CCX does not list energy efficiency and conservation projects as being eligible for the generation of carbon offset credits in their listing of prescriptive projects. An entity can submit a proposal for generating carbon credits from projects not on the prescriptive list, but it is unlikely that energy efficiency and conservation projects such as those being considered by Kent County would qualify under the CCX protocol for the generation of marketable carbon credits based on the concept of additionality.
The Gold Standard only includes lighting projects that involve replacing incandescent lights with compact fluorescent lamps (CFLs) in the Gold Standard project eligibility list. The Gold Standard adheres to the Clean Development Mechanism (CDM) additionality definition. Based on this definition, the GHG emission reductions from the energy efficiency and conservations projects being considered by Kent County would not be considered additional.
The Climate Action Reserve was the program used by Kent County to create the carbon credits in the South Kent Landfill Gas-to-Energy Project. However, no protocol exists under the CAR for the creation of carbon credits from energy efficiency and conservation projects. A review of the approved project list shows that there are no energy efficiency and conservation projects listed as having created carbon credits under the CAR program.
The Voluntary Carbon Standard is unique in that it allows the use and development of carbon credit protocols that can be tailored to specific projects, including energy efficiency projects. However, protocols must be approved by the VCS, and the protocols are screened against the CDM definition of additionality. A review of the approved project listing shows that there is one approved energy efficiency project that has successfully generated carbon credits under the VCS program. However, this project, located in Israel, involved the replacement of an entire manufacturing process at an industrial facility with a more efficient process. This project was able to meet the test of additionality because it would not have been implemented without the generation and sale of carbon credits in order to help finance the project.
Kent County EECBG Page 11 of 42
Greater financial incentive may be provided by state and/or utility rebate and incentive programs for energy efficiency.
Kent County should monitor cap and trade legislation that is currently pending before the United States Congress. It is possible that mechanisms for the development of carbon credits will be included in the legislation.
VI. Energy Usage and GHG Emissions Forecast
In order to forecast energy usage and GHG emissions for an entire County, City or other organization, growth and other parameters are factored into the assessment which lead to a forecast of energy usage and GHG emissions increases over time at an estimated percentage. In this case the scope is limited to buildings identified earlier.
Factors such as employee/occupancy changes, building use changes, or new building projects, impact the forecasts for energy usage and GHG emission patterns in the future for buildings. However, given the economic climate and the expectation for governmental agencies to increase energy efficiency, as well as operating efficiencies in general, this analysis has assumed that County operations, energy usage, and GHG emissions will remain static or may even decrease over time. Therefore, the forecast for energy usage and GHG emissions among County facilities is the sum of the amount of energy and emissions saved by all the EECBG projects actually implemented by the County. If County operations grow or shrink from today’s level in the future, these forecasts will need to be updated.
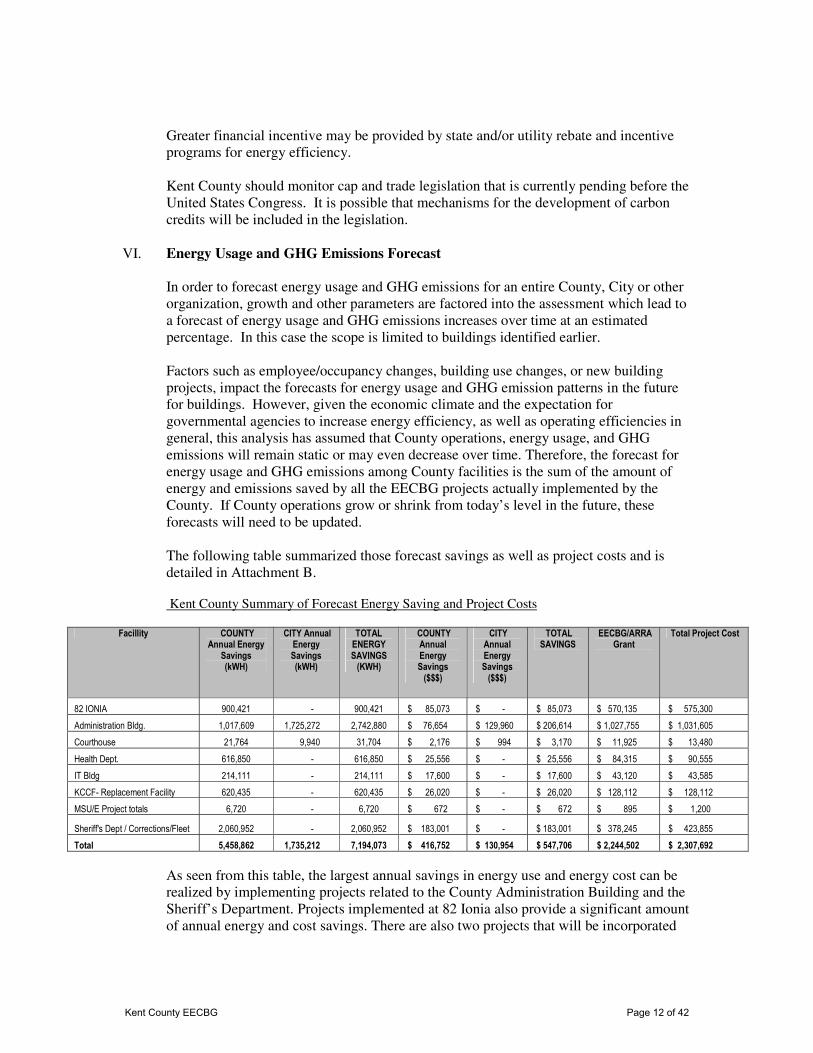
The following table summarized those forecast savings as well as project costs and is detailed in Attachment B.
Kent County Summary of Forecast Energy Saving and Project Costs
Facillity COUNTY Annual Energy
Savings (kWH)
CITY Annual Energy Savings (kWH)
TOTAL ENERGY SAVINGS
(KWH)
COUNTY Annual Energy Savings
($$$)
CITY Annual Energy Savings
($$$)
TOTAL SAVINGS
EECBG/ARRA Grant
Total Project Cost
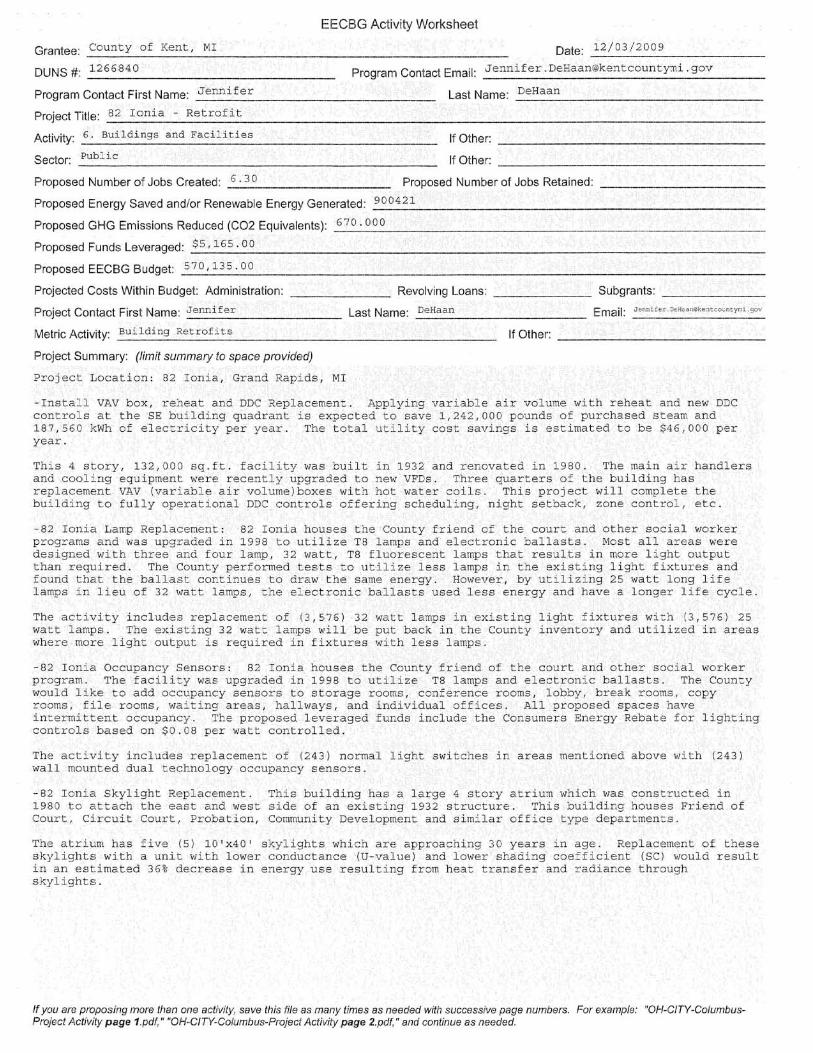
82 IONIA 900,421 - 900,421 $ 85,073 $ - $ 85,073 $ 570,135 $ 575,300
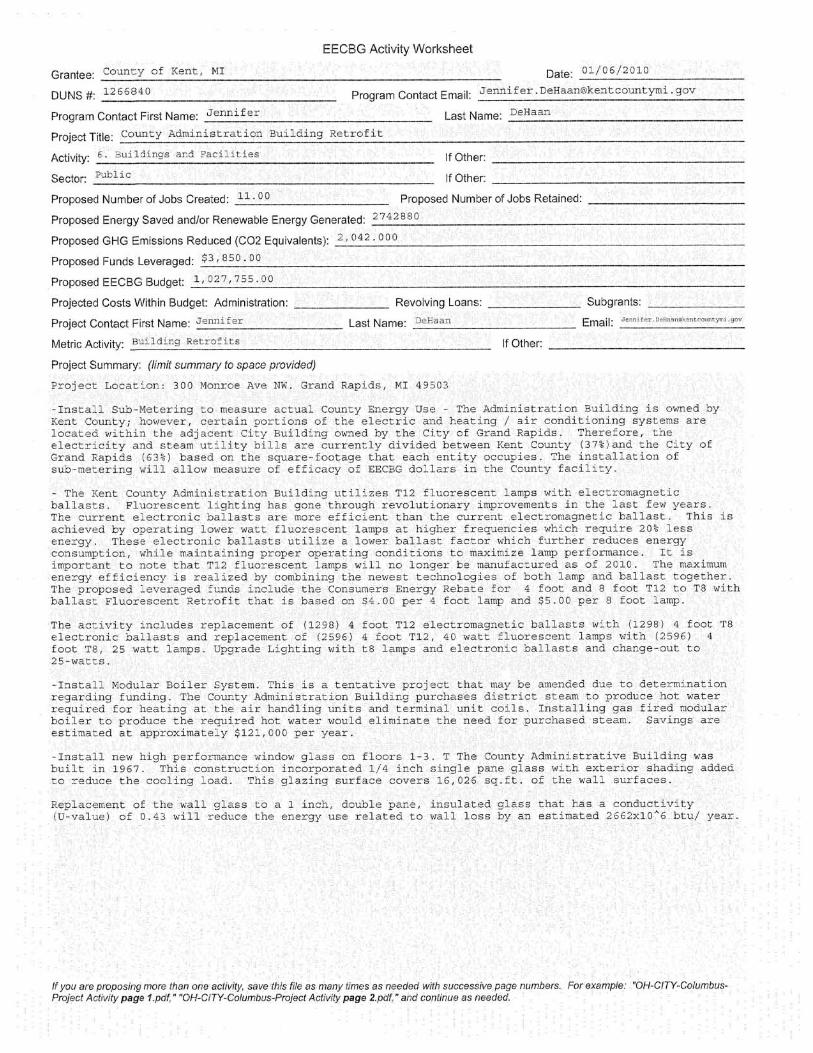
Administration Bldg. 1,017,609 1,725,272 2,742,880 $ 76,654 $ 129,960 $ 206,614 $ 1,027,755 $ 1,031,605
Courthouse 21,764 9,940 31,704 $ 2,176 $ 994 $ 3,170 $ 11,925 $ 13,480
Health Dept. 616,850 - 616,850 $ 25,556 $ - $ 25,556 $ 84,315 $ 90,555
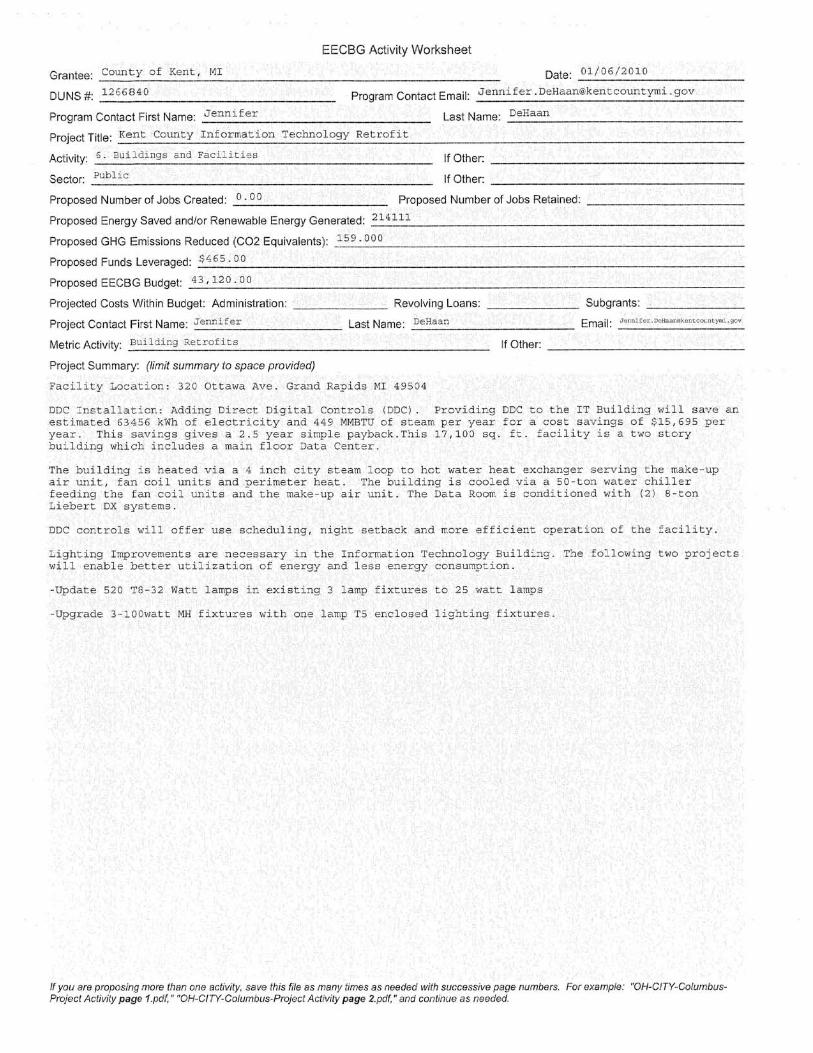
IT Bldg 214,111 - 214,111 $ 17,600 $ - $ 17,600 $ 43,120 $ 43,585
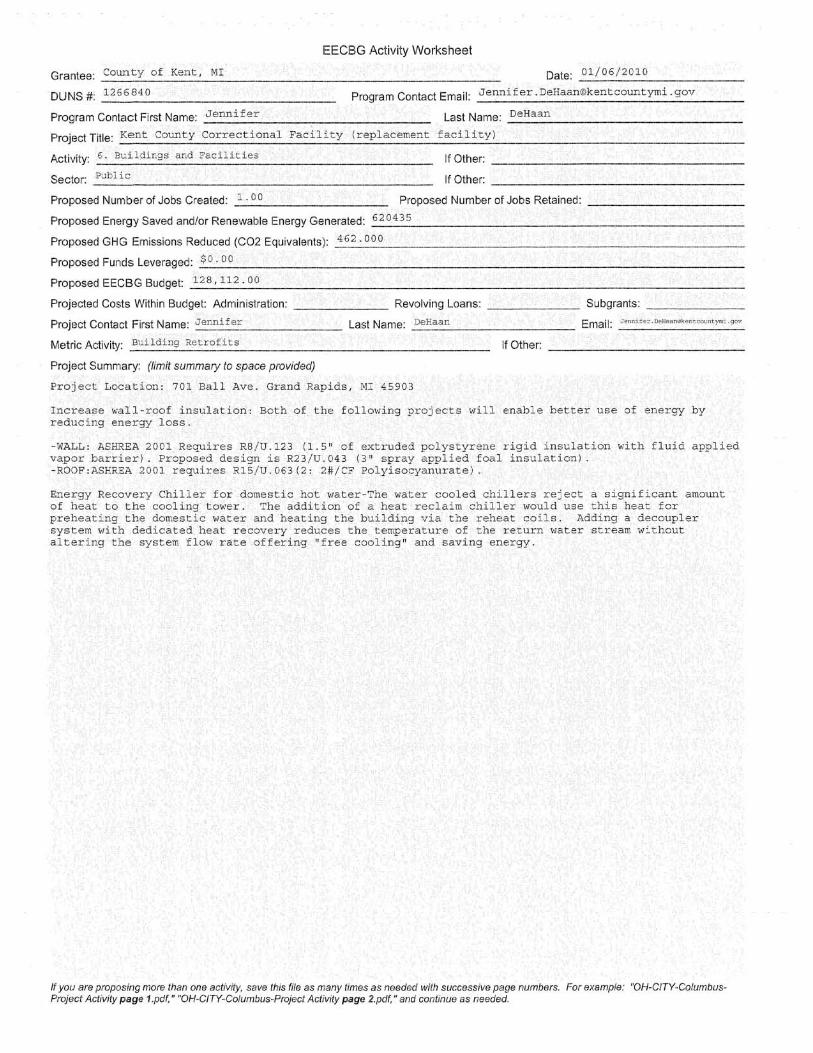
KCCF- Replacement Facility 620,435 - 620,435 $ 26,020 $ - $ 26,020 $ 128,112 $ 128,112
MSU/E Project totals 6,720 - 6,720 $ 672 $ - $ 672 $ 895 $ 1,200
Sheriff's Dept / Corrections/Fleet 2,060,952 - 2,060,952 $ 183,001 $ - $ 183,001 $ 378,245 $ 423,855
Total 5,458,862 1,735,212 7,194,073 $ 416,752 $ 130,954 $ 547,706 $ 2,244,502 $ 2,307,692
As seen from this table, the largest annual savings in energy use and energy cost can be realized by implementing projects related to the County Administration Building and the Sheriff’s Department. Projects implemented at 82 Ionia also provide a significant amount of annual energy and cost savings. There are also two projects that will be incorporated
Kent County EECBG Page 12 of 42
into the design of the new correctional facility. These two projects will provide significant savings over the life of the facility.
Through the implementation of the recommended projects in Attachment B, it is estimated that the County will reduce energy use by 24,553 MMBTUs annually3, a 9% t reduction, which is projected to result in an estimated annual savings/cost avoidance of $416,752 for the County and $130,954 for the City of Grand Rapids. These forecasts will vary somewhat with actual energy usage and actual construction bids/quotes, but are based on information provided by Kent County, Means Construction Estimator and other sources available throughout the development of this Strategy.
VII. General Recommendations The following recommendations are made to assist in achieving the goals and objectives of the energy reduction plan, several of which are also included in the County’s Strategy and Plan for Resource Conservation and Energy Cost Mitigation.
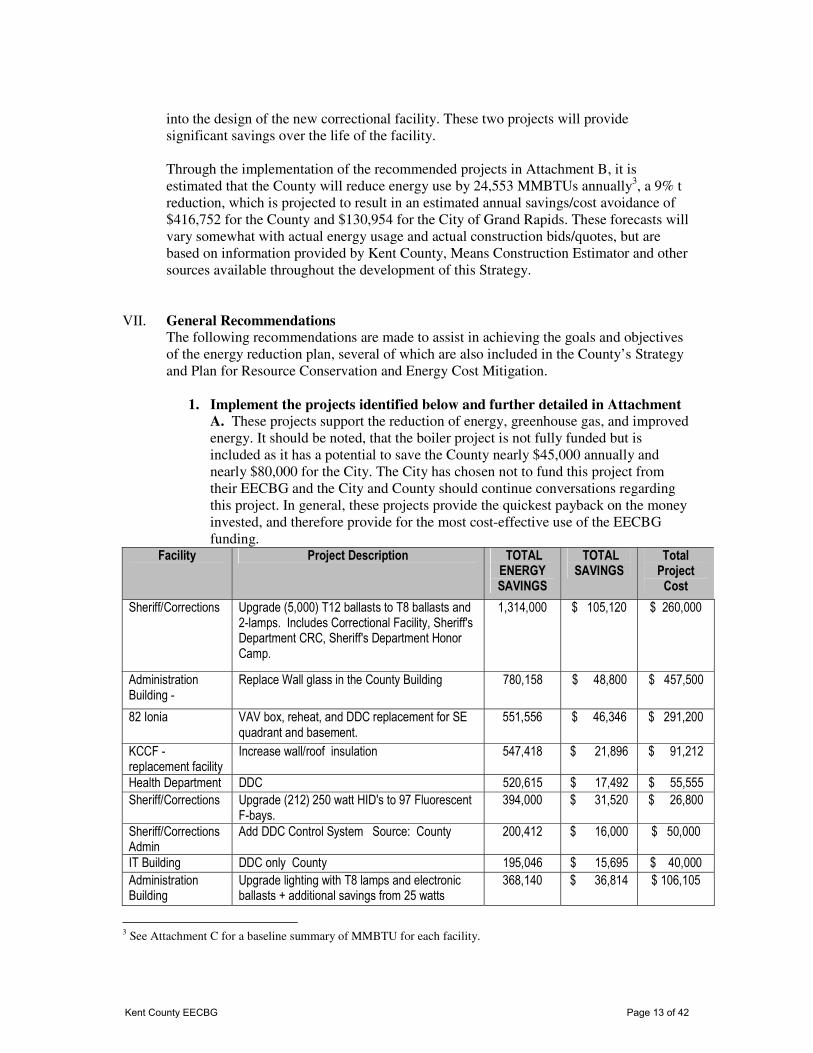
1. Implement the projects identified below and further detailed in Attachment A. These projects support the reduction of energy, greenhouse gas, and improved energy. It should be noted, that the boiler project is not fully funded but is included as it has a potential to save the County nearly $45,000 annually and nearly $80,000 for the City. The City has chosen not to fund this project from their EECBG and the City and County should continue conversations regarding this project. In general, these projects provide the quickest payback on the money invested, and therefore provide for the most cost-effective use of the EECBG funding.
Facility Project Description TOTAL ENERGY SAVINGS
TOTAL SAVINGS
Total Project
Cost
Sheriff/Corrections Upgrade (5,000) T12 ballasts to T8 ballasts and 2-lamps. Includes Correctional Facility, Sheriff's Department CRC, Sheriff's Department Honor Camp.
1,314,000 $ 105,120 $ 260,000
Administration Building -
Replace Wall glass in the County Building 780,158 $ 48,800 $ 457,500
82 Ionia VAV box, reheat, and DDC replacement for SE quadrant and basement.
551,556 $ 46,346 $ 291,200
KCCF - replacement facility
Increase wall/roof insulation 547,418 $ 21,896 $ 91,212
Health Department DDC 520,615 $ 17,492 $ 55,555
Sheriff/Corrections Upgrade (212) 250 watt HID's to 97 Fluorescent F-bays.
394,000 $ 31,520 $ 26,800
Sheriff/Corrections Admin
Add DDC Control System Source: County 200,412 $ 16,000 $ 50,000
IT Building DDC only County 195,046 $ 15,695 $ 40,000
Administration Building
Upgrade lighting with T8 lamps and electronic ballasts + additional savings from 25 watts
368,140 $ 36,814 $ 106,105
3 See Attachment C for a baseline summary of MMBTU for each facility.
Kent County EECBG Page 13 of 42
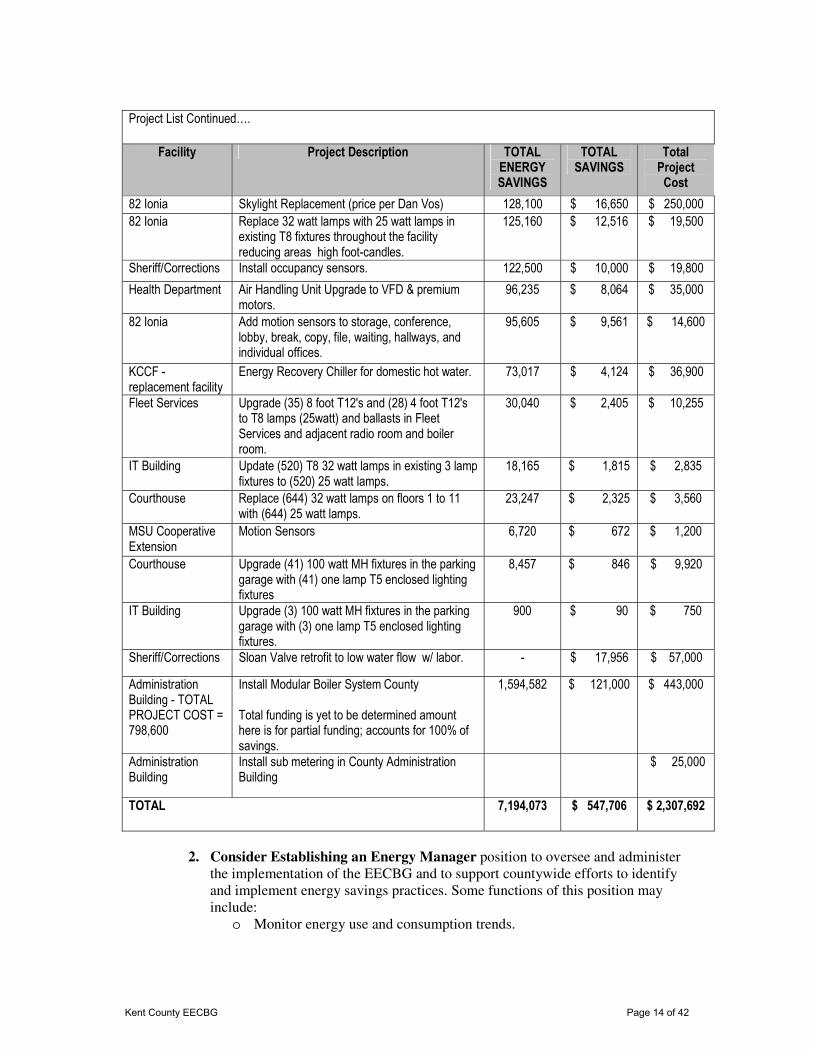
Project List Continued….
Facility Project Description TOTAL ENERGY SAVINGS
TOTAL SAVINGS
Total Project
Cost
82 Ionia Skylight Replacement (price per Dan Vos) 128,100 $ 16,650 $ 250,000
82 Ionia Replace 32 watt lamps with 25 watt lamps in existing T8 fixtures throughout the facility reducing areas high foot-candles.
125,160 $ 12,516 $ 19,500
Sheriff/Corrections Install occupancy sensors. 122,500 $ 10,000 $ 19,800
Health Department Air Handling Unit Upgrade to VFD & premium motors.
96,235 $ 8,064 $ 35,000
82 Ionia Add motion sensors to storage, conference, lobby, break, copy, file, waiting, hallways, and individual offices.
95,605 $ 9,561 $ 14,600
KCCF - replacement facility
Energy Recovery Chiller for domestic hot water. 73,017 $ 4,124 $ 36,900
Fleet Services Upgrade (35) 8 foot T12's and (28) 4 foot T12's to T8 lamps (25watt) and ballasts in Fleet Services and adjacent radio room and boiler room.
30,040 $ 2,405 $ 10,255
IT Building Update (520) T8 32 watt lamps in existing 3 lamp fixtures to (520) 25 watt lamps.
18,165 $ 1,815 $ 2,835
Courthouse Replace (644) 32 watt lamps on floors 1 to 11 with (644) 25 watt lamps.
23,247 $ 2,325 $ 3,560
MSU Cooperative Extension
Motion Sensors 6,720 $ 672 $ 1,200
Courthouse Upgrade (41) 100 watt MH fixtures in the parking garage with (41) one lamp T5 enclosed lighting fixtures
8,457 $ 846 $ 9,920
IT Building Upgrade (3) 100 watt MH fixtures in the parking garage with (3) one lamp T5 enclosed lighting fixtures.
900 $ 90 $ 750
Sheriff/Corrections Sloan Valve retrofit to low water flow w/ labor. - $ 17,956 $ 57,000
Administration Building - TOTAL PROJECT COST = 798,600
Install Modular Boiler System County Total funding is yet to be determined amount here is for partial funding; accounts for 100% of savings.
1,594,582 $ 121,000 $ 443,000
Administration Building
Install sub metering in County Administration Building
$ 25,000
TOTAL 7,194,073 $ 547,706 $ 2,307,692
2. Consider Establishing an Energy Manager position to oversee and administer the implementation of the EECBG and to support countywide efforts to identify and implement energy savings practices. Some functions of this position may include:
o Monitor energy use and consumption trends.
Kent County EECBG Page 14 of 42
o Create monthly, quarterly and annual reports showing energy use, estimated savings, and other energy information for all the county buildings and circulate to key managers.
o Research and present potential projects for consideration during the budget or capital improvement process.
o Participate in design process of new County facilities to ensure that the design and construction process incorporate energy efficiency strategies.
o Coordinate with human resources staff to implement education/awareness programs for staff.
o Conduct facility evaluations with facility managers to identify energy saving projects or initiatives.
o Work with utility companies to identify opportunities for funding and incentives.
o Use Energy Star tools and DOE tools to drive energy efficiency and conservation in all county operations and equipment/vehicles.
o Manage data in the Energy Star Portfolio Manager tool. o Direct the purchase and provision of utilities such as steam, water and
sewer services. o Serve as County's energy analyst and make appropriate recommendations. o Assist in programs of scheduled preventive maintenance. o Review utility services budget, ensuring that appropriate consumption
levels are identified for all utilities. o Represent the County on various committees to promote awareness of
County efforts. o Monitor current and pending federal and state energy management
incentives.
Adequate administrative staff may also be necessary to assist with the reporting, monitoring and other activities required by the DOE and County policies.
3. Install sub-metering on the utilities at the points of service to the Administration Building. Currently the County, through an agreement with the City, pays 37.1% of all utility costs which may or may not accurately reflect the energy utilized by the County. To ensure accurate measurements of energy use and energy savings, it is recommended that the County install sub-metering at an estimated cost to be in the range of $15,000 - $25,000 depending on the depth of metering required. The electrical service is likely the easiest to initiate, but gas and steam service sub-metering should also be considered.
As an alternative to the costs associated with the installation of sub-metering, the County should negotiate a new agreement with the City restructuring the utility payments to be based on approximated savings from these projects and/or changing the current percent rate being paid by the County to reflect 100% of the savings to be realized.
4. Monitor technical advancements and building performance: The County has been proactive in conducting energy audits on its facilities and has a good knowledge of the age, performance and condition of materials, equipment and building control systems within these facilities. As technological advancements
Kent County EECBG Page 15 of 42

are made in materials, equipment, controls, etc., the County should continue to perform periodic energy audits or retro-commissioning studies of the facilities that are deemed to be outdated and/or rank the highest on the energy intensity table as noted on page 7 such as portions of the Correctional Facilities and the Juvenile Detention Center. This function can be completed by the Energy Manager.
5. Continue to enable the Energy Steering Committee to fund projects that are recommended by the periodic energy audits or retro-commissioning studies or at the request of County departments as defined by the Energy Use Reduction Policy.
6. Continue to implement educational and awareness initiatives to maximize savings by addressing both technical opportunities as well as appropriate behavior changes that will result in energy savings.
7. Identify energy conservation strategies such as occupancy sensors or automatic computer power-downs and develop the plan to implement these strategies.
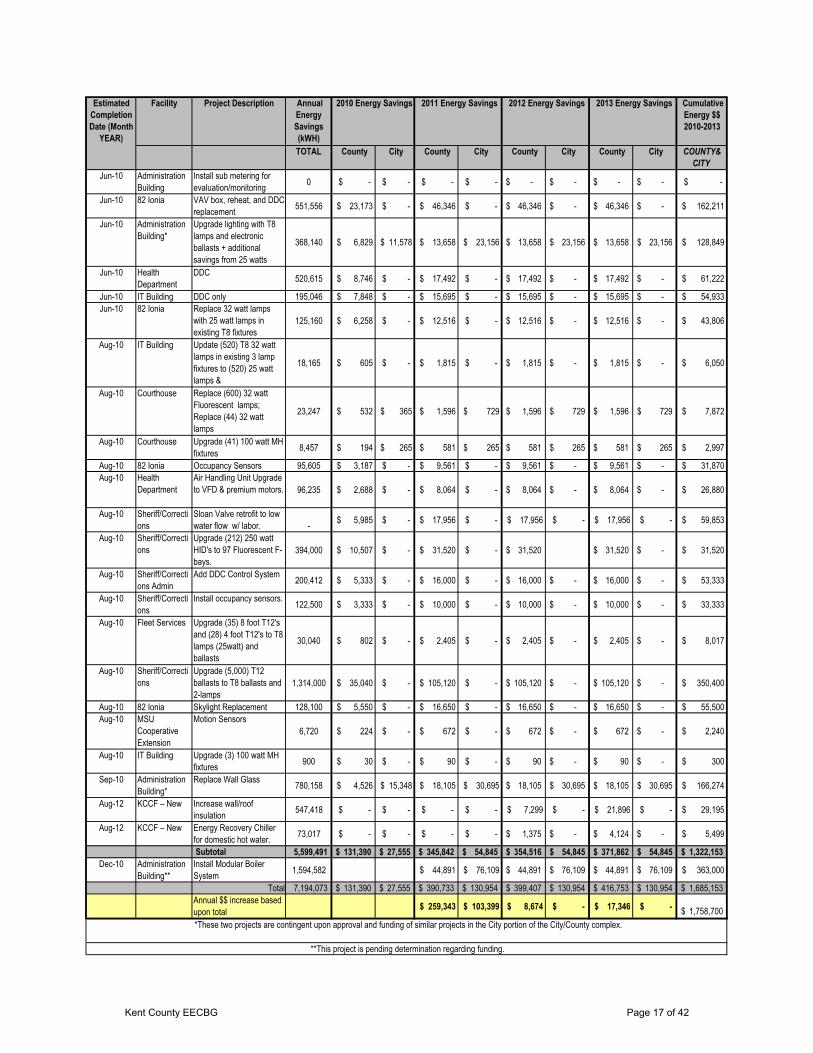
VIII. Timeline for Implementation The DOE grant guidelines provide for three years to implement and spend down the DOE grant. The County should plan to spend down all of the DOE funds no later than July 2012 to meet this requirement.
One of the priorities when determining the appropriate timeline for implementation is the opportunity to capture as much of the savings as possible as well as to leverage additional resources including the Consumers Energy and City of Grand Rapids partnership. Other factors involved in the timeline for implementation will depend upon the DOE award/approval date, the process and timing for the bidding of projects to be consistent with Kent County Polices and Procedures as well as the DOE requirement. Further consideration will have to be given to the ability of existing facilities management staff to implement these projects within their existing workload. Located on the following pages is a proposed timeline that includes projected project completion dates as well as estimated savings.
See table on following page.
Kent County EECBG Page 16 of 42
Facility Project Description Annual
Energy
Savings
(kWH)
Cumulative
Energy $$
2010-2013
TOTAL County City County City County City County City COUNTY&
CITY
Jun-10 Administration
Building
Install sub metering for
evaluation/monitoring 0 $ - $ - $ - $ - -$ -$ -$ -$ $ -
Jun-10 82 Ionia VAV box, reheat, and DDC
replacement 551,556 $ 23,173 $ - $ 46,346 $ - 46,346$ -$ 46,346$ -$ $ 162,211
Jun-10 Administration
Building*
Upgrade lighting with T8
lamps and electronic
ballasts + additional
savings from 25 watts
368,140 $ 6,829 $ 11,578 $ 13,658 $ 23,156 13,658$ 23,156$ 13,658$ 23,156$ $ 128,849
Jun-10 Health
Department
DDC 520,615 $ 8,746 $ - $ 17,492 $ - 17,492$ -$ 17,492$ -$ $ 61,222
Jun-10 IT Building DDC only 195,046 $ 7,848 $ - $ 15,695 $ - 15,695$ -$ 15,695$ -$ $ 54,933
Jun-10 82 Ionia Replace 32 watt lamps
with 25 watt lamps in
existing T8 fixtures
125,160 $ 6,258 $ - $ 12,516 $ - 12,516$ -$ 12,516$ -$ $ 43,806
Aug-10 IT Building Update (520) T8 32 watt
lamps in existing 3 lamp
fixtures to (520) 25 watt
lamps &
18,165 $ 605 $ - $ 1,815 $ - 1,815$ -$ 1,815$ -$ $ 6,050
Aug-10 Courthouse Replace (600) 32 watt
Fluorescent lamps;
Replace (44) 32 watt
lamps
23,247 $ 532 $ 365 $ 1,596 $ 729 1,596$ 729$ 1,596$ 729$ $ 7,872
Aug-10 Courthouse Upgrade (41) 100 watt MH
fixtures 8,457 $ 194 $ 265 $ 581 $ 265 581$ 265$ 581$ 265$ $ 2,997
Aug-10 82 Ionia Occupancy Sensors 95,605 $ 3,187 $ - $ 9,561 $ - 9,561$ -$ 9,561$ -$ $ 31,870
Aug-10 Health
Department
Air Handling Unit Upgrade
to VFD & premium motors. 96,235 $ 2,688 $ - $ 8,064 $ - 8,064$ -$ 8,064$ -$ $ 26,880
Aug-10 Sheriff/Correcti
ons
Sloan Valve retrofit to low
water flow w/ labor.
- $ 5,985 $ - $ 17,956 $ - $ 17,956 $ - $ 17,956 $ - $ 59,853
Aug-10 Sheriff/Correcti
ons
Upgrade (212) 250 watt
HID's to 97 Fluorescent F-
bays.
394,000 $ 10,507 $ - $ 31,520 $ - 31,520$ 31,520$ -$ $ 31,520
Aug-10 Sheriff/Correcti
ons Admin
Add DDC Control System 200,412 $ 5,333 $ - $ 16,000 $ - 16,000$ -$ 16,000$ -$ $ 53,333
Aug-10 Sheriff/Correcti
ons
Install occupancy sensors. 122,500 $ 3,333 $ - $ 10,000 $ - 10,000$ -$ 10,000$ -$ $ 33,333
Aug-10 Fleet Services Upgrade (35) 8 foot T12's
and (28) 4 foot T12's to T8
lamps (25watt) and
ballasts
30,040 $ 802 $ - $ 2,405 $ - 2,405$ -$ 2,405$ -$ $ 8,017
Aug-10 Sheriff/Correcti
ons
Upgrade (5,000) T12
ballasts to T8 ballasts and
2-lamps
1,314,000 $ 35,040 $ - $ 105,120 $ - 105,120$ -$ 105,120$ -$ $ 350,400
Aug-10 82 Ionia Skylight Replacement 128,100 $ 5,550 $ - $ 16,650 $ - 16,650$ -$ 16,650$ -$ $ 55,500
Aug-10 MSU
Cooperative
Extension
Motion Sensors
6,720 $ 224 $ - $ 672 $ - 672$ -$ 672$ -$ $ 2,240
Aug-10 IT Building Upgrade (3) 100 watt MH
fixtures 900 $ 30 $ - $ 90 $ - 90$ -$ 90$ -$ $ 300
Sep-10 Administration
Building*
Replace Wall Glass 780,158 $ 4,526 $ 15,348 $ 18,105 $ 30,695 18,105$ 30,695$ 18,105$ 30,695$ $ 166,274
Aug-12 KCCF – New Increase wall/roof
insulation 547,418 $ - $ - $ - $ - $ 7,299 $ - $ 21,896 $ - $ 29,195
Aug-12 KCCF – New Energy Recovery Chiller
for domestic hot water. 73,017 $ - $ - $ - $ - 1,375$ -$ 4,124$ -$ $ 5,499
Subtotal 5,599,491 131,390$ 27,555$ 345,842$ 54,845$ 354,516$ 54,845$ 371,862$ 54,845$ 1,322,153$
Dec-10 Administration
Building**
Install Modular Boiler
System 1,594,582 $ 44,891 $ 76,109 44,891$ 76,109$ 44,891$ 76,109$ $ 363,000
Total 7,194,073 131,390$ 27,555$ 390,733$ 130,954$ 399,407$ 130,954$ 416,753$ 130,954$ 1,685,153$
Annual $$ increase based
upon total $ 259,343 $ 103,399 $ 8,674 $ - $ 17,346 $ -
1,758,700$
**This project is pending determination regarding funding.
Estimated
Completion
Date (Month
YEAR)
2013 Energy Savings
*These two projects are contingent upon approval and funding of similar projects in the City portion of the City/County complex.
2010 Energy Savings 2011 Energy Savings 2012 Energy Savings
Kent County EECBG Page 17 of 42
IX. Leveraging/Coordination of Funds There are at least two initial opportunities for the County to leverage funding and/or rebates to help off-set and/or coordinate the spending of EECBG funds to maximize energy savings/cost avoidance. These opportunities include:
• Coordinating with the City of Grand Rapids to complete energy improvements that will result in energy savings to both entities.
• Utilize the rebate program offered by Consumers Energy Commercial Energy Efficiency Program.
The City of Grand Rapids and the County Administration building are co-located in one complex, whereby the City and County share energy costs based upon the square footage of the facility. The County owns the County building but shares the mechanical systems which operate the City and County buildings. The City and County, by jointly making similar improvements to their facilities can generate energy savings for both entities. The City also received an ARRA grant and is working to complete an Energy Strategy to meet DOE requirements. At the time of writing this document, the City intends to pursue a window-glass upgrade and lighting upgrades similar to the County projects which will yield both entities more savings as a result of the coordination of these projects.
In addition, the City currently leases a portion of the Kent County Courthouse to operate the 61st District Court. This lease provides that the City pays a percentage of the utilities based upon the percentage of the building which the City occupies. At this time, the County has identified several projects in the Courthouse that will yield the City and County energy savings. Discussions with the City should be ongoing in order to coordinate funds and maximize the potential savings from coordinating energy saving projects.
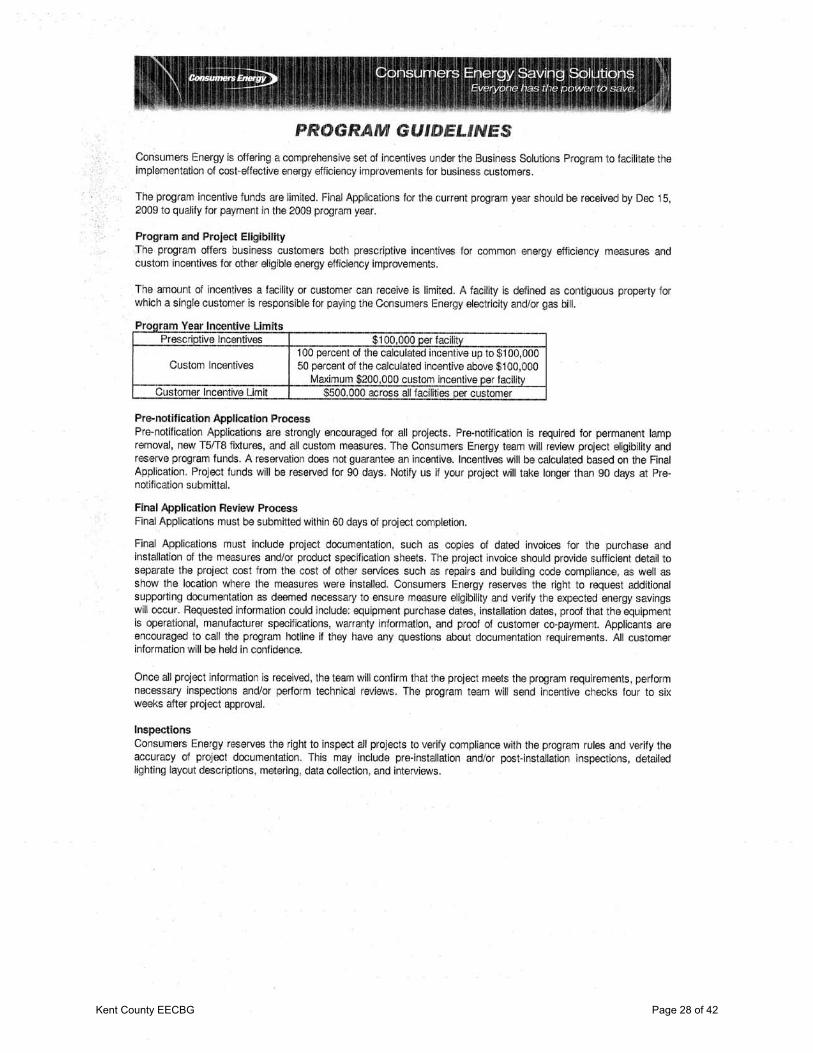
The Consumers Energy Company Commercial Energy Efficiency Program provides incentives based on prescriptive energy efficiency measures, such as replacement of low-efficiency light fixtures with CFLs or T5/T8 high efficiency lights, and custom energy efficiency measures (i.e., engineered site or project-specific measures).
Consumers Energy Incentives are limited to $100,000 per facility and $500,000 per customer. Further, incentive funds become available on January 1 each year in a first-come-first-served basis until the program is exhausted of funds. Therefore, it is an extremely important part of the County’s strategy to proceed as quickly as possible with the projects being leveraged with Consumers Energy rebates in the first few months after being awarded the EECBG funds. It is recommended that the County set up a meeting with their Consumers Energy representative to review all rebates and determine if any might not be funded.
Pre-notification is required by Consumers Energy for proposed activities. A Consumers Energy team will review project eligibility and reserve program funds for 90-days. The amount of these incentives is not guaranteed and will be calculated based on the Final Application. Thus, the project is limited to a 90-day completion timeframe. An appeal process is in place for possible project extensions, but a successful approval of the projects extension date is likewise not guaranteed.
Kent County EECBG Page 18 of 42

As may be inferred from the above discussion, the opportunity to receive Consumers Energy rebates is extremely time-sensitive. In order to increase the County’s ability ot obtain the rebates, the County should consider prioritizing projects based upon the projects where a rebate is available.
Attached is the “Consumers Energy Savings Solutions” Program Guidelines to assist in determining eligible projects and process for obtaining the rebates. Additional information is available online via http://www.dsireusa.org/incentives/incentive.cfm?Incentive_Code=MI28F&re=1&ee=1.
Note, as mentioned above, that incentives are not guaranteed in the program due to the number of applications that have been received towards the utility’s portfolio requirements. However, projects are still urged to apply. More information about these programs can be found at the following address:
http://www.dsireusa.org/incentives/incentive.cfm?Incentive_Code=MI24F&re=1&ee=1
It should be noted that EECBG funding can be used in conjunction with other state and federal public funds. However, EECBG funds (or any Federal funds) can not be used as required cost-share or matching funds for other Federal programs. Opportunities outside of EECBG funding should continue to be investigated on an on-going basis.
X. Monitoring and Evaluation
Each project and recommendation in this Strategy should be considered an objective to achieve the goal of energy savings and cost avoidance.
The monitoring of the County's energy usage and GHG emissions will be accomplished through the monthly and quarterly updating of the County's Energy Use spreadsheets and comparison of this database to the GHG and Energy Use Baseline spreadsheet. These comparisons will enable the County to determine the extent to which County facilities are performing prior to and after the implementation of the energy projects and in relation to national averages.
The ongoing evaluation, monitoring, and verification of this type of information is often completed at the site level or managed by an outside consultant and may involve a position such as an Energy Manager. Energy use and GHG inventory data needs to be maintained on a regular basis; and building metering and sub-metering data as well as utility billing sheets need to be compiled and tracked.
With this information, operational inefficiencies, hardware and equipment inefficiencies, and energy optimization strategies all can be identified and evaluated. These are often referred to as energy conservation measures and typically involve changes to the mechanical, electrical, envelope and control systems for buildings.
The County must assess the status of each activity on a regular basis in order to meet DOE requirements. Further, status reports should be completed during the design and
Kent County EECBG Page 19 of 42
planning phases, during construction and implementation, and one year after implementation. The information contained in these reports should include:
• Status of activity (e.g. in design, under construction, complete) • Estimated annual energy savings per dollar invested • Simple payback • County-wide energy savings in MMBTU • County-wide energy reduction as a percentage • Greenhouse gas reduction • Implementation method • Job created / retained • Funds leveraged
Performance must be evaluated and tracked according to the number of jobs created or retained (the default DOE job creation rate is 1 job per $92,000 invested), cost effectiveness of energy savings (BTUs per $1,000 invested) and GHG emissions reduction (CO2 equivalents in metric tons). The standards to reference for these calculations are the EECBG Estimated Expected Benefits Calculator User’s Guide4 and Estimates of Job Creation from the American Recovery and Reinvestment Act of 2009, May 20095.
To facilitate the monitoring and measurement of energy savings and GHG emission reductions for initiated activities funded by EECBG a sample worksheet is included as an Attachment I entitled “Kent County Energy Tracking.” This can be updated by keeping the appropriate energy use data for the period being compared to the Baseline 2007 period up to date in the individual facility worksheets. The change in energy use will appear on this worksheet.
XI. Recommendations for Unfunded Activities A listing of projects not recommended to be funded by the grant at this time is included as Attachment G. In general, these projects are low-priority or have a long payback as compared to the recommended projects. These projects may be considered as potential future projects and should be re-evaluated at a later date.
XII. DOE EEBCG Reporting
The DOE continues to develop the quarterly reporting process that will be necessary for the County to complete. At this time, the reporting is online through www.federalreporting.gov and also on the DOE PAGE reporting system.
Each quarterly report should include information on the five EECBG metrics:
• Jobs created and/or retained • Energy savings on a per dollar invested basis
4
http://www.eecbg.energy.gov/solutioncenter/applicationresources/default.html5 http://www.whitehouse.gov/assets/documents/Job-Years_Revised5-8.pdf
Kent County EECBG Page 20 of 42
• Renewable energy capacity installed (if applicable) • Greenhouse gas emissions reduced • Funds leveraged
XIII. Sustaining Energy Efficiency
The County, through the efforts of the Energy Use Reduction Workgroup and in developing the EECS, has generated a substantial list of projects that were of a low enough priority not to be funded by the EECBG. These projects should be reviewed on an on-going basis. As technologies improve, several of these are likely to have better paybacks and be elevated to a higher priority. Thus, when County and/or leveraging outside funds become available, they may be more viable and result in additional long-term energy efficiency improvements.
The following items are recommended to assist the County in establishing an on-going sustainable energy program:
• Join the Energy Star program as a government entity to have access to Energy Star Energy Portfolio Manager, tracking programs, strategies, benchmarking software tools, product procurement guidelines, and lists of Energy Star qualified products. www.energystar.gov
• Initiate computer monitor phase outs (replace all CRT monitors with LCD Energy
Star monitors, saving energy, heat, and eye sight). It is estimated that an annual savings of between $60 and $80 per CRT change out could be realized giving rise to approximately a 5-year payback.
• Appliance phase out (replace all older/non-Energy star refrigerators, dishwashers, etc. with Energy Star appliances).
• When new construction or major renovation projects are being planned that involve
roof replacement, consider green/cool roofs.
• Consider the use of on-site generated electricity through the use of solar PV and small wind projects or hot water through solar hot water collectors. Incentives for these types of projects are also available through the local utility.
• Increase use of non-vehicular transportation, by adopting measures (such as bike
racks and other incentives) to make this form of travel more accessible.
• Increase use of electric vehicles, or alternative fuels vehicles. • Establish a policy whereby the most efficient, “Right Sized” vehicle would be
assigned to County personnel for the type of use.
Kent County EECBG Page 21 of 42

• Establish procedures to optimize the pick up and delivery management system for supplies to reduce the amount of redundant trips, travel time and spent fuel. This may be applicable to the scheduling of staff meetings as well.
• Continue to implement Kent County’s Employee Information and Awareness Initiatives and the Vehicle and Fuel Use Initiatives which will have long lasting benefits in the form of reductions in energy use and GHG emissions.
• Complete a yearly energy performance report or full sustainability report. In order to make the program successful and improve the bottom line, energy use should be tracked and evaluated on a regular basis. This should be completed by a qualified individual, either the Kent County Energy Manager, identified Kent County employee, or an outside consultant.
• Enact policies within the County’s administrative structure to initiate and fund
projects that are recommended by the periodic facility walk-through’s, energy audits, commissioning or retro-commissioning studies/projects.
• Create a separate “Energy Project” fund fed by a percentage of the savings realized from utility bills from energy-related projects by which Kent County internal entities (Departments) can obtain loans to support sustainability projects. The County entity would then pay back the loan based on annual savings and simple payback with a small amount of interest.
• Implementation of the County Energy Reduction Workgroup recommendations and plans of action will ensure the sustainability of the EECBG program well beyond the EECBG funding period.
• Strive to have the County’s buildings, new and existing alike, certified as Leadership
in Energy and Environment Design (LEED) Bronze, Silver or Gold through the U. S. Green Building Council (USGBC) and Green Building Certification Institute (GBCI), or as a minimum select and implement several rating system points required for LEED certification in one or more of the following LEED areas: o Sustainable Sites o Water Efficiency o Materials and Resources o Indoor Environmental Quality o Innovation in Design
XIV. Recycling and Disposal For each project listed in Attachment B, Kent County remains committed to ensuring that all materials that are able to be recycled are done so appropriately.
XV. Conclusion For several years, Kent County has worked to develop and implement initiatives that will result in a reduction in energy use, cost savings, and cost avoidance. Through the DOE formula grant, the County can implement changes to the existing infrastructure that will further realize energy efficiency.
Kent County EECBG Page 22 of 42
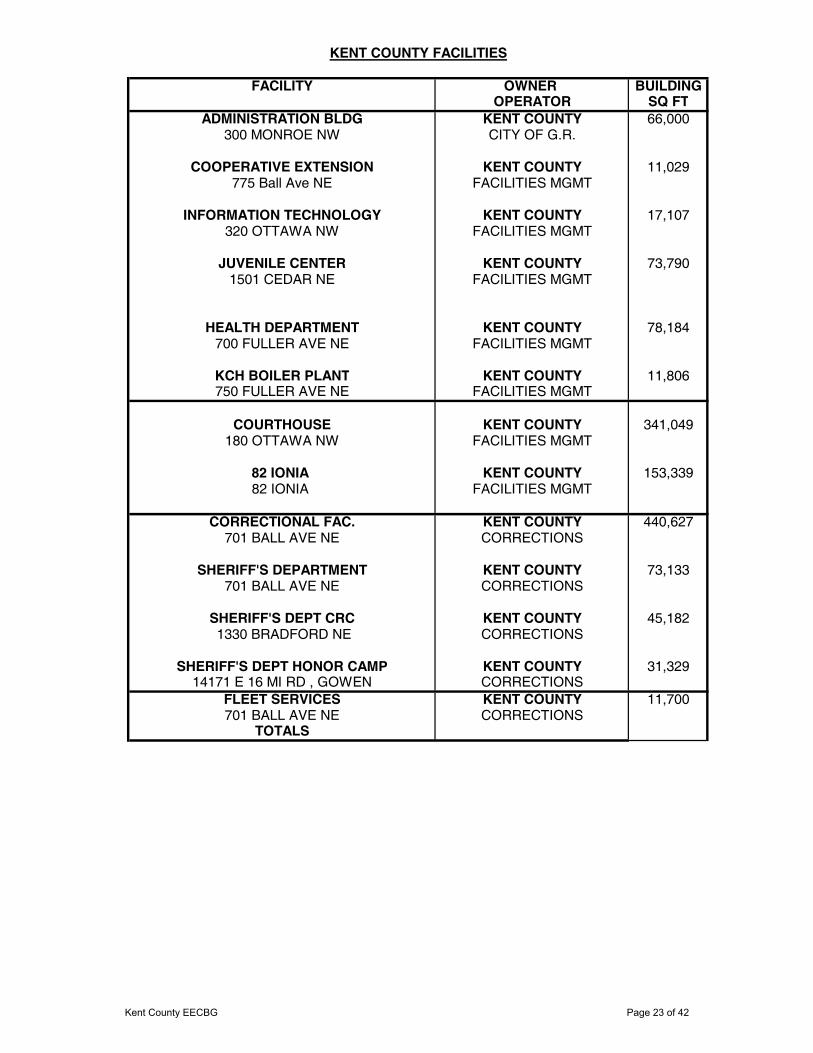
FACILITY OWNER BUILDINGOPERATOR SQ FT
ADMINISTRATION BLDG KENT COUNTY 66,000300 MONROE NW CITY OF G.R.
COOPERATIVE EXTENSION KENT COUNTY 11,029775 Ball Ave NE FACILITIES MGMT
INFORMATION TECHNOLOGY KENT COUNTY 17,107320 OTTAWA NW FACILITIES MGMT
JUVENILE CENTER KENT COUNTY 73,7901501 CEDAR NE FACILITIES MGMT
HEALTH DEPARTMENT KENT COUNTY 78,184700 FULLER AVE NE FACILITIES MGMT
KCH BOILER PLANT KENT COUNTY 11,806750 FULLER AVE NE FACILITIES MGMT
COURTHOUSE KENT COUNTY 341,049180 OTTAWA NW FACILITIES MGMT
82 IONIA KENT COUNTY 153,33982 IONIA FACILITIES MGMT
CORRECTIONAL FAC. KENT COUNTY 440,627701 BALL AVE NE CORRECTIONS
SHERIFF'S DEPARTMENT KENT COUNTY 73,133701 BALL AVE NE CORRECTIONS
SHERIFF'S DEPT CRC KENT COUNTY 45,182 1330 BRADFORD NE CORRECTIONS
SHERIFF'S DEPT HONOR CAMP KENT COUNTY 31,32914171 E 16 MI RD , GOWEN CORRECTIONS
FLEET SERVICES KENT COUNTY 11,700701 BALL AVE NE CORRECTIONS
TOTALS
KENT COUNTY FACILITIES
Kent County EECBG Page 23 of 42
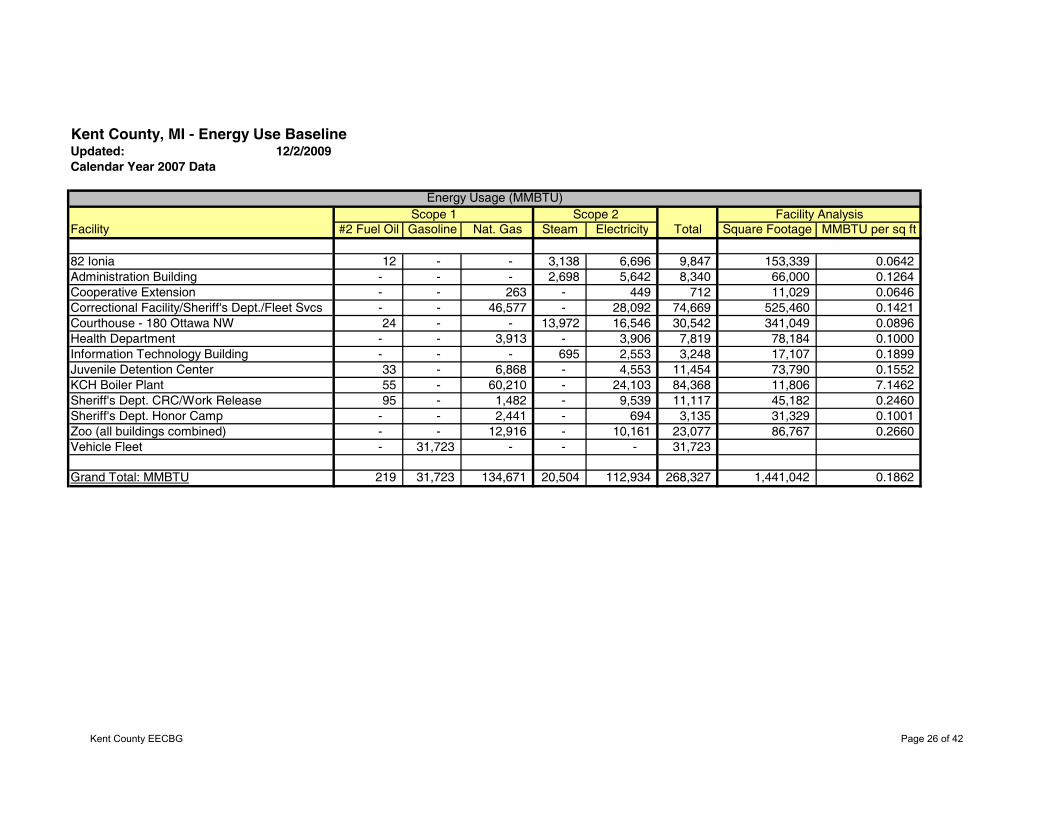
Kent County, MI - Energy Use BaselineUpdated: 12/2/2009Calendar Year 2007 Data
Facility #2 Fuel Oil Gasoline Nat. Gas Steam Electricity Total Square Footage MMBTU per sq ft
82 Ionia 12 - - 3,138 6,696 9,847 153,339 0.0642 Administration Building - - - 2,698 5,642 8,340 66,000 0.1264 Cooperative Extension - - 263 - 449 712 11,029 0.0646 Correctional Facility/Sheriff's Dept./Fleet Svcs - - 46,577 - 28,092 74,669 525,460 0.1421 Courthouse - 180 Ottawa NW 24 - - 13,972 16,546 30,542 341,049 0.0896 Health Department - - 3,913 - 3,906 7,819 78,184 0.1000 Information Technology Building - - - 695 2,553 3,248 17,107 0.1899 Juvenile Detention Center 33 - 6,868 - 4,553 11,454 73,790 0.1552 KCH Boiler Plant 55 - 60,210 - 24,103 84,368 11,806 7.1462 Sheriff's Dept. CRC/Work Release 95 - 1,482 - 9,539 11,117 45,182 0.2460 Sheriff's Dept. Honor Camp - - 2,441 - 694 3,135 31,329 0.1001 Zoo (all buildings combined) - - 12,916 - 10,161 23,077 86,767 0.2660 Vehicle Fleet - 31,723 - - - 31,723
Grand Total: MMBTU 219 31,723 134,671 20,504 112,934 268,327 1,441,042 0.1862
Energy Usage (MMBTU)Scope 1 Scope 2 Facility Analysis
Kent County EECBG Page 26 of 42

Kent County, MI - GHG Emissions SummaryUpdated: 12/2/2009Calendar Year 2007 Data
Facility #2 Fuel Oil Gasoline Nat. Gas Steam Electricity Total Square Footage CO2e Emissions per sq ft
82 Ionia 1 - - 222 1,461 1,684 153,339 0.0110 Administration Building - - - 191 1,231 1,422 66,000 0.0215 Cooperative Extension - - 15 - 98 113 11,029 0.0102 Correctional Facility/Sheriff's Dept./Fleet Svcs - - 2,607 - 6,128 8,735 525,460 0.0166 Courthouse - 180 Ottawa NW 2 - - 988 3,609 4,599 341,049 0.0135 Health Department - - 219 - 852 1,071 78,184 0.0137 Information Technology Building - - - 49 557 606 17,107 0.0354 Juvenile Detention Center 3 - 384 - 993 1,380 73,790 0.0187 KCH Boiler Plant 4 - 3,371 - 5,258 8,633 11,806 0.7312 Sheriff's Dept. CRC/Work Release 8 - 83 - 2,081 2,172 45,182 0.0481 Sheriff's Dept. Honor Camp - - 137 - 151 288 31,329 0.0092 Zoo (all buildings combined) - - 723 - 2,216 2,939 86,767 0.0339 Vehicle Fleet - 2,276 - - - 2,276
Grand Total: (metric tonnes) 18 2,276 7,539 1,450 24,635 35,918 1,441,042 0.0249
Grand Total Less Zoo: (metric tonnes) 18 2,276 6,816 1,450 22,419 32,979 1,354,275 0.0244
(All Bldg's) (Less Zoo)Emissions Emissions in Emissions in
CO2e (metric tonnes) CO2e (metric tonnes)Scope 1 - Direct Emissions 9,833 9,110 Scope 2 - Purchased Electricity and Steam 26,085 23,869 Total GHGs 35,918 32,979
Emissions in Emissions in Emission Sources CO2e (metric tonnes) CO2e (metric tonnes)
Stationary Combustion 9,833 9,110 Mobile Combustion 2,276 2,276 Steam 1,450 1,450 Purchased Electricity 24,635 22,419 Total GHGs 38,194 35,255
Carbon Dioxide Equivalents Emissions from Energy Usage (metric tonnes)Scope 1 Scope 2 Facility Analysis
Kent County EECBG Page 27 of 42
Kent County EECBG Page 28 of 42

Kent County EECBG Page 29 of 42
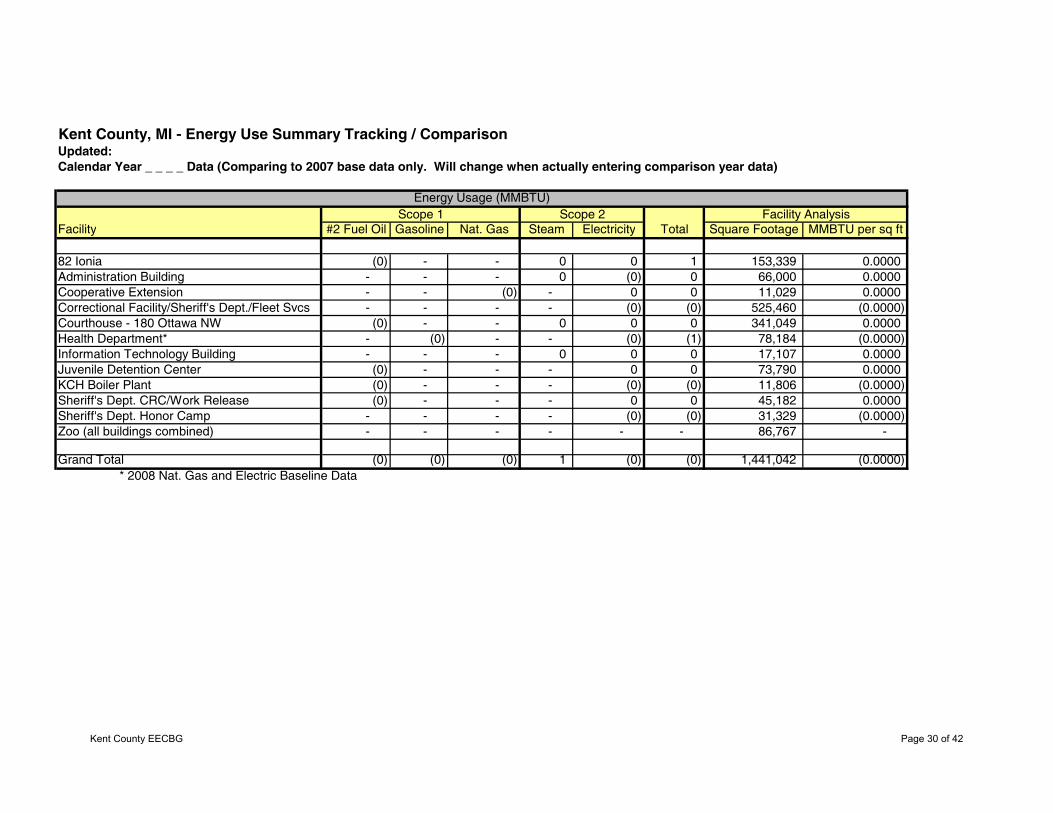
Kent County, MI - Energy Use Summary Tracking / ComparisonUpdated:Calendar Year _ _ _ _ Data (Comparing to 2007 base data only. Will change when actually entering comparison year data)
Facility #2 Fuel Oil Gasoline Nat. Gas Steam Electricity Total Square Footage MMBTU per sq ft
82 Ionia (0) - - 0 0 1 153,339 0.0000 Administration Building - - - 0 (0) 0 66,000 0.0000 Cooperative Extension - - (0) - 0 0 11,029 0.0000 Correctional Facility/Sheriff's Dept./Fleet Svcs - - - - (0) (0) 525,460 (0.0000) Courthouse - 180 Ottawa NW (0) - - 0 0 0 341,049 0.0000 Health Department* - (0) - - (0) (1) 78,184 (0.0000) Information Technology Building - - - 0 0 0 17,107 0.0000 Juvenile Detention Center (0) - - - 0 0 73,790 0.0000 KCH Boiler Plant (0) - - - (0) (0) 11,806 (0.0000) Sheriff's Dept. CRC/Work Release (0) - - - 0 0 45,182 0.0000 Sheriff's Dept. Honor Camp - - - - (0) (0) 31,329 (0.0000) Zoo (all buildings combined) - - - - - - 86,767 -
Grand Total (0) (0) (0) 1 (0) (0) 1,441,042 (0.0000) * 2008 Nat. Gas and Electric Baseline Data
Energy Usage (MMBTU)Scope 1 Scope 2 Facility Analysis
Kent County EECBG Page 30 of 42
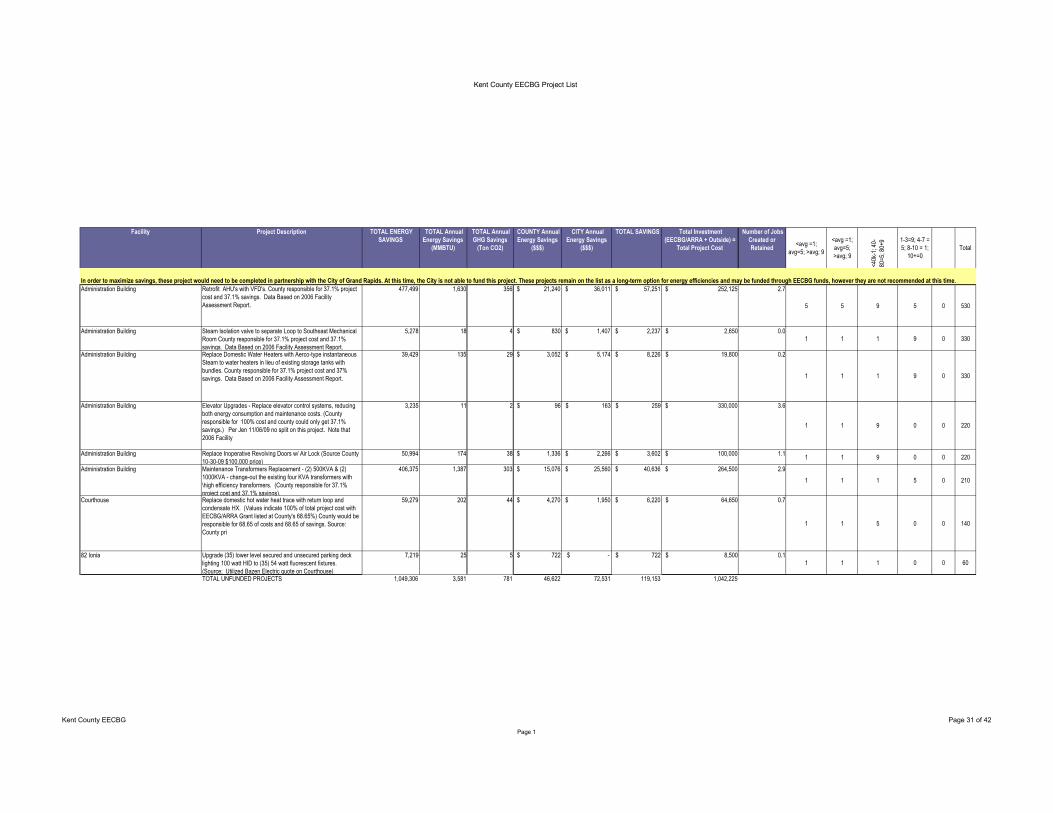
Kent County EECBG Project List
Facility Project Description TOTAL ENERGY SAVINGS
TOTAL Annual Energy Savings
(MMBTU)
TOTAL Annual GHG Savings
(Ton CO2)
COUNTY Annual Energy Savings
($$$)
CITY Annual Energy Savings
($$$)
TOTAL SAVINGS Total Investment (EECBG/ARRA + Outside) =
Total Project Cost
Number of Jobs Created or Retained
<avg =1; avg=5; >avg; 9
<avg =1; avg=5; >avg; 9
<40k
-1; 4
0-80
=5; 8
0+9 1-3=9; 4-7 =
5; 8-10 = 1; 10+=0
Total
Administration Building Retrofit AHU's with VFD's. County responsible for 37.1% project cost and 37.1% savings. Data Based on 2006 Facility Assessment Report.
477,499 1,630 356 $ 21,240 $ 36,011 $ 57,251 $ 252,125 2.7
5 5 9 5 0 530
Administration Building Steam Isolation valve to separate Loop to Southeast Mechanical Room County responsible for 37.1% project cost and 37.1% savings. Data Based on 2006 Facility Assessment Report.
5,278 18 4 $ 830 $ 1,407 $ 2,237 $ 2,650 0.0 1 1 1 9 0 330
Administration Building Replace Domestic Water Heaters with Aerco-type instantaneous Steam to water heaters in lieu of existing storage tanks with bundles. County responsible for 37.1% project cost and 37% savings. Data Based on 2006 Facility Assessment Report.
39,429 135 29 $ 3,052 $ 5,174 $ 8,226 $ 19,800 0.2
1 1 1 9 0 330
Administration Building Elevator Upgrades - Replace elevator control systems, reducing both energy consumption and maintenance costs. (County responsible for 100% cost and county could only get 37.1% savings.) Per Jen 11/06/09 no split on this project. Note that 2006 Facility
3,235 11 2 $ 96 $ 163 $ 259 $ 330,000 3.6
1 1 9 0 0 220
Administration Building Replace Inoperative Revolving Doors w/ Air Lock (Source County 10-30-09 $100,000 price)
50,994 174 38 $ 1,336 $ 2,266 $ 3,602 $ 100,000 1.1 1 1 9 0 0 220
Administration Building Maintenance Transformers Replacement - (2) 500KVA & (2) 1000KVA - change-out the existing four KVA transformers with \high efficiency transformers. (County responsible for 37.1% project cost and 37.1% savings).
406,375 1,387 303 $ 15,076 $ 25,560 $ 40,636 $ 264,500 2.9
1 1 1 5 0 210
Courthouse Replace domestic hot water heat trace with return loop and condensate HX. (Values indicate 100% of total project cost with EECBG/ARRA Grant listed at County's 68.65%) County would be responsible for 68.65 of costs and 68.65 of savings. Source: County pri
59,279 202 44 $ 4,270 $ 1,950 $ 6,220 $ 64,650 0.7
1 1 5 0 0 140
82 Ionia Upgrade (35) lower level secured and unsecured parking deck lighting 100 watt HID to (35) 54 watt fluorescent fixtures. (Source: Utilized Bazen Electric quote on Courthouse)
7,219 25 5 $ 722 $ - $ 722 $ 8,500 0.1 1 1 1 0 0 60
TOTAL UNFUNDED PROJECTS 1,049,306 3,581 781 46,622 72,531 119,153 1,042,225
In order to maximize savings, these project would need to be completed in partnership with the City of Grand Rapids. At this time, the City is not able to fund this project. These projects remain on the list as a long-term option for energy efficiencies and may be funded through EECBG funds, however they are not recommended at this time.
Page 1
Kent County EECBG Page 31 of 42
Kent County EECBG Project List
Ene
rgy
Sav
ings
M
MB
TU
's
GH
G S
avin
gs
$$ G
F S
avin
gs
(offs
et to
Cou
nty
GF
fo
r pr
ojec
t cos
t)
EE
CB
G P
ayba
ck
Onl
y
Cou
nty
Sta
ff O
ffset
Facility Project Description TOTAL ENERGY SAVINGS
TOTAL Annual Energy Savings
(MMBTU)
TOTAL Annual GHG Savings
(Ton CO2)
COUNTY Annual Energy Savings
($$$)
CITY Annual Energy Savings
($$$)
TOTAL SAVINGS Total Investment (EECBG/ARRA + Outside) =
Total Project Cost
Number of Jobs Created or Retained
<avg =1; avg=5; >avg; 9
<avg =1; avg=5; >avg; 9
<40k
-1; 4
0-80
=5; 8
0+9 1-3=9; 4-7 =
5; 8-10 = 1; 10+=0
Total
Sheriff/Corrections - revised QUOTE FROM $400,000 TO $260,000 per Hudenko 11/9/09
Upgrade (5,000) T12 ballasts to T8 ballasts and 2-lamps. Includes Correctional Facility, Sheriff's Department CRC, Sheriff's Department Honor Camp. (Source: URS calc .)
1,314,000 4,485 978 $ 105,120 $ - $ 105,120 $ 260,000 2.8
9 9 9 9 9
900
Administration Building -This project is contingent upon approval and funding of similar projects in the City portion of the City/County complex.
Replace Wall glass in the County Building per item 4(a) option 1 of Building Assessment Report.(100%) $381250 -2006 number. Data Based on 2006 Facility Assessment Report and URS calcs.
780,158 2,663 581 $ 18,105 $ 30,695 $ 48,800 $ 457,500 5.0
9 9 9 1 0 570
82 Ionia VAV box, reheat, and DDC replacement for SE quadrant and basement. Source: County)
551,556 1,882 411 $ 46,346 $ - $ 46,346 $ 291,200 3.2 9 9 9 5 0 690
KCCF - replacement facility Increase wall/roof insulation 547,418 1,868 408 21,896$ -$ $ 21,896 $ 91,212 1.0 9 9 9 5 0 690Health Department DDC Source: County 520,615 1,777 388 $ 17,492 $ - $ 17,492 $ 55,555 0.6 9 9 5 9 0 730Sheriff/Corrections Upgrade (212) 250 watt HID's to 97 Fluorescent F-bays. There
are 31 of the required 97 done leaving 66 to complete. Calculations based on remaining 66 fixtures. (Source: CTA materials pricing + URS Calcs )
394,000 1,345 293 $ 31,520 $ - $ 31,520 $ 26,800 0.3
9 5 1 9 9
700
Sheriff/Corrections Admin Add DDC Control System Source: County 200,412 684 149 $ 16,000 $ - $ 16,000 $ 50,000 0.5 5 5 5 9 0 570IT Building DDC only County 195,046 666 145 $ 15,695 $ - $ 15,695 $ 40,000 0.4 5 5 1 9 0 490Administration Building - This project is contingent upon approval and funding of similar projects in the City portion of the City/County complex.
Upgrade lighting with T8 lamps and electronic ballasts + additional savings from 25 watts (County responsible for 100% cost of County Building Lighting replacement and County could only get 37.1% savings.) Data Based on 2006 Facility Assessment Report.
368,140 1,256 274 $ 13,658 $ 23,156 $ 36,814 $ 106,105 1.2
5 5 9 9 0 650
82 Ionia Skylight Replacement (price per Dan Vos) 128,100 437 95 $ 16,650 $ - $ 16,650 $ 250,000 2.7 5 5 9 0 0 38082 Ionia Replace 32 watt lamps with 25 watt lamps in existing T8 fixtures
throughout the facility reducing areas high foot-candles. Second floor has 3-lamp ballasts that are only operating 2-lamps. 1192 fixtures or 3, 576 25 watt lamps. (Source: URS calcs )
125,160 427 93 $ 12,516 $ - $ 12,516 $ 19,500 0.2
5 5 1 9 5 540
Sheriff/Corrections Install occupancy sensors. Assume 250 occupancy sensors. (Source: URS quantity assumption of offices using vandal resistant wall occupancy sensor and KC electrician labor.)
122,500 418 91 $ 10,000 $ 10,000 $ 19,800 0.2
5 5 1 9 9
580
Health Department Air Handling Unit Upgrade to VFD & premium motors. As per B&V price ((1) 20hp, (1) 10 hp new motors; new VFDs for (1) 50hp, (2) 20hp, (1) 10hp)) Source: County pricing & URS calcs.
96,235 328 72 $ 8,064 $ 8,064 $ 35,000 0.4
1 1 1 5 0
210
82 Ionia Add motion sensors to storage, conference, lobby, break, copy, file, waiting, hallways, and individual offices. (Source: KC list of motion sensors with costs and URS inclusion of perimeter offices using KC costs)
95,605 326 71 $ 9,561 $ 9,561 $ 14,600 0.2
1 1 1 9 5 380
KCCF - replacement facility Energy Recovery Chiller for domestic hot water. 73,017 249 54 4,124$ $ 4,124 $ 36,900 0.4 1 1 1 1 0 90Fleet Services Upgrade (35) 8 foot T12's and (28) 4 foot T12's to T8 lamps
(25watt) and ballasts in Fleet Services and adjacent radio room and boiler room. (Source: URS calc with $150 for 8' replacement and $100 for 4' replacement)
30,040 103 22 $ 2,405 $ 2,405 $ 10,255 0.1
1 1 1 5 9
300
IT Building Update (520) T8 32 watt lamps in existing 3 lamp fixtures to (520) 25 watt lamps. (Source: URS calcs )
18,165 62 14 $ 1,815 $ 1,815 $ 2,835 0.0
1 1 1 9 5 380
Courthouse Replace (644) 32 watt lamps on floors 1 to 11 with (644) 25 watt lamps. (Source URS calcs). County pays 100% receives 68.65% in savings. City of Grand Rapids to benefit 31.35% of savings = $1063.75 annually.
23,247 79 17 $ 1,596 $ 729 $ 2,325 $ 3,560 0.0
1 1 1 9 5 380
MSU Cooperative Extension Motion Sensors . (Source: URS inclusion of perimeter offices using KC costs from 82 Ionia occupancy sensor list)
6,720 23 5 $ 672 $ 672 $ 1,200 0.0 1 1 1 9 0 330
Courthouse Upgrade (41) 100 watt MH fixtures in the parking garage with (41) one lamp T5 enclosed lighting fixtures. (Source: Bazen Electric Quote 7/2/09) (Values indicate 100% of total project cost with EECBG/ARRA Grant listed at County's 68.65%) CECO rebate $1076
8,457 29 6 $ 581 $ 265 $ 846 $ 9,920 0.1
1 1 1 5 0 210
Use the numbers 1, 5, 9 to score the strength of each criteria for each project/initiative, with1 = low/no5 = medium9 = high
Page 1
Kent County EECBG Project List
Ene
rgy
Sav
ings
M
MB
TU
's
GH
G S
avin
gs
$$ G
F S
avin
gs
(offs
et to
Cou
nty
GF
fo
r pr
ojec
t cos
t)
EE
CB
G P
ayba
ck
Onl
y
Cou
nty
Sta
ff O
ffset
Facility Project Description TOTAL ENERGY SAVINGS
TOTAL Annual Energy Savings
(MMBTU)
TOTAL Annual GHG Savings
(Ton CO2)
COUNTY Annual Energy Savings
($$$)
CITY Annual Energy Savings
($$$)
TOTAL SAVINGS Total Investment (EECBG/ARRA + Outside) =
Total Project Cost
Number of Jobs Created or Retained
<avg =1; avg=5; >avg; 9
<avg =1; avg=5; >avg; 9
<40k
-1; 4
0-80
=5; 8
0+9 1-3=9; 4-7 =
5; 8-10 = 1; 10+=0
Total
Use the numbers 1, 5, 9 to score the strength of each criteria for each project/initiative, with1 = low/no5 = medium9 = high
IT Building Upgrade (3) 100 watt MH fixtures in the parking garage with (3) one lamp T5 enclosed lighting fixtures. (Source: Utilized $250.00/fixture from Bazen Electric quote on Courthouse)
900 3 1 $ 90 $ 90 $ 750 0.0
1 1 1 5 0 210
Sheriff/Corrections Sloan Valve retrofit to low water flow w/ labor. Source: County - - - $ 17,956 $ 17,956 $ 57,000 0.6
0 0 5 9 9460
Administration Building - TOTAL PROJECT COST = 798,600
Install Modular Boiler System County responsible for 100% project cost and City(62.9%=$76,109)) and County (37.1%=$44891) would split savings. Data Based on 2006 Facility Assessment Report and EECBG Benefits Calculator. To be determined how difference of $798600-443,000 is $355600is determined
1,594,582 5,442 1,187 $ 44,891 $ 76,109 $ 121,000 $ 443,000 4.8
9 9 9 5 0 690
Administration Building Install sub metering in County Administration Building in order to measure the actual County Energy Use. This function is critical to measuring the efficacy of energy efficiency projects that are implemented in the County Administration Building.
- $ 25,000 0.3
SUBTOTAL 7,194,073 24,553 5,356 $ 416,752 $ 130,954 $ 547,706 $ 2,307,692 25 Project Administration, EECBG Strategy, and Budget 312,198
Energy Manager - 3 Years = $240,000 240,000
TOTAL 7,194,073 24,553 5,356 416,752$ 130,954$ 547,706$ 2,859,890$
TOTAL PROJECTS 1-3 YEAR PAYBACK 3,111,705 10,620 2,317 248,007 729 248,736 $ 585,850 6 TOTAL PROJECT 4-7 YEAR PAYBACK 1,498,054 5,113 1,115 84,395 23,156 107,551 499,522 5TOTAL PROJECT 8-10 1,667,599 5,692 1,242 49,015 76,109 125,124 479,900 5TOTAL PROJECT 10+ 916,715 3,129 683 35,335 30,960 66,296 717,420 8Other 25,000 - TOTAL 7,194,073 24,553 5,356 $ 416,752 $ 130,954 $ 547,706 $ 2,307,692 25
TOTALS BY FACILITY 82 IONIA Totals 900,421 3,073 670 $ 85,073 $ - $ 85,073 $ 575,300 6ADMINISTRATION Bldg Total Projects 2,742,880 9,361 2,042 76,654 129,960 206,614 1,031,605 11 Courthouse Project Totals 31,704 108 24 2,176 994 3,170 13,480 0 Health Department Totals 616,850 2,105 459 25,556 - 25,556 90,555 1 IT BUILDING 214,111 731 159 17,600 - 17,600 43,585 0 KCCF- Replacement Facility 620,435 2,118 462 26,020 - 26,020 128,112 1 MSU/E Project totals 6,720 23 5 672 - 672 1,200 0 Sheriff's Dept/Corrections/Fleet Svc 2,060,952 7,034 1,534 183,001 - 183,001 423,855 5 Total 7,194,073 24,553 5,356 416,752$ 130,954$ 547,706$ 2,307,692$ 25
Page 2