energy development and technology 016 additions to a design …€¦ · · 2009-04-16the energy...
TRANSCRIPT

Energy Development and Technology 016
"Additions to a Design Tool for Visualizing the Energy Implications of California’s Climates "
Murray Milne, Robin Liggett, Andrew Benson and Yasmin Bhattacharya
University of California, Los Angeles
August 2008
This paper is part of the University of California Energy Institute's (UCEI) Energy Policy and Economics Working Paper Series. UCEI is a multi-campus research unit of the University of California located on the Berkeley campus.
UC Energy Institute 2547 Channing Way
Berkeley, California 94720-5180 www.ucei.org

This report was issued in order to disseminate results of and information about energy research at the University of California campuses. Any conclusions or opinions expressed are those of the authors and not necessarily those of the Regents of the
University of California, the University of California Energy Institute or the sponsors of the research. Readers with further interest in or questions about the subject matter of the
report are encouraged to contact the authors directly.

Additions to a Design Tool for Visualizing The Energy Implications of California’s Climates
Murray Milne, Robin Liggett, Andrew Benson, and Yasmin Bhattacharya
UCLA Department of Architecture and Urban Design
August, 2008
Abstract:
In California there are 16 different climate zones as defined in the California Energy code (Title
24). The code requires slightly different types of buildings in each zone. These different building
code requirements make it important for architects, builders, contractors, and homeowners to
understand the resources of their unique local climate and how it will influence the performance
of their buildings. The objective of this project is to create a tool called Climate Consultant 4.0
that adds a number of features to those in the prior version 3.0, including new graphic screens
such as a Monthly Diurnal Averages plot. It also calculates a set of the Top 20 Design
Guidelines based on your unique climate, and displays a sketch illustrating how each applies. A
new dynamic graphic tutorial has been created to explain the Psychrometric Chart, and how the
relationship between air temperature and humidity influences human thermal comfort and
HVAC systems design. Climate Consultant 4.0 helps people who are designing, building, and
maintaining buildings throughout the world to understand their local climate and how it impacts
their building’s energy consumption.

1.0 INTRODUCTION:
Buildings use over 40% of California’s energy and produce a comparable amount of greenhouse
gasses. The California Energy Code (Title 24) requires that slightly different types of buildings
must be designed for each of California’s 16 climate zones. These different building code
requirements make it important for Californians who are designing, constructing, or maintaining
these buildings to understand the unique attributes of their local climate and how it will influence
the performance of their buildings.
Climate Consultant 3.0, was developed in a prior UCEI-funded project. It is a simple easy to use,
graphic-based computer program that helps architects, builders, contractors, homeowners, and
students understand their local climate. It uses annual 8760 hour EPW format climate data that is
made available at no cost by the Department of Energy for all these 16 zones, plus 21 other
California cities (as well as for 2000 other stations around the world). Climate Consultant 3.0
translates this raw climate data into dozens of meaningful graphic displays. It is available at no
cost on UCLA’s Energy Design Tools Web site. In the first two years since it was released, over
6000 people have downloaded copies.
In this current UCEI-funded project, Climate Consultant 4.0 was developed, adding new
capabilities to aid the kinds of energy decisions that thousands of Californians make about their
houses every year. One of these new additions is an expert system that automatically interprets
each location’s climate data to create a unique set of Building Design Guidelines. With each
design Guideline a sketch is available. In addition a number of new kinds of climate data
analyses have been added, along with new ways of displaying them. The third addition is a
graphic and audio tutorial that helps users understand the Psychrometric Chart, which displays
the relationship between temperature and humidity, and what it means to human thermal comfort
and how HVAC systems can change environmental conditions.

2.0 BACKGROUND:
The Department of Energy makes available at no cost, climate data for over two thousand
stations around the world, including California’s 16 climate zones, plus data for 21 other
California cities. Each of these is defined by a file of 26 attributes for all 8760 hours per year.
Climate Consultant 4 translates this raw weather data into meaningful graphic outputs and design
guidelines.
The California Energy Commission states that a third of California’s energy consumption is used
in buildings, of which about half is used in residential buildings, of which the majority is used
for space heating and cooling. The energy consumption of the vast majority of California
buildings is determined by how well they respond to the local climate. These “envelope
dominated” buildings include single family homes, low-rise multi-family homes, small
commercial buildings, and schools, etc. The alternative category is “internal-loads dominated”
buildings that includes large high-rise offices, hospitals, theaters, and factories, etc. which are
relatively indifferent to the exterior environment.
Small envelope-dominated buildings outnumber internal-loads dominated buildings by a huge
margin. For example, Southern California Edison supplies five residential ratepayers for every
one non-residential ratepayer, and many of these non-residential ratepayers are also housed in
envelope-dominated buildings, like small stores and offices.
California’s big internal-loads-dominated buildings are well served by sophisticated architectural
and engineering firms, construction companies, and professional building managers, who have at
their disposal an array of sophisticated tools for energy simulation, environmental analysis,
computer aided design, etc.

Climate Consultant 4.0 however is intended to support the other, much larger constituency--
California’s small consumers who design, own, manage and maintain this huge stock of
envelope-dominated buildings. This constituency needs a simple, free, easy-to-use tool that will
help them understand their local climate, and how it impacts their building’s energy
consumption.
Graphic Thinking: The computer may `know' what the climate is like, but the most challenging
task is to devise effective ways to communicate this information to the user. At UCLA over the
past 30 years we have been working on ways to graphically display complex information that are
easy and intuitive to comprehend. For example, we have developed a 3-D plotting technique
that shows the state of a variable for every hour of the day for every month of the year. We have
found that the general 'gestalt' of the resulting shape is easy to quickly interpret, while at the
same time these plots are rich with information at the most detailed level. The beauty and power
of these graphic approaches is that they communicate in a way that allows users to see extremely
subtle distinctions that would otherwise be lost in a page full of numbers. This is sometimes
called “right-brain” thinking. If ‘information’ is defined as the recognition of small differences
that make a difference, then this technique makes it possible to recognize some very subtle
differences, indeed.
3.0 RESEARCH PROJECT
Energy Problem Addressed: Designing and remodeling buildings that are truly climate
responsive depends first on gaining a detailed accurate understanding of the local climate, then
learning how to translate this into architectural form.

The former task was addressed in the prior project, Climate Consultant 3.0 that is intended
primarily for architects, students of architecture, builders, contractors, and knowledgeable
homeowners. It automatically reads the local climate data for all 8760 hours per year in EPW
(EnergyPlus Weather) format which now is available at no cost for thousands of stations (see our
web page). For the chosen climate it displays dozens of different graphic images of various
attributes of that climate.
The latter task, learning how to translate this understanding of the climate into architectural
form, is specifically addressed in Climate Consultant 4.0 which creates a new level of
sophistication by adding an expert system that develops a climate-specific list of Building
Design Guidelines. It also adds a web-based audio and graphic tutorial that explains the
relationship between temperature and humidity and how the Psychrometric chart informs climate
based building design. The purpose is not simply to plot climate data, but rather to organize and
represent this information in easy-to-understand new ways that shows the subtle attributes of the
climate, and its impact on built form.
Our goal is to help Californians create more energy efficient, more sustainable buildings, each of
which is uniquely suited to its particular spot on this planet.
4.0 CONTENT OF THE PRIOR CLIMATE CONSULTANT 3.0:
All the options which were developed as part of Climate Consultant 3.0 are also contained in the
new Climate Consultant 4.0 (see Table 1)1: 1 For a full discussion of this part of the current project please see the prior UCEI Project Report
or the ASES paper on Climate Consultant 3.0 in the Bibliography.

Table 1: Options Developed Originally in Climate Consultant 3.0 Text Screens:
Title Screen: Basic Instructions with information on how to download EPW data Measurement Units Selection (pop up): Metric or Imperial Select Weather Station: (two EPW stations are included with download) Design Criteria Definitions: All the variables in the program including Comfort Range, Design High and Low Temperatures
2-D Plots: Temperature Range Bar Chart (Mean, Records and Design High and Low for 12 Months) Radiation Bar Chart Beam and Horizontal Recorded and Theoretical Maximums Sky Cover plus Radiation Bar Chart (Mean and Record High and Low for 12 Months) Wind Speed Timetable (for 24 Hours x 365 Days with Comfort Zone Overly) Relative Humidity vs. Temperature Monthly Plots (12 Months for 24 Hour Averages) Sun Shading Chart (Hourly Bearing and Altitude, Color Coded for Comfort Temperature) Sky Cover Timetable (for 24 Hours x 365 Days with Comfort Zone Overly) Radiation Timetable (for 24 Hours x 365 Days with Comfort Zone Overly) Sun Chart (Hourly Bearing and Shadow Length, Color Coded for Comfort Temperature) Bio-Climatic Chart (Temperature 24 Hours x 356 Days with Comfort Zone Overlay)
3-D Surface Plots (Monthly or Daily): Dry Bulb Temperature Plot (for 24 Hours x 356 Days Color Coded for Comfort Ranges) Wet Bulb Temperature (for 24 Hours x 356 Days Color Coded for Comfort Ranges) Wet Bulb Depression (difference below Dry Bulb Color Coded for Evaporative Cooling Feasibility) Relative Humidity (for 24 Hours x 356 Days Color Coded for Comfort Ranges) Wind Speed (for 24 Hours x 356 Days Color Coded for Comfort Ranges)
Psychrometric Charts (with Design Strategies for 13 Zones Overlaid): With Temperature Color Coded: 8760 Hourly or Daily High/Low Data Points With Wind Speed Color Coded: 8760 Hourly or Daily High/Low Data Points, With Radiation Color Coded: 8760 Hourly or Daily High/Low Data Points With Sky Cover Color Coded: 8760 Hourly or Daily High/Low Data Points Plus All of the Above with User-Selected Hourly Ranges or Date Ranges
Wind Wheel: (Color Coded for Wind Velocity, Humidity, and Temperature for Each 10 Degrees)
For Full Year or For Selected Hourly Ranges or Date Ranges Static or Animated for Daily or Monthly Ranges
5.0 CONTENT OF THE NEW CLIMATE CONSULTANT 4.0:
By clicking on “Help” on the top line the user will get definitions of each variable on the current

screen and detailed discussions of how to apply this data to creating energy efficient buildings.
This Help function has been greatly expanded from Climate Consultant 3. It explains in detail all
of the following additions to the new Climate Consultant 4.
5.1 Criteria Screen: This has been expanded to give the user control over new variables,
such as the definition of the Fan-Forced Ventilation Zone. Other Design Categories can be
redefined here, such as the definition of the Comfort Zone. At any point the user can click the
button to Restore Default Values (see Fig.3).
5.2 Monthly Diurnal Averages: This new screen displays five variables simultaneously,
showing the average monthly values for each of the 24 hours plotted for all 12 months (see
Fig.5). These variables are:
• Dry Bulb Temperature
• Wet Bulb Temperature
• Global Horizontal Radiation
• Direct Normal Radiation
• Diffuse Radiation
It is also possible to plot the actual Dry Bulb Temperatures for every hour of the month, which
gives an idea of the variability of temperatures (see Fig.6)
5.3 New Variables: a number of additional new types of data have been added including
ground temperature at various depths, snow depth, and illumination data. Unfortunately the EPW
climate data files do not contain data on these latter two variables for any of California’s 16
climate zones:
• Ground Temperature (monthly at three depths) (see Fig.7)
• Snow (monthly bar charts, 3D monthly average by hour, 3D individual hours) (see Fig.6)

• Illumination (monthly bar charts, 3D monthly average by hour, 3D individual hours)
5.4 Psychrometric Chart: A new Design Strategy Zone for Fan-Forced Ventilation has been
added to the Psychrometric Chart and the Zone outlines have been made easier to read (see
Fig.9). The percentage of hours that fall into each of these 14 different Design Strategies gives a
relative idea of which will be the most effective passive heating or passive cooling strategy (see
Fig.10). Many of these Strategies can be used concurrently, for example Sun Shading works with
all cooling strategies. Other Strategies might conflict with each other, for example Natural
Ventilation usually requires low mass construction with large openings during the day, while
High Thermal Mass construction usually is closed up during the day to keep in the “coolth”.
Thus it is usually better to choose one or the other, selecting the one that is most compatible with
the winter passive heating Design Strategy.
Fan-Forced Ventilation: The new Fan-Forced Ventilation zone was added to the Psychrometric
Chart because it is an important cooling strategy in climates where wind speeds are low, or
where local conditions (large buildings, trees) block the available wind. The wind data in the
EPW files is usually taken at the top of a high building or in a large unobstructed area like an
airfield. This means that wind velocities will be much lower in more dense urban settings. It can
be argued that Fan-Forced Ventilation should be considered a passive cooling strategy, like
Natural Ventilation, because has such a high COP (Coefficient of Performance). This means that
although it uses electricity for fan power, the energy used compared to the cooling effect
produced is many times better than Air Conditioning. There are two ways to implement Fan-
Forced Ventilation, one is by using whole-house fans or energy recovery ventilators (if outdoor
air temperatures are cool enough), and the other is by using internal ceiling fans or personal fans.
In either case ASHRAE Standard 55 says that with air velocities of about 160 fpm, occupants
will feel an effective temperature that is about 4.5ºF cooler than the recorded dry bulb
temperature. This amount of air motion will just barely flutter a piece of paper.

5.5 Design Guidelines Based on Climate: One of the major new additions to the new Climate
Consultant 4 is the calculation of the list of Top 20 Design Guidelines (see Fig.11). A master list
of 65 Design Guidelines was created (see Table 2). On the Psychrometric Chart the percentage
of hours that fall into each of the 14 Design Strategy Zones is calculated (per Fig.10). Based on
an internal interaction matrix that assigns a weight to each of the 14 Design Strategy Zones for
each of the 65 Design Guidelines, the list of the Top 20 Guidelines is created for each unique
climate
This list of guidelines will be revised when any of the Design Strategies that do not apply to the
building are eliminated. For example if the home is not going to be high thermal mass, then click
on the three High Thermal Mass Design Strategies and they will be eliminated from further
consideration (per Fig.10), and a Top 20 list with different guidelines will be generated. Another
way this list will change is if the user changes the definitions on the Criteria Screen of the
boundaries of any of these Design Strategies (per Fig.3). The third and more complex way that
this list of Top 20 Design Guidelines can change is if the interaction matrix is revised (a utility to
let users revise this matrix is planned for the next release of Climate Consultant).

Table 2: Master List of Design Guidelines:
1
In this climate conventional heating will always be required, but can be greatly reduced by careful energy conserving design
2
A basement must be insulated on the exterior with foam (usually 18 inches below the frost line) or on the interior with fiberglass in furred wall
3
Lowering the indoor comfort temperature at night will reduce heating energy consumption (lower thermostat heating setback)
4 Extra insulation (super insulation) might prove cost effective 5
Carefully seal building to minimize infiltration and eliminate drafts, especially in windy sites (house wrap, weather stripping, good window construction)
6 Exterior wind shields and planting can protect entries from cold winter winds 7 Use vestibule entries (air locks) to minimize infiltration and eliminate drafts, in cold windy sites 8 Sunny wind protected outdoor spaces can extend living areas in cool weather 9
Use compact building form with square-ish floorplan and multiple stories to minimize heat loss from Building envelope (minimize surface to volume ratio)
10
Glazing should minimize conductive loss and gain (minimize U-factor) because radiation gain or loss (Low-E) will have less impact in this climate
11
Equipment, lights, and occupants generate a significant amount of heat gain that can reduce winter Heating loads or increase summer cooling
12 Insulating blinds or heavy draperies will help reduce night time heat losses 13
Steep pitched roofs, vented with an insulated ceiling below, work well in cold climates to shed snow, and prevent ice dams
14 Locate garages or storage areas on the side of the building facing the coldest wind to help insulate 15 High Efficiency furnace (at least Energy Star) should prove cost effective 16
Trees (neither conifer nor deciduous) should not be planted in front of passive solar windows, but rather beyond 45 degrees from each corner
17 Use plant materials (ivy, bushes, trees) especially on the west to shade the structure 18 Keep building small (right-sized) because excessive floor area wastes heating and cooling energy 19
This is a good climate for passive solar heating so face the long side of the floorplan to the south to maximize glazing exposure to winter sun
20
Provide double pane high performance glazing (Low-E) on west, north, and east, but clear on south for maximum passive solar gain
21
Use raised floor, well insulated, because a slab on grade is of little benefit for thermal storage in cold climates or small day-to-night temperatures
22
Even wood floors with tile or slate, or a stone fireplace can help store winter daytime solar gain and summer nighttime 'coolth'
23
Small well-insulated skylights (less than 3% of floor area in temperate climates, 5% in overcast) reduce daytime lighting energy and cooling loads
24
Use high mass interior materials to store winter passive heat and summer night 'coolth' such as slab floors, high mass walls, stone fireplace
25
Steep pitched well ventilated roofs work well in wet climates to shed rain and protect outdoor Porches and verandas
26 A radiant barrier (shiny foil) will help reduce radiated heat gain through the roof in hot climates 27 Raise buildings high above ground to minimize dampness and maximize natural ventilation 28
Windows can be unshaded and face in any direction because there is little benefit from passive solar heating and little danger of overheating
29
Humidify the air in enclosed outdoor spaces before it enters the building with spray-like fountains, Misters, wet pavement, or cooling towers
30
High performance glazing on all orientations should prove cost effective (Low-E with insulated frames) in hot clear summers or cold winters
31
Organize floorplan so winter sun penetrates into daytime use spaces with specific functions that coincide with solar orientation

32 Minimize or eliminate west facing glazing to reduce afternoon heat gain 33
High performance glazing (Low-E) might NOT be needed in mild more overcast climates, or in Warmer climates if windows are fully shaded
34
Wind direction can be changed up to 45 degrees by exterior wingwalls, casement windows, L shaped floorplans, or plantings
35
Good natural ventilation can reduce or eliminate air conditioning, especially if windows are well Shaded and oriented to prevailing breezes
36
Locate door and window openings on opposite sides of building to facilitate cross ventilation, with larger areas facing up-wind if possible
37
Air conditioning can be reduced or eliminated by carefully designing fixed overhangs or operable sunshades (extend in summer retract in winter)
38
Shape and orient floorplan to within +/- 45 degrees of prevailing breezes, provided that all windows are well shaded (deep roof overhangs)
39
A whole-house fan or natural ventilation can store nighttime 'coolth' in high mass interior, thus reducing or eliminating the need for air conditioning
40
High mass interior surfaces like stone, brick, tile, or slate, feel naturally cooler on hot days and reduce day-to-night temperature swings
41
The best high mass walls use exterior insulation (EIFS foam) and expose the mass on the interior Or use plaster or direct contact drywall
42
Ceiling fans during the day can provide up to 4.5º F of added comfort cooling and thus can reduce Or eliminate the need for air conditioning
43 Use light colored building materials and cool roofs (with high emissivity) to minimize conducted heat gain 44
Plant tall deciduous trees close to south façade at 45 degrees from the corners to shade the roof (in New England called husband and wife trees)
45 Flat roofs work well in hot dry climates (especially if light colored) 46 High Efficiency air conditioner (at least Energy Star) should prove cost effective 47
Use open plan interiors to promote natural cross ventilation, or use louvered doors or jump ducts if privacy is required
48
Raising indoor comfort temperature to 80° (thermostat setpoint) will reduce cooling energy, while added air motion will increase comfort
49
Provide vertical distance between air inlet and outlet to produce stack ventilation (open stairwells, two story spaces, roof monitors) when wind speeds are low
50
An Evaporative Cooler can provide all the required cooling capacity (thus eliminating the need for an air conditioner)
51
Slab on grade should provide enough thermal mass, but if air conditioning is still needed consider high-mass walls or better window shading
52
In very cold climates outdoor air is extremely dry, but a well sealed home generates more than enough moisture to make it comfortable
53
Shaded outdoor areas (porches, patios) oriented to the prevailing breezes can extend living Spaces in warm or humid weather
54 Provide enough north glazing to balance daylighting and allow cross ventilation (about 3 to 5% of floor area) 55 Low pitched roof with wide overhangs works well in temperate climates 56 Screen porches and patios work wlll to provide comfort cooling by ventilation and prevent insect problems 57 In very hot climates with no passive solar needs, orient most of the glass to the north, shaded by vertical fins 58
This is one of the more comfortable climates, so shade to prevent overheating open to breezes in summer, and use passive solar gain in winter
59
In this climate air conditioning might always be required, but can be greatly reduced if building is designed to minimize overheating
60
In very hot climates earth sheltering or occupied basements benefit from earth cooling in summer (it remains close to average annual temperature)
61
Traditional homes in hot dry climates used high mass construction with small well shaded openings operable for night ventilation to cool the mass
62 Traditional homes in temperate climates used light weight construction with slab on grade and

openable walls and shaded outdoor spaces 63
Traditional homes in cold overcast climates used low mass well sealed, well insulated construction To provide rapid heat buildup in morning
64
Traditional homes in mixed hot humid and cold climates used low mass well ventilated second floor, and high mass sun tempered first floor
65
Traditional homes in hot humid and cool climates used high ceilings and high operable (French) windows protected by roof overhangs and verandas
66
Traditional homes in hot dry climates used enclosed well shaded courtyards, with a small fountain To provide wind-protected microclimates
67
Traditional homes in cold climates had snug floorplan with central heat source, south facing windows, and roof pitched for wind protection
68
Traditional homes in warm humid climates used light weight construction with openable walls and Shaded outdoor porches, raised above ground
This list was developed based on a number of references, including in part Watson and Labs, as well as Loftness, et.al., the description of Traditional Buildings was developed from many authors especially
James Marston Fitch (see Bibliography).
Because the combination of Building Design Guidelines is different for each different climate,
we will be able to answer the question of how this specific local climate implies a unique
architectural form. Therefore this project directly addresses the purpose of the UCEI’s California
Energy Studies Program, to “provide a better intellectual basis for energy decisions.”
For example, if the majority of the hours on the psychrometric chart fall in the strategy when
Natural Ventilation is the most effective cooling strategy, the Building Design Guidelines list
might include:
38
Shape and orient floorplan to within +/- 45 degrees of prevailing breezes, provided that all windows are well shaded (deep roof overhangs)
36
Locate door and window openings on opposite sides of building to facilitate cross ventilation, with larger areas facing up-wind if possible
55 Low pitched roof with wide overhangs works well in temperate climates 62
Traditional homes in temperate climates used light weight construction with slab on grade and openable walls and shaded outdoor spaces
However if the majority of the hours fall in the zone of High Mass with Night Ventilation or
Whole House Fan, the Building Design Guidelines are almost the exact opposite:
24
Use high mass interior materials to store winter passive heat and summer night 'coolth' such as slab floors, high mass walls, stone fireplace

39
A whole-house fan or natural ventilation can store nighttime 'coolth' in high mass interior, thus reducing or eliminating the need for air conditioning
9
Use compact building form with square-ish floorplan and multiple stories to minimize heat loss from Building envelope (minimize surface to volume ratio)
61
Traditional homes in hot dry climates used high mass construction with small well shaded openings operable for night ventilation to cool the mass
Conflicts between Design Guidelines: Because all the hours in a year’s climate will not fall into
one single Building Design Strategy Zone on the Psychrometric Chart, it is likely that there will
be Building Design Guidelines that are in conflict with each other. It is the resolution of these
conflicts that are the essence of the architect’s design task. Clever designers can create
innovative solutions that resolve these apparent conflicts. Poorly designed buildings are usually
the ones that are found to ignore the most important Building Design Guidelines.
5.6 Design Guideline Sketches: For each Guideline on the Master List, a sketch is available
that is a graphic illustration of how to translate that Guideline into building form (for an example
see Fig.10). These sketches are certainly not the only way to interpret each guideline, but they
serve to communicate the issues more effectively.
5.7 Psychrometric Chart Tutorial: As part of this new Climate Consultant 4 we have created
a new user-paced tutorial that is a dynamic graphic and audio presentation that shows the
relationship between air temperature and humidity, and how this influences human thermal
comfort. It is written in Flash and can be downloaded at no cost from our web site
(www.aud.ucla.edu/energy-design-tools). It requires the Flash Player which can also be
downloaded from the same site. Many users find it difficult to understand how to read the
Psychrometric Chart. This Psychrometric Chart Tutorial will help them understand:

• What each set of lines on the chart mean (i.e. Relative Humidity vs. Absolute Humidity,
Dry Bulb vs. Wet Bulb vs. Dew Point Temperature),
• How can human thermal comfort be defined on the chart
• How different HVAC systems that change environmental conditions can be represented
on the chart.
6. WEB SITE
Both Climate Consultant 4 and the new Psychrometric Chart Tutorial, along with the paper
describing the prior version of Climate Consultant 3.0, are all available at no cost on the
following web site:
www.aud.ucla.edu/energy-design-tools
7. ACKNOWLEDGEMENTS
This project would not have been possible without the support of the University of California
Energy Institute (UCEI). At UCLA the Principal Investigators were Murray Milne and Robin
Liggett. The Design Sketches for each of the Design Guidelines were produced by Andrew
Benson, based in part on work by Don Watson and Ken Labs, and by Vivian Loftness et al. The
Psychrometric Chart Tutorial was written in Flash by Yasmin Bhattacharya.

Fig.1: Climate Consultant 4: New Introduction screen
Fig.2: Select Units and Open EPW Weather: In this case Imperial Units (inch/pound) units were selected, and California Zone 16 (the high Sierras) was selected.

Fig.3: Criteria Screen: This has been expanded to give the user control over new variables, such as the definition of the Comfort Zone. The new Fan-Forced Ventilation Zone can be redesigned here. At any point the user can click the button to Restore Default Values.
Fig.4: Weather Data Summary Screen: Now gives monthly data for 18 variables

Fig.5: Monthly Diurnal Averages: Gives monthly plots showing all 24 hours for Dry Bulb and Wet Bulb Temperatures, and for Global Horizontal, Direct Normal and Diffuse Solar Radiation.
Fig.6: This same chart can display all the hourly Dry Bulb temperatures for each month.

Fig.5: Ground Temperature: Monthly Average shown for 3 depths, (at 0.5, 2, 4 meters)
Fig.6: Snow Depth Range: Unfortunately, no data on Snow Depth is given for any of the California Climate Zones.

Fig.7: Psychrometric Chart: Each dot represents one of the 8760 hours per year. In Climate Consultant 4 a new Design Strategy Zone has been added for Fan-Forced Ventilation.
Fig.8: Design Strategies: The percentage of hours that fall into each of the 14 Design Strategy zones on the Psychrometric Chart shows which will be most effective. Here in Climate Zone 16, the High Sierras, the best cooling strategy is 3. High Thermal Mass, and the best passive heating strategy is 9. Passive Solar Direct Gain in a Low Mass Building. In this case the conflict can be removed by clicking on one of these Design Strategies to remove it, which will recalculate the percentages of all the others. Sun Shading, Internal Gains, Wind Protection, and Conventional Heating will not conflict with each other so should remain.

Fig.9: Design Guidelines: A unique list will be produced for each climate and for the selected Design Strategies
Fig.10: Design Guideline Sketches: If you click on the ID number of any guideline you will get a Sketch further explaining more about how it affects the architectural form of the building.
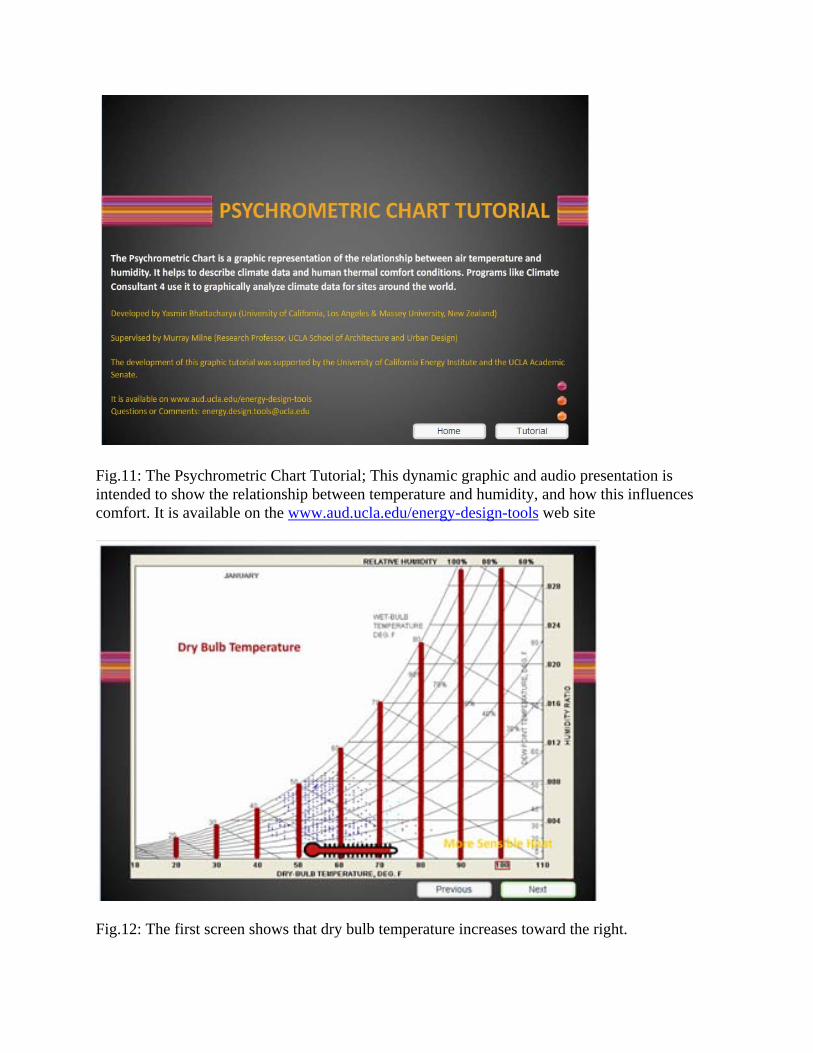
Fig.11: The Psychrometric Chart Tutorial; This dynamic graphic and audio presentation is intended to show the relationship between temperature and humidity, and how this influences comfort. It is available on the www.aud.ucla.edu/energy-design-tools web site
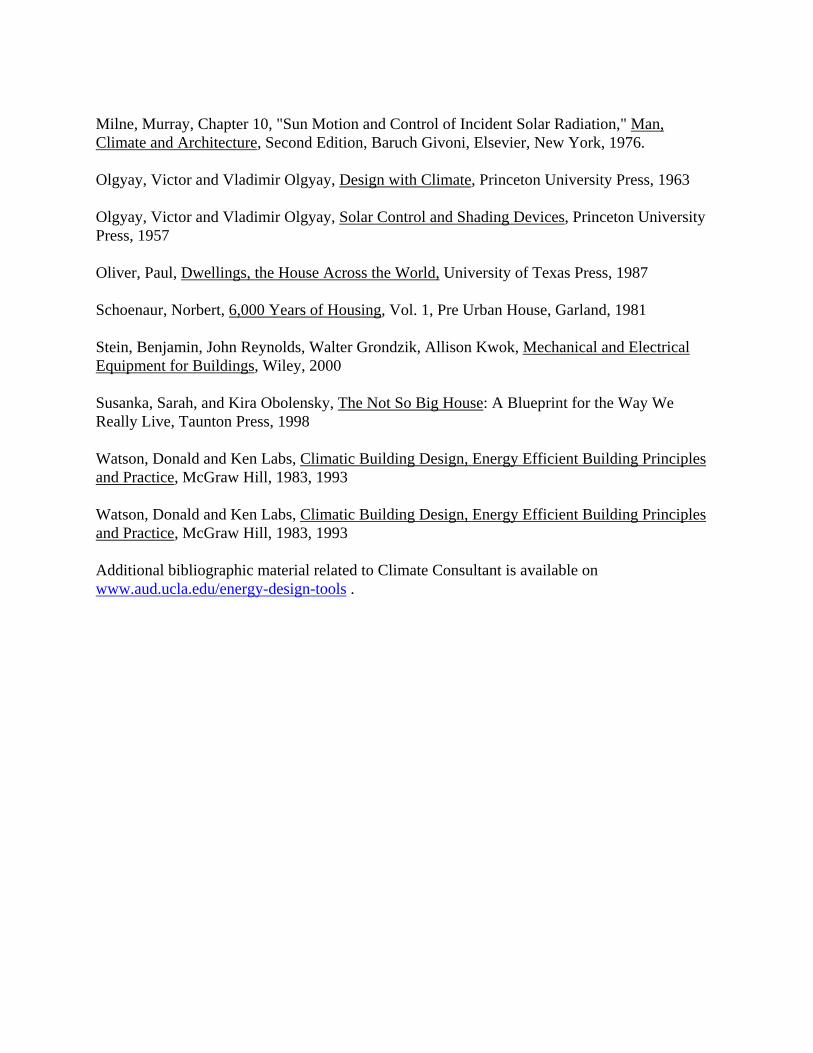
Fig.12: The first screen shows that dry bulb temperature increases toward the right.

Fig.13: The next screen shows that absolute humidity increases vertically
Fig.14: The Saturation Line shows that air can hold more moisture at higher temperatures but can hold less as the temperature decreases, which will lead to precipitation.

Fig.15: The ASHRAE Winter and Summer Comfort Zones can be plotted on the Psychrometric Chart. There are a number of other definitions of comfort which have slightly different zones.
Fig.16: A building’s HVAC system can change indoor conditions in four common ways.

BIBLIOGRAPHY: Al-Shaali, Rashid: "Tools for Natural Ventilation in Architecture”, UCLA PhD Dissertation, 2006 ASHRAE Standard 55-2004, Thermal Environmental Conditions for Human Occupancy, American Society of Heating, Refrigeration, and Air Conditioning Engineers, Inc., Atlanta Georgia, 2004 ASHRAE: Chapter 30 in 2001 ASHRAE Handbook of Fundamentals, American Society of Heating, Refrigeration, and Air Conditioning Engineers, Inc., Atlanta Georgia, 2001 California Energy Commission, Residential Compliance Manual, 2005 Building energy Efficiency Standards, CEC 400-2005-005-CMF Dueck, Al, “Canadian Green Housing: Equilibrium House” (Net Zero Energy), Sustainable Architecture Magazine, November/December, 2007, SABmag.net Duly, Colin, The Houses of Mankind, Thames and Hudson, 1979 Fitch, James Marston, and Branch, Daniel P, “Primitive Architecture and Climate”, Scientific American, December, 1960, Givoni, Baruch, Man, Climate and Architecture, Second Edition, Elsevier, New York, 1976 Guidoni, Enrico, Primitive Architecture, Faber and Faber/Electra, 1975 Loftness, Vivian, et al., Regional Guidelines for Building Passive Energy Homes, AIA Research Corporation for the US Department of Housing and Urban Development in cooperation with the US Department of Energy, July 1980 Lechner, Norbert, Heating Cooling Lighting, Design Methods for Architects, Wiley, 2001 Mazria, Edward, The Passive Solar Energy Book, Rodale Press 1979 Milne, Murray, and Baruch Givoni, Chapter 6, "Architectural Design Based on Climate", Energy Conservation through Building Design, Donald Watson, Editor, McGraw-Hill, New York, 1979 Milne, Murray, Robin Liggett, and Rashed Alshaali, “A New Design Tool for Visualizing the Energy Implications of California’s Climates”, University of California Energy Institute’s (UCEI) Energy Development and Technology Working Paper Series, www.ucei.org, April 2007 “Climate Consultant 3.0: A new Design Tool for Visualizing Building Energy Implications of Climates”, with Robin Liggett, Proceedings of the 2007 American Solar Energy Society Conference, July 2007, Cleveland, Ohio
Milne, Murray, Chapter 10, "Sun Motion and Control of Incident Solar Radiation," Man, Climate and Architecture, Second Edition, Baruch Givoni, Elsevier, New York, 1976. Olgyay, Victor and Vladimir Olgyay, Design with Climate, Princeton University Press, 1963 Olgyay, Victor and Vladimir Olgyay, Solar Control and Shading Devices, Princeton University Press, 1957 Oliver, Paul, Dwellings, the House Across the World, University of Texas Press, 1987 Schoenaur, Norbert, 6,000 Years of Housing, Vol. 1, Pre Urban House, Garland, 1981 Stein, Benjamin, John Reynolds, Walter Grondzik, Allison Kwok, Mechanical and Electrical Equipment for Buildings, Wiley, 2000 Susanka, Sarah, and Kira Obolensky, The Not So Big House: A Blueprint for the Way We Really Live, Taunton Press, 1998 Watson, Donald and Ken Labs, Climatic Building Design, Energy Efficient Building Principles and Practice, McGraw Hill, 1983, 1993 Watson, Donald and Ken Labs, Climatic Building Design, Energy Efficient Building Principles and Practice, McGraw Hill, 1983, 1993 Additional bibliographic material related to Climate Consultant is available on www.aud.ucla.edu/energy-design-tools .