energy demand and security of power supply 2013
DESCRIPTION
Energy Demand and security of power supplyTRANSCRIPT

Energy Demand and security of power supply
Birgitte Bak-Jensen
Institute of Energy Technology Aalborg University
www.et.aau.dk E-mail: [email protected]

2
Topics
– Energy demand worldwide • Introduction to energy systems
• Energy demand
– In the world
– US
– Germany
– Estonia
– Denmark
• Measures to provide balance in the future
• Integration and Control of Wind Farms in the Danish Electricity System

3
Introduction to energy systems
• Introduction to overall energy system
• Need for different kind of power – Electrical
– Thermal
– Hydraulic
– Mechanical
• Different ways to produce the power – Power plants (fossil fuels, hydro, gas, waste etc)
– Wind turbines
– Use of alternative energy resources
• Different ways to transmit the power

4
Introduction to energy systems
HEAT LOADS
POWER STATION
SOLAR CELLS
WIND TURBINE
MOTOR
PUMP
ROBOTICS
REFRIGERATOR
TELEVISION
LIGHT
TRANSFORMER
INDUSTRY
=
POWER SUPPLY
ac dc
TRANSFORMER
COMPEN - SATOR
FUEL CELLS
FUEL [
COMMUNICATION
COMBUSTION
ENGINE
SOLAR ENERGY
TRANSPORT
3 3 3 1 - 3
3
DC
AC
~
POWER STATION
SOLAR CELLS
WIND TURBINE
MOTOR
PUMP
ROBOTICS
REFRIGERATOR
TELEVISION
LIGHT
TRANSFORMER
INDUSTRY
=
POWER SUPPLY
ac dc
TRANSFORMER
COMPEN - SATOR
FUEL CELLS
FUEL [
COMMUNICATION
COMBUSTION
ENGINE
SOLAR ENERGY
TRANSPORT
3 3 34 1 - 3
3
DC
AC
~
DC
AC
DC
AC
PRIMARY FUEL
CHP
Energy Storages
Energy Storages
FACTS/CUPS
Keywords: Energy production – Energy distribution – Energy consumption – Energy control
Energy demand
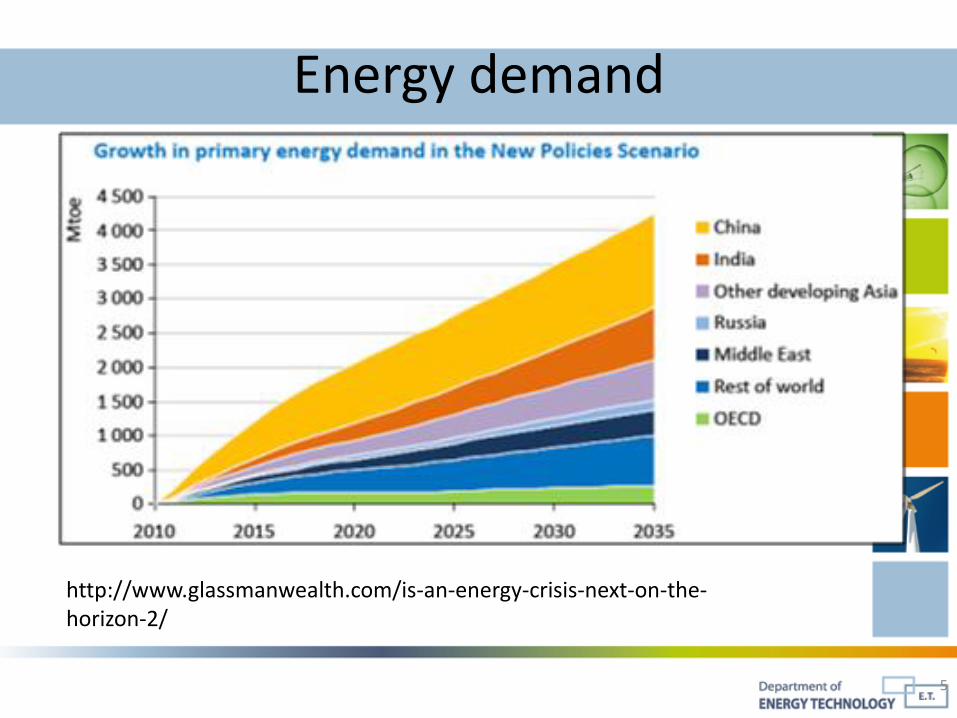
5
http://www.glassmanwealth.com/is-an-energy-crisis-next-on-the-horizon-2/

Energy demand
http://articles.businessinsider.com/2012-01-30/markets/31004698_1_oecd-demand-growth-energy-demand

Energy demand
7
http://energyanswered.org/questions/how-important-is-oil-sands-to-americas-energy-future

Energy demand
http://www.bp.com/genericarticle.do?categoryId=98&contentId=7069626

9
Energy demand
∙Ref:www.exxonmobil.com/Corporate/energy_outlook_p...

Electricity demand
10
http://www.marketsize.com/blog/index.php/2011/03/
March 2011

Electricity demand
The installed capacity has to increase by over 80%
New power sources becomes interesting
More efficient use of the existing sources
From production to end user
Power balance extremely important
New energy storage devices http://www.iea.org/textbase/nppdf/free/2011/key_world_energy_stats.pdf

Electricity generation by region
12
http://www.iea.org/textbase/nppdf/free/2011/key_world_energy_stats.pdf

13
Energy demand
• Ref:http://www.eea.europa.eu/data-and-maps/indicators/final-electricity-consumption-by-sector/final-electricity-consumption-by-sector-2
Electricity consumption per capita (in kWh/cap) in 2008

Development in Energy Technology
14
Future Power System
Less central power plants and more DPGS
Current Power System

15
Energy demand US
• Ref: http://www.sankey-diagrams.com/tag/us/
“…over half of the energy produced for our domestic market goes to waste. Fully two thirds of the energy produced by electrical generation and distribution goes to waste.”

16
Energy demand US
• Ref: http://www.energyliteracy.com/?p=126
2/3 of US electricity is wasted!

Energy demand US
• In 2010, renewable energy increased to 8% of the total primary energy consumed in the U.S • http://endofcrudeoil.blogspot.com/2011_06_01_archive.html
17

Energy demand D
• Primary energy mix in Germany in 2010 (in % )
• http://blog.american.com/2011/08/the-costs-of-german-fear-energy-fact-of-the-week/
18

19
Energy demand D
Balance of Electricity supply in Germany 2007
• Ref: www.fair-pr.com/background/facts.php

20
Energy demand D
• Development of electricity generated in Germany from renewable energy sources until 2015
Ref: http://www.wwindea.org/technology/ch04/en/4_1_2_1.html

Ref: http://www.bmu.de/files/pdfs/allgemein/application/pdf/hintergrund_zahlen2006_eng.pdf
Energy demand D
Structure of renewable energy technologies for electricity supply in Germany

22
Energy demand EST
• Ref: http://www.enercee.net//estonia/energy-demand.html

23
Energy demand EST
• Ref: http://www.enercee.net/fileadmin/enercee/test/Est-fin-cons-energy2010.GIF

24
Energy demand EST
http://www.enercee.net/estonia/energy-supply.html

Electric capacity in Nordic countries
Ref: Danish Electricity Supply 2009, Statistical Survey, Dansk Energi

26
Overview of DPGS
• Wind energy – highest development
• Solar energy – next highest development
• Wave energy – largely unexplored
• Tidal energy – largely unexplored
• Small hydro (<10MW), 47GW used, 180 GW untapped (70% in
developing countries). Oldest technology (not covered)
• Biomass 18GW used (2000), largely unexplored. Used in CHP.
Advantages of DPGS:
• Load management (peak shaving)
• Power quality (required by standards!)
• Enhanced voltage stabiliity
• Reduced transmission losses
• Potential for improving grid reliability/stability
Disadvantage - high cost!
Development in Energy Technology

27
Production capacity in Denmark
Ref: Danish Electricity Supply 2009, Statistical Survey, Dansk Energi

28
Production capacity in Denmark
East
MW
West
MW
Central power plants 3.755 3.402
Decentralized power plants
628 1.741
Wind power on-shore 578 2.232
Wind power off-shore 166 160
Consumption (max load 10 year winter)
3.031 4.060
Ref: http://www.energinet.dk/NR/rdonlyres/F53D95F7-36FF-477A-AD71-35C64DEDAFA4/0/Analyseforudsætninger20072016.pdf

29
Production capacity in Denmark
• Decentralized power plants categorized after size.
East Denmark West Denmark Denmark
Power
MW
Number Power
MW
Number Power
MW
Number
0-5MW 181 222 547 483 728 705
5-10MW 120 18 295 44 415 62
10-50MW 192 11 476 25 668 36
50-100 MW 136 2 423 6 559 8
Total 628 253 1741 558 2370 811
Ref: http://www.energinet.dk/NR/rdonlyres/F53D95F7-36FF-477A-AD71-35C64DEDAFA4/0/Analyseforudsætninger20072016.pdf

Production capacity in Denmark
• Wind turbines categorized after size
East Denmark West Denmark Denmark
Power
MW
Number Power
MW
Number Power
MW
Number
0-149kW 4 101 14 286 18 397
150-450kW 96 392 270 1288 366 1680
451-900kW 355 546 1393 2033 1748 2579
901-1300kW 42 40 255 232 297 272
1301-2000kW 72 37 377 205 449 242
>2000kW 175 75 82 32 257 107
Total 744 1191 2392 4076 3136 5267

31
Production capacity in Denmark
Ref: Danish Electricity Supply 2009, Statistical Survey, Dansk Energi

32
The surroundings of the Western Danish Power System: - connecting the transmission systems of Nordel
(Scandinavia) and UCTE (Continental Europe).
DK West is a regular transit area with large interconnections to the neighbouring areas:
Norway (HVDC ”Skagerrak”): Capacity: 1,000 MW
Sweden (HVDC ”KontiSkan”): Capacity 720 MW
Germany (AC): Capacity, import: 900 MW Capacity, export: 1,500 MW

33
Production capacity in Denmark
• Import and export from Denmark in GWh

34
Production capacity in Denmark Installed wind capacity share in the electricity supply in Denmark by year
Year 2001 2002 2003 2004 2005 2006 2007
Installed wind capacity (MW) 2,489 2,892 3,117 3,125 3,129 3,136 3,125
Wind power share in the electricity supply (%) 12.1 13.8 15.8 18.5 18.5 16.8 19.7
∙Ref:http://www.danskenergi.dk/~/media/Energi_i_tal/Statistik_07_UK_net%20pdf.ashx
Ref: http://www.power-technology.com/projects/hornsreefwind/hornsreefwind1.html

35
Wind production in % of consumption Wind Production in % of consumption
0
20
40
60
80
100
120
01-0
1-2
00
7
31-0
1-2
00
7
02-0
3-2
00
7
01-0
4-2
00
7
01-0
5-2
00
7
31-0
5-2
00
7
30-0
6-2
00
7
30-0
7-2
00
7
29-0
8-2
00
7
28-0
9-2
00
7
28-1
0-2
00
7
27-1
1-2
00
7
27-1
2-2
00
7
Date
%
% of consumption Denmark

36
Wind production in % of consumption
Wind Production in % of consumption
0
20
40
60
80
100
120
01-0
1-2
00
7
31-0
1-2
00
7
02-0
3-2
00
7
01-0
4-2
00
7
01-0
5-2
00
7
31-0
5-2
00
7
30-0
6-2
00
7
30-0
7-2
00
7
29-0
8-2
00
7
28-0
9-2
00
7
28-1
0-2
00
7
27-1
1-2
00
7
27-1
2-2
00
7
Date
%
% of consumption ENDK-E

37
Wind production in % of consumption Wind Production in % of consumption
0
20
40
60
80
100
120
01-0
1-2
007
31-0
1-2
007
02-0
3-2
007
01-0
4-2
007
01-0
5-2
007
31-0
5-2
007
30-0
6-2
007
30-0
7-2
007
29-0
8-2
007
28-0
9-2
007
28-1
0-2
007
27-1
1-2
007
27-1
2-2
007
Date
%
% of consumption ENDK-W

38
Production capacity in Denmark
• Development in decentralized power plants in the West Denmark area
39
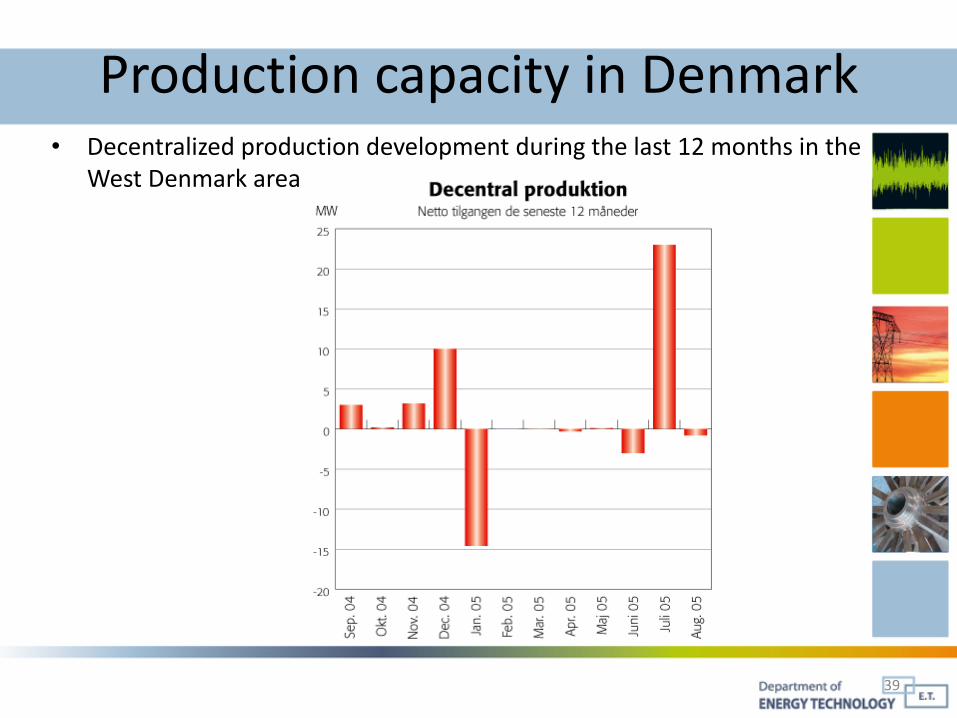
Production capacity in Denmark • Decentralized production development during the last 12 months in the
West Denmark area

40
Energy demand DK
• Ref: Danish Electricity Supply 2009, Statistical Survey, Dansk Energi

41
Energy demand DK
Primary energy supply in DK by two different prognosis methods
Export SE-elec.
Solar heat
Biomass Natural gas
Oil Coal

42
Energy demand DK
Ref: Danish Electricity Supply 2009, Statistical Survey, Dansk Energi

43
Energy demand DK
Ref: Danish Electricity Supply 2009, Statistical Survey, Dansk Energi

44
Introduction to the existing Danish power system
• Danish energy demand • Ref:http://www.danskenergi.dk/~/media/Energi_i_tal/Statistik_07_UK_net%20pdf.ashx

45
Introduction to the existing Danish power system
Ref: Danish Electricity Supply 2009, Statistical Survey, Dansk Energi

Introduction to the existing Danish power system
Ref: Danish Electricity Supply 2009, Statistical Survey, Dansk Energi

Introduction to the existing Danish power system
Danish Electricity Supply 2009, Statistical Survey, Dansk Energi

Introduction to the existing Danish power system
Ref: Danish Electricity Supply 2009, Statistical Survey, Dansk Energi

49
Future demands in DK
• Future demands to the energy systems from the government strategy plan 2025. – Energy saving initiatives must grow 1,25% annually
– Share of Renewable energy should be increased to at least 30% of energy consumption I 2025
– Biofuels in the transport sector should be increased to at least 10% by 2020.
– More efficient energy technologies should be made, the finansial support from government is doubled up to 2010.
– New infra structure with regard to the electrical transmission system and the gas system.

50
Future demands in DK
• Point from the government energy strategy – Points with relevance to electrical power and combined
heat and power production. • 3000 MW extra wind power ~ 50% wind power for the
electrical demand in DK
• 100.000 oil-fired boilers to be replaced with heat pumps
• 50 new large biogas power plants
• Increased flexibility in the choice of fuels
• Production of 2nd generation bio-fuel for transport
• Improved exploitation of energy from waste in combined heat and power production plants
• An energy saving market, and flexible electricity consumption
• District cooling
• Development of hydrogen and fuel cell systems. Especially intended for micro combined heat and power systems

51
Future demands in DK • Consequences for the electrical system
– Increased need for balancing control power
– Several occasions a year with surplus power and with a larger amount
– Need for both and energy as well as a power balance
– New price-elastic power consumption
– Renewable energy which can replace fossil fuels
Today (first 8 weeks of 2007) Today + 3000MW
Wind power Minimum regulating power Load

52
Future demands in DK • What should ensure the balance in the future
– DK have to use internal balance control possibilities as well as using the connection to our neighbour countries if the stability and security of supply shall be maintained and the usage of the wind power production are to be optimized also with regard to the market and environment.
– The below profile demands a huge and expensive amount of balancing power
Surplus power

53
Future demands in DK
• Balance control through new measures – Power production by use of fossil fuels or bio-fuels are controlled
up/down at fluctuations in the wind-power – Increase the role of the district heating in the total energy system – The power plants gets the possibility to shift among the production
of electricity, heat and bio-fuels – Use electrical power where it replaces fossil fuels i.e. for boilers,
heat-pumps, electric heating elements etc. – Improve the electrical infra-structure also the connections to our
neighbouring countries – Use price-elastic electric energy consumption – Control the power production from the wind-turbines – Conversion/storage of electrical energy to other energies i.e.
hydrogen, electrical cars, compressed air storages, fuel-cells etc.

54
System demands/ rules of Energinet.dk
• Primary control: – Maintain the balance between generation and demand in the
network using turbine speed governors – Automatic control to regulate the frequency within seconds
• Secondary control: – Secure import/export balancing with neighbouring areas with
reserve generating capacities. Control within minutes – In case of a major frequency deviation in the control area to
restore the frequency and to free capacity for the primary control – Can be manual or automatic
• Tertiary control: – Is automatic or manual change in the working points of generators
in order to restore adequate secondary control reserve at the right time

55
West Denmark power system Power system key figures (WDK) MW
Centralized power plant units 3400
Decentralized CHP units 1750
Wind turbines 2400
Offshore Wind - Horns Rev A 160
Maximum demand 3767
Minimum demand 2669
Transmission capacity from Germany to
W. Denmark
950
Transmission capacity from W.
Denmark to Germany
1500
Transmission capacity with Norway 1040
Transmission capacity with Sweden 740
Regulation
reserves
Primary Automatic Manual
Capacity (MW) +/- 24 +/- 90 +290/-310
Activation time 0 - 30sec 30sec - 15min 15min
Activation mode Automatic Load frequency control Manual

56
System demands/ rules of Energinet.dk
• NORDEL
Decoupling of power plants
Emergency power by HVDC connections
Lowering generation
Frequency control/primary control
Emergency power by HVDC connections
Load shedding, diconnection of connection lines
Disconnection of large combined power plants
The reserve is activated

57
Example of agreement concerning system demands:
Table 1. Agreement concerning systems demands between E2 and Elkraft System. /2/
Type
Demand Maximum activation time
Frequency control reserve 25MW at 0.1 Hz 2-3 minutes
Reserve up regulation 150 MW Minimum 2.5 MW per minute as
an average over 10 minutes
Reserve deregulation 150 MW Minimum 2.5 MW per minute as
an average over 10 minutes
Momentary regulating power 50 MW at 49.5 Hz 5/30 second
Fast reserve 300 MW
60 MW
240 MW
15 minutes
1 hour
1 hour 30 minutes
Reactive reserve/voltage control Minimum 3 systems with each –50
to –100 MVAr control
synchronized to the 132kV/400 kV
network grid
Few seconds
Start after a blackout According to appendix

58
System demands
• Industry and decentralized power plants have now to participate in the market demands:
– The TSO have made deals with different industry concerning regulating power from their emergency power system and by lowering their power.
• Reserved should be available within 10 minutes.
– From 2007 all plants above 5 MW are included in an agreement about power payment, so ensure that the plants are available for the market demands.

59
Possibilities for reserve
• Power balance in Nordel 2009/10

60
Possibilities for reserve
• Rolling reserve: – By changing the demands for reserve from the
decentralised power plants – By using reserves from the wind turbines – Use emergency power units in the industry – By load shedding according to different rules – By use of on-line pricing systems to control some of
the loads.
• Energy storage: – Use of energy storages to somehow average the
power from the wind turbines

61
Integration and Control of Wind Farms in the Danish Electricity System
Ph.D. Candidate: Akarin Suwannarat
Supervisors: Birgitte Bak-Jensen, Zhe Chen
PhD Defense on January 14, 2008 at Aalborg University
November 2004 – November 2007
PSO 4102 Project

62
Related problems with Renewable Energy Power
• Problems with wind power fluctuations:

Power Balancing Control
63
• On large interconnected networks, the issue seems to be load following and power balancing
• Need more regulating power with the increased wind power penetration
Objectives
• Need for dedicated system modelling tools for analysing high penetration of wind power generations
• Control strategies for power balancing control
• Technical issues which might limit the wind power penetration in Danish power system

Implementation and Development of Models
64
• AGC system
• Wind Farm Power Control
• Gradient control, Delta Control, Balance Control
• Centralised thermal power plant
• Secondary control
• Decentralized CHP unit
• Fast Secondary control
• Great Belt Link HVDC connection
• Regulating power control
• The connections with UCTE and Nordel systems
• Time-series for the connections with Norway and Sweden
• Slack-bus for the connection with Germany

Two Bus-Bars Danish Power System
65
•No transmission network
•Generating units and system interconnections is included
66
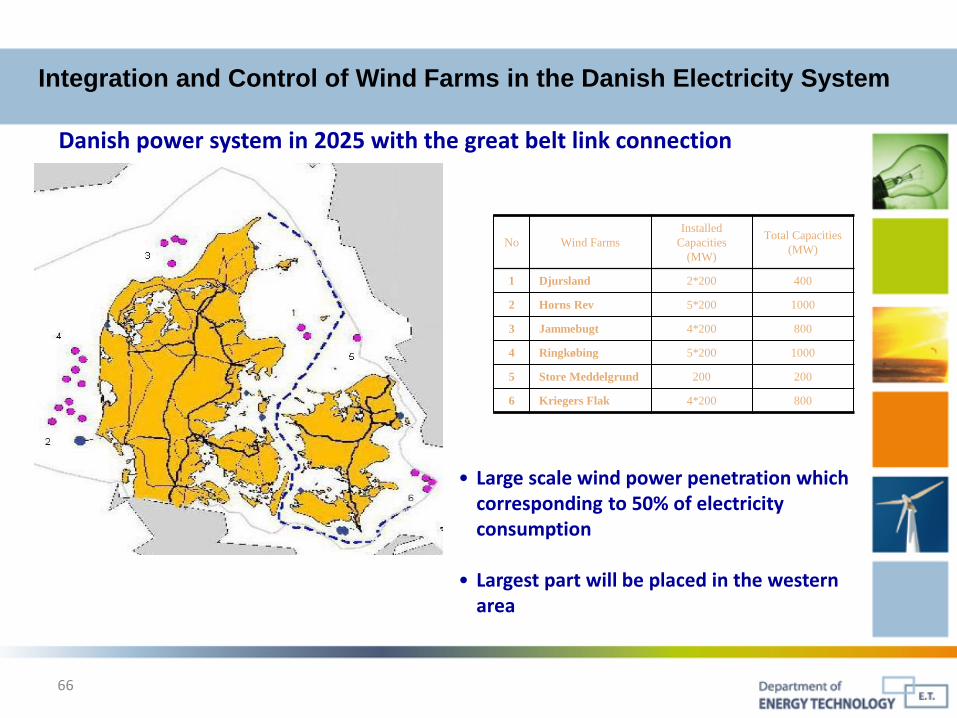
Danish power system in 2025 with the great belt link connection
No Wind Farms
Installed
Capacities
(MW)
Total Capacities
(MW)
1 Djursland 2*200 400
2 Horns Rev 5*200 1000
3 Jammebugt 4*200 800
4 Ringkøbing 5*200 1000
5 Store Meddelgrund 200 200
6 Kriegers Flak 4*200 800
• Large scale wind power penetration which corresponding to 50% of electricity consumption
• Largest part will be placed in the western
area
Integration and Control of Wind Farms in the Danish Electricity System

Control Strategies for Power Balancing Control
67
• Different control strategies are demonstrated:
a) Secondary control of the centralized power plants b) Regulating power control from DCHP units c) Delta control from wind farms
• Deviations from the planned power exchange (PDEV) between the measured power (PMEAS) and the planned power (PPLAN) with the UCTE system shall be minimized by the power balancing control (PCTRL)
Balance
DEV MEAS PLAN CtrlP P P P
Thermal
DEV MEAS PLAN CtrlP P P P
Thermal DCHP
DEV MEAS PLAN Ctrl CtrlP P P P P
Thermal DCHP HRA
DEV MEAS PLAN Ctrl Ctrl DeltaP P P P P P

Case study wind
68
• Forecast Wind Power with measured wind power and Power deviation of HRA
Simulation Studies:
HRA wind farm
• Measured power from HRA is rescaled to 160 MW to give a kind of worst case scenario
• To keep the power exchange between the western Danish system and the UCTE system at the planned power exchange

Simulation results
69
Thermal
DEV MEAS PLAN CtrlP P P P
Power Plants Active Power (MW) pf
Plant 1 1684 0.25
Plant 2 700 0.25
Plant 3 392 0.25
Plant 4 625 0.25
Power Plants Active Power (MW) pf
Plant 1 1684 0.25
Plant 2 700 0.25
Plant 3 392 0.25
Plant 4 625 0.20
DCHP 400 0.05
Thermal DCHP
DEV MEAS PLAN Ctrl CtrlP P P P P
Control strategy: 1) Control strategy: 2)

Simulation results
70
Power Plants Active Power (MW) pf
Plant 1 1684 0.25
Plant 2 700 0.25
Plant 3 392 0.25
Plant 4 625 0.20
DCHP 400 0.05
HRA wind farm - 0.05
Thermal DCHP WF
DEV MEAS PLAN Ctrl Ctrl deltaP P P P P P
Control strategy: 3)

71
71
Demand side management and Load Characteristics
• As electricity markets are liberalized, if a time-of-use electricity price could be available for consumers, they may decide to modify the profile of their demand to reduce their electricity costs as much as possible.
• The customer driven load control against real time prices may generate unexpected load profiles.

72
72
Electricity Price and Load Characteristics
The spot price of west Demark in the year 2007

73
73
Electricity Price and Load Characteristics
• The consumers may get the electricity price one day before the actual delivery day.
• If the consumers have not made a fixed price contract in the future, the consumers may change their load depend on the electricity price to minimize their energy cost.

74
74
Electricity Price and Load Characteristics
The spot price of west Denmark in a winter weekday and 3 typical different kinds of loads in a winter weekday

75
75
Electricity Price and Load Characteristics

76
76
Electricity Price and Load Characteristics

77
77
Electricity Price and Load Characteristics

78
78
Electricity Price and Load Characteristics
The SCP of different loads at January, 2007

79
79
Electricity Price and Load Characteristics
The original load duration curve (dot line) and the optimal load duration curve (solid line) of residential load in year 2007.

80
80
Electricity Price and Load Characteristics
• The optimal load response to a time-of-use electricity price for demand side management generates different load profiles and provides an opportunity to achieve power loss minimization in distribution systems with high wind power penetrations.

81
81
Electricity Price and Load Characteristics
Distribution system configuration under investigation
The studied distribution system is with high wind power penetrations, where 47.3% of the loads are supplied by wind power in the high wind speed time.
1
2
3
4
5
7
8
9
10
11
12
13
14
15 16
17 18
5P
11P 13P
14P
1wtP
2wtP 3wtP
WT1
WT2 WT3

82
82
Electricity Price and Load Characteristics
Electricity price
Industrial load at bus 5 Residential load at bus 14

83
83
Electricity Price and Load Characteristics
Electricity price
Commercial load at bus 11 Commercial load at bus 13

84
84
Electricity Price and Load Characteristics
The total power loss under the fixed electricity price (asterisk) and the total power loss under the new electricity price (diamond) in the distribution system
The total daily power loss in the distribution system decreases from 1568.0 kW (under the
original fixed electricity price) to 1351.8 kW (under the new optimal electricity price)

85
The energy demand and supply of power
• Conclusion – The structure of the Danish energy system has been detailed shown
• It shows a lot of decentralized production by – Wind turbines – Central combined heat and power plants – Small decentralized combined heat and power plants
– Related problems with Renewable Energy Power • There are fluctuations in the delivered power from
– Wind turbines – Decentralized combined heat and power plants
• The load fluctuates as well • The production from the central power plants are dependent on the needed
heat production – Lead to Electricity surplus
• The situation get worse in the future at a higher wind penetration
– Regarding system demands and power balance it is shown, that the Nordic countries still can keep the power balance themselves