energy contribution of ofmsw (organic fraction of
TRANSCRIPT

energies
Article
Energy Contribution of OFMSW (Organic Fraction ofMunicipal Solid Waste) to Energy-EnvironmentalSustainability in Urban Areas at Small Scale
Umberto Di Matteo 1, Benedetto Nastasi 2,*, Angelo Albo 1 and Davide Astiaso Garcia 3
1 Department of Sustainability Engineering—Università degli Studi Guglielmo Marconi, Via Plinio 44,00193 Rome, Italy; [email protected] (U.D.M.); [email protected] (A.A.)
2 Department of Architectural Engineering & Technology, Environmental & Computational Design Section,TU Delft University of Technology, Julianalaan 134, 2628 BL Delft, The Netherlands
3 Department of Astronautics Electrical Energy Engineering—Sapienza University of Rome,Via Eudossiana 18, 00184 Rome, Italy; [email protected]
* Correspondence: [email protected]
Academic Editor: Xidong WangReceived: 19 October 2016; Accepted: 9 February 2017; Published: 15 February 2017
Abstract: Urban waste management is one of the most challenging issues in energy planning ofmedium and large cities. In addition to the traditional landfill method, many studies are investigatingenergy harvesting from waste, not as a panacea but as a foreseeable solution. Thermo-chemicalconversion to biogas, or even bio-methane under certain conditions, could be an option to addressthis challenge. This study focuses on municipal solid waste conversion to biogas as a local energysupply for the cities. Three urban models and their subdivision into urban areas were identifiedalong with a typical Organic Fraction of Municipal Solid Waste (OFMSW) matrix for each urban area.Then, an energy analysis was carried out to provide an optimization map for an informed choice byurban policy-makers and stakeholders. The results highlighted how the urban context and its usecould affect the opportunity to produce energy from waste or to convert it in fuel. So, in this case,sustainability means waste turning from a problem to a renewable resource.
Keywords: urban sustainability; municipal solid waste; biogas; bioenergy; sensitivity analysis;environmental management; distributed generation; energy planning
1. Introduction
Urban waste is a major current issue for cities moving towards sustainable urban environment.Since landfills are already considered an obsolete answer to this issue from both technical and legalpoints of view [1], energy harvesting from waste represents an attractive solution [2]. As a matter offact, in other contexts landfills are still the suitable solution to face waste disposal and management.A first historical attempt in energy conversion of waste belongs to the post-industrial era whensynthetic gas was produced by gasification processes to feed urban lighting infrastructures. Indeed,the so-called city-gas was stored in gazometers which can be found in most of the big cities aroundEurope and recognized as industrial heritage. Nowadays, minimization of waste production isessential for a more sustainable development of society, but energy harvesting from its flow is themost feasible option to handle the society transition [3] along with the implementation of promisingrenewable technologies [4,5]. Based on technical and legal regulations waste is classified for treatmentor harnessing for energy purposes according to its physical and chemical composition. Recyclablematter such as glass, plastic and paper, if properly preserved, are excluded by specific processes withinthe separate collection approach. Waste is composed of an Organic Fraction (OF) which is the main
Energies 2017, 10, 229; doi:10.3390/en10020229 www.mdpi.com/journal/energies

Energies 2017, 10, 229 2 of 13
responsible of the waste smell and humidity along with sanitary issues. Humidity is considered a keyfactor since it strongly affects the energy conversion to biogas. Nevertheless, OF has a high energyconversion potential since it is source of several hydrocarbons (HC) when treated by a process such asanaerobic digestion. The HC of highest energy content is methane (CH4). Indeed, methanation is acommon word used to name all of the aforementioned treatments. Furthermore, temperature playsa key role in energy conversion process in terms of output matrix, emissions and, last but not least,process energy demands. All those technical considerations should be driven by urban managementlanguage and practices to be easily applied and integrated by policy-makers and city stakeholders [6].New concepts such as territorial energy vocation [7] are applicable to approach the sustainability ofharnessing OF.
Local resources result beneficial in terms of energy sovereignty and economic cost required by newinfrastructures, so distribution and transmission losses along with their impact on the environmentcould be avoided when consumption and production are matched [8]. Moreover, new players such aspro-sumers, excluded from the old centralized generation model, have been introduced by distributedRES deployment calling for a bi-univocal Grid. In this field, EU resolution [9] promoted this newactor, i.e., the PROducer-conSUMER, in the energy context, firstly, as off-grid solution to improveenergy-access for those areas considered not economically profitable by big energy utilities to buildenergy networks, and secondly, to allows a free choice to citizens about their own energy supply [10].Consequently, the link between the availability of local resources and sustainability considerationsmove towards the so-called Zero Kilometer Energy model [11].
Starting from those considerations, the authors investigated on energy contribution of OrganicFraction of Municipal Solid Waste (OFMSW) to urban sustainability so as to harness resources alreadyavailable locally. Knowing that waste is not only an energy-related issue for municipal services, theauthors intended them as a resource for growing energy community for an informed choice. Differenturban morphology models were analyzed along with the composition of OFMSW matrix related toeach zones within them. The biogas potential was associated to each area in terms of its use and theassociated collection method, which are considered crucial elements by the authors.
2. Key Issues
Energy harvesting from waste is widely meant as valorization of exhausted materials so as toimply assessment on energy efficiency values mainly related to the end-use production devices such asboilers or CHP. The authors address the efficiency calculation moving towards a more comprehensiveconcept accounting for the initial energy content of OFMSW and its final use. Nevertheless recyclingcould be the foreseeable solution, and the anaerobic digestion fared well environmentally [12,13].In Figure 1, the distribution of MW sources for anaerobic digestion is shown. Specifically, a very highgrowth potential is envisaged for the anaerobic digestion of OFMSW. Today a world average amountof 50% of MSW is landfilled, and with a content of 30% of OF composting, the current biotechnologyfor OFMSW recycling, is still problematic [14].
Energies 2017, 10, 229 2 of 12
is considered a key factor since it strongly affects the energy conversion to biogas. Nevertheless, OF has a high energy conversion potential since it is source of several hydrocarbons (HC) when treated by a process such as anaerobic digestion. The HC of highest energy content is methane (CH4). Indeed, methanation is a common word used to name all of the aforementioned treatments. Furthermore, temperature plays a key role in energy conversion process in terms of output matrix, emissions and, last but not least, process energy demands. All those technical considerations should be driven by urban management language and practices to be easily applied and integrated by policy-makers and city stakeholders [6]. New concepts such as territorial energy vocation [7] are applicable to approach the sustainability of harnessing OF.
Local resources result beneficial in terms of energy sovereignty and economic cost required by new infrastructures, so distribution and transmission losses along with their impact on the environment could be avoided when consumption and production are matched [8]. Moreover, new players such as pro-sumers, excluded from the old centralized generation model, have been introduced by distributed RES deployment calling for a bi-univocal Grid. In this field, EU resolution [9] promoted this new actor, i.e., the PROducer-conSUMER, in the energy context, firstly, as off-grid solution to improve energy-access for those areas considered not economically profitable by big energy utilities to build energy networks, and secondly, to allows a free choice to citizens about their own energy supply [10]. Consequently, the link between the availability of local resources and sustainability considerations move towards the so-called Zero Kilometer Energy model [11].
Starting from those considerations, the authors investigated on energy contribution of Organic Fraction of Municipal Solid Waste (OFMSW) to urban sustainability so as to harness resources already available locally. Knowing that waste is not only an energy-related issue for municipal services, the authors intended them as a resource for growing energy community for an informed choice. Different urban morphology models were analyzed along with the composition of OFMSW matrix related to each zones within them. The biogas potential was associated to each area in terms of its use and the associated collection method, which are considered crucial elements by the authors.
2. Key Issues
Energy harvesting from waste is widely meant as valorization of exhausted materials so as to imply assessment on energy efficiency values mainly related to the end-use production devices such as boilers or CHP. The authors address the efficiency calculation moving towards a more comprehensive concept accounting for the initial energy content of OFMSW and its final use. Nevertheless recycling could be the foreseeable solution, and the anaerobic digestion fared well environmentally [12,13]. In Figure 1, the distribution of MW sources for anaerobic digestion is shown. Specifically, a very high growth potential is envisaged for the anaerobic digestion of OFMSW. Today a world average amount of 50% of MSW is landfilled, and with a content of 30% of OF composting, the current biotechnology for OFMSW recycling, is still problematic [14].
Figure 1. Distribution of waste sources for anaerobic digestion [15]. Figure 1. Distribution of waste sources for anaerobic digestion [15].

Energies 2017, 10, 229 3 of 13
A preliminary review of literature indicated that about 20%–30% of the energy produced byanaerobically digesting waste is consumed by the process itself for big power plants and higherpercentage values are forecasted for the small-scale ones [16].
Missing information was found for this latter scale in terms of studies. Indeed, laboratory plantsizes comparable to the waste production of a range from one to ten dwellings are available inliterature [17].
The authors’ intention is to investigate the preliminary energy gains achievable from small scalebiogas treatment and use plants to increase sustainability level of existing urban energy systems whereto integrate local energy from a not harnessed resource, i.e., waste.
In order to carry out an energy analysis, theoretical production and substrate composition shouldbe delved deeper. The theoretical yield of biogas production can be calculated by the so-called Buswellequation taking into account the chemical composition of feed-stocks [18,19], as shown in Equation (1):
Bo,th =
(a2 + b
8 −c4
)22.4
12a + b + 16c
[Nm3CH4
kgVS
](1)
To do so, the general chemical equation of the reaction is reported below as Equation (2):
CaHbOcNdSe +14 (4a− b− 2c + 3d + 2e)H2O→ 1
8 (4a− b + 2c + 3d + 2e)CO2 +18 (4a + b− 2c− 3d− 2e)CH4
+dNH3 + eH2S(2)
Starting from that, the ratio between CH4 and CO2 is affected by the oxidation state of the carbonfraction in the material. To sum up, a higher reduction grade of the carbon content corresponds to ahigher methane production, as shown in Table 1.
Table 1. Biogas composition calculated by the oxidation state method.
Substrate from Waste Oxidation State % Methane % Carbon Dioxide
Paper −0.049 51.0 49.0Yard −0.089 51.5 48.5
Wood −0.138 52.1 47.9Food −0.548 57.1 42.9
Furthermore, in those materials, the proportion of carbohydrates, proteins and lipids affects thebiogas yield. The lipid contribution entails higher volumes of biogas per feed-stock unit of massthan both carbohydrate and protein ones. The microorganisms used in anaerobic digestion processare sensitive to the substrate chemical composition and, specifically, to its carbon to nitrogen (C/N)ratio [20]. Typical C/N ratio values are reported in Table 2.
Table 2. C/N ratio of familiar biodegradable materials.
Household Waste C/N Ratio
Kitchen waste 25–29Fruits and vegetable waste 7–35
Food waste 3–17
Notwithstanding, the actual biogas production from anaerobic digestion is considerably lowerthan the theoretical maximum value. Data related to pure substrate is present in a previouspublication [21] but, it is expressed per mol, as reported in Table 3.
Energies 2017, 10, 229 4 of 13
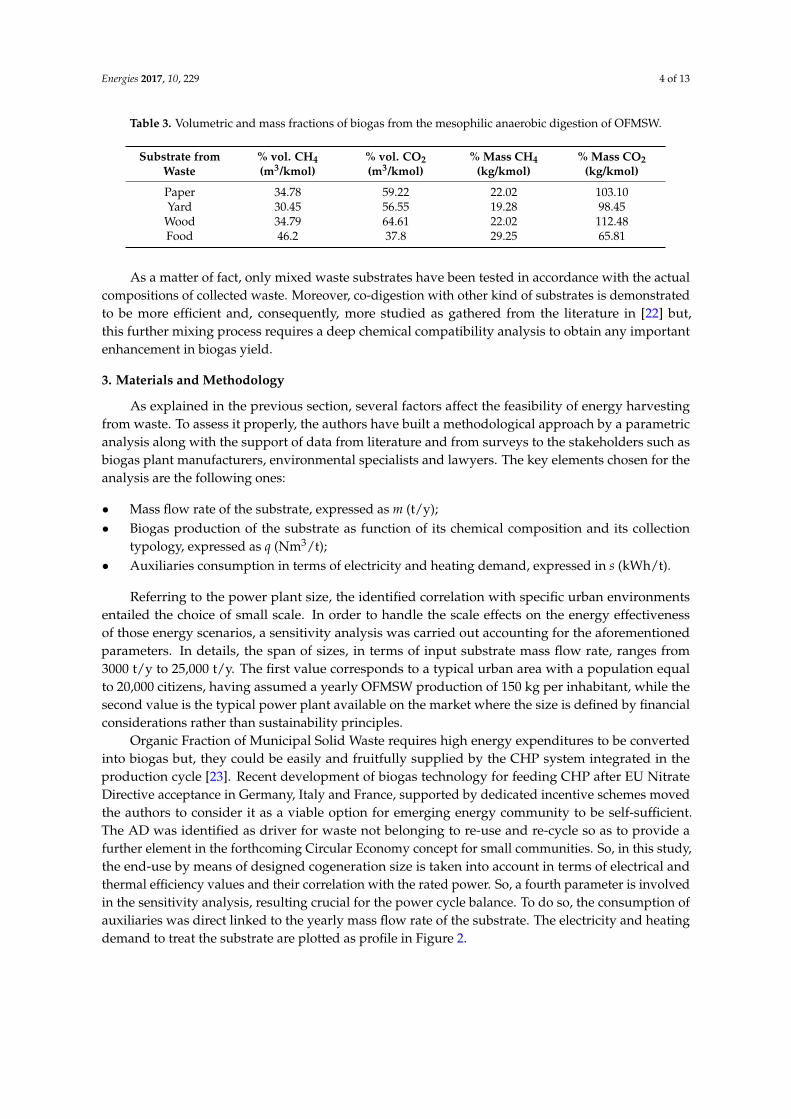
Table 3. Volumetric and mass fractions of biogas from the mesophilic anaerobic digestion of OFMSW.
Substrate fromWaste
% vol. CH4(m3/kmol)
% vol. CO2(m3/kmol)
% Mass CH4(kg/kmol)
% Mass CO2(kg/kmol)
Paper 34.78 59.22 22.02 103.10Yard 30.45 56.55 19.28 98.45
Wood 34.79 64.61 22.02 112.48Food 46.2 37.8 29.25 65.81
As a matter of fact, only mixed waste substrates have been tested in accordance with the actualcompositions of collected waste. Moreover, co-digestion with other kind of substrates is demonstratedto be more efficient and, consequently, more studied as gathered from the literature in [22] but,this further mixing process requires a deep chemical compatibility analysis to obtain any importantenhancement in biogas yield.
3. Materials and Methodology
As explained in the previous section, several factors affect the feasibility of energy harvestingfrom waste. To assess it properly, the authors have built a methodological approach by a parametricanalysis along with the support of data from literature and from surveys to the stakeholders such asbiogas plant manufacturers, environmental specialists and lawyers. The key elements chosen for theanalysis are the following ones:
• Mass flow rate of the substrate, expressed as m (t/y);• Biogas production of the substrate as function of its chemical composition and its collection
typology, expressed as q (Nm3/t);• Auxiliaries consumption in terms of electricity and heating demand, expressed in s (kWh/t).
Referring to the power plant size, the identified correlation with specific urban environmentsentailed the choice of small scale. In order to handle the scale effects on the energy effectivenessof those energy scenarios, a sensitivity analysis was carried out accounting for the aforementionedparameters. In details, the span of sizes, in terms of input substrate mass flow rate, ranges from3000 t/y to 25,000 t/y. The first value corresponds to a typical urban area with a population equalto 20,000 citizens, having assumed a yearly OFMSW production of 150 kg per inhabitant, while thesecond value is the typical power plant available on the market where the size is defined by financialconsiderations rather than sustainability principles.
Organic Fraction of Municipal Solid Waste requires high energy expenditures to be convertedinto biogas but, they could be easily and fruitfully supplied by the CHP system integrated in theproduction cycle [23]. Recent development of biogas technology for feeding CHP after EU NitrateDirective acceptance in Germany, Italy and France, supported by dedicated incentive schemes movedthe authors to consider it as a viable option for emerging energy community to be self-sufficient.The AD was identified as driver for waste not belonging to re-use and re-cycle so as to provide afurther element in the forthcoming Circular Economy concept for small communities. So, in this study,the end-use by means of designed cogeneration size is taken into account in terms of electrical andthermal efficiency values and their correlation with the rated power. So, a fourth parameter is involvedin the sensitivity analysis, resulting crucial for the power cycle balance. To do so, the consumption ofauxiliaries was direct linked to the yearly mass flow rate of the substrate. The electricity and heatingdemand to treat the substrate are plotted as profile in Figure 2.

Energies 2017, 10, 229 5 of 13
Having accounted for data available in [24–26] related to the electricity demand and in [26–28]related to heating one, two regression curves were built to carry out the subsequent energy analysis.Then, the energy efficiency of all the conversion process was defined as:
ηplant =Enet
Egross(3)
where:
• Enet is the useful energy output from the cycle on annual base;• Egross is the gross energy content of the produced biogas volume.Energies 2017, 10, 229 5 of 12
Figure 2. Incidence of auxiliaries’ consumption per biogas production plant size.
Moreover, in Equations (4) and (5) Eaux is the auxiliaries’ electrical and thermal energy demand. While, the specific thermal energy production Φ and the cycle inefficiency were defined: Φ = kWh
(4)
ζ = (5)
Energy balance is affected by the biogas production plant layout, especially by the choice of the digester technology. In addition, substrate chemical composition represents the key point. The authors estimated from survey in industry stakeholders the values of digester performance within the well-established technologies. Moreover, they considered ten different substrates taking into account for each one, its origin in terms of urban area morphology, and its proven biogas production, as shown in Table 4.
Table 4. Substrates chosen from the authors along with their biogas production per unit of mass.
Substrate Collection Mode q (m3/t) References M1 Mechanically Sorted 119.0 [29] M2 Mechanically Sorted 123.0 [25] M3 Mechanically Sorted 126.7 [30] M4 Mechanically Sorted 128.0 [24] M5 Mechanically Sorted 140.0 [26] M6 Hand Sorted 239.2 [31] M7 Mechanically Sorted 242.6 [32] M8 Separated Sorted 396.8 [30] M9 Source Sorted 474.8 [30] M10 Source Sorted 556.4 [33]
It is remarkable that direct collection of waste in the place of its production preserves the highest biogas potential and its accidental emissions [34,35], while the mechanical collection entails longer periods of waste storage and a subsequent reduction of available energy. Curbside residential rubbish pick-up in residential area shows also this time dependence issue. The lowest values are representative of waste collection without a separation procedure so that further effort is required at the treatment plant in the landfill and the substrate is of low quality. Policy instruments are available
Figure 2. Incidence of auxiliaries’ consumption per biogas production plant size.
Moreover, in Equations (4) and (5) Eaux is the auxiliaries’ electrical and thermal energy demand.While, the specific thermal energy production Φ and the cycle inefficiency ζ were defined:
Φ =Enet
m
[kWh
t
](4)
ζ =Eaux
Egross(5)
Energy balance is affected by the biogas production plant layout, especially by the choiceof the digester technology. In addition, substrate chemical composition represents the key point.The authors estimated from survey in industry stakeholders the values of digester performance withinthe well-established technologies. Moreover, they considered ten different substrates taking intoaccount for each one, its origin in terms of urban area morphology, and its proven biogas production,as shown in Table 4.

Energies 2017, 10, 229 6 of 13
Table 4. Substrates chosen from the authors along with their biogas production per unit of mass.
Substrate Collection Mode q (m3/t) References
M1 Mechanically Sorted 119.0 [29]M2 Mechanically Sorted 123.0 [25]M3 Mechanically Sorted 126.7 [30]M4 Mechanically Sorted 128.0 [24]M5 Mechanically Sorted 140.0 [26]M6 Hand Sorted 239.2 [31]M7 Mechanically Sorted 242.6 [32]M8 Separated Sorted 396.8 [30]M9 Source Sorted 474.8 [30]
M10 Source Sorted 556.4 [33]
It is remarkable that direct collection of waste in the place of its production preserves the highestbiogas potential and its accidental emissions [34,35], while the mechanical collection entails longerperiods of waste storage and a subsequent reduction of available energy. Curbside residential rubbishpick-up in residential area shows also this time dependence issue. The lowest values are representativeof waste collection without a separation procedure so that further effort is required at the treatmentplant in the landfill and the substrate is of low quality. Policy instruments are available to promotethe most effective collection and their use close to the production sites [36] as well as the LCOE whenassociated to new renewable solutions [37] or hybridized with conventional cycles [38].
4. Urban Fabric and Biogas Potential
Searching for local solutions can address urban sustainability, especially by avoiding theconstruction of new infrastructures and transportation as well as the associated environmentaland economic costs. Furthermore, solutions suitable for existing urban environments lead to theidentification of the proper scale of intervention. Indeed, in the field of waste-to-energy, big size entailsstrict environmental and logistic assessment for making the plant and its chain fit in the eco-systemsand even in an existing city. On the other hand, the small-scale does not appear profitable even ifsupported by feed-in-tariff since the energy paradigm goes for centralized generation. Therefore, toinvestigate on the energy effectiveness of small scale solutions and their fit in urban environments,the authors focused on the link between urban context and the production of locally available waste.To do so, the first step is finding adequate data of well-proven technologies and verified biogas yieldfrom different OFMSW substrates, as shown in the previous section. The original work consists inconnecting the substrate to its “producer”, highlighting its function and its location within the urbanenvironment. A key parameter chosen by the authors is the density of the urban tissue. As depicted inFigure 3, it corresponds to a specific urban morphology along with precise intended use of the builtenvironment and spatial distribution.
Energies 2017, 10, 229 6 of 12
to promote the most effective collection and their use close to the production sites [36] as well as the LCOE when associated to new renewable solutions [37] or hybridized with conventional cycles [38].
4. Urban Fabric and Biogas Potential
Searching for local solutions can address urban sustainability, especially by avoiding the construction of new infrastructures and transportation as well as the associated environmental and economic costs. Furthermore, solutions suitable for existing urban environments lead to the identification of the proper scale of intervention. Indeed, in the field of waste-to-energy, big size entails strict environmental and logistic assessment for making the plant and its chain fit in the eco-systems and even in an existing city. On the other hand, the small-scale does not appear profitable even if supported by feed-in-tariff since the energy paradigm goes for centralized generation. Therefore, to investigate on the energy effectiveness of small scale solutions and their fit in urban environments, the authors focused on the link between urban context and the production of locally available waste. To do so, the first step is finding adequate data of well-proven technologies and verified biogas yield from different OFMSW substrates, as shown in the previous section. The original work consists in connecting the substrate to its “producer”, highlighting its function and its location within the urban environment. A key parameter chosen by the authors is the density of the urban tissue. As depicted in Figure 3, it corresponds to a specific urban morphology along with precise intended use of the built environment and spatial distribution.
Figure 3. Urban fabric and historic intended use for waste quality assessment.
Urban density is a feature connected to the urbanization phenomenon which involved the considered area. The time and the building typology associated to the development of a specific area provide crucial details about its current use and its relation with the energy sector. For instance, it is already well-established in Urban Heat Island mitigation [39,40], and it could be suitable for estimating the potential of its waste production. For instance, in current historic and dense city centres, the gentrification process and ICT evolution have provoked the substitution of function from dwellings to prestigious offices, so to determine a variation on quality and quantity of the produced waste substrate. At the same time, mobility space designed for pedestrians rather than vehicles entails a difficult handling process to collect the waste. In this way, only high density areas make the daily waste collection meaningful since it is expensive in terms of time as well as economics.
An opposite situation is related to the high-rise buildings built after the Second World War to meet the increasing demand for housing. The high concentration of users provides the opportunity to design a few collection points and to go through the new-built mobility connections economically. The other side of the coin consists in the quality of residential waste and its way of collection and separation. Indeed, mono-functional areas such as big office district already cope with the waste issues in order to optimize the process at least in terms of expenses. While, for residential ones, the
Figure 3. Urban fabric and historic intended use for waste quality assessment.

Energies 2017, 10, 229 7 of 13
Urban density is a feature connected to the urbanization phenomenon which involved theconsidered area. The time and the building typology associated to the development of a specificarea provide crucial details about its current use and its relation with the energy sector. For instance,it is already well-established in Urban Heat Island mitigation [39,40], and it could be suitable forestimating the potential of its waste production. For instance, in current historic and dense city centres,the gentrification process and ICT evolution have provoked the substitution of function from dwellingsto prestigious offices, so to determine a variation on quality and quantity of the produced wastesubstrate. At the same time, mobility space designed for pedestrians rather than vehicles entails adifficult handling process to collect the waste. In this way, only high density areas make the dailywaste collection meaningful since it is expensive in terms of time as well as economics.
An opposite situation is related to the high-rise buildings built after the Second World War tomeet the increasing demand for housing. The high concentration of users provides the opportunityto design a few collection points and to go through the new-built mobility connections economically.The other side of the coin consists in the quality of residential waste and its way of collection andseparation. Indeed, mono-functional areas such as big office district already cope with the waste issuesin order to optimize the process at least in terms of expenses. While, for residential ones, the inhabitantdoes not take care of waste as an economic issue but as a sanitary problem to solve practically alongwith the avoidance of smells and used space [41].
Hence, from the analysis of verified substrates and associated biogas yield the authors identifiedvalues representative of certain urban areas to understand a holistic feasibility of the small scalewaste-to-biogas facilities and its real contribution to local urban sustainability [42].
Four Samples of Urban Substrates
As previously reported from Table 4 in Section 3, ten substrates were selected from the literature torepresent typical urban environment values. The code M and the number identify a specific conditionalong with the intended use of the waste producer and its location in urban fabricalong the typologyof this latter. Here, four samples are described to familiarize readers with the mentioned values.To be more clear, the minimum and the maximum biogas yield values are considered along with twomedium values, which are M1, M10, M5 and M6, respectively.
The code M1 corresponds to a typical waste coming from low-rise dwellings, collected twiceper weeks in dedicated boxes and mechanically sorted in the treatment plant after its collection.The energy potential value is low due to the reduced HC content caused by long exposure to airand consequent degradation. Furthermore, the mechanically separation starts from a low degree ofpurity of the substrates since the collection boxes are not typically protected against the introductionof non-recyclable materials as well as the incorrect sealing with respect to the weather agents.
As regards M10, it comes from the canteens of office districts which collect the waste daily and isobliged to follow strict regulations in handling sanitary dangerous goods such as waste. Moreover,the precise definition of the quality is possible from the scheduled menu as well as the supply chaindocuments available from the environmental quality management systems. The size of a canteen,profitable after a certain amount of users, allows it to feed daily a small-scale biogas plant by providingcontrolled and pure food wastes.
In the range between those extreme values, it is possible to find many different values andassociated urban tissues. For instance M5 and M6 are quite similar values but they are related todifferent contexts as well as collection methods. This latter element is strongly affected by the urbanfabric. For instance, the size of the streets and the accessibility to the buildings, the shape of the urbanmodel as a grid or a linear structure determine the typology of collection, its time per week and,subsequently, the final biogas yield of the corresponding substrate.
Referring to M5, it is related to dense housing areas such as the ones built during the 1960s and1970s across Europe. The high concentration of the production provides favourable conditions for thecollection but the social conflicts and issues around citizenship information reduce the quality of the

Energies 2017, 10, 229 8 of 13
collection. In many case, the waste must be further separated by a machine at the treatment plant.This process leads to further energy and economic costs so as to reduce the chance for small-scalepower plant.
Finally, M6 shows a similar value to M5. It comes from a wise hand-sorted collection in newmedium-rise urban areas already built under the advertisement of sustainable buildings and dedicatedmostly to high-income people. That means new facilities to handle all the waste collection chain suchas pumped air transport or automatic bin accessible by ICT supports by citizens ready for future SmartCity. Then, healthier lifestyle associated to those people entails high degree of purity of the substratesalong with higher methanation potential.
To sum up, the urban environment and its detailed analysis could provide high-level data toestimate correctly the potential of waste-to-energy, especially for those scales currently not competitiveon the market. Interesting outcomes derive from the relation between mobility infrastructures andtheir design with the location of the waste producers in the area. This is the reason why new urbansettlements are going to be designed with the road as infrastructure facility for energy, water andwaste management.
The concept of peer grid which is the key concept of the decentralized generation could be foundin the urban fabric to make the existing built environment suitable for the transition towards futuresustainable and smart cities.
5. Results and Discussion
At the end of the analysis of relation between urban environment and quality of waste, it isremarkable that the chemical composition and subsequent biogas potential are variable depending oncollection mode of waste and urban area of origin. Anyway, from literature data it results that q rangesfrom about 120 to 560 m3/t. To account for this wide range of potential, the influence of m and q on theenergy balance of the biogas production plant was analyzed. The conversion efficiency ηplant trendswith changes in substrate yearly flow rate are depicted in Figure 4 for each waste typology.
The graph can be divided by two values, i.e., 6000 and 15,000 t/y, in three coloured areas. The firstarea, highlighted in red, denotes the size where the initial energy expenses are huge. The trend ofsubstrates lines has a high slope and the conversion efficiency values are low. Then, the second area inblue shows a lower slope, especially for the substrates of lowest biogas potential such as q values up to242.6 m3/t. Finally, in the green area, the changes in flow rates affect little ηplant.
Different behaviour can be noticed for the energy net production profiles shown in Figure 5.Specific net energy is reported as a function of substrate yearly flow rate for each waste. It is noteworthythat in the same ranges of the previous graph, there are changes in line geometry but, the main outcomeis the energy net independence of biogas production plant size from the value equal to 10,000 t/y.As aforementioned, the changes are remarkable for low potential substrates while the influence of m isnegligible on high potential ones, so the link between urban fabric and foreseeable local waste-to-energywould allow to identify the areas suitable for this energy process and to account for it as a furtherelement for improving its sustainability. Scale becomes the crucial challenge to associate the feasiblesolution to the proper environment.

Energies 2017, 10, 229 9 of 13
Energies 2017, 10, 229 8 of 12
5. Results and Discussion
At the end of the analysis of relation between urban environment and quality of waste, it is remarkable that the chemical composition and subsequent biogas potential are variable depending on collection mode of waste and urban area of origin. Anyway, from literature data it results that q ranges from about 120 to 560 m3/t. To account for this wide range of potential, the influence of m and q on the energy balance of the biogas production plant was analyzed. The conversion efficiency ηplant trends with changes in substrate yearly flow rate are depicted in Figure 4 for each waste typology.
Figure 4. Conversion efficiency of biogas production plant with changes in yearly flow rate and substrate typology.
The graph can be divided by two values, i.e., 6000 and 15,000 t/y, in three coloured areas. The first area, highlighted in red, denotes the size where the initial energy expenses are huge. The trend of substrates lines has a high slope and the conversion efficiency values are low. Then, the second area in blue shows a lower slope, especially for the substrates of lowest biogas potential such as q values up to 242.6 m3/t. Finally, in the green area, the changes in flow rates affect little ηplant.
Different behaviour can be noticed for the energy net production profiles shown in Figure 5. Specific net energy is reported as a function of substrate yearly flow rate for each waste. It is noteworthy that in the same ranges of the previous graph, there are changes in line geometry but, the main outcome is the energy net independence of biogas production plant size from the value equal to 10,000 t/y. As aforementioned, the changes are remarkable for low potential substrates while the influence of m is negligible on high potential ones, so the link between urban fabric and foreseeable local waste-to-energy would allow to identify the areas suitable for this energy process and to account for it as a further element for improving its sustainability. Scale becomes the crucial challenge to associate the feasible solution to the proper environment.
Figure 4. Conversion efficiency of biogas production plant with changes in yearly flow rate andsubstrate typology.
Energies 2017, 10, 229 9 of 12
Figure 5. Net energy production of biogas production plant with changes in yearly flow rate and substrate typology.
Referring to the inefficiency of the different substrate + treatment + energy production layouts, it is useful to show the relationship between them and the system conversion efficiency so as to have a comprehensive view. Four substrates were chosen to represent all the variety shown in Table 4. The lowest and the highest biogas production values, i.e., M1 and M10, were considered together with two intermediate values, i.e., M5 and M6.
The threshold between the curves of system inefficiency and conversion efficiency represents the starting point of energy profitability of the chosen substrate, i.e., the minimum required yearly mass flow rate. The associated CHP plant size can be identified by calculation.
As depicted in Figure 6, the curves η and of the substrates M1 and M6 have a common point while the other ones do not. It implies that for low-quality substrates the small scale is not a feasible solution in terms of energy analysis. All the curves have an asymptotic trend moving towards the highest yearly mass flow rate.
This demonstrates the current interest of market stakeholders to invest in big size power plant. The best quality substrate shows high inefficiency values until m equal to 10,000 t/y. Other pathway such as further treatment to produce bio-methane as suggested in [43], could involve only high m values and high productive substrates to maintain an energy convenience. Then, other research shows foreseeable scenarios where renewable hydrogen storage systems interact with renewable electricity excess and biomass gasification plants to build future sustainable networks [44].
Figure 5. Net energy production of biogas production plant with changes in yearly flow rate andsubstrate typology.

Energies 2017, 10, 229 10 of 13
Referring to the inefficiency of the different substrate + treatment + energy production layouts,it is useful to show the relationship between them and the system conversion efficiency so as to havea comprehensive view. Four substrates were chosen to represent all the variety shown in Table 4.The lowest and the highest biogas production values, i.e., M1 and M10, were considered together withtwo intermediate values, i.e., M5 and M6.
The threshold between the curves of system inefficiency and conversion efficiency represents thestarting point of energy profitability of the chosen substrate, i.e., the minimum required yearly massflow rate. The associated CHP plant size can be identified by calculation.
As depicted in Figure 6, the curves η and ζ of the substrates M1 and M6 have a common pointwhile the other ones do not. It implies that for low-quality substrates the small scale is not a feasiblesolution in terms of energy analysis. All the curves have an asymptotic trend moving towards thehighest yearly mass flow rate.Energies 2017, 10, 229 10 of 12
Figure 6. Efficiency and Inefficiency with changes in yearly flow rate and substrate typology.
6. Conclusions
Energy harvesting from waste is a feasible option to handle the societal challenge to move towards more sustainable energy pathways. The study presented an energy analysis as a function of substrates available on the urban areas, their potential, their yearly mass flow rate and the associated power plant size. The methodology elaborated by the authors allows to manage this issue at small scale, usually forgotten by the market but useful to achieve energy sovereignty of local communities. The link between urban areas and their potential of building biogas facility and supply can help policy-makers and energy planner for preliminary evaluation of the feasibility of that technology in a certain area.
The urban density, taking into account the features of the analyzed urban area, plays a key role in determining the waste-to-energy opportunity. The study demonstrates the convenience in terms of system efficiency of specific combinations of the aforementioned parameters and it was a first attempt to order biogas data available in literature and to make it ready for use for local energy planners. The results promote the deployment of medium-size biogas power plant close to the urban waste production, pinpointing the nature of those areas where it is energy effective.
Acknowledgments: The authors appreciated with gratitude all the involved industrial stakeholders.
Author Contributions: Umberto Di Matteo supervised the paper preparation; Benedetto Nastasi conceived and designed the study and wrote the paper; Angelo Albo made the calculations; Davide Astiaso Garcia contributed in reporting from the industrial stakeholders.
Conflicts of Interest: The authors declare no conflict of interest.
References
1. European Parliament. Decision No. 1386/2013/EU of the European Parliament and of the Council on a General Union Environment Action Programme to 2020 ‘Living well, within the limits of our planet’. Off. J. Eur. Union 2013, L354, 171–200.
2. Chaliki, P.; Psomopoulos, C.S.; Themelis, N.J. WTE plants installed in European cities: A review of success stories. Manag. Environ. Qual. Inte. J. 2015, 27, 606–620.
Figure 6. Efficiency and Inefficiency with changes in yearly flow rate and substrate typology.
This demonstrates the current interest of market stakeholders to invest in big size power plant.The best quality substrate shows high inefficiency values until m equal to 10,000 t/y. Other pathwaysuch as further treatment to produce bio-methane as suggested in [43], could involve only high mvalues and high productive substrates to maintain an energy convenience. Then, other research showsforeseeable scenarios where renewable hydrogen storage systems interact with renewable electricityexcess and biomass gasification plants to build future sustainable networks [44].
6. Conclusions
Energy harvesting from waste is a feasible option to handle the societal challenge to move towardsmore sustainable energy pathways. The study presented an energy analysis as a function of substratesavailable on the urban areas, their potential, their yearly mass flow rate and the associated power plantsize. The methodology elaborated by the authors allows to manage this issue at small scale, usuallyforgotten by the market but useful to achieve energy sovereignty of local communities. The link

Energies 2017, 10, 229 11 of 13
between urban areas and their potential of building biogas facility and supply can help policy-makersand energy planner for preliminary evaluation of the feasibility of that technology in a certain area.
The urban density, taking into account the features of the analyzed urban area, plays a key role indetermining the waste-to-energy opportunity. The study demonstrates the convenience in terms ofsystem efficiency of specific combinations of the aforementioned parameters and it was a first attemptto order biogas data available in literature and to make it ready for use for local energy planners.The results promote the deployment of medium-size biogas power plant close to the urban wasteproduction, pinpointing the nature of those areas where it is energy effective.
Acknowledgments: The authors appreciated with gratitude all the involved industrial stakeholders.
Author Contributions: Umberto Di Matteo supervised the paper preparation; Benedetto Nastasi conceived anddesigned the study and wrote the paper; Angelo Albo made the calculations; Davide Astiaso Garcia contributedin reporting from the industrial stakeholders.
Conflicts of Interest: The authors declare no conflict of interest.
References
1. European Parliament. Decision No. 1386/2013/EU of the European Parliament and of the Council on aGeneral Union Environment Action Programme to 2020 ‘Living well, within the limits of our planet’. Off. J.Eur. Union 2013, L354, 171–200.
2. Chaliki, P.; Psomopoulos, C.S.; Themelis, N.J. WTE plants installed in European cities: A review of successstories. Manag. Environ. Qual. Inte. J. 2015, 27, 606–620. [CrossRef]
3. Wang, N.-Y.; Shih, C.-H.; Chiueh, P.-T.; Huang, Y.F. Environmental Effects of Sewage Sludge Carbonizationand Other Treatment Alternatives. Energies 2013, 6, 871–883. [CrossRef]
4. Salata, F.; Golasi, I.; Domestico, U.; Banditelli, M.; Lo Basso, G.; Nastasi, B.; de Lieto Vollaro, A. Headingtowards the nZEB through CHP + HP systems. A comparison between retrofit solutions able to increasethe energy performance for the heating and domestic hot water production in residential buildings.Energy Convers. Manag. 2017, in press. [CrossRef]
5. Rovense, F.; Amelio, M.; Ferraro, V.; Scornaienchi, V. Analysis of a Concentrating Solar Power TowerOperating with a Closed Joule Brayton Cycle and Thermal Storage. Int. J. Heat Technol. 2016, 34, 485–490.[CrossRef]
6. Rossi, F.; Castellani, B.; Presciutti, A.; Morini, E.; Anderini, E.; Filipponi, M.; Nicolini, A. Experimentalevaluation of urban heat island mitigation potential of retro-reflective pavement in urban canyons.Energy Build. 2016, 12, 340–352. [CrossRef]
7. Nastasi, B.; Di Matteo, U. Solar energy technologies in Sustainable Energy Action Plans of Italian big cities.Energy Procedia 2016, 101, 1064–1071. [CrossRef]
8. Cicatiello, C.; Franco, S.; Pancino, B.; Blasi, E. The value of food waste: An exploratory study on retailing.J. Retail. Consum. Serv. 2016, 30, 96–104. [CrossRef]
9. European Parliament Resolution of 21 May 2013 Current Challenges and Opportunities for Renewable Energyin the European Internal Energy Market (2012/2259(INI)). Available online: http://www.europarl.europa.eu/sides/getDoc.do?pubRef=-//EP//NONSGML+TA+P7-TA-2013-0201+0+DOC+PDF+V0//EN(accessed on 22 September 2016).
10. Antizar-Ladislao, B.; Turrion-Gomez, J.L. Decentralized Energy from Waste Systems. Energies 2010, 3,194–205. [CrossRef]
11. De Santoli, L.; Mancini, F.; Nastasi, B.; Piergrossi, V. Building integrated bioenergy production (BIBP):Economic sustainability analysis of Bari airport CHP (combined heat and power) upgrade fueled withbioenergy from short chain. Renew. Energy 2015, 81, 499–508. [CrossRef]
12. Arafat, H.A.; Jijakli, K.; Ahsan, A. Environmental performance and energy recovery potential of five processesfor municipal solid waste treatment. J. Clean. Prod. 2015, 105, 233–240. [CrossRef]
13. Passeri, N.; Blasi, E.; Franco, S.; Martella, A.; Pancino, B.; Cicatiello, C. The environmental sustainability ofnational cropping systems: From assessment to policy impact evaluation. Land Use Policy 2016, 57, 305–312.[CrossRef]

Energies 2017, 10, 229 12 of 13
14. Mata-Alvarez, J.; Macé, S.; Llabrés, P. Anaerobic digestion of organic solid wastes. An overview of researchachievements and perspectives. Bioresour. Technol. 2000, 74, 3–16. [CrossRef]
15. Divya, D.; Gopinath, P.; Christy, M. A review on current aspects and diverse prospects for enhancing biogasproduction in sustainable means. Renew. Sustain. Energy Rev. 2015, 42, 690–699. [CrossRef]
16. RIS International Feasibility of Generating Green Power through Anaerobic Digestion of Garden Refusefrom the Sacramento Area. Feasibility Study Sacramento Municipal Utility District, Sacramento, CA,USA. 2005. Available online: https://nerc.org/documents/sacramento_feasibility_study.pdf (accessed on22 September 2016).
17. Andreottola, G.; Ragazzi, M.; Foladori, P.; Villa, R.; Langone, M.; Rada, E.C. The unit intregrated approch forOFMSW treatment. UPB Sci. Bull. 2012, 74, 19–26.
18. Symons, G.E.; Buswell, A.M. The methane fermentation of carbohydrates. J. Am. Chem. Soc. 1933, 55,2028–2036. [CrossRef]
19. Buswell, A.M.; Mueller, H.F. Mechanism of methane fermentation. Ind. Eng. Chem. 1955, 44, 550–552.[CrossRef]
20. Chen, Y.; Cheng, J.J.; Creamer, K.S. Inhibition of anaerobic digestion process: A review. Bioresour. Technol.2008, 99, 4044–4064. [CrossRef] [PubMed]
21. Nallathambi Gunaseelan, V. Anaerobic digestion of biomass for methane production: A review.Biomass Bioenergy 1997, 13, 83–114. [CrossRef]
22. Mao, C.; Feng, Y.; Wang, X.; Ren, G. Review on research achievements of biogas from anaerobic digestion.Renew. Sustain. Energy Rev. 2015, 45, 540–555. [CrossRef]
23. Ryu, C.; Shin, D. Combined Heat and Power from Municipal Solid Waste: Current Status and Issues in SouthKorea. Energies 2013, 6, 45–57. [CrossRef]
24. Murphy, J.D.; McCarthy, K. The optimal production of biogas for use as a transport fuel in Ireland.Renew. Energy 2005, 30, 2111–2127. [CrossRef]
25. Watkins, P.; McKendry, P. Assessment of waste derived gases as a renewable energy source—Part 1.Sustain. Energy Technol. Assess. 2015, 10, 102–113. [CrossRef]
26. Reichhalter, H.; Bozzo, A.; Dal Savio, S.; Guerra, T. Analisi Energetica, Ambientale ed Economica di Impianti aBiogas in Provincia di Bolzano. 2011. Available online: http://www.provincia.bz.it/agricoltura/download/Bilancio_ecologico_di_impianti_a_biogas.pdf (accessed on 22 September 2016).
27. Berglund, M.; Börjesson, P. Assessment of energy performance in the life-cycle of biogas production.Biomass Bioenergy 2006, 30, 254–266. [CrossRef]
28. Banks, C.J.; Chesshire, M.; Heaven, S.; Arnold, R. Anaerobic digestion of source-segregated domesticfood waste: Performance assessment by mass and energy balance. Bioresour. Technol. 2011, 102, 612–620.[CrossRef] [PubMed]
29. De Baere, L.; Verstraete, W. High-rate anaerobic composting with biogas recovery. BioCycle 1984, 25, 30–31.30. Mata-Alvarez, J.; Cecchi, F.; Pavan, P.; Llabres, P. The performances of digesters treating the organic fraction
of municipal solid wastes differently sorted. Biol. Wastes 1990, 33, 181–199. [CrossRef]31. Owens, J.M.; Chynoweth, D.P. Biochemical methane potential of Municipality Solid Waste (MSW)
components. Water Sci. Technol. 1993, 27, 1–14.32. Valorga. Waste recovery as a source of methane and fertilizer. The Valorga process. In Proceedings of
the 2nd Annual International Symposium on Industrial Resource Management, Philadelphia, PA, USA,17–20 February 1985.
33. Viturtia, A.M.; Mata-Alvarez, J.; Cecchi, F.; Fazzini, G. Two-phase anaerobic digestion of a mixture of fruitand vegetable wastes. Biol. Wastes 1989, 29, 189–199. [CrossRef]
34. Castellani, B.; Morini, E.; Filipponi, M.; Nicolini, A.; Palombo, M.; Cotana, F.; Rossi, F. Comparative analysisof monitoring devices for particulate content in exhaust gases. Sustainability 2014, 6, 4287–4307. [CrossRef]
35. Lo Basso, G.; Nastasi, B.; Astiaso Garcia, D.; Cumo, F. How to handle the Hydrogen enriched Natural Gasblends in combustion efficiency measurement procedure of conventional and condensing boilers. Energy2017, in press. [CrossRef]
36. Finnveden, G.; Ekvall, T.; Arushanyan, Y.; Bisaillon, M.; Henriksson, G.; Gunnarsson Östling, U.;Söderman, M.L.; Sahlin, J.; Stenmarck, Å.; Sundberg, J.; et al. Policy Instruments towards a Sustainable WasteManagement. Sustainability 2013, 5, 841–881. [CrossRef]

Energies 2017, 10, 229 13 of 13
37. Lo Zupone, G.; Amelio, M.; Barbarelli, S.; Florio, G.; Scornaienchi, N.M.; Cutrupi, A. Lcoe evaluationfor a tidal kinetic self balancing turbine: Case study and comparison. Appl. Energy 2017, 185, 1292–1302.[CrossRef]
38. Rovense, F. A Case of Study of a Concentrating Solar Power Plant with Unfired Joule-Brayton Cycle.Energy Proc. 2015, 82, 978–985. [CrossRef]
39. De Santoli, L.; Mancini, F.; Rossetti, S.; Nastasi, B. Energy and system renovation plan for Galleria Borghese,Rome. Energy Build. 2016, 129, 549–562. [CrossRef]
40. Rossi, F.; Anderini, E.; Castellani, B.; Nicolini, A.; Morini, E. Integrated improvement of occupants’ comfortin urban areas during outdoor events. Build. Environ. 2015, 93, 285–292. [CrossRef]
41. Nastasi, B. Planning of rural-urban continuum towards a sustainable relationship between agricultural andenergy production. In Agricultural Development within the Rural-Urban Continuum; Print & Mail (PRIMA):Hamburg, Germany, 2013.
42. Nastasi, B.; Di Matteo, U. Innovative use of Hydrogen in energy retrofitting of listed buildings. Energy Procedia2016, in press.
43. Pöschl, M.; Ward, S.; Owende, P. Evaluation of energy efficiency of various biogas production and utilizationpathways. Appl. Energy 2010, 87, 3305–3321. [CrossRef]
44. Astiaso Garcia, D.; Barbanera, F.; Cumo, F.; Di Matteo, U.; Nastasi, B. Expert Opinion Analysis on RenewableHydrogen Storage Systems Potential in Europe. Energies 2016, 9, 963. [CrossRef]
© 2017 by the authors; licensee MDPI, Basel, Switzerland. This article is an open accessarticle distributed under the terms and conditions of the Creative Commons Attribution(CC BY) license (http://creativecommons.org/licenses/by/4.0/).