energy consumption in mobile phones: measurement, … consumption in mobile phones: measurement,...
TRANSCRIPT

Energy Consumption in Mobile Phones: Measurement,Design Implications, and Algorithms
Niranjan Balasubramanian Aruna Balasubramanian Arun VenkataramaniDepartment of Computer Science
University of Massachusetts Amherst{niranjan, arunab, arun}@cs.umass.edu
ABSTRACTIn this paper, we present a measurement study of the energyconsumption characteristics of three widespread mobile net-working technologies: 3G, GSM, and WiFi. We find that3G and GSM incur a high tail energy overhead because oflingering in high power states after completing a transfer.Based on these measurements, we develop a model for theenergy consumed by network activity for each technology.Armed with this model, we seek to reduce the energy con-sumption of common mobile applications.
Towards this goal, we develop TailEnder, a protocol thatschedules transfers so as to minimize the cumulative en-ergy consumed while meeting user-specified delay-tolerancedeadlines. We show that the TailEnder algorithm is within afactor 1.28× of the optimal and show that no deterministiconline algorithm can achieve a better competitive ratio. Forapplications like web search that can benefit from prefetch-ing, TailEnder can aggressively prefetch several times moredata and improve user-specified response times while con-suming less energy. We evaluate the benefits of TailEnder forthree different case study applications—email, news feeds,and web search—based on real user logs and show signifi-cant reduction in energy consumption in each case. Experi-ments conducted on the mobile phone shows that TailEndercan download 60% more news feed updates and downloadsearch results for more than 50% of web queries, comparedto using the default policy. Our model-driven simulationshows that TailEnder can reduce energy by 35% for emailapplications, 52% for news feeds and 40% for web search.
1. INTRODUCTIONMobile phones are ubiquitous today with an estimated
cellular subscription of over 4 billion worldwide [2]. Mostphones today support one or more of 3G, GSM, and WiFi fordata transfer. For example, the penetration of 3G is estimatedat over 15% of cellular subscriptions worldwide and is over70% in some countries [1]. Recent measurement studiesreport that in the daily lives of urban users, cellular and WiFiavailability is about 99% and 50% respectively.
How do the energy consumption characteristics of networkactivity over 3G, GSM, and WiFi on mobile phones comparewith each other? How can we reduce the energy consumed bycommon applications using each of these three technologies?
To investigate these questions, we first conduct a detailedmeasurement study to quantify the energy consumed by datatransfers across 3G, GSM, and WiFi. We find that the en-ergy consumption is intimately related to the characteristicsof the workload and not just the total transfer size, e.g., afew hundred bytes transferred intermittently on 3G can con-sume more energy than transferring a megabyte in one shot.The key findings of our measurement are summarized below.These findings remain consistent across three different cities,diurnal variation, mobility patterns, and devices.
1. In 3G, a large fraction (nearly 60%) of the energy, re-ferred to as the tail energy, is wasted in high-powerstates after the completion of a typical transfer. Incomparison, the ramp energy spent in switching to thishigh-power state before the transfer is small. Tail andramp energies are constants that amortize over largertransfer sizes or frequent successive transfers.
2. In GSM, although a similar trend exists, the time spentin the high-power state after the transfer, or the tailtime, is much smaller compared to 3G (6 vs. 12 secs).Furthermore, the lower data rate of GSM implies thatmore energy is spent in the actual transfer of data.
3. In Wifi, the association overhead is comparable to thetail energy of 3G, but the data transfer itself is signifi-cantly more efficient than 3G for all transfer sizes.
Based on these findings, we develop a simple model ofenergy consumption of network activity for each of the threetechnologies. Armed with these models, we ask how we canreduce the energy consumption of network activity inducedby common mobile applications. To this end, we designTailEnder, an energy-efficient protocol for scheduling datatransfers. TailEnder considers two classes of applications: 1)delay-tolerant applications such as email and RSS feeds, and2) applications such as web search and web browsing thatcan benefit from aggressive prefetching.
For delay-tolerant applications on 3G and GSM, TailEnderschedules outgoing transfers so as to minimize the overalltime spent in high energy states after completing transfers,while respecting user-specified delay-tolerance deadlines. Weshow that the TailEnder scheduling algorithm is provablywithin a factor 1.28× of the energy consumed by an optimal
1

offline algorithm that knows the complete arrival pattern oftransfers a priori. Furthermore, we show that no deterministiconline algorithm can be better than 1.28-competitive withrespect to an optimal offline adversary, i.e., the upper andlower bounds on the competitive ratio are tight.
For applications that can benefit from prefetching, TailEn-der determines what data to prefetch so as to minimize theoverall energy consumed. Prefetching useful data reducesthe number of transfers and their associated cumulative tailenergy, while prefetching useless data incurs additional trans-mission energy. TailEnder uses a probabilistic strategy tobalance these concerns. Somewhat counterintuitively, forapplications such as web search, TailEnder fetches severaltimes more data and improves user-perceived response times,but still consumes less energy.
We evaluate the performance of TailEnder for three differ-ent applications: email, news feeds and web search. For eachof these applications, we collect real user traces includingarrival times and transfer sizes. We evaluate TailEnder byconducting experiments on the mobile phone and find thatTailEnder can download 60% more news feed updates anddownload search results for more than 50% of web queries,compared to using the default policy. Our model-driven sim-ulation shows that TailEnder can reduce energy by 35% foremail applications, 52% for news feeds and 40% for websearch. Further, we find that, opportunistic WiFi access sub-stantially reduces energy consumption compared to only us-ing 3G. Even when WiFi in only available 50% of the time,sending data over WiFi when available reduces the energyconsumption by over 3 times for all three applications.
2. BACKGROUND AND RELATED WORK
2.1 Cellular power managementTwo factors determine the energy consumption due to net-
work activity in a cellular device. First, is the transmissionenergy that is proportional to the length of a transmissionand the transmit power level. Second, is the Radio ResourceControl (RRC) protocol that is responsible for channel allo-cation and scaling the power consumed by the radio based oninactivity timers.
Figure 1(a) shows the state machine [16] implemented bythe RRC protocol for GSM/EDGE/GPRS (2.5G) as well asUMTS/WCDMA (3G) networks that follow the 3GPP [4]standard. The radio remains in the IDLE state in the absenceof any network activity. The radio transitions to the higherpower states, DCH (Dedicated Channel) or FACH (ForwardAccess Channel), when the network is active. The DCH statereserves a dedicated channel to the device and ensures highthroughput and low delay for transmissions, but at the cost ofhigh power consumption. The FACH state shares the channelwith other devices and is used when there is little traffic totransmit and consumes about half of the power in the DCHstate. The IDLE state consumes about one percent of thepower in the DCH state.
The transition between the different states is controlled by
IDLEDCH
FACH
NOT CONNECTEDCONNECTED
POWER
(a) (b)
Figure 1: : (a) The radio resource control state ma-chine for 3GPP networks consisting of three states:IDLE, DCH and FACH (b) Instantaneous power mea-surements for an example transfer over 3G showing thetransition time between high to low power state
inactivity timers [16]. Figure 1(b) shows the instantaneouspower measurements for an example transfer. The graphshows the time taken to transition from a high power to alow power state. Instead of transitioning from the high to thelow power state immediately after a packet is transmitted, thedevice transitions only when the network has been inactivefor the length of the inactivity timer. This mechanism servestwo benefits: 1) it alleviates the delay incurred in moving tothe high power state from the idle state, and 2) it reduces thesignaling overhead incurred due to channel allocation andrelease during state transitions. Since lingering in the highpower state also consumes more energy, network operatorsestimate the value of the inactivity timer based on this pefor-mance/energy trade-off [16, 11], with typical values beingseveral seconds long.
The 3GPP2 standard [3] used by the CDMA2000 tech-nology is another standard for 3G networks, and 3GPP and3GPP2 are the most prevalent standards today. Though thestate machine for the radio resource control in the 3GPP2standard is different from that shown in Figure 1, severalfeatures are similar. In particular, the 3GPP2 standard alsouses an inactivity timer to transition from the high power tothe low power state for performance reasons [16, 23].
2.2 WiFi power managementIn comparison, WiFi incurs a high initial cost of associat-
ing with an access point (AP). However, because WiFi onphones typically uses the Power Save Mode (PSM), the costof maintaining the association is small. When associated, theenergy consumed by a data transfer is proportional to the sizeof the data transfer and the transmit power level. Our mea-surements (Section 3) confirm that the transmission energyconsumed by WiFi is significantly smaller than both 3G andGSM1, especially for large transfer sizes.
2.3 Related work1We use the terms GSM and 2.5G interchangeably in this paper.
2

Energy consumption of network activity in mobile phoneshas seen a large body of work in recent times. To our knowl-edge, our paper presents the first comparative study of energyconsumption characteristics of all three technologies—3G,GSM, and WiFi—that are under widespread use today. Inparticular, our study of the energy consumption characteris-tics of 3G reveals significant and nonintuitive implicationsfor energy-efficient application design.
Analytical modeling. Prior work [16, 23, 11] has stud-ied the impact of different energy saving techniques in 3Gnetworks using analytical models. These works analyze theimpact of the inactivity timer by modeling the delay and en-ergy utilization for different values for the inactivity timer.Their goal is to determine the optimal value of the inactivitytimer from the network operator’s perspective. Yeh et al. [23]analytically compare the impact of the inactivity timer inboth 3GPP and 3GPP2 networks. In comparison, our studytreats the inactivity timer value as a given and develops algo-rithms for energy-efficient application design based on realmeasurements and application traces.
Measurement. Gupta et al. [13] present a measurementstudy of the energy consumption of VoIP applications overWiFi-based mobile phones. The authors find that intelligentscanning strategies and aggressive use of PSM in WiFi canreduce power consumption for VoIP applications. Xiao etal. [22] measure the energy consumption for Youtube-likevideo streaming applications in mobile phones using bothWiFi and 3G. Their focus is on the energy utilization of vari-ous storage strategies and application-level strategies such asdelayed-playback and playback after download. Nurminen etal. [18] measure the energy consumption for peer-to-peerapplications from mobile phones over 3G. In comparison tothese application-specific studies, our focus is on reducingthe energy consumption of general network activity across3G, GSM, and WiFi.
Energy-efficient mobile network activity. Severalprevious studies [5, 20, 21, 6] have investigated strategies forenergy-efficient network activity in mobile phones supportingmultiple wireless technologies. Pering et al.[20] developstrategies to intelligently switch between WiFi and Bluetooth.Agarwal et al.[5] propose an architecture to use the GSMradio to wake up the WiFi radio upon an incoming VoIP callto leverage the better quality and energy-efficiency of WiFiwhile keeping its scanning costs low.
Rahmati et al. [21] show that intelligently switching be-tween WiFi and GSM reduces energy consumption substan-tially as WiFi consumes less transmission power. However,in order to avoid the cost of unnecessary scanning in theface of poor WiFi availability, the authors design an algo-rithm that predicts WiFi availability, and the device scans forWiFi access points only in areas where WiFi is available withhigh probability. Trevor et al. [6] present application-levelmodifications to reduce energy consumption for updates todynamic web content. Their key ideas include using a proxyto 1) only push new content when the portion of the webdocument of interest to the user is updated, 2) batch updates
to avoid the overhead of repeated polling, and 3) use SMS onGSM to signal the selection of WiFi or GSM based on thetransfer size for energy-efficient data transfer. In addition toconfirming these prior findings about GSM and WiFi powerconsumption, our measurement study also investigates 3Gthat reveals significantly different energy consumption char-acteristics, which lead us to develop novel energy-efficientand provably near-optimal data transfer algorithms for 3G.
Algorithms. Prior theoretical works [10, 12, 14, 7]study the problem of energy minimization while meeting jobdeadlines in processors that transition between the sleep andactive state. The model assumed in most of these works is thata device incurs a large ramp energy overhead in transitioningfrom the low power state to the high power state, so the goalis to minimize the number of transitions. As explained inSections 3 and 4, this model cannot be applied as is to mobilephones because their transition characteristics are differentand include a significant tail energy component. For thismodel, we develop a provably near-optimal online algorithmto minimize energy, and further show that no deterministiconline algorithm can achieve a better competitive ratio.
3. MEASUREMENTThe main goals of our measurement study are to:
1. Compare the energy consumption characteristics of 3G,GSM and WiFi and measure the fraction of energyconsumed for data transfer versus overhead.
2. Analyze the variation of the energy overhead with geo-graphic location, time-of-day, mobility, and devices.
3. Develop a simple energy model to quantify the energyconsumption over 3G, WiFi and GSM as a function ofthe transfer size and the inter-transfer times.
Next, we describe our measurement methodology and thenpresent our findings.
3.1 Devices and ToolsOur experiments are performed using four Nokia N95
phones2. Two of the phones are 3G-enabled AT&T phonesthat use HSDPA/UMTS technology and two are GSM-enabledAT&T phones that use EDGE. All four phones were equippedwith an 802.11b WiFi interface. We use Python, PyS60v1.4.2, developed for the Symbian OS 3rdEd FP 1 to conductdata transfer experiments.
To measure energy consumption, we use Nokia’s energyprofiling application, the Nokia Energy Profiler (NEP) v1.13.NEP provides instantaneous power measurements sampledonce every 250 milli-seconds. Using the power measure-ments, we estimate the energy consumed by approximatingthe area under the power measurement curve over a time inter-val. We subtract the idle power from the energy consumption2http://en.wikipedia.org/wiki/Nokia N953http://www.forum.nokia.com/Resources and Information/Tools/Plug-ins/Enablers/Nokia Energy Profiler/
3

0
2
4
6
8
10
12
14
Transfer Ramp Tail
Energy(Jou
les)
Components Total
(a)
0
5
10
15
20
25
1 2 3 4 5 6 7 8 9 10111213141516171819
Energy(Joules)
Timebetweentransfers(seconds)
1K
5K
10K
50K
100K
500K
(b)
Figure 2: : 3G Measurements: (a) Ramp, transfer andtail energy for 50K 3G transfer. (b) Average energy con-sumed for transfer against the time between successivetransfers
estimation when appropriate. Unless stated, all measurementresults are averaged over 20 trials.
3.2 Measurement Methodology
3.2.1 3G and GSMWe conduct measurement study to quantify the: 1) Ramp
energy: energy required to switch to the high-power state,2) Transmission energy, and 3) Tail energy: energy spent inhigh-power state after the completion of the transfer.
We conduct measurements for data transfers of differentsizes (1 to 1000 KB) with varying intervals (1 to 20 seconds)between successive transfers. We measure energy consump-tion by running NEP in the background while making datatransfers. For each configuration of (x,t), where x ∈ [1K,1000K] and t ∈ [1, 20] seconds, the data transfers proceedas follows: The phone initiates an x KB download by issu-ing a http-request to a remote server. After the download iscompleted, the phone waits for t seconds and then issues thenext http request. This process is repeated 20 times for eachdata size. Between data transfer experiments for differentintervals, the phone remains idle for 60 seconds. We conducta similar experiment to upload data to a remote server.
We extract the energy measurements from the profiler foranalysis. We use the time-stamps recorded by NEP to markthe beginning and end of data transfer as well as the begin-
ning and end of the Ramp time and the Tail time. Then, theenergy consumed by each data transfer is computed by ap-proximating the energy under the power-curve between theend of Ramp time and the start of Tail time.
3.2.2 WiFiOur WiFi measurements quantify: 1) Energy to scan and as-
sociate to an access point and 2) transfer energy. We conducttwo sets of measurements. In the first set of measurements,for each data transfer, we first scan for Wifi access points,associate with an available AP and then make the transfer. Inthe second set of measurements, we only make one scan andassociation for the entire set of data transfers to isolate thetransfer energies.
In addition, all three networks, 3G, GSM and WiFi, incura maintenance energy, which is the energy used to keep theinterface up. We estimate the maintenance energy per secondby measuring the total energy consumed to keep the interfaceup for a time period.
3.2.3 Accounting for idle powerFor all measurements, we configure the phone in the low-
est power mode and turn off the display and all unused net-work interfaces. The energy profiler itself consumes a smallamount of energy, which we include in the idle power mea-surement. We measure idle energy by letting the energyprofiler run in the background with no other application activ-ity. The average idle power is less than 0.05 W and runningthe energy profiler at a sampling frequency of 0.25 secondsincreases the power to 0.1 W.
3.3 3G MeasurementsFigure 2(a) shows the energy consumption for a typical
50KB download over 3G. We find that the Tail energy ismore than 60% of the total energy. The Ramp energy issignificantly small compared to the tail energy, and is only14% of the total energy. 3G also incurs a maintenance energyto keep the interface on, and is between 1-2 Joules/minute(not shown).
Figure 2(b) shows the average energy consumed for datatransfer when the time between successive transfers is var-ied. We ignore the idle energy consumed when waiting totransfer the next packet. Consider the data points for trans-ferring 100 KB data. The energy increases from 5 Joules to13 Joules as the time between successive transfers increasesfrom 1 second to 12 seconds. When the time between suc-cessive transfers is greater than 12.5 seconds, the energyconsumed for 100 KB transfers plateaus at 15 Joules. Whenthe device waits less than the Tail time to send the next packet,each data transfer does not incur the total Tail energy penalty,reducing the average energy per transfer. This observationsuggests that the Tail energy can be amortized using multipletransfers, but only if the transfers occur within Tail time ofeach other. We use this crucial observation to design TailEn-der, a protocol that reduces the energy consumed by networkapplications running on mobile phones.
4

0
5
10
15
20
0 10 20 30 40 50 60 70 80
En
erg
y (J
oule
s)
Trial number
23-April27-April28-April
(a) Temporal variation: Tail energy
0
2
4
6
8
10
0 10 20 30 40 50 60 70 80
En
erg
y (J
oule
s)
Trial number
23-April27-April28-April
(b) Temporal variation: Ramp energy
0
2
4
6
8
10
12
14
En
erg
y (
Jo
ule
s)
Amherst, D1Amherst, D2
Northampton, D2Boston, D1
Night, D1
RAMP TAIL
(c) Geographical variation
Figure 3: : 3G: 50 Energy measurements on three different days: (a) Tail energy (b) Ramp energy. (c) Tail and Rampenergies measured in different locations with two devices, including a night time measurement.
0
5
10
15
20
25
1 10 100 1000
Energy(Joules)
DataSizeinKB
Day
Night
(a) Download: Day versus Night
0
5
10
15
20
Transfer Ramp Tail
Components Total
(b) Upload measurements
02468
101214161820
1 10 100
Energy(Joules)
DataSizeinKB
Upload
Download
(c) Upload versus Download
Figure 4: : 3G: (a) Comparison of energy consumption of day versus night time transfers. x-axis is in logarithmicscale. (b) Transfer, Tail and Ramp energy for upload experiments (c) Comparison of energy consumption of downloadversus upload experiments.
3.3.1 Geographical and Temporal variationsWe measure the energy consumption across different days
and in different geographical regions. The objective of thisexperiment is two-fold. First, we wish to verify that mobilephones in different cell tower areas are also affected by theTail time overhead. Second, we want to evaluate the consis-tency of Tail time.
Figure 3(a) shows that the Tail energy remains consistentacross three days. On the other hand, Figure 3(b) shows thatthe Ramp energy is about 2 and 4 Joules for the measurementsconducted on different days.
We conducted 3G energy measurements in three differentcities, Amherst, Northamption and Boston, in Massachusetts,USA using two different devices, D1 and D2. Figure 3(c)shows that Tail energy is consistent across different locationsand for two different Nokia devices. The figure also showsthat the Tail energy and Ramp energy do not vary acrossday (9:00 am to 5:00 pm) and night (8:00 pm to 6:00 am).Based on these measurements, it appears that the Tail timeor the inactivity timer is configured statically by the networkoperators and can be inferred empirically. In Section 4, weuse the value of the inactivity timer to design TailEnder.
Figure 4(a) compares the total energy consumed for datatransfers during the day versus night, averaged over threedays. Even though the ramp and tail energies are similarduring night and day (shown in Figure 3(c)), the total energyconsumed during the night is up to 10% lower than duringthe day. This is likely due to lower congestion during thenight leading to lower transfer energy.
3.3.2 UploadsFigure 4(b) shows the tail, ramp and transfer energy for
upload experiments. As observed in the download experi-ments, the Tail energy consumes more than 55% of the totalenergy. Figure 4(c) shows that the transfer energy for uploadsis higher than downloads for larger data sizes. For example,the transfer energy for upload is nearly 30% more comparedto that for downloads when transferring 100 KB. This differ-ence is because upload bandwidths are typically smaller thanthe download bandwidth.
3.3.3 MobilityFigure 5 compares energy consumption under mobility
within the town of Amherst, MA for 50K data transfers. Mo-
5

0
5
10
15
20
25
30
Total Transfer Ramp Tail
Energy(Jou
les)
Stationary
Mobile
Figure 5: 3G Mobility Measurements: Energy compo-nents of 50K 3G transfers with confidence intervals.(Averaged over 35 mobility trials)
bility in outdoor settings affect transfer rates due to factorssuch as signal strength and hand-offs between cell towersresulting in varying transfer times [17]. Despite the largevariances in the transfer energy compared to the stationarymeasurements, we observe that the Tail energy accounts fornearly 50% of the total energy.
3.4 GSM Measurements
0
1
2
3
4
5
6
Transfer Ramp Tail
Components Total
(a) GSM: Energy components
05
101520253035404550
1 2 3 4 5 6 7 8 9 10
Energy(Jou
les)
Timebetweentransfers(seconds)
1K
5K
10K
50K
100K
500K
1M
(b) GSM: Varying data sizes
Figure 6: : GSM Measurements: (a) Proportional en-ergy consumption for Ramp energy, Tail energy, andtransfer energy. (b) Energy consumption for differentdata sizes against the inter-transfer time.
We conducted a set of measurements using the two Nokiaphones equipped with GSM. Figure 6(a) shows the energyconsumption in GSM networks as a proportion of the Tailenergy, Ramp energy and transfer energy for a 50K download.
Unlike in 3G, the Tail energy only accounts for 30% of thetransfer energy. However, similar to 3G, the Ramp energy inGSM is small compared to the Tail energy and the transferenergy. We also observed that the Tail time is 6 secondsand GSM incurs a small maintenance energy between 2-3J/minute (not shown in figure).
Due to the small Tail time in GSM (unlike 3G), data sizesdominate energy consumption rather than the inter-transfertimes. Figure 6(b) shows the average energy consumed whenvarying the time between successive transfers. The averageenergy does not vary with increasing inter-transfer interval.For example, for data transfers of size 100 KB, the averageenergy consumption is between 19 Joules to 21 Joules evenas the time between successive transfers is varied. In compar-ison, Figure 2(b) shows that the average energy consumptionvaries significantly in 3G with varying inter-transfer interval,until the inter-transfer interval grows to more than the Tailtime.
3.5 Wi-Fi MeasurementsFigure 7(a) shows the energy consumption in WiFi com-
posed of scanning, association and transfer, for a 50 K down-load. We observe that the scanning and association energyis nearly five times the transfer energy. Our results confirmprevious measurements by Rahmati et al. [21].
Figure 7(b) shows that for WiFi, energy consumption in-creases when time between successive transfer increases.Interestingly, energy consumption does not plateau after athreshold inter-transfer interval like in 3G (Figure 2(b)). Thereason for increasing energy consumption with increasinginter-transfer interval is the high maintenance energy in WiFi.We measured the maintenance overhead (not shown) for keep-ing the WiFi interface on to be 3-3.5 Joules per minute.
3.6 3G vs GSM vs WiFiFigure 8 compares the energy consumption of 3G, GSM
and WiFi. 3G consumes significantly more energy to transferdata of all sizes (12-20J) compared to GSM and WiFi. GSMconsumes 40% to 70% less energy compared to 3G. Thisis due to two reasons – (1) GSM radios typically operateat a lower power level than 3G radios and (2) the Tail en-ergy set for GSM is around 6 seconds, much lower than the12.5 seconds set for 3G.
Wi-Fi is more energy efficient than both cellular networksonce it is connected to an access point (AP). We find thatthe transfer energy for Wifi grows nearly three times slowercompared to the cellular networks. For a transfer of size 10K,Wifi consumes one-sixth of 3G’s energy and one-third ofGSM’s energy. With increasing data sizes Wifi’s efficiencyincreases dramatically. The graph shows that when the costof scan and transfer is included (marked in the graph as WiFi+ SA), WiFi becomes inefficient for small sized transferscompared to GSM (as also observed by Rahmati et al. [21]).Surprisingly, when compared to 3G, WiFi is energy efficienteven when the cost of scanning and association is included.We exploit this observation in Section 5.2.4.
6

0
1
2
3
4
5
6
7
8
Total Scan‐Associate Transfer
Energy(Jou
les)
(a)
0
0.5
1
1.5
2
2.5
3
3.5
0 5 10 15 20
Energy(Jou
les)
Timebetweentransfers(seconds)
1K
5K
10K
50K
100K
(b)
Figure 7: Wifi Measurements: (a) Proportional energyconsumption for scan/associate and transfer. (b) Energyconsumption for different transfer sizes against the inter-transfer time.
Figures 9(a) and 9(b) is a qualitative comparison of theinstantaneous power measurements over 3G and GSM re-spectively. The measurements corresponds to a single 50Ktransfer. The lines marked Uplink and Downlink show thenetwork activities in the uplink and downlink direction re-spectively (corresponding to request and download). Theprofiles show both that GSM radios operate at lower powerlevels and that the device returns to the low power mode in ashorter time in GSM compared to 3G.
Figure 9(c) shows a similar snapshot for a 50K transferover WiFi. The initial spikes corresponds to energy consumedfor scanning and association. The WiFi radio frequentlychecks the AP for incoming packets, and is shown by thepower spikes corresponding to uplink activity after the initialscanning and association is complete. Since we set WiFi tooperate in the power-save mode, these checks are terminatedafter a fixed idle time of 40 seconds.
3.6.1 Energy modelOne of the goals of our measurement study is to obtain
accurate energy models for energy consumption in 3G, GSMand WiFi. The model enables us to empirically estimate theenergy consumption of different applications using the mea-surement results (Section 5). We model energy consumptionas a function of the size and the time between successivetransfers. Figure 7(b) and Figure 2(b) show that time betweentransfers significantly effects energy consumption.
Table 1 shows the energy model we derive from the mea-
0
5
10
15
20
25
1 10 100 1000
Energy(Jou
les)
DatasizeinKB
3G
GSM
WiFi
Wifi+SA
Figure 8: : Energy consumption of transfers of differ-ent sizes: WiFi versus cellular networks. x-axis is inlogarithmic scale.
surement study. The energy spent to send x bytes of datais consists of three components: 1) Ramp energy 2) trans-mission energy and 3) Tail energy. In case of 3G and GSM,we use R(x) to denote the sum of the Ramp energy and thetransmission energy to send x bytes and E to denote the Tailenergy. For WiFi, we use R(x) to denote the sum of the trans-fer energy and the energy for scanning and association, andwe set the Tail energy E to zero. M denotes the maintenanceenergy per second and T denotes the Tail time. In additionto R(x) and E, the total energy to transmit a packet also de-pends on the time the interface is on. The last row in Table 1shows an example computation for the average energy spentto transmit 50K of data with a 20 second interval.
3.7 SummaryWe summarize our key measurement findings as follows:
1. In 3G, nearly 60% of the energy is tail energy, is wastedin high-power states after the completion of a typi-cal transfer. In comparison, the ramp energy spent inswitching to this high-power state before the transfer issmall. The tail and ramp energies can be amortized overfrequent successive transfers, but only if the transfersoccur within Tail time of each other.
2. In GSM, although a similar trend exists, the tail timeis much smaller compared to 3G (6 vs. 12 secs). Fur-thermore, the lower data rate of GSM implies that moreenergy is spent in the actual transfer of data comparedto in the tail.
3. In WiFi, the association overhead is comparable to thetail energy of 3G, but the data transfer itself is sig-nificantly more efficient than 3G for all transfer sizes.When the scan cost is included, WiFi becomes ineffi-cient for small sized transfers compared to GSM, but isstill more energy efficient than 3G.
4. PROTOCOLInformed by our measurement-driven model, we develop
TailEnder, a protocol whose end-goal is to reduce energy
7
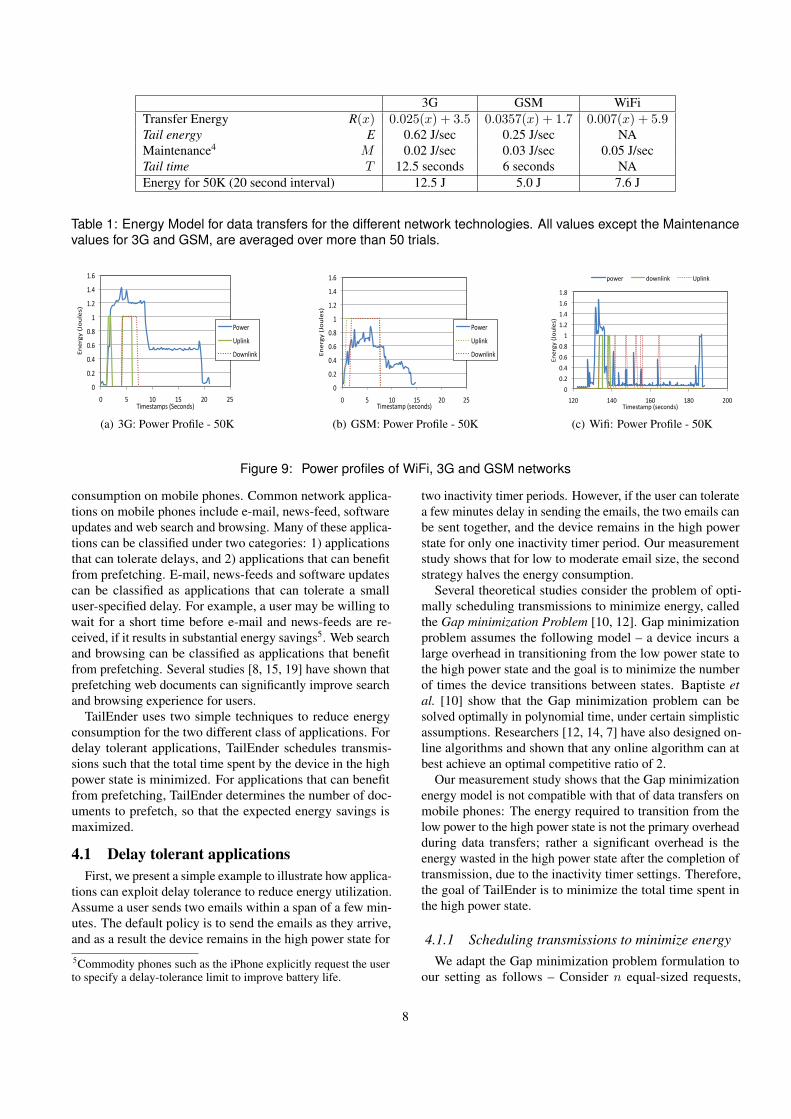
3G GSM WiFiTransfer Energy R(x) 0.025(x) + 3.5 0.0357(x) + 1.7 0.007(x) + 5.9Tail energy E 0.62 J/sec 0.25 J/sec NAMaintenance4 M 0.02 J/sec 0.03 J/sec 0.05 J/secTail time T 12.5 seconds 6 seconds NAEnergy for 50K (20 second interval) 12.5 J 5.0 J 7.6 J
Table 1: Energy Model for data transfers for the different network technologies. All values except the Maintenancevalues for 3G and GSM, are averaged over more than 50 trials.
0
0.2
0.4
0.6
0.8
1
1.2
1.4
1.6
0 5 10 15 20 25
Energy(Joules)
Timestamps(Seconds)
Power
Uplink
Downlink
(a) 3G: Power Profile - 50K
0
0.2
0.4
0.6
0.8
1
1.2
1.4
1.6
0 5 10 15 20 25
Energy(Joules)
Timestamp(seconds)
Power
Uplink
Downlink
(b) GSM: Power Profile - 50K
0
0.2
0.4
0.6
0.8
1
1.2
1.4
1.6
1.8
120 140 160 180 200
Energy(Joules)
Timestamp(seconds)
power downlink Uplink
(c) Wifi: Power Profile - 50K
Figure 9: Power profiles of WiFi, 3G and GSM networks
consumption on mobile phones. Common network applica-tions on mobile phones include e-mail, news-feed, softwareupdates and web search and browsing. Many of these applica-tions can be classified under two categories: 1) applicationsthat can tolerate delays, and 2) applications that can benefitfrom prefetching. E-mail, news-feeds and software updatescan be classified as applications that can tolerate a smalluser-specified delay. For example, a user may be willing towait for a short time before e-mail and news-feeds are re-ceived, if it results in substantial energy savings5. Web searchand browsing can be classified as applications that benefitfrom prefetching. Several studies [8, 15, 19] have shown thatprefetching web documents can significantly improve searchand browsing experience for users.
TailEnder uses two simple techniques to reduce energyconsumption for the two different class of applications. Fordelay tolerant applications, TailEnder schedules transmis-sions such that the total time spent by the device in the highpower state is minimized. For applications that can benefitfrom prefetching, TailEnder determines the number of doc-uments to prefetch, so that the expected energy savings ismaximized.
4.1 Delay tolerant applicationsFirst, we present a simple example to illustrate how applica-
tions can exploit delay tolerance to reduce energy utilization.Assume a user sends two emails within a span of a few min-utes. The default policy is to send the emails as they arrive,and as a result the device remains in the high power state for5Commodity phones such as the iPhone explicitly request the userto specify a delay-tolerance limit to improve battery life.
two inactivity timer periods. However, if the user can toleratea few minutes delay in sending the emails, the two emails canbe sent together, and the device remains in the high powerstate for only one inactivity timer period. Our measurementstudy shows that for low to moderate email size, the secondstrategy halves the energy consumption.
Several theoretical studies consider the problem of opti-mally scheduling transmissions to minimize energy, calledthe Gap minimization Problem [10, 12]. Gap minimizationproblem assumes the following model – a device incurs alarge overhead in transitioning from the low power state tothe high power state and the goal is to minimize the numberof times the device transitions between states. Baptiste etal. [10] show that the Gap minimization problem can besolved optimally in polynomial time, under certain simplisticassumptions. Researchers [12, 14, 7] have also designed on-line algorithms and shown that any online algorithm can atbest achieve an optimal competitive ratio of 2.
Our measurement study shows that the Gap minimizationenergy model is not compatible with that of data transfers onmobile phones: The energy required to transition from thelow power to the high power state is not the primary overheadduring data transfers; rather a significant overhead is theenergy wasted in the high power state after the completion oftransmission, due to the inactivity timer settings. Therefore,the goal of TailEnder is to minimize the total time spent inthe high power state.
4.1.1 Scheduling transmissions to minimize energyWe adapt the Gap minimization problem formulation to
our setting as follows – Consider n equal-sized requests,
8

where each request ri is associated with an arrival time ai
and a deadline di by which it needs to be transmitted. Whenthe request ri is scheduled to be transmitted at time si, theradio transitions to the high power state, transfers requestri instantaneously, and remains in the high power states forT time units, equal to the Tail time. Also, based on ourmeasurements, we ignore the energy overhead to switch tothe high-power state. Note that when multiple requests aretransmitted at the same time, the device is in the high powerstate only for T time units. Let Z denote the the total timespent in high-power states for a given schedule of requests.The problem is to compute a schedule s1, s2, · · · , sn thatminimizes Z, such that ai ≤ si ≤ di.
In practice, we need to solve an online version of theproblem, where arrivals and their deadlines are not known inadvance.TailEnder uses a simple online algorithm to scheduletransmission of an incoming request ri at time t. The mainidea of TailEnder is to transmit a request ri if either
• the request arrives within a time x ·T from the previousdeadline d′, or
• the request’s deadline is reached.
We show that the algorithm provably achieves a compet-itive ratio of 1.28 compared to the optimal if the value of xis set to 0.57. Further, we show that no deterministic onlinealgorithm can achieve a competitive ratio lower than 1.28.Thus, the TailEnder algorithm achieves the optimal competi-tive ratio(see Appendix for details). Figure 10 presents theTailEnder algorithm.
An alternate solution to the scheduling problem is to waituntil deadline, where incoming requests are batched until oneof the requests reaches its deadline [9]. It is easy to showthat the wait until deadline scheme is at best 2-competitivecompared to the optimal. Further, the wait until deadlinescheme can delay requests even if the delay does not provideany energy benefit. For example, if a new request arrivesimmediately after another request is scheduled, the wait untildeadline scheme will delay scheduling the new request, eventhough delay provides no energy benefit.
4.2 Applications that benefit from prefetchingPrevious work [8] shows that aggressive prefetching can re-
duce delays in networks with intermittent connectivity. How-ever, it is not straightforward to design a prefetching strategywhose end goal is to reduce energy consumption. On theone hand, in the absence of any prefetching, the applicationneeds to fetch the user-requested documents sequentially. Ifthe user think-time is greater than the value of the inactivitytimer, then the application incurs a large energy overheadin fetching each document. On the other hand, if the appli-cation aggressively prefetches documents and the user doesnot request any of the prefetched documents, then the appli-cation wastes a substantial amount of energy in prefetching.Clearly, user behavior is key in determining the effectivenessof prefetching for reducing energy consumption.
TailEnder scheduler (t, ri):
1. set d′ = 0
2. if (t < ai), return
3. If (t < di)
(a) if (d′ + 0.57T < ai), transmit.
(b) else, add the request to queue Q.
4. If (t == di)
(a) Transmit ri
(b) Transmit all requests in Q and set Q = null
(c) Set d′ = di
Figure 10: TailEnder scheduler that makes a decisionabout transmitting a request ri at time t
0
0.2
0.4
0.6
0.8
1
0 2 4 6 8 10 12 14 16 18 20 22 24 26 28 30
Frac
tion
of re
ques
ts
Document Rank
Figure 11: CDF of the fraction of times a user requestsa web document at a given rank, for Web search ap-plication. The figure shows the CDF over more than 8million queries collected across several days.
We consider the prefetching problem in the context of Websearch and browsing. The information retrieval communityand search engine providers collect large amounts of data tostudy user behavior on the web. Our goal is to exploit theuser-behavior statistics to make prefetching decisions. Weformulate the prefetching problem as follows: Given user be-havior statistics, how many documents should be prefetched,in order to minimize the expected energy consumption?.
4.2.1 Maximizing expected energy savingsFigure 11 shows the distribution of web documents that
are requested by the user when searching the web. The graphis generated using Microsoft Search logs 6. The logs containover 8 million user queries and were collected over a month.Figure 11 shows that 40% of the time, a user requests forthe first document presented by the search engine. A user re-quests for a document ranked 11 or more, less than 0.00001%of the time.
Based on the user-behavior statistics, we estimate the ex-pected energy savings as a function of prefetched documents
6obtained from Microsoft Live Labs
9

0
20
40
60
80
100
0 2 4 6 8 10 12 14 16 18 20 22 24 26 28 30
Expe
cted
ene
rgy
savi
ng (%
)
Document Rank
Figure 12: Expected percentage energy savings as afunction of the number of documents prefetched.
size. We assume that the user think-times are greater thanthe value of the inactivity timer. Let k be the number ofprefetched documents, prefetched in the decreasing rank or-der and p(k) be the probability that a user requests a docu-ment within rank k. Let E be the Tail energy, R(k) be theenergy required to receive k documents, and TE be the totalenergy required to receive a document. TE includes the en-ergy to move from the low to the high power state, the energyto receive a requested document and the Tail energy. Theexpected fraction of energy savings if the top k documentsare prefetched is
E · p(k)−R(k)TE
Figure 12 shows the expected energy savings for varying kas estimated by Equation 4.2.1. The value of p(k) is obtainedfrom statistics presented in Figure 11, and E, R(k) and TEare obtained from the 3G energy measurements (in Table 1).We set the size of a document to be the average web documentsize seen in the search logs.
Figure 12 shows that prefetching 10 web documents maxi-mizes the energy saved. When more documents are prefetched,the cost of prefetching is greater than the energy savings.When too few documents are prefetched, the expected energysavings is low since the user may not request a prefetcheddocument. Therefore, for Web search applications, TailEnderprefetches 10 web documents for each user query. In Sec-tion 5, we show that TailEnder can save substantial amountof energy when applied to real Web search sessions.
5. EVALUATIONWe evaluate TailEnder using a model-driven simulation
and real experiments on the phone. The goal of our evaluationis to quantify the reduction in energy utilization when usingTailEnder for different applications, when compared to aDefault protocol.
To show the general applicability of TailEnder, we evaluateits performance for three applications: emails, news-feedsand Web search. Both email and news-feeds are applicationsthat may be able to tolerate a small delay, while Web searchis an application that benefits from prefetching. For all threeapplications, the impact of TailEnder for energy minimization
0
0.2
0.4
0.6
0.8
1
1.2
[0‐5]
[5‐10]
[10‐15]
[15‐20]
[20‐25]
[25‐30]
[30‐35]
[35‐40]
[40‐45]
[45‐50]
[50‐55]
[55‐60]
CDFofFeedup
dates
Time(seconds)
BusinessTopStoriesOp/Ed
Figure 13: Arrival times distribution for 3 news feedtopics.
largely depends on the application traffic and user behavior.For example, if a user receives an email at a periodic intervalof once per hour, or if news-feeds are updated once per hour,TailEnder is unlikely to provide energy benefits. In our ex-periments, we collect real application level traces to evaluateTailEnder.
5.1 Application-level trace collectionTo collect traces for evaluating e-mail application, we mon-
itor the mailboxes of 3 graduate students for 10 days and logthe size and time-stamps of incoming and outgoing mails.Table 2 tabulates the statistics of the resulting email logs.
User 1 User 2 User 3Incoming 446 405 321
Incoming size 214MB 162MB 161MBOutgoing 219 183 354
Outgoing size 107MB 66MB 178MB
Table 2: Characteristics of collected e-mail
To collect news feed traces, we polled 10 different Yahoo!RSS news feeds7 once every 5 seconds for a span of 3 days.We log the arrival time and size of each new story or anupdate to an existing story Table 3 lists the news-feeds wecrawled. The traces cover major news topics, both critical(e.g., Business, Politics) and non-critical (e.g., Entertainment).Figure 13 shows the inter-arrival times of updates for threeexample news topics – Top stories, Op/Ed and Business.Updates to the Top stories topic arrive with higher frequencythan the Op/Ed and Business topics and nearly 60% of theupdates for the Top stories topic arrive with an inter-arrivaltime of 10–15 seconds.
For Web search, we use the Microsoft Search logs thatcontains more than 8 million queries sampled over a periodof one month. The search log contains the time and theurls that were clicked for each query, as well as the size ofthe requested document. We extracted a random subset of1000 queries from this data set. Figure 11 characterizes thedistribution of clicks for each query.
7http://news.yahoo.com/rss
10

Feed Total storiesOpinion/Editorials 507Health 2177Technology 4659Business 5616Sports 7265Politics 12069US News 12389Entertainment 16757World 21006Top Stories 23232
Table 3: News Feeds Collection
5.2 Model-driven evaluationTo quantify the performance of TailEnder for varying pa-
rameters and settings, we conduct a trace-driven evaluationusing the application traces we collected. We obtain an en-ergy model for per-byte data transmission from our measure-ment study. We also obtain the Tail time, Tail energy andRamp energyform our measurement (see Section 3.7). Weuse the energy values obtained from our Amherst, day time,stationary measurements, shown in Table 1.
The application trace consists of a sequence of arrivalsof the form (si, ai), where si is the size of the request andthe ai is the time of arrival. For example, for the news feedapplication, ai is the time a topic is updated and si is thesize of the update. Requests could be downloads as in newsfeeds or uploads as in outgoing emails. The Default protocolschedules transmissions as requests arrive. For delay tolerantapplications, TailEnder schedules transmissions using thealgorithm shown in Figure 10. For applications that benefitfrom prefetching, TailEnder schedules transmissions for allprefetched documents. For both protocols, we estimate theenergy consumption as a sum of the Ramp energy (if thedevice is not in high power state), transmission energy and theenergy consumed because of staying in the high power stateafter transmission. If a request is scheduled for transmissionbefore the Tail time of the previous transmission, the previoustransmission does not incur an overhead for the entire Tailtime.
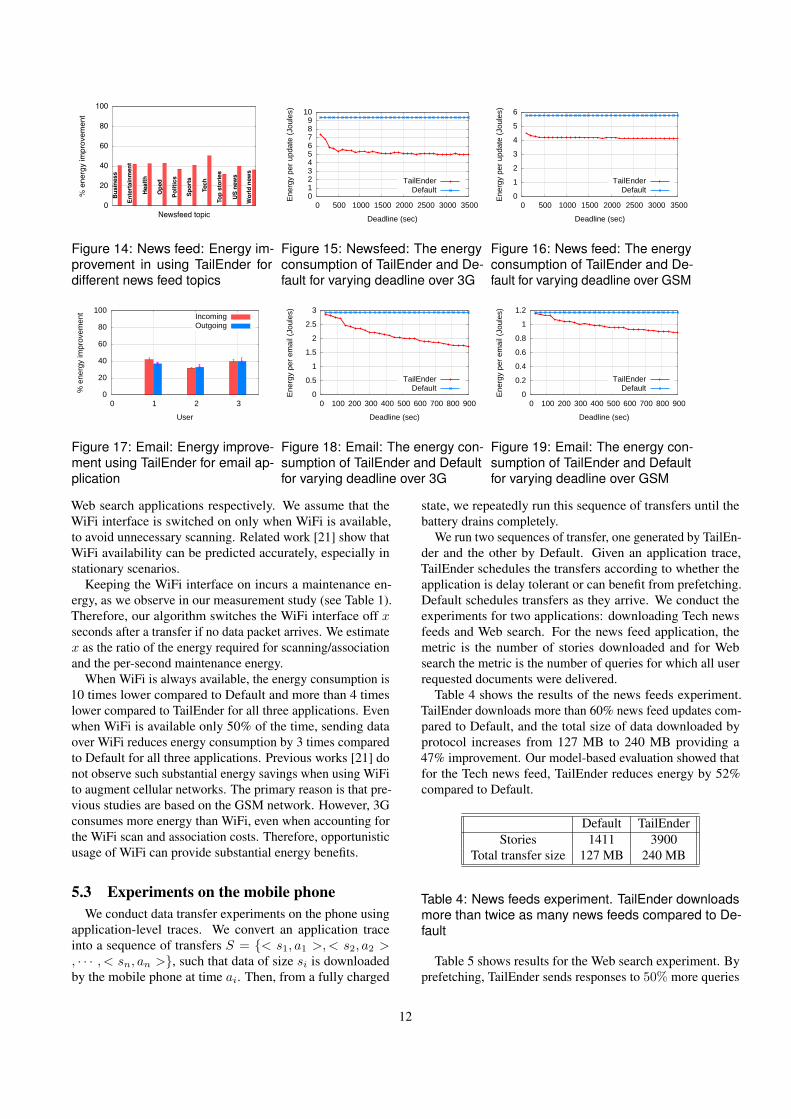
5.2.1 News-feedsFigure 14 shows the improvement in energy using TailEn-
der for each of the news feed topics. We set the deadline forsending the news feeds update to 10 minutes; i.e., a newsfeedcontent needs to be sent to the user with a maximum delayof 10 minutes since the content was updated. The averageimprovement across all news feeds is 42%. The largest im-provement is observed for the Tech news feed at 52% and thesmallest improvement for the Top story news feed at 36%.One possible reason for the top story news feed to yield lowerperformance improvement is that 60% of the top story up-dates arrive within 10 seconds, which is the less than the
Tail time of 12.5 seconds (see Figure 13). Therefore, Defaultdoes not incur a Tail energy penalty for a large portion of theupdates.
Figure 15 and 16 show the expected energy consump-tion for business news feeds using TailEnder and Default forvarying deadline settings over 3G and GSM respectively. Fig-ure 15 shows that as deadline increases to 25 minutes(1500 sec-onds), TailEnder’s energy decreases to nearly half of theenergy consumption of Default, decreasing from 10 Joulesto 5 Joules per update. When sending data over GSM, theenergy decreases from 6 Joules to 4 Joules when using TailEn-der, compared to Default, yielding a 30% improvement. Theimprovements of TailEnder over default are smaller in GSMcompared to 3G. However, the improvements are substan-tial when considering the relative proportions of GSM’s Tailenergyand transfer energies.
5.2.2 E-mailFigure 17 shows the energy reduction using TailEnder
as percentage improvement over default, for incoming andoutgoing emails for a set deadline of 10 minutes. We obtainan improvement of 35% on average for all three users. Wenote that we use download energy model for incoming emailsand upload energy model for outgoing emails.
Figure 18 and Figure 19 show the energy consumed byTailEnder and Default as the deadline increases, when datais sent on the 3G and GSM networks respectively. Thisexperiment is conducted using the incoming email traces ofUser 2. Increasing the deadline improves energy benefits ofTailEnder in both 3G and GSM. Over 3G, TailEnder reducesenergy consumption by 40% when the deadline is set to15 minutes. As before, TailEnder provides a lower energybenefit in GSM compared to 3G. For a 15 minute deadline,TailEnder decreases energy by only 22% when data is sentover GSM.
5.2.3 Web searchFigure 20 shows the energy improvement using TailEn-
der for Web search application, when sending data over 3Gand GSM. For Web search, TailEnder prefetches the top 10documents for each requested query. Default only fetchesdocuments that are requested by the user. TailEnder reducesenergy by nearly 40% when data is sent over 3G and by about16% when data is sent over GSM.
To understand the distribution of energy savings per query,we plot the CDF of the energy improvement in Figure 21.The plot shows that about 2% of the queries see little en-ergy improvement. TailEnder reduces energy for 80% of thequeries by 25–33%. For the remaining 18% of the queries,TailEnder reduces energy by over 40%. We find that the 18%of the queries that benefits most by TailEnder’s prefetchingare queries for which the user requested 3 or more documents.
5.2.4 Using WiFi for energy savingsFigures 22, 23 and 24 show how utilizing WiFi availability
can reduce energy consumption for news feed, email and
11
0
20
40
60
80
100
% e
ne
rgy im
pro
ve
me
nt
Newsfeed topic
Busi
ness
Ente
rtain
men
t
Heal
th
Ope
d
Polit
ics
Spor
ts
Tech
Top
stor
ies
US n
ews
Wor
ld n
ews
Figure 14: News feed: Energy im-provement in using TailEnder fordifferent news feed topics
0 1 2 3 4 5 6 7 8 9
10
0 500 1000 1500 2000 2500 3000 3500
Ene
rgy
per
upda
te (
Joul
es)
Deadline (sec)
TailEnderDefault
Figure 15: Newsfeed: The energyconsumption of TailEnder and De-fault for varying deadline over 3G
0
1
2
3
4
5
6
0 500 1000 1500 2000 2500 3000 3500
Ene
rgy
per
upda
te (
Joul
es)
Deadline (sec)
TailEnderDefault
Figure 16: News feed: The energyconsumption of TailEnder and De-fault for varying deadline over GSM
0
20
40
60
80
100
0 1 2 3
% e
nerg
y im
prov
emen
t
User
IncomingOutgoing
Figure 17: Email: Energy improve-ment using TailEnder for email ap-plication
0
0.5
1
1.5
2
2.5
3
0 100 200 300 400 500 600 700 800 900
Ene
rgy
per
emai
l (Jo
ules
)
Deadline (sec)
TailEnderDefault
Figure 18: Email: The energy con-sumption of TailEnder and Defaultfor varying deadline over 3G
0
0.2
0.4
0.6
0.8
1
1.2
0 100 200 300 400 500 600 700 800 900
Ene
rgy
per
emai
l (Jo
ules
)
Deadline (sec)
TailEnderDefault
Figure 19: Email: The energy con-sumption of TailEnder and Defaultfor varying deadline over GSM
Web search applications respectively. We assume that theWiFi interface is switched on only when WiFi is available,to avoid unnecessary scanning. Related work [21] show thatWiFi availability can be predicted accurately, especially instationary scenarios.
Keeping the WiFi interface on incurs a maintenance en-ergy, as we observe in our measurement study (see Table 1).Therefore, our algorithm switches the WiFi interface off xseconds after a transfer if no data packet arrives. We estimatex as the ratio of the energy required for scanning/associationand the per-second maintenance energy.
When WiFi is always available, the energy consumption is10 times lower compared to Default and more than 4 timeslower compared to TailEnder for all three applications. Evenwhen WiFi is available only 50% of the time, sending dataover WiFi reduces energy consumption by 3 times comparedto Default for all three applications. Previous works [21] donot observe such substantial energy savings when using WiFito augment cellular networks. The primary reason is that pre-vious studies are based on the GSM network. However, 3Gconsumes more energy than WiFi, even when accounting forthe WiFi scan and association costs. Therefore, opportunisticusage of WiFi can provide substantial energy benefits.
5.3 Experiments on the mobile phoneWe conduct data transfer experiments on the phone using
application-level traces. We convert an application traceinto a sequence of transfers S = {< s1, a1 >, < s2, a2 >, · · · , < sn, an >}, such that data of size si is downloadedby the mobile phone at time ai. Then, from a fully charged
state, we repeatedly run this sequence of transfers until thebattery drains completely.
We run two sequences of transfer, one generated by TailEn-der and the other by Default. Given an application trace,TailEnder schedules the transfers according to whether theapplication is delay tolerant or can benefit from prefetching.Default schedules transfers as they arrive. We conduct theexperiments for two applications: downloading Tech newsfeeds and Web search. For the news feed application, themetric is the number of stories downloaded and for Websearch the metric is the number of queries for which all userrequested documents were delivered.
Table 4 shows the results of the news feeds experiment.TailEnder downloads more than 60% news feed updates com-pared to Default, and the total size of data downloaded byprotocol increases from 127 MB to 240 MB providing a47% improvement. Our model-based evaluation showed thatfor the Tech news feed, TailEnder reduces energy by 52%compared to Default.
Default TailEnderStories 1411 3900
Total transfer size 127 MB 240 MB
Table 4: News feeds experiment. TailEnder downloadsmore than twice as many news feeds compared to De-fault
Table 5 shows results for the Web search experiment. Byprefetching, TailEnder sends responses to 50% more queries
12

0 1 2 3 4 5 6 7 8 9
10
0 0.1 0.2 0.3 0.4 0.5 0.6 0.7 0.8 0.9 1
Ene
rgy
per
upda
te (
Joul
es)
Fraction WiFi Availability
TailEnder+WiFiTailEnder
Default
Figure 22: News feed. Verticalbars show 95% confidence interval
0
0.5
1
1.5
2
2.5
3
3.5
0 0.1 0.2 0.3 0.4 0.5 0.6 0.7 0.8 0.9 1
Ene
rgy
per
emai
l (Jo
ules
)
Fraction WiFi Availability
TailEnder+WiFiTailEnder
Default
Figure 23: E-mail. Vertical barsshow 95% confidence interval
0
10
20
30
40
50
0 0.1 0.2 0.3 0.4 0.5 0.6 0.7 0.8 0.9 1
Ene
rgy
per
quer
y (J
oule
s)
Fraction WiFi Availability
TailEnder+WiFiTailEnder
Default
Figure 24: Web Search. Verticalbars show 95% confidence interval
0
20
40
60
80
100
% e
nerg
y im
pro
vem
ent
Wireless technology
3G
GSM
Figure 20: Web search: Energy im-provement using TailEnder for Websearch over 3G and GSM
0 0.1 0.2 0.3 0.4 0.5 0.6 0.7 0.8 0.9
1
0 10 20 30 40 50 60 70 80 90
Fra
ctio
n of
que
ries
% Energy improvement
Figure 21: Web search: CDF of theEnergy improvement using TailEn-der for each query
for the same amount of energy and the average number oftransfers decreases by 45%. Prefetching is energy efficient,even though it sends ten times more data for each transferon an average. Our model-driven evaluation showed that forWeb search, TailEnder decreases energy consumption by 40%compared to Default.
Default TailEnderQueries 672 1011
Documents 864 10110Transfers 1462 1011
Average transfers per query 9.3K 147.5K
Table 5: Web search experiment. TailEnder downloads50% more queries compared to Default
6. CONCLUSIONS
Energy on mobile phones is a precious resource. As phonesequipped with multiple wireless technologies such as 3G,GSM, and WiFi become commonplace, it is important tounderstand their relative energy consumption characteristics.To this end, we conducted a detailed measurement study andfound a significant tail energy overhead in 3G and GSM. Wedeveloped a measurement-driven model of energy consump-tion of network activity for each technology.
Informed by the model, we develop TailEnder, a protocolthat provably minimizes energy consumption while meetinguser-specified delay-tolerance deadlines. For applicationsthat can benefit from prefetching, TailEnder aggressivelyprefetches data, including potentially useless data, and yetreduces the overall energy consumed. We evaluate the perfor-mance of TailEnder for three case study applications—email,news feeds, and web search—based on real user logs andfind significant savings in energy in each case. Experimentsconducted on the mobile phone shows that TailEnder candownload 60% more news feed updates and download searchresults for more than 50% of web queries, compared to usingthe default policy. Our model-driven simulation shows thatTailEnder can reduce energy by 35% for email applications,52% for news feeds and 40% for web search.
APPENDIXHere we provide optimality analysis for TailEnder. We firstprove that any online algorithm can at most be 1.28 com-petitive with an optimal offline algorithm. Next, we provethat the online algorithm TailEnder(SCHED) we describe inFigure 10 achieves this competitive ratio;
Let OPT be an optimal adversary that has complete knowl-edge of packet arrivals. OPT schedules transmissions tominimize Z, the time spent by the mobile device in the highpower state. Let T be the Tail time.
THEOREM 1. Any online algorithm ALG can at most be1.28-competitive with the offline adversary, OPT, with respectto the time spent in the high energy state.
PROOF. We prove the theorem by constructing the offlineadversary, OPT, that incrementally generates new requestsafter observing the actions of ALG. OPT generates a newrequest at time x · T after the ALG schedules a previousrequest. We show that Z(ALG)
Z(OPT ) is maximized when x is set to0.57; in other words, when OPT generates a new request at0.57T after ALG schedules a request, OPT can force the ALG
13

schedule to remain in the high power state for the longesttime compared to its own schedule.
Let the first request be r1 = (a1, d1) and let both ALGand OPT schedule to transmit r1 at time s1. As a first step,OPT generates a second request r2 = (a2, d2), where a2 =s1 + x · T and d2 � T .
ALG can schedule r2 in the following ways:Choice 1: If ALG schedules r2 at a2, ALG remains in
the high power state for x · T time units. In response, OPTgenerates a third request r3 = (a3, d3) such that a3 = d2.OPT schedules the transmission of r2 and r3 at d2. ThereforeZ(OPT ) = 2T . ALG is forced to schedule r3 at some timebetween a3 and d3, incurring an overhead of T . In total,Z(ALG) = (2 + x) · T and Z(OPT ) = 2T .
Choice 2: If ALG schedules r2 at d2, OPT schedules r2
at a2 and generates no more requests. Therefore Z(ALG) =2T while Z(OPT ) = (1 + x) · T .
Choice 3: If ALG schedules r2 at time s2, where a2 <s2 < d2, OPT generates a third request r3 = (a3, d3) suchthat a3 = d2 (as in Choice 1). Thus, using the same argumentas Choice 1, Z(OPT ) = 2T , while Z(ALG) ≥ (2 + x) · T .
The competitive ratio for the different choices is
Z(ALG)Z(OPT )
=2 + x
2(Choices 1 & 3)
=2
(1 + x)(Choice 2) (1)
The lower bound of the competitive ratio is min( 2+x2 , 2
(1+x) ).We compute the value of x that maximizes the lower boundof the competitive ratio by solving:
2 + x
2=
2(1 + x)
(2)
Solving Eq. 2, we get x = 0.57 and plugging it in Eq. 1,we get Z(ALG)
Z(OPT ) = 1.28; i.e., when OPT introduces a newrequest at time 0.57T after the previous schedule, ALG isforced to be in the high energy state 1.28 times longer thanOPT for any choice it makes. If x > 0.57, then ALG canschedule according to Choice 2 and reduce the competitiveratio to less than 1.28. Similarly, if x < 0.57, then ALG canschedule according to Choice 1 and reduce the competitiveratio.
In summary, OPT can generate new requests such thatALG is forced to be in the high energy state 1.28 times longerthan OPT. Therefore any online algorithm ALG can at mostbe 1.28 competitive with an offline adversary.
THEOREM 2. SCHED is 1.28-competitive with the offlineadversary OPT with respect to the time spent in the highenergy state.
PROOF. Let the set of incoming requests be r1, r2 · · · rm.Construction: We first construct a sequence S =
{a′1, d′1, a′2, d′2 · · · } as follows. a′i is the arrival time of arequest ri that occurs after the previous deadline d′i−1 such
Time
a!1
a!2 d!
2d!1
< T > T
a!k+1a!
k d!kd!k"1
Figure 25: Construction for Theorem 2.
that, of all arrivals that occur after d′i−1, a′i has the earliestdeadline. The deadline for ri is d′i+1. By definition, thesequence S is an alternating sequence of a′i and d′i. Figure 25shows an example construction.
Let a′k be the first arrival time, such that a′k−1 occurs morethan T time units after a′k. If no such request exists, then weset a′k to be the last arrival time in the sequence.
It is easy to show that both SCHED and OPT schedule thefirst request at its deadline. For simplicity, let the first requestbe scheduled at time 0.
Claim 1: Z(OPT ) ≥ a′k + TSince an arrival a′j is at most T time units from the subse-
quent arrival a′j+1 for j < k, the interspersed deadlines arealso at most T time units apart. The first request is scheduledat its deadline. Therefore, the schedule of the first request andthe deadline of the second request are at most T time unitsapart, and so on. This implies that the device remains in thehigh power state at least until a′k. The request that arrives ata′k is scheduled after its arrival, and remains in the high powerstate for at least T time units. Therefore, Z(OPT ) ≥ a′k +T .
Claim 2: Z(SCHED) ≤ a′k + 1.43T .Two cases can occur.Case 1: If a′k < d′k−1 + 0.57T , SCHED transmits the
request rk, and Z(SCHED) = a′k + TCase 2: If a′k > d′k−1 + 0.57T , then SCHED transfers
request rk at its deadline d′k−1, and remains in the high energystate for at most T time units. SCHED schedules the firstk− 1 requests and incurs an overhead of at most a′k + 0.43T .Note that the latest that SCHED can schedule request rk−1
is at its deadline d′k−1. Since, a′k is at a distance of at least0.57T from d′k−1, the device remains in the high power statefor at most 0.43T time units after a′k. Adding together, weget Z(SCHED) ≤ a′k + 1.43T .
If Case 1 occurs Z(OPT ) = Z(SCHED).If Case 2 occurs, note that a′k ≥ 0.57T , since a′k is at least
0.57T time units from d′k−1. Therefore, Z(SCHED) ≤0.57T + 1.43T and Z(OPT ) ≥ 0.57T + T and Z(SCHED)
Z(OPT )
is at most 1.28. We can repeat this argument for requestsfrom rk+1, · · · rm.
Therefore, SCHED is 1.28 competitive with OPT.
A. REFERENCES[1] 3g: Wikipedia.
http://en.wikipedia.org/wiki/3G.[2] International telecommunication union press release.
14

http://www.itu.int/newsroom/press_releases/2008/29.html.
[3] Third generation partnership project 2 (3gpp2).http://www.3gpp2.org.
[4] Third generation partnership project (3gpp).http://www.3gpp.org.
[5] Y. Agarwal, R. Chandra, A. Wolman, P. Bahl, K. Chin,and R. Gupta. Wireless wakeups revisited: energymanagement for voip over wi-fi smartphones. InMobiSys ’07: Proceedings of the 5th internationalconference on Mobile systems, applications andservices, pages 179–191, New York, NY, USA, 2007.ACM.
[6] T. Armstrong, O. Trescases, C. Amza, and E. de Lara.Efficient and transparent dynamic content updates formobile clients. In MobiSys ’06: Proceedings of the 4thinternational conference on Mobile systems,applications and services, pages 56–68, New York, NY,USA, 2006. ACM.
[7] J. Augustine, S. Irani, and C. Swamy. Optimalpower-down strategies. In FOCS ’04: Proceedings ofthe 45th Annual IEEE Symposium on Foundations ofComputer Science, pages 530–539, Washington, DC,USA, 2004. IEEE Computer Society.
[8] A. Balasubramanian, B. N. Levine, andA. Venkataramani. Enabling Interactive Applications inHybrid Networks. In Proc. ACM Mobicom, September2008.
[9] N. Banerjee, J. Sorber, M. D. Corner, S. Rollins, andD. Ganesan. Triage: balancing energy and quality ofservice in a microserver. In MobiSys ’07: Proceedingsof the 5th international conference on Mobile systems,applications and services, pages 152–164, New York,NY, USA, 2007. ACM.
[10] P. Baptiste. Scheduling unit tasks to minimize thenumber of idle periods: a polynomial time algorithmfor offline dynamic power management. In SODA ’06:Proceedings of the seventeenth annual ACM-SIAMsymposium on Discrete algorithm, pages 364–367, NewYork, NY, USA, 2006. ACM.
[11] X. Chuah, M.; Wei Luo; Zhang. Impacts of inactivitytimer values on umts system capacity. In WirelessCommunications and Networking Conference (2002),volume 2, pages 897–903. IEEE, 2002.
[12] E. D. Demaine, M. Ghodsi, M. T. Hajiaghayi, A. S.Sayedi-Roshkhar, and M. Zadimoghaddam. Schedulingto minimize gaps and power consumption. In SPAA ’07:Proceedings of the nineteenth annual ACM symposiumon Parallel algorithms and architectures, pages 46–54,New York, NY, USA, 2007. ACM.
[13] A. Gupta and P. Mohapatra. Energy consumption andconservation in wifi based phones: Ameasurement-based study. In Sensor and Ad HocCommunications and Networks (SECON), pages121–131, Washington, DC, USA, 2007. IEEEComputer Society.
[14] S. Irani, S. Shukla, and R. Gupta. Algorithms for powersavings. In SODA ’03: Proceedings of the fourteenthannual ACM-SIAM symposium on Discrete algorithms,pages 37–46, Philadelphia, PA, USA, 2003. Society forIndustrial and Applied Mathematics.
[15] Z. Jiang and L. Kleinrock. Web prefetching in a mobileenvironment. In IEEE Personal Communications,volume 5, pages 25–34, September, 1998.
[16] C.-C. Lee, J.-H. Yeh, and J.-C. Chen. Impact ofinactivity timer on energy consumption in wcdma andcdma2000. In Proceedings of the Third Annual WirelessTelecommunication Symposium (WTS). IEEE, 2004.
[17] X. Liu, A. Sridharan, S. Machiraju, M. Seshadri, andH. Zang. Experiences in a 3g network: interplaybetween the wireless channel and applications. InMobiCom ’08: Proceedings of the 14th ACMinternational conference on Mobile computing andnetworking, pages 211–222, New York, NY, USA,2008. ACM.
[18] J. Nurminen, J.K.; Noyranen. Energy-consumption inmobile peer-to-peer - quantitative results from filesharing. In Consumer Communications and NetworkingConference (CCNC), pages 729–733, Washington, DC,USA, 2008. IEEE Computer Society.
[19] V. Padmanabhan and J. Mogul. Using PredictivePrefetching to Improve World Wide Web Latency. InProc. ACM Sigcomm, pages 22–36, July 1996.
[20] T. Pering, Y. Agarwal, R. Gupta, and R. Want.Coolspots: Reducing the power consumption ofwireless mobile devices with multiple radio interfaces.In MobiSys 2006: Proceedings of the 4th internationalconference on Mobile systems, applications andservices, pages 220–232, New York, NY, USA, June2006. ACM Press.
[21] A. Rahmati and L. Zhong. Context-for-wireless:context-sensitive energy-efficient wireless data transfer.In MobiSys ’07: Proceedings of the 5th internationalconference on Mobile systems, applications andservices, pages 165–178, New York, NY, USA, 2007.ACM.
[22] Y. Xiao, R. S. Kalyanaraman, and A. Yla-Jaaski.Energy consumption of mobile youtube: Quantitativemeasurement and analysis. In NGMAST ’08:Proceedings of the 2008 The Second InternationalConference on Next Generation Mobile Applications,Services, and Technologies, pages 61–69, Washington,DC, USA, 2008. IEEE Computer Society.
[23] J.-H. Yeh, J.-C. Chen, and C.-C. Lee. Comparativeanalysis of energy-saving techniques in 3gpp and 3gp2systems. In Transactions on Vehicular Technology,volume 58, pages 432–448. IEEE, 2009.
15