energy audit guidelines for industrial sectors
TRANSCRIPT
i
Government of Nepal
Water and Energy Commission Secretariat
Singha Durbar, Kathmandu
Energy Audit Guidelines for Industrial
Sectors
GIEF Consultancy Pvt. Ltd.
Gaushala-8, Kathmandu
Phone/Fax: 01-5186308
www.giefnepal.com
Ashwin, 2077

Energy Audit Guidelines for Industrial Sectors
i
PREFACE
The Water and Energy Commission Secretariat (WECS) works in the field of collection and
analysis of the energy related data in Nepal. The Energy Division of the secretariat, in
particular, has been doing such data collection, analysis and future planning of the energy
sector. With immense efforts and resources, WECS prepared National Energy Strategy in April
2013, Energy Sector Vision 2050 A.D. in November 2013 and Energy Sector Synopsis report.
In both of these documents, energy demand has been forecasted. The energy demand forecast
is necessary for the future energy planning of the country.
In order to meet the energy requirement, efficient use of energy in all sectors of economy
should be ensured. Keeping this in mind, WECS has prepared Energy Audit Guidelines of
Industrial sectors. This is expected to help all sectors covered under this program to reduce
their energy demand by adopting energy efficient methods in their activities.
Various studies in different countries have shown that significant energy efficiency
improvement opportunities exist in the industrial sector, many of which are cost-effective.
These energy efficiency options include both cross-cutting as well as sector-specific measures.
However, industrial infrastructures are not always aware of energy efficiency improvement
potentials. Conducting an energy audit is one of the first steps in identifying these potentials.
Even so, many industrial sectors do not have the capacity to conduct an effective energy audit.
The government of Nepal policies and programs aim to assist industrial sectors to improve
competitiveness through increased energy efficiency. However, usually only limited technical
and financial resources for improving energy efficiency are available, especially for small and
medium-sized industrial entities.
This energy audit guideline is intended to provide guideline for energy auditors, energy
managers and all stakeholders involved in energy conservation activities in industrial sectors,
regarding the key elements for preparing for an energy audit, conducting an inventory and
measuring energy use, analyzing energy bills, benchmarking, analyzing energy use patterns,
identifying energy efficiency opportunities, conducting cost-benefit analysis, preparing energy
audit reports and undertaking post-audit activities. The guideline will assist energy auditors to
follow systematic ways to conduct energy audits of industries without any difficulties.

Energy Audit Guidelines for Industrial Sectors
ii
SUMMARY
Energy Audit Guidelines for industrial sectors is intended to guide the process of identifying
and implementing energy saving opportunities that may exist in the industries. It also aims to
raise awareness of managers and general public along with providing useful inputs about
energy efficient appliances and available technologies. The adoption of guideline will help to
achieve reduction in energy use in systematic way, identifying and implementing energy
savings opportunities and achieving energy efficiency as well as make better use of energy
consuming assets. The guideline provides step by step advice for industries to develop strategy
to identify energy efficiency opportunities and development of action plans to implement the
options. The Energy Audit Guidelines may also be used by national institutions to recommend
strategies, policies, and measures to strengthen the institutional arrangements and capacities of
the national institutions working in the development, implementation and promotion of energy
efficiency.
The main purpose of the Energy Audit Guidelines for Industrial Sectors is to provide
supervision in the identification and implementation of energy saving opportunities that may
exist in the industrial sectors. It further aims to raise awareness about energy efficient
appliances and available technologies and provide useful inputs to the owners/managers and
general public. The implementation of this guideline will help achieve systematic reduction in
energy use, identify and implement energy savings opportunities and achieve energy efficiency
and make use of energy consuming appliances efficiently.
For preparation of energy guidelines for industrial sector, first of all baseline of energy
consumption of industries were established by energy audit in the selected units. A total of 29
industries i.e. 4 cement, 4 steel rolling mills, 4 brick kilns, 4 sugar, 4 dairy, 2 beverage, 4
noodles making and 3 pulp & paper industries. The energy consumption of selected industries
was obtained, and the specific energy consumption were obtained. Review of national, regional
and global practices were done along with review of the best available energy efficient
technologies. During the process, areas for improvement and energy efficiency options were
identified. There are ample opportunities for improvement of energy efficiency through
implementation of low and no cost measures. Some recommendations for specific industrial
sectors have been provided along with other recommendations for overall all industrial sectors
based on the observation during the field visit. With the adoption of the provided measures, the
industries can move towards achieving energy efficiency. The guideline also includes the
information sheets, formulae for calculation and outline on preparing energy audit report.

Energy Audit Guidelines for Industrial Sectors
iii
ACKNOWLEDGEMENT
Water and Energy Commission Secretariat is thankful to related industrial sectors for their
involvement in the preparation of “Energy Audit Guidelines for Industrial sectors”. This project
wouldn’t have been possible without their cooperation.
The Secretariat is grateful to all the team members for their contribution during field visit and
preparation of this report. The Secretariat is indebted to the organizations, experts and
individuals for their feedbacks and suggestions during the report preparation. Besides these,
the Secretariat is also more thankful to the experts from different organizations and authors of
various documents, who have been consulted during the work.
Water and Energy Commission Secretariat would like to express its sincere gratitude to GIEF
Consultancy Pvt. Ltd. and the experts involved in the preparation of “Energy Audit Guidelines
for Industrial Sectors”.
Water and Energy Commission Secretariat
Singhadurbar, Kathmandu
Ashwin, 2077 B.S.

Energy Audit Guidelines for Industrial Sectors
iv
TABLE OF CONTENT
PREFACE ................................................................................................................................................ i
SUMMARY ............................................................................................................................................ ii
ACKNOWLEDGEMENT ..................................................................................................................... iii
TABLE OF CONTENT ......................................................................................................................... iv
LIST OF TABLES ................................................................................................................................. ix
LIST OF FIGURES ................................................................................................................................ x
ABBREVIATIONS ............................................................................................................................... xi
CHAPTER 1: INTRODUCTION ........................................................................................................... 1
1.1 Background of Energy Audit Guideline ................................................................................. 1
1.2 Types of Energy Used in Industrial Sectors ............................................................................ 1
1.3 Past and Ongoing Energy Efficiency Activities in Nepal ....................................................... 2
1.4 Policies and Legislation related to Energy Efficiency in Nepal ............................................. 2
1.4.1 Industrial Enterprises Act, 2076 ...................................................................................... 2
1.4.2 Industrial Policy, 2067 .................................................................................................... 2
1.4.3 National Energy Efficiency Strategy, 2075 .................................................................... 2
1.4.4 Bioenergy Strategy, 2073 ................................................................................................ 3
CHAPTER 2: ENERGY AUDIT AND ENERGY AUDIT METHODOLOGY ................................... 4
2.1 Energy Audit ........................................................................................................................... 4
2.2 Benefit of Energy Audit .......................................................................................................... 4
2.3 Types of Energy Audit ............................................................................................................ 5
2.4 Energy Audit Methodology .................................................................................................... 5
2.4.1 Preliminary Energy Audit Methodology ......................................................................... 6
2.4.2 Detailed Energy Audit Flow Chart ................................................................................. 6
2.5 Specific Energy Consumption (SEC) Calculation .................................................................. 9
CHAPTER: 3 ENERGY AUDIT GUIDELINES OF INDUSTRIAL SECTOR .................................. 10
3.1 BRICK KILNS ...................................................................................................................... 10
3.1.1 Brick Kilns in Nepal ..................................................................................................... 10
3.1.2 Energy Use in Nepalese Brick Kilns ............................................................................. 10
3.1.3 Specific Energy Consumption (SEC) in Brick Sector .................................................. 10
3.1.4 General Process Flow Chart .......................................................................................... 11
3.1.5 Process Description ....................................................................................................... 12
3.1.6 Significant energy used area and equipment in brick kiln ............................................ 12
3.1.7 Sampling and measurement for energy audit ................................................................ 12
3.1.8 Potential Energy Conservation Opportunity in Brick Kiln ........................................... 13
3.2 CEMENT MANUFACTURING .......................................................................................... 14
3.2.1 Cement Industries in Nepal ........................................................................................... 14
3.2.2 Energy Use in Nepalese Cement Industries .................................................................. 14
3.2.3 Specific Energy Consumption (SEC) in Cement Sector ............................................... 15

Energy Audit Guidelines for Industrial Sectors
v
3.2.4 General Process Flow Chart .......................................................................................... 16
3.2.5 Process Description ....................................................................................................... 17
3.2.6 Significant energy used area and equipment in cement industries ................................ 19
3.2.7 Sampling and measurement for energy audit ................................................................ 19
3.2.8 Potential Energy Conservation Opportunity in Cement Industries ............................... 20
3.3 DAIRY INDUSTRIES .......................................................................................................... 21
3.3.1 Dairy Industries in Nepal .............................................................................................. 21
3.3.2 Energy Use in Nepalese Dairy Industries ..................................................................... 21
3.3.3 Specific Energy Consumption (SEC) in Dairy Sector .................................................. 21
3.3.4 General Process Flow Chart .......................................................................................... 22
3.3.5 Process Description ....................................................................................................... 22
3.3.6 Significant Energy used area and equipment in Dairy Industries ................................. 23
3.3.7 Sampling and measurement for energy audit ................................................................ 23
3.3.8 Potential Energy Conservation Opportunity in Dairy Industries .................................. 24
3.4 NOODLES MAKING INDUSTRIES .................................................................................. 26
3.4.1 Noodles Manufactures in Nepal .................................................................................... 26
3.4.2 Energy Use in Nepalese Noodle Making Industries ..................................................... 26
3.4.3 Specific Energy Consumption (SEC) in Noodle Making Sector .................................. 26
3.4.4 General Process Flow Chart .......................................................................................... 27
3.4.5 Process Description ....................................................................................................... 28
3.4.6 Significant energy used area and equipment in noodles making industries .................. 28
3.4.7 Sampling and measurement for energy audit ................................................................ 28
3.4.8 Potential energy conservation opportunity in noodle making industries ...................... 29
3.5 NON-ALCOHOLIC BEVERAGE INDUSTRIES ............................................................... 31
3.5.1 Non-Alcoholic Beverage Industries in Nepal ............................................................... 31
3.5.2 Energy Use in Nepalese Non-Alcoholic Beverage Industries ...................................... 31
3.5.3 Specific Energy Consumption (SEC) in Non-Alcoholic Beverage Sector ................... 31
3.5.4 General Process Flow Chart .......................................................................................... 31
3.5.5 Process Description ....................................................................................................... 32
3.5.6 Significant energy used area and equipment in non-alcoholic beverages ..................... 32
3.5.7 Sampling and measurement for energy audit ................................................................ 32
3.5.8 Potential Energy Conservation Opportunity in Non-Alcoholic Beverage Industry ...... 34
3.6 PULP AND PAPER INDUSTRIES ..................................................................................... 35
3.6.1 Pulp and Paper Making Industries in Nepal .................................................................. 35
3.6.2 Energy Use in Nepalese Pulp and Paper Industries ...................................................... 35
3.6.3 Specific Energy Consumption (SEC) in Pulp and Paper Sector ................................... 35
3.6.4 General Process Flow Chart .......................................................................................... 35
3.6.5 Process Description ....................................................................................................... 37
3.6.6 Significant energy used area and equipment in pulp and paper industries ................... 38

Energy Audit Guidelines for Industrial Sectors
vi
3.6.7 Sampling and measurement for energy audit ................................................................ 38
3.6.8 Potential Energy Conservation Opportunity in Pulp and Paper Industries ................... 39
3.7 STEEL RE-ROLLING MILLS ............................................................................................. 40
3.7.1 Steel Re-rolling Mills in Nepal ..................................................................................... 40
3.7.2 Energy Use in Nepalese Steel Re-Rolling Industries .................................................... 40
3.7.3 Specific Energy Consumption (SEC) in Steel Re-Rolling Industry Sector .................. 40
3.7.4 General Process Flow Chart .......................................................................................... 41
3.7.5 Process Description ....................................................................................................... 41
3.7.6 Significant energy used area and equipment in steel re-rolling mills ........................... 43
3.7.7 Sampling and measurement for energy audit ................................................................ 43
3.7.8 Potential Energy Conservation Opportunity in Steel Re-Rolling Mills ........................ 44
3.8 SUGAR MILLS .................................................................................................................... 45
3.8.1 Sugar Mills in Nepal ..................................................................................................... 45
3.8.2 Energy Use in Nepalese Sugar Industries ..................................................................... 45
3.8.3 Specific Energy Consumption (SEC) in Sugar Sector .................................................. 45
3.8.4 General Process Flow Chart .......................................................................................... 46
3.8.5 Process Description ....................................................................................................... 47
3.8.6 Significant Energy used area and equipment in Sugar Industries ................................. 49
3.8.7 Sampling and measurement for energy audit ................................................................ 50
3.8.8 Potential Energy Conservation Opportunity in Sugar Industries .................................. 50
3.8.9 Benefits of Cogeneration in Sugar Industries ............................................................... 51
CHAPTER 4: ENERGY CONSERVATION OPPORTUNITIES IN INDUSTRIAL SECTORS ....... 53
4.1 Electrical load and demand management .............................................................................. 53
4.2 Power factor management ..................................................................................................... 54
4.3 Improvement of operational performance of electric motor ................................................. 54
4.3.1 Motor System Maintenance .......................................................................................... 54
4.3.2 Maintain supply voltage close to rated specification .................................................... 54
4.3.3 Minimize Rewinding Losses ......................................................................................... 55
4.3.4 Optimize transmission efficiency by use of efficient belts and gears ........................... 55
4.3.5 Optimize motor loading ................................................................................................ 55
4.3.6 Speed control of induction motors ................................................................................ 55
4.4 Improvement of lighting performance .................................................................................. 56
4.5 Opportunities in Compressed Air System ............................................................................. 56
4.5.1 Cool air intake ............................................................................................................... 56
4.5.2 Dust free air intake ........................................................................................................ 56
4.5.3 Dry air intake ................................................................................................................ 56
4.5.4 Reducing delivery pressure ........................................................................................... 56
4.5.5 Avoiding Misuse of Compressed Air ............................................................................ 57
4.5.6 Avoid Air Leaks ............................................................................................................ 57

Energy Audit Guidelines for Industrial Sectors
vii
4.5.7 Heat recovery ................................................................................................................ 57
4.6 Opportunities in Boiler and Steam System ........................................................................... 57
4.7 Refrigeration and air-conditioning system ............................................................................ 58
4.7.1 Vapour Compression type ............................................................................................. 58
4.7.2 Vapor Absorption Type ................................................................................................ 59
4.8 Opportunities in Fans and Blowers ....................................................................................... 61
4.9 Opportunities in Pumping System ........................................................................................ 62
4.10 Opportunities in process and Heat Recovery (Boiler) .......................................................... 63
4.11 Benefits of FD & ID Fan in Boiler ....................................................................................... 63
4.12 Firing optimization and better operating practices (Brick Kiln) ........................................... 63
4.13 Reduction of Fuel Consumption ........................................................................................... 68
4.14 Energy Management and Process Control in Grinding (Cement) ......................................... 70
4.15 Improved Grinding Media for Ball Mills .............................................................................. 70
4.16 Replacing a Ball Mill with Vertical Roller Mill ................................................................... 70
4.17 High Pressure Roller Press and Pre-Grinding to Ball Mill ................................................... 70
4.18 Low Temperature Waste Heat Recovery for Power Generation ........................................... 71
4.19 Blended Cement .................................................................................................................... 71
4.20 Kiln Shell Heat Loss Reduction (Improved Refractories) .................................................... 72
4.21 Use of Alternative Fuels ....................................................................................................... 72
4.22 Energy Management and Process Control Systems in Clinker Making ............................... 72
4.23 Optimize Heat Recovery/Update Clinker Cooler. ................................................................ 73
4.24 Opportunities in Furnace ....................................................................................................... 73
4.25 Furnace Efficiency ................................................................................................................ 77
CHAPTER 5: PREPARING ENERGY AUDIT REPORT .................................................................. 78
5.1 Cost Benefit Analysis ........................................................................................................... 78
ANNEXES ............................................................................................................................................ 80
Annex 1: Conversion Factors ............................................................................................................ 80
Annex 2: Energy Audit Report format for Industrial Sectors ........................................................... 81
Annex 3: Equipment needed for Energy Audit ................................................................................. 85
Annex 4: Safety consideration during energy audit .......................................................................... 88
Annex 5: Baseline Data Collection Format ...................................................................................... 89
Annex 6: Boiler efficiency calculation by direct and indirect methods ............................................ 91
Annex 7: Furnace Efficiency Direct & Indirect Method .................................................................. 99
Annex 8: Surface Heat Loss Calculation ........................................................................................ 103
Annex 9: Compressor Calculation .................................................................................................. 104
Annex 10: HVAC Calculation ........................................................................................................ 105
Annex 11: Pump Calculation .......................................................................................................... 107
Annex 12: Fan Calculation ............................................................................................................. 108
Annex 13: Methodology for calculating heat losses (Brick Kiln) .................................................. 110

Energy Audit Guidelines for Industrial Sectors
viii
Annex 14: Cooling Tower Performance. ........................................................................................ 111
Annex 15: Performance Calculation of Turbine ............................................................................. 112
Annex 16: Model Minutes for Energy Audit conduction ............................................................... 113
Annex 17: References ..................................................................................................................... 114
Energy Audit Guidelines for Industrial Sectors
ix
LIST OF TABLES
Table 3.1: Specific Energy Consumption in Brick Kiln ....................................................................... 11
Table 3.2: Energy conservation opportunities in brick kilns ................................................................ 13
Table 3.3: Specific Energy Consumption in Cement Industry ............................................................. 15
Table 3.4: Energy conservation opportunities in cement industries ..................................................... 20
Table 3.5: Specific Energy Consumption in Dairy ............................................................................... 21
Table 3.6: Energy conservation opportunities in dairy industries ......................................................... 24
Table 3.7: Specific Energy Consumption in Noodle Making Sector .................................................... 26
Table 3.8: Energy conservation opportunities in noodle making industries ......................................... 29
Table 3.9: Specific Energy Consumption in Non-Alcoholic Beverage ................................................ 31
Table 3.10: Energy conservation opportunities in non-alcoholic beverage industry ............................ 34
Table 3.11: Specific Energy Consumption in Pulp and Paper .............................................................. 35
Table 3.12: Energy conservation opportunity in pulp and paper industries.......................................... 39
Table 3.13: Specific Energy Consumption in Steel Re-Rolling Mills .................................................. 40
Table 3.14: Energy conservation opportunities in steel re-rolling mills ............................................... 44
Table 3.15: Specific Energy Consumption in Sugar Sector .................................................................. 45
Table 3.16: Energy conservation opportunities in sugar industries ...................................................... 50
Table 4.1: Electricity tariff (NEA) applicable to industrial sectors from Baiskh to Mangsir 074/75 ... 53
Table 4.2: Electricity tariff (NEA) applicable to industrial sectors from Poush to Chaitra 074/75 ...... 53
Table 4.3: Difference between Fans and Blowers ................................................................................ 62
Table 4.4: Potential causes of inefficiency and measures for improvement in Pumping System ......... 62
Table 4.5: Excess Air levels for different types of fuels ....................................................................... 74
Table 5.1: Energy Efficiency Options and Payback ............................................................................. 79
Table 5.2: Types and priority of energy saving measures .................................................................... 79

Energy Audit Guidelines for Industrial Sectors
x
LIST OF FIGURES
Figure 3.1: General process flow chart of brick kiln ............................................................................ 11
Figure 3.2: General process flow chart of Limestone based cement plant ........................................... 16
Figure 3.3: General process flow chart of clinker based cement plant ................................................. 17
Figure 3.4: General Milk Processing Flowchart ................................................................................... 22
Figure 3.5: General process flow chart of Noodle Making ................................................................... 28
Figure 3.6: General Flowchart Cola Product Production ...................................................................... 32
Figure 3.7: General process flow chart of Pulp and Paper .................................................................... 37
Figure 3.8: General Process flowchart of steel re-rolling mill .............................................................. 41
Figure 3.9: Sugar Production Process Flowchart .................................................................................. 47
Figure 3.10: Overview of Bagasse Cogeneration ................................................................................. 51
Figure 4.1: Boiler Efficiency Method ................................................................................................... 57
Figure 4.2: Schematic of a Basic Vapour Compression Refrigeration System .................................... 59
Figure 4.3: T-S and P-V diagram of Refrigeration cycle ...................................................................... 59
Figure 4.4: Schematic of a Basic Vapour Absorption Refrigeration System ........................................ 60
Figure 4.5: Existing Practices ............................................................................................................... 64
Figure 4.6: Recommended Practice ...................................................................................................... 64
Figure 4.7: Large Size Coal .................................................................................................................. 64
Figure 4.8: Recommended Smaller Size Coal ...................................................................................... 64
Figure 4.9: Convectional large size spoon ............................................................................................ 65
Figure 4.10: Recommended small size spoon ....................................................................................... 65
Figure 4.11: Fuel feeding pattern .......................................................................................................... 65
Figure 4.12: Conventional Fixed Chimney ........................................................................................... 66
Figure 4.13: Improved Fixed Chimney ................................................................................................. 66
Figure 4.14: Air flow diagram in brick kiln .......................................................................................... 66
Figure 4.15: Straight Line Brick Setting ............................................................................................... 67
Figure 4.16: Zigzag Brick Setting (Chamber system) .......................................................................... 67
Figure 4.17: Straight Air flow & Zig Zag Air flow .............................................................................. 67
Figure 4.18: Jute Tripal ......................................................................................................................... 67
Figure 4.19: Plastic sheet ...................................................................................................................... 68
Figure 4.20: Conventional type wicket wall ......................................................................................... 69
Figure 4.21: Recommended type wicket wall ....................................................................................... 69
Figure 4.22: Heat loss from Tawa ......................................................................................................... 70
Figure 4.23: Furnace Efficiency Methods ............................................................................................. 77

Energy Audit Guidelines for Industrial Sectors
xi
ABBREVIATIONS
% : Percent
A : Ampere
AC : Alternating Current/Air Conditioner
AEPC : Alternative Energy Promotion Center
APFC : Automatic Power Factor Control
APH : Air Pre Heater
APO : Asian Production Organization
AQC : Air Quenching Chamber
ASHRAE : American Society of Heating, Refrigerating, and Air-Conditioning
Engineer
ASME : American Society for Mechanical Engineer
BEE : Bureau of Energy Efficiency
BEP : Break Even Point
BPT : Boiling Point Temperature
BTK : Bull’s Trench Kiln
Ca(OH)2 : Calcium Hydroxide
CBS : Central Bureau of Statistics
CEO : Chief Executive Officer
CFL : Compact Fluorescent Lamp
CHP : Combined Heat & Power
CIPEC : Canadian Industry Program for Energy Conservation
CM : Centimeter
CM2 : Square Centimeter
CO : Carbon Monoxide
CO2 : Carbon dioxide
COC : Cycle of Concentration
COP : Coefficient of Performance
DANIDA : Danish International Development Agency
DC : Direct Current
DDC : Dairy Development Community
DEVC : Double Effect Vapour Cell
DG : Diesel Generator
EA : Energy Audit
ECO : Energy Conservation Opportunity
EEC : Energy Efficiency Center
ENCON : Energy Conservation
Energy Audit Guidelines for Industrial Sectors
xii
EnMS : Energy Management System
EPA : Energy Performance Assessment
EPI : Energy Performance Indicator
ESCO : Energy Service Company
ESPS : Environment Sector Program Support
FAD : Free Air Delivery
FBTK : Fixed Chimney Bull’s Trench
FD : Forced Draft
FO : Furnace Oil
FRP : Fiberglass Reinforced Plastic
FTL : Fluorescent Tube Lamps
GCV : Gross Calorific Value
GDP : Gross Domestic Product
GHG : Green House Gas
GIZ : German International Corporation
GJ : Gigajoule
GoN : Government of Nepal
HF : High Frequency
HID : High Intensity Discharge
HP : High Pressure/Horse Power
HPMV : High Pressure Mercury Vapour Lamp
HPSV : High Pressure Sodium Vapor
Hr : Hour
HVAC : Heating, Ventilation and Air Conditioner
ID : Induced Draft
IEE : Initial Environmental Examination
IEMP : Industrial Energy Management Project
IGEA : Investment Grade Energy Audit
IRR : Internal Rate of Return
ISO : International Organization for Standardization
k Cal : Kilo Calorie
Kg : Kilogram
kJ : Kilo Joules
KL : Kiloliter
KLPD : Kilo Liters Per Day
kV : Kilo Volt
KVA : Kilo Volt Ampere
Energy Audit Guidelines for Industrial Sectors
xiii
kWh : Kilowatt hour
LED : Light Emitting Diode
LOTO : Log Out Tag Out
M&E : Maintenance and Energy
M2 : Square Meter
M3 : Cubic Meter
MD : Metering Data
MG : Machine Glazed
MJ : Mega Joule
ML : Milliliter
mmWC : Water Column (Millimeter Gauge)
MoEWRI : Ministry of Energy, Water Resources and Irrigation
MOICS : Ministry of Industry, Commerce and Supplies
MPC : Milk Producer Cooperatives
MS : Mild Steel
MSG : Monosodium Glutamate
NEA : Nepal Electricity Authority
NEEAP : National Energy Efficiency Action Plan
NEEP : Nepal Energy Efficiency Program
NPR/NRs : Nepalese Rupees
NPV : Net Present Value
NS : Nepal Standard
O2 : Oxygen
oC : Degree Celsius
OEES : Office of Energy Efficiency Service
oF : Degree Fahrenheit
OPC : Ordinary Portland Cement
PF : Power Factor
pH : Potential of Hydrogen
PHE : Plate Heat Exchanger
PPC : Pozzolana Portland Cement
PPE : Personal Protective Equipment
PPM : Parts Per Millions
PSC : Pozzolana Slag Cement
PV : Photovoltaic
PVC : Polyvinyl Chloride
RE : Renewable Energy

Energy Audit Guidelines for Industrial Sectors
xiv
RO : Reverse Osmosis
RoI : Return of Interest
S. N./ S. No. : Serial number
SEC : Specific Energy Consumption
SEU : Specific Energy Use
SO2 : Sulphur Dioxide
SP : Suspension Preheater
SPM : Suspended Particulate Matter
TCD : Ton Crushing Per Day
TDS : Total Dissolved Solid
TMT : Thermo Mechanical Treatment
TPD : Tons Per Day
TR : Ton of Refrigeration
TSS : Total Suspended Solid
UNESCAP : United Nations Economic and Social Commission for Asia and the
Pacific
UNIDO : United Nations Industrial Development Organization
US : United State
VFD : Variable Frequency Drive
VRM : Vertical Roll Mill
VSBK : Vertical Shaft Brick Kiln
VSK : Vertical Shaft Kiln
W/P : Writing & Printing
WECS : Water and Energy Commission Secretariat
WHR : Waste Heat Recovery

Energy Audit Guidelines for Industrial Sectors
1
CHAPTER 1: INTRODUCTION
1.1 Background of Energy Audit Guideline
The basic purpose of the Energy Audit Guideline is to impart knowledge to industrial sectors
of Nepal on the benchmarking/energy audit/assessment process, and also to guide them on the
process of identifying and implementing energy saving opportunities that may exist in the
industrial sectors. The guideline also aims to provide useful inputs about energy efficient
equipment and technology relevant to industrial sectors.
In general, the key features of Energy Audit Guidelines for industrial sector include:
• Ways to achieve reduction in energy use and carbon emissions in a systematic way;
• Providing guidance on how to benchmark, measure, document and report energy use;
• Creating a clear picture of current energy use status, based on which new goals and targets
can be set;
• Evaluating and prioritizing the implementation of new energy-efficient technologies and
measures;
• Providing a framework to promote energy efficiency throughout the supply chain;
• Making better use of energy consuming assets, thus identifying potentials to reduce
maintenance costs or expand capacity;
• Provide useful inputs about available energy efficient equipment and technologies;
• Identifying and implementing energy saving opportunities;
• Demonstrating the stakeholders of the corporate commitment to comply with their best
practice to protect the environment;
• Fulfilling the associated regulatory requirements and responding with confidence to green
trade barriers in the global market.
The guideline provides step by step advice for industries to develop strategy to identify energy
efficiency opportunities and development of action plans to implement the options. The Energy
Audit Guidelines may also be used by national institutions to recommend strategies, policies,
and measures to strengthen the institutional arrangements and capacities of the national
institutions promoting energy efficiency. These guidelines provide inputs to concerned
decision-makers of national energy efficiency organizations on the path to be charted, the
process to be followed, and the synergy to be created among the various stakeholders in order
to realize the energy efficiency goals set by the respective governments. The guideline intends
to present an analytical framework which can be pursued to achieve energy efficiency goals. It
highlights the fact that energy efficiency promotion is a cyclic process. Irrespective of whatever
level of success a country/organization may have achieved, there is always scope for further
improvement as traditional barriers to energy efficiency are lifted, and there are further
technological innovations as energy price keeps rising. The analytical framework defines the
three pillars (Path, Partners and Process) that lay the foundation to a sustainable energy
efficiency action plan. Government officials concerned with the subject will be able to initiate
a gap analysis for assessing their present status in the cyclic process of energy efficiency
promotion.
1.2 Types of Energy Used in Industrial Sectors
Industrial sectors use both electrical and thermal energy. Electricity is supplied by Nepal
Electricity Authority (NEA), a government owned organization whereas major source of
thermal energy is imported from India and third countries. The petroleum products are
imported and distributed by Nepal Oil Corporation (NOC). The NOC is under Ministry of

Energy Audit Guidelines for Industrial Sectors
2
Industry, Commerce and Supplies (MOICS). Mainly used liquid thermal fuel are diesel and
furnace oil, which are imported from India.
1.3 Past and Ongoing Energy Efficiency Activities in Nepal
In Nepal, study related to energy efficiency was found to be started since 1985 but the dedicated
works started only from 1999 to 2005 A.D. In these years’ works such as energy audits of
industries, energy efficiency related trainings and increase in public awareness as well as
management of loans for energy efficiency in industries were carried out. Later from 2009 to
2011 some effective works such as demand side management of electricity, energy audit, study
of electricity load profile, preparation of policy suggestions for promotion of energy efficiency
as well as replacement of traditional bulbs with energy efficient bulbs were done under Nepal
Electricity Authority.
1.4 Policies and Legislation related to Energy Efficiency in Nepal
Article 51 (f) 3 of the constitution of Nepal has mentioned “ensuring reliable and affordable
energy supply and proper utilization of energy by generation and development of renewable
energy for the fulfillment of citizen’s basic needs.” Different acts, policies, regulations and
strategy related to energy efficiency are presented below:
1.4.1 Industrial Enterprises Act, 2076
Chapter 5, Article 24 “p” of this act states that “an industry is entitled to deduction for the
purpose of income tax of all expenses invested in machinery or equipment contributing to
reducing consumption of energy by enhancing energy efficiency”. Also, 29 “b” of the act states
that electricity generated by an industry for its own purpose is exempted from any fee or royalty
payable on it under the prevailing law” and 29 “c” states that “if an industry intends to sell
excess of electricity generated by it for its own purpose, it may be sold at the rate set by mutual
consent under the prevailing law”.
1.4.2 Industrial Policy, 2067
Objective 7.3 of Industrial Policy 2067 states that “To establish industrial entrepreneurship as
a sustainable and reliable sector by utilizing latest technology and environment friendly
production process”. Policies concerning the objective 7.3 are “Technical and financial
assistance shall be made available to the industries that use environment-friendly and energy
saving technology on their own costs” and “Special measures shall be taken to promote green
industries and to make the established industries pollution free and zero to carbon emission”.
Policy 17.11 states that “The expenses made by any industry in the machine or instrument that
help decrease consumption of energy, the capital expenses and technology and process for
installation of a system for pollution control and less impact in environment may be deducted
for the purpose of income tax. Such facility shall have to be utilized once or within a period of
five years” and Policy 17.32 states that “No royalty shall be charged on the electricity generated
by an industry for its own purpose. Moreover, if the industry desires to sell the electricity
energy, provision shall be made to allow the excess energy to the national greed at the
prevailing market rate”.
1.4.3 National Energy Efficiency Strategy, 2075
Government of Nepal, Ministry of Energy, Water Resources and Irrigation developed and
adopted the National Energy Efficiency Strategy, 2075. The goal of this strategy is to double
the average improvement rate if energy efficiency in Nepal from 0.84% per year, which existed
during the period of 2000 – 2015 AD to 1.68% per year in 2030. The main objectives of the
strategy are to reduce existing energy shortage, increase energy access and provide important

Energy Audit Guidelines for Industrial Sectors
3
contribution to energy security, maintain environmental balance and bring positive
improvements in health by efficient use of energy.
National Energy Efficiency Strategy emphasizes the following:
• Generate awareness on energy efficiency from the consumers’ level to policy makers’
level.
• Establish policy, legal and institutional frameworks for resource management, resource
mobilization, infrastructure development and human resource development required for
energy efficiency
• Develop national standards for energy efficiency based on the established international
and regional standards as well as to develop equipment and means for measuring energy
efficiency
• Make services and production cost effective and competitive by reducing energy
consumption needed for production of goods and services
• Reduce energy import by energy conservation
1.4.4 Bioenergy Strategy, 2073
The strategy aims to increase access to and contribute to environmental protection by
developing bio-energy, which has been in a traditional way, as modern, sustainable and clean
energy. The following strategies are outlined for a strategy to increase efficiency and
effectiveness in the production and use of bioenergy.
• To provide technical and financial assistance for research and study on modern
efficient, and affordable biomass energy technologies (biogas, ICS, gasifier, briquettes,
pellets, industrial boiler, cogeneration, waste to energy etc.) for determining their
feasibility, goals, quality control, emission standards, technology development and
improvements. • To carry out public awareness and promotional activities with the participation of local
stakeholders for effective and efficient use of biomass energy and for expansion of
modern, efficient and affordable technologies.
• To develop appropriate system and market for commercialization of biomass energy
and to ensure the sales and distribution of sales of the produced biomass energy and
hence benefit.

Energy Audit Guidelines for Industrial Sectors
4
CHAPTER 2: ENERGY AUDIT AND ENERGY AUDIT
METHODOLOGY
2.1 Energy Audit
An energy audit is a systematic identification of energy flow for energy conservation of any
energy using entity through survey and analysis. It helps the entity/facilities in understanding
their energy use, recognize the areas of high energy use, and identify opportunities in reducing
the high energy input/use without negatively affecting the output as well the quality of the
output. In other words, energy audit also helps in identification of potential energy saving
opportunities.
An energy audit is an important tool or method for finding such potentials for energy efficiency
measures and for assessing their financial viability, which can be carried out at different levels.
Energy audit can also verify the effectiveness of energy management opportunities after they
have been implemented.
Energy audit is also regarded as one of the tools of energy management system to attain the
objective of improved energy performance of the organization. It may be used in conjunction
with the EnMS or may be used independently. Energy audit has been defined by different
institutions in different ways with more or less the common view.
• In ISO 50002:2014, Energy audits requirements with guidance for use, ISO has defined
energy audit as a systematic analysis of energy use and energy consumption of audited
objects, in order to identify, quantify and report on the opportunities for improved energy
performance (ISO 2014).
• As per the National Energy Efficiency Strategy, 2075, Energy efficiency is the efficient
consumption of energy through the use of suitable tools, technologies or equipment’s related
to energy consumption. The state of energy efficiency can be measured by the energy
required to produce goods or services. Reducing the amount of energy required to produce
the right goods or services through the use of various methodology using different tools,
technologies or equipment’s is to increase the energy efficiency. Measuring the decreasing
rate of energy intensity is the average state of optical energy efficiency; which refers to the
declining energy consumption required to produce GDP.
The energy audit needs to be carried out under the supervision of experts, with better
understanding of energy audit making the audit more effective.
2.2 Benefit of Energy Audit
Several studies around the world have shown three major operating costs in any industrial
entity as energy, labor and materials. As the cost of energy has been constantly on the rise, it
is also the area for highest potential towards cost reduction. Such an audit will review variations
in energy costs, availability and reliability of supply of energy, decide on appropriate energy
mix, identify energy conservation technologies, retrofit for energy conservation equipment etc.
In general, energy audit is the translation of conservation ideas into realities by evolving
technically feasible solutions with economic and other organizational considerations within the
specified time frame.
Improving energy efficiency and conservation are essential to achieve economic and
environmental sustainability, especially in a developing economy like Nepal. The energy
consuming facilities are not always aware of energy-efficiency improvement potentials.
Following some set of rules and principles are essential to arrive at a systematic approach
towards realization of energy savings. Conducting an energy audit is one of the prime requisites
in identifying these potentials. Despite being aware of the usefulness of the energy efficiency,
Energy Audit Guidelines for Industrial Sectors
5
not all industries are financially and technically capable of undertaking the energy audit process
in a systematic way and therefore it requires to have guideline to assist the facilities towards
effective’s way of reducing energy use, increase energy efficiency.
The National Energy Efficiency Strategy, 2075 for Nepal has been approved by the cabinet
meeting of GON on 19th Nov 2018. In the section 9.3 of the strategy, development of national
standards for energy efficiency based on established international and regional standards as
well as development of equipment and means for measuring energy efficiency is clearly
outlined. This guideline may also serve as a tool for conducting the energy audit as envisaged
in the National Energy Efficiency Strategy, 2075. Understanding all these contexts, WECS has
initiated a program titled “Preparation of Energy Audit Guidelines for Industrial, Commercial
and Domestic Sectors”. This initiative is expected to help different sectors covered under this
program to reduce their energy demand by adopting energy efficient methods in their activities.
2.3 Types of Energy Audit
Energy audit can be different depending upon the types of industry, size, technology used,
detail to which energy audit is required. It also varies upon the requirement of cost reduction
desired along with potential & magnitude of energy savings required. Depending on these
criteria, an energy audit can be classified into two types: a preliminary (walk-through) audit
and a detailed (diagnostic) audit.
a) Preliminary Audit
This is a simple analysis of energy use and performance of energy consuming utilities. It is
mostly done using easily available data and does not involve a lot of data collection and
measurements. Due its simple type, it requires very less time. Hence, the obtained energy audit
results are more general with common identified energy efficiency opportunities. The payback
period in this type is done through simple method of calculation with realized energy savings.
This type of audit is also known as walk through audit.
b) Detailed Audit
This a more detailed type of energy audit which requires detailed data collection of different
energy utilities (Pump, Fan, Induction Motors, Compressed Air, HVAC, Furnace, Boiler
System etc.) and its energy consumption measurements. Due to its detailed nature, it requires
longer time than the preliminary audit. Hence, the obtained results are more specific with actual
picture of energy use, performance of utilities and with more specific recommendations on
energy efficiency opportunities. These energy opportunities are discussed with concerned
officials of any organization and then recommended for sustainability of savings. Along with
these, vendors and energy efficient equipment suppliers are also consulted while identifying
energy saving opportunities. It includes detailed financial analysis of cost demanding
opportunities with cost benefit analysis. This type of audit is also known as diagnostic audit.
Besides these, the detailed energy audit also involves post audit phase. In post audit phase,
energy auditor assists in implementation of recommended energy saving measures and
monitors the performance. The energy auditor also helps the organization in identification of
barriers and overcome them, if any, in implementing the recommended action plan.
Furthermore, the energy auditor ensures energy saving realization from the organization
through follow up and periodic review.
2.4 Energy Audit Methodology
Energy Audit Methodology provides a detailed energy project implementation plan for a
facility, since it evaluates all major energy using systems. This type of audit offers the most
accurate estimate of energy savings and cost. It considers the interactive effects of all projects,

Energy Audit Guidelines for Industrial Sectors
6
accounts for the energy use of all major equipment, and includes detailed energy cost saving
calculations and project cost. This is based on an inventory of energy using systems,
assumptions of current operating conditions and calculations of energy use. This estimated use
is then compared with utility bill charges.
2.4.1 Preliminary Energy Audit Methodology
It is also called Walkthrough Audit:
▪ Establish energy consumption in the organization
▪ Estimate the scope for saving
▪ Identify the most likely and the easiest areas for attention
▪ Identify immediate (especially no-/low-cost) improvements/savings
▪ Set a ‘reference point’
▪ Identify areas for more detailed study/measurement
▪ Preliminary energy audit uses existing, or easily obtained data
2.4.2 Detailed Energy Audit Flow Chart
Energy audit is carried out in three phases: Phase I, II and III and ten steps energy audit flow
chart as presented below: Phase Steps
Pre-Audit
Plan and Organize
&
Walkthrough Survey
Meetings and Awareness
Audit
Data Collection, Process Flow &
Energy Utility Diagram
Preparation
Energy Survey and Monitoring
Detailed experiments for selected
SEU area
Analyze of Energy Use
Recommendations of Energy
Conservation Opportunities (ECO)
Cost Benefit Analysis
Reporting
Post Audit Implementation and Follow up

Energy Audit Guidelines for Industrial Sectors
7
Phase I -Pre Audit Phase
In the pre audit phase, energy auditor starts the initial planning for the carry out audit in
structured and systematic way. An initial study of the site should always be carried out, as the
planning of the procedures necessary for an audit is the most important. An initial site visit
before the detailed audit is necessary as it provides the energy auditor with an overview of the
organization and helps in planning the necessary actions to be conducted in a systematic way.
This also helps the energy auditor to familiarize with the organization, its concerned officials
and the site itself.
During the site visit the energy auditor should carry out the following:
• Discuss the aims and agendas of energy audit with senior management;
• Obtain drawings of the building layout, steam distribution, compressed air distribution,
electricity distribution etc. accompanied by engineering/production department
officials;
• Analyze the major energy consumption data with the relevant personnel.
Energy Auditor should focus the following aims during the site visit:
• To finalize energy audit team of the organization;
• To identify the Significant Energy Consumption (SEC) areas/plant/items to be surveyed
during the audit;
• To identify any existing instrumentation/additional metering required;
• To decide whether any measuring devices/instruments will have to be installed prior to
the audit;
• To identify the instrumentation required for carrying out the audit;
• To collect macro data on plant energy resources, major energy consuming areas;
• To create awareness among the technical teams of organization through meetings.
Phase II- Detailed Energy Audit
In this phase, detail energy audit is carried out based on the planning from the pre audit phase.
In this phase, energy survey and monitoring to establish, and investigate, energy/material
balances for specific plant departments or items of process equipment are carried out. Detailed
trials/experiments for selected energy guzzlers are done. Sometimes, plant operations are
checked over an extended period of time, at nights and at the weekends and daytime working
hours to ensure nothing or no parts are missed out. The time required during this phase depends
on the nature and complexity of the site/organization.
Collection of information during the detailed audit:
• Energy consumption by type of energy, by department, by major items of process
equipment, by end-use
• Energy cost and tariff data
• Process and material flow diagrams
• Generation and distribution of site services (e.g. compressed air, steam)
• Sources of energy supply (e.g. electricity from the grid or self-generation)

Energy Audit Guidelines for Industrial Sectors
8
• Potential for fuel substitution, process modifications, and the use of co-generation
systems (combined heat and power generation).
• Energy management procedures and energy awareness training programs within the
organization.
Information on existing baseline is important and hence it should be collected with existing
reports to get consumption pattern, production cost and productivity levels in terms of product
per raw material inputs.
The audit team should collect the following baseline data:
• Capacity utilization;
• Amount & type of input materials used;
• Water consumption;
• Fuel consumption;
• Electrical energy consumption;
• Steam consumption;
• Other inputs such as compressed air, cooling water etc.;
• Quantity & type of wastes generated;
• Percentage rejection / reprocessing;
• Efficiencies.
Based on all the data/information collected from the organization/site, the analysis of energy
use is conducted and Energy Conservation Opportunities (ECO) are identified and developed.
The cost benefit analysis of high-cost opportunities is calculated.
After all these steps, the audit report is prepared. The audit report includes a description of
energy inputs and product outputs by major department or by major processing functions. List
of means of improving these efficiencies will be listed. Preliminary assessment of the cost of
energy opportunities/improvements are made along with the expected payback on any capital
investment required. The report also includes specific recommendations for which detailed
engineering studies and feasibility analyses must be performed to justify the implementation
of those conservation measures that require high investments.
Phase III: Post Audit
This phase is required to provide sustainability to the energy audit carried out to the overall
purpose of energy audit. During this, the energy auditor assists in implementation of
recommended energy saving measures and monitors the performance, helps the organization
in identification of barriers and overcome them, if any, in implementing the recommended
action plan. It also ensures energy saving realization from the organization through follow up
and periodic review.

Energy Audit Guidelines for Industrial Sectors
9
Flow-chart of detailed energy audit:
2.5 Specific Energy Consumption (SEC) Calculation
It is the measure of amount of energy consumed to the amount of product produced. It is one
of the energy performance indicators and reflects the energy efficiency of the manufacturing
industries. SEC is calculated as a ratio of energy used for producing a product:
SEC=Energy used/Product or Service amount
Phase Steps
Pre-Audit
Plan and Organize
&
Walkthrough Survey
Meetings and Awareness
Audit
Data Collection, Process
Flow & Energy Utility
Diagram Preparation
Energy Survey and
Monitoring
Detailed experiments for
selected SEU area
Analyze of Energy Use
Recommendations of Energy
Conservation Opportunities
(ECO)
Cost Benefit Analysis
Reporting
Post Audit Implementation and Follow
up

Energy Audit Guidelines for Industrial Sectors
10
CHAPTER: 3 ENERGY AUDIT GUIDELINES OF INDUSTRIAL
SECTOR
The Guidelines consist total eight most energy intensive industrial sectors. These eight
industrial sectors are brick kiln, cement, dairy, noodles making, non-alcoholic beverages, pulp
and paper, steel re-rolling and sugar industries.
3.1 BRICK KILNS
3.1.1 Brick Kilns in Nepal
Brick making is one of the traditional crafts in Nepal. Brick is a primary building material in
many parts of Nepal, particularly in Kathmandu valley and in the southern plain of the Terai.
With the increasing demand of brick, technology shift took place in early 1950’s when
traditional clamp kilns (locally known as “Thaado Bhatta”) were largely displaced by Bull’s
Trench Kilns Movable Chimney, (commonly known as BTKs or "Chimney Bhatta") a
technology that was brought from India in the early 1950s. At present, Fixed Chimney BTKs
(FBTK) is widely used for brick making since the government banned the Moving Chimney
BTKs in the Kathmandu Valley in 2002.
Brick making is an energy and labour intensive process. Most of the units in the country are
handmade green brick making units as there is no mechanization of this process (except for
large Hoffman Kiln units and few FBTK). The industry is seasonal and operates mostly for
about 6-7 months from November to May again except for large mechanized kilns with shades
for storing bricks.
Brick making is highly energy intensive process having specific energy consumption varying
in adopted technology. The brick industry is faced with lower operating efficiency, higher fuel
consumption and higher pollution loads which need to be tackled. The energy cost accounts
for 30-40 percent of the overall production costs.
3.1.2 Energy Use in Nepalese Brick Kilns
Nepalese brick kilns use mainly coal as energy resource, which is imported from Assam in
India. Apart from coal, a small fraction of sawdust/fire-wood is also used as fuel in these kilns.
Major energy consuming section of the brick industry is the kiln where coal is used as an energy
source for firing of green bricks. Electricity is mainly used for lighting. Few industries with
mechanized molding use electricity for clay preparation and molding of green bricks.
All brick kilns crush the coal to required size for firing. Coal is a combination of different
chemicals components, which produce the heat in exothermic reaction. Some component of
the coal i.e., ash do not produce any heat but after combustion remains in the kilns.
Ash can be divided into two types namely fly ash and bottom ash. Fly ash is the one of the
pollutants, which is emitted as a SPM through flue gas. Along with fly ash, un-burnt carbon is
also emitted through flue gas. Due to the un-burnt carbon, flue gas colour can be seen as black.
Energy efficiency in brick kilns can achieve elimination of un-burnt carbon and also reduce the
fly ash percentage.
3.1.3 Specific Energy Consumption (SEC) in Brick Sector
According to the present study findings, the specific energy consumption of the Industrial brick
sector in Nepal is given below. Figures derived are based on the energy audit carried out in
four brick kiln units of Nepal.

Energy Audit Guidelines for Industrial Sectors
11
Table 3.1: Specific Energy Consumption in Brick Kiln
Specific Energy Consumption
Electrical, kWh/MT Thermal, GJ/MT
WECS, 2019/20 2.57 0.95
EEC, 2015 Nepal 1 - 1.9-3.3
India 2 - 0.95 – 1.82
3.1.4 General Process Flow Chart
Input Process Waste/Emissions
Clay
Manpower
Energy (Diesel)
Digging and
Excavation
Dust
Stone/crop/grass
Smoke/Gases
Manpower
Water
Electrical Energy
Clay Preparation Efficiency of Pug Mill
Sand
Manpower
Brick Moulding Dust (sand)
Solar Energy Sun Drying Heat and Moisture
Manpower Stacking on Ground Moisture
Manpower Stacking at Fire Place
(Loading) Dust
Coal, wood dust
Man power
Firing
Flue gas (Smoke) Dust
Heat Radiation
Un-burnt Coal
Manpower
Unloading (Removing
from Fire Place and
Stacking on Ground)
Exposure to dust
Heat
Fired Bricks
Figure 3.1: General process flow chart of brick kiln
1 EEC/FNCCI, 2005 2 BEE, India

Energy Audit Guidelines for Industrial Sectors
12
3.1.5 Process Description
Four main processes are involved in brick making. In clay winning, the raw material i.e. clay
is excavated and mixed thoroughly with water after manual removal of stones and bigger
particles. The depth of clay excavation can range from 0.25m to 3m. If required, carbonaceous
material such as coal dust, crop waste etc. or other additives are added to the clay at this stage.
The clay preparation mainly depends on the properties of clay. The processed clay is shaped
into the specific shape. This process is known as clay moulding. moulding can be done
manually or mechanically using extrusion machines. Green bricks are dried naturally in open
air. The natural drying uses solar energy to evaporate moisture in the green bricks. The dried
(moisture content of 3 to 10% by mass on wet basis) green bricks are heated to a range of about
800 to 1100 C in a kiln to get the fired brick.
3.1.6 Significant energy used area and equipment in brick kiln
Brick Kiln uses mostly thermal energy in comparision to electrical energy. The following area
and equipment consume significant energy:
• Kiln;
• Induction fan;
• Coal crusher;
• Pug mill;
• Brick production line;
• Diesel generator.
3.1.7 Sampling and measurement for energy audit
The following electrical parameters are needed to be measured for electrical energy audit in
brick kilns:
Data Logging: 24 hours of data logging at main electrical pannel with the help of Three Phase
Data Logger. It shows power factor, total load in kW & kVA, peak demand, voltage, current,
harmonics.
Load Measurement: Load measurement in all individual induction motors with the help of
handheld power analyzer. It shows kW, kVA, ampere and power factor.
Lighting Load Measurement: Load measurement at main lighting pannel with the help of
handheld power analyzer.
Lighting details: Collection of lighting types with wattages, running hours and installed
location.
Diesel Generator: Calculate kilowatt hour generation in per litre of fuel.
The following thermal parameters are needed to be measured for thermal energy audit in brick
kilns:
Flue Gas Analysis: Measure oxygen, carbondioxide, carbonmonoxide, stack & ambient
temperature. Calculate fuel consumption and production in one round of kiln.
Surface Heat Loss Measurement: Measure surface temperature of firing zone of kiln and kiln
walls.
Air leakge test in wall of kiln: measure air movement towards the kiln by using smoke tube
and anaemometer.
Green Brick Moisture and Coal Size: Analyse the green brick moisture in laboratory.
Measure the coal size being fed in the kiln.

Energy Audit Guidelines for Industrial Sectors
13
3.1.8 Potential Energy Conservation Opportunity in Brick Kiln
The following energy conservation opportunities can be found in brick kilns:
Table 3.2: Energy conservation opportunities in brick kilns
S.N. Energy Conservation Opportunities Types of
investment
1 Stopped the leakage from top and wall of the kilns No Cost
2 Feed ¾ inch sizes coal to kilns
3 Feed maximum 200 gm coal at time in fuel feeding hole
4 Use Single man fuel feeding practice with Z pattern
5 Stacking of green bricks in chamber system
6 Keep distance of cooling zone at least 70 ft and more
7 Use at least 25 % of agriculture residue as a fuel
8 Improve the Ravish thickness and keep min 9 inch thick
9 Use VFD in induction fan Low Cost
10 Insulation of fuel feeding cover (Tawa)
11 Insulate the Shunt
12 Construct wind breaking wall over kiln
13 Use 40 % of the coal as an internal fuel
14 Construct coal and other fuel shed with hard surface Cost
Demanding 15 Construction shed for kinl duck
16 Change technology from BTK to energy efficient Tunnel or HKK
kilns
Energy Audit Guidelines for Industrial Sectors
14
3.2 CEMENT MANUFACTURING
3.2.1 Cement Industries in Nepal
The cement industries are operated mostly in large scale and located mostly in urban vicinities
and in the Tarai region. In the earlier period, Cement industries were established by the
government. Himal Cement Company Ltd. of 360 TPD capacity was established in Chobhar in
the Kathmandu Valley, Hetauda Cement Industry Ltd. of 750 TPD capacity in Lamsure,
Hetauda and Udapypur Cement Industry Ltd. of 850 TPD capacity in Gaighat of Udayapur by
the government. Himal Cement Company Ltd. has been closed whereas Hetauda Cement
Industry and Udayapur Cement Industry are still operational.
Almost all the cement industries possess similar technology and process. But the cement goods
production varies from industry to industry. Most of the industries mainly produces OPC
(Ordinary Portland Cement) & PPC (Portland Pozzolana Cement). Few industries produce
PSC (Portland Slag Cement). Cement grade limestone, silica reach clay and gypsum are the
main raw materials for the cement production and coal is the main fuel for limestone based
cement industries.
According to the Department of Industry, there are 105 cement industries registered in Nepal.
Out of them, 54 industries have received Nepal Standard Mark (NS) till 2019. From the aspect
of availability of raw materials, cement sector is considered as a very important sector in Nepal.
It falls under the category of heavy industry. Nepal has good deposit of the main raw materials
calcium carbonate or limestone and silica rich clay, as Nepal has vast limestone reserve spread
over 7000 square kilometers. According to the Nepal Cement Manufacturers Association, total
consumption of cement in Nepal is six million tons per annum.
Overall scenario in the context of raw material and market availability as seen in the Nepalese
cement production sector is encouraging. Nepal also has to depend on import of coal, which is
mainly used as fuel in the cement factory as it does not have its own reserve or production.
Efficient use of energy with effective energy management is thus an essential means to ensure
sustainable and cost-efficient cement production in the country.
3.2.2 Energy Use in Nepalese Cement Industries
Energy efficiency and energy conservation measures combined with proper energy
management action is of high importance in cement industries as the cost of energy as part of
the total production costs in the cement industry is significant. Optimizing energy demand in
all areas must be combined with the search for the optimal operating point that is consistent
with productivity and quality targets. Production of cement also consumes natural resources in
bulk quantities.
Given the magnitude of energy consumption and greenhouse gas (GHG) emissions high
importance is given to cement industry in the perspective of energy efficiency and climate
policies. When building new cement plants, manufacturers install the most recently developed
technologies, which are also typically the most energy efficient. Therefore, new kilns are
comparatively very energy efficient. More efficient technologies generally provide a cost
advantage to the producer through lower energy costs, so efficiency does increase gradually
over time with the addition of new plants and upgrading of old plants. There is a very wide
range of technologies available, and savings on a per unit basis range from 0.2-3.5 GJ/tonne
clinker. The industry is phasing out inefficient long dry kilns and the wet production process.
Market and economic forces generally trigger the closure of inefficient facilities as more
advanced technologies are commissioned.

Energy Audit Guidelines for Industrial Sectors
15
Globally, coal is the primary fuel used in cement kilns, but petroleum coke, natural gas and oil
can also be combusted in the kiln. Waste fuels, such as hazardous wastes from painting
operations, metal cleaning fluids, electronic industry solvents, as well as tires, are often used
as fuels in cement kilns as a replacement for more traditional fossil fuels. In Nepal, coal is used
almost exclusively as the fuel for the cement kilns, while electricity – both provided by the grid
and through the generation of electricity on-site using DG set is used to power the plant
equipment. Newer plants have also begun to have their own power plants based on coal for
generating power in-house.
3.2.3 Specific Energy Consumption (SEC) in Cement Sector
According to the present study findings, the specific energy consumption of the Industrial
cement sector in Nepal is given below. Figures derived are based on the energy audit carried
out in four Cement units of Nepal.
Table 3.3: Specific Energy Consumption in Cement Industry
Specific Energy Consumption
Electrical, kWh/MT Thermal, GJ/MT
WECS, 2019/20 Limestone Based: 74.68
Clinker Based: 38.4
2.75
EEC, 2015 Nepal 3
Limestone Based : 80-550
Clinker Based: 38
3.26 – 4.48
India 4 Limestone Based : 105
Clinker Based: 35
3.1
European Union,
20105
90 to 150 3.382
3 EEC/FNCCI, 2015 4 BEE, India 5 EU, 2010

Energy Audit Guidelines for Industrial Sectors
16
3.2.4 General Process Flow Chart
Input Process Output
Lime Stone Boulder
Electricity
Manpower
Lime Stone Crushing
Primary & Secondary
Dust Emission
Spillage
Noise
Electricity
Manpower Lime Stone Blending
Dust Emission
LS Spillage
Noise
Clay From Ore
Electricity
Hot Air from Kiln
Manpower
Raw Meal Grinding
Dust Emission
Spillage
Noise
Electricity
Manpower Homogenization
Dust Emission
Dust Spillage
Noise
Hot air from Kiln
Electricity
Manpower
Preheating &
Calcinations
Dust Emission
Dust Spillage
Noise
Heat Radiation
Coal
Hot Air
Electricity
Manpower
Coal
Grinding
Coal
Dust Sintering
Dust Emission
Hot air to raw mill
Heat Radiation
Electricity
Manpower Cooling
Hot air to coal mill &
raw mill
Dust emission
Electricity
Manpower Storing & Stabilizing
Dust emission
Rejected Clinker
Gypsum
Electricity
Manpower Cement Grinding
Dust Emission
Cement Spillage
Noise
Packing bags
Electricity
Manpower
Packing
Dust Emission
Cement Spillage
Damaged bags
Cement ready for
Dispatch
Figure 3.2: General process flow chart of Limestone based cement plant

Energy Audit Guidelines for Industrial Sectors
17
Clinker based Cement Plant
Input Process Output
Clinker
Fly ash
Gypsum
Storing
Clinker Dust
Fly ash Dust
Gypsum Dust
clinker fly ash
Crushed Gypsum
Electricity
Manpower
Storing (Master
Hopper)
Dust
Spillages
Electricity
Manpower
Electricity
Manpower
Storing (Raw Material
Hopper)
Dust emission
Spillages
Electricity
Manpower
Storing (Mill Hopper)
Dust emission
Spillages
Electricity
Water (for cooling)
Compressed air
Milling
Cement dust emission
Noise
Water (warm)
Dust in collector
Electricity Storing (Silo) Dust emission
Poly bag
Electricity/Compressed air
Manpower
Weighing and Packing
Spillage (Reused)
Damaged bags
Dust emission
Cement in Bag
Figure 3.3: General process flow chart of clinker-based cement plant
3.2.5 Process Description
The manufacture of cement is a two-step process, notably, clinker production and cement
grinding. In the first step, the raw materials are fed to the kiln system to produce clinker. Clinker
consists of silicates, aluminates and ferrites of calcium obtained from the reduction of calcium,
silica, alumina and iron oxides present in the raw materials. In the second step, clinker is ground
(in a grinding mill) with calcium sulphates (gypsum or anhydrite) to obtain cement with desired
performance such as setting time and strength development.
Raw Material Acquisition
Calcium carbonate, usually limestone is the basic raw material used in the plant. Limestone is
quarried at mines and transported to the plant using rails, ropeways, trippers and dumpers

Energy Audit Guidelines for Industrial Sectors
18
depending on the available facility. The mines are equipped with the latest machinery and
technology. The mined limestone is then crushed through primary jaw crusher and secondary
hammer crusher. The crushed limestone is then transported to the plant site. Other raw
materials such as coal, bauxite (for aluminum) iron ore and gypsum are procured from various
suppliers.
Raw Milling
Raw milling involves mixing the extracted raw materials to obtain the correct chemical
configuration, and grinding them to achieve the proper particle-size to ensure optimal fuel
efficiency in the cement kiln and strength in the final concrete product. The raw materials are
crushed, ground and mixed to obtain a homogenous blend, and then stored. Crushing operation
takes place in a raw mill that could be either VRM or Ball Mill or both. The major energy input
during this process is electricity.
After the material preparation and prior to entering the kiln system for clinker production, the
raw materials are preheated to enable the chemical reactions to occur quickly and efficiently in
the kiln and calcined (calcinations) to separate calcium oxides from calcium carbonates
contained in the raw materials. During the process, significant amount of carbon dioxide (CO2)
is released. This complete operation takes place in preheater tower through cyclones at different
stages.
Pyro-processing
In Pyro-processing, the raw mix is heated to produce clinkers. Clinkers are hard, gray, spherical
nodules with diameters ranging from 0.32-5.50 cm (1/8 - 2") created from the chemical
reactions between the raw materials. The Pyro-processing system involves three steps: drying
or preheating, calcining (a heating process in which calcium oxide is formed), and burning
(sintering). The Pyro-processing takes place in the burning zone of the kiln section.
The major thermal energy consumption of the plant is in this section. Coal mill consumes
electricity for pulverizing coal. In the kiln system, calcium oxides are sintered at a typical
temperature of 1400-1500°C to form clinker, together with oxides of silica, alumina and iron
that are present in the feed materials. The clinker production ends with the cooling phase in the
cooler installed in the plant. The combusted gases move from kiln through preheater tower,
heating the raw material coming to the kiln through the raw meal silo.
Clinker Cooling
The clinker cooling operation recovers up to 30% of kiln system heat, preserves the ideal
product qualities, and enables the cooled clinker to be maneuvered by conveyors.
Clinker Storage
Suitable transfer mechanism is used to transfer clinkers from coolers to storage areas and to
the finish mill. Gravity drops and transfer points typically are vented to dust collectors.
Cement (Finish) Milling
The clinker produced in the kiln stored in the silo/stock-pile is ground along with Gypsum
(about 5%) to produce Ordinary Portland Cement (OPC). The generally used grinding
equipment is the ball mill in various cement plants around the world. In recently installed
plants the VRM has been installed for lowering energy consumption. The other types of
cement such as PPC (Portland Pozzolana Cement) and PSC (Portland Slag Cement) are also
produced by grinding clinker with fly-ash and blast furnace slag respectively.
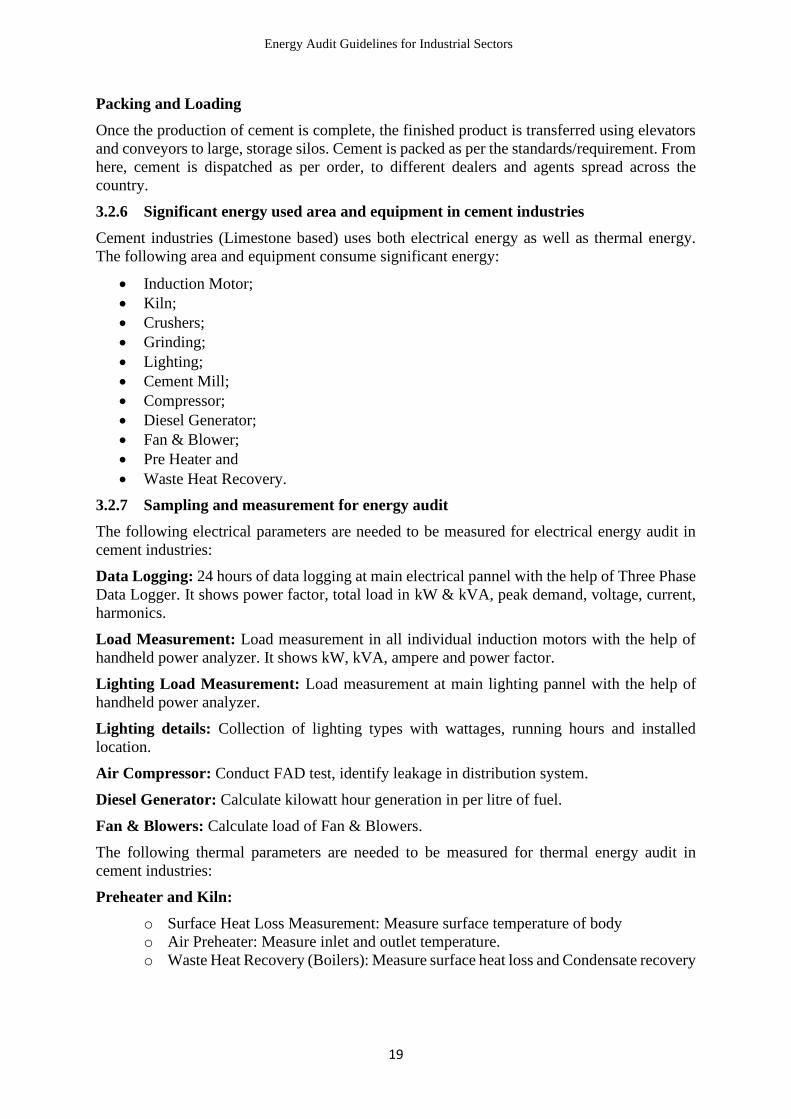
Energy Audit Guidelines for Industrial Sectors
19
Packing and Loading
Once the production of cement is complete, the finished product is transferred using elevators
and conveyors to large, storage silos. Cement is packed as per the standards/requirement. From
here, cement is dispatched as per order, to different dealers and agents spread across the
country.
3.2.6 Significant energy used area and equipment in cement industries
Cement industries (Limestone based) uses both electrical energy as well as thermal energy.
The following area and equipment consume significant energy:
• Induction Motor;
• Kiln;
• Crushers;
• Grinding;
• Lighting;
• Cement Mill;
• Compressor;
• Diesel Generator;
• Fan & Blower;
• Pre Heater and
• Waste Heat Recovery.
3.2.7 Sampling and measurement for energy audit
The following electrical parameters are needed to be measured for electrical energy audit in
cement industries:
Data Logging: 24 hours of data logging at main electrical pannel with the help of Three Phase
Data Logger. It shows power factor, total load in kW & kVA, peak demand, voltage, current,
harmonics.
Load Measurement: Load measurement in all individual induction motors with the help of
handheld power analyzer. It shows kW, kVA, ampere and power factor.
Lighting Load Measurement: Load measurement at main lighting pannel with the help of
handheld power analyzer.
Lighting details: Collection of lighting types with wattages, running hours and installed
location.
Air Compressor: Conduct FAD test, identify leakage in distribution system.
Diesel Generator: Calculate kilowatt hour generation in per litre of fuel.
Fan & Blowers: Calculate load of Fan & Blowers.
The following thermal parameters are needed to be measured for thermal energy audit in
cement industries:
Preheater and Kiln:
o Surface Heat Loss Measurement: Measure surface temperature of body
o Air Preheater: Measure inlet and outlet temperature.
o Waste Heat Recovery (Boilers): Measure surface heat loss and Condensate recovery

Energy Audit Guidelines for Industrial Sectors
20
3.2.8 Potential Energy Conservation Opportunity in Cement Industries
The following energy conservation opportunities can be found in cement industries:
Table 3.4: Energy conservation opportunities in cement industries
S.N. Energy Conservation Opportunities Types of
investment
1 Electrical Demand Management No Cost
2 Power Factor Improvement by installing capacitor bank with
APFC units
3 Replace conventional lamp with LED
4 Excess Oxygen control in down coming duct
5 Calibrate all pressure guage and temperature indicators
6 Regular cleaning of dust in all induction motors
7 Control the air supply in kiln to reduce CO formation
8 VFD for Pumps and Motors Low Cost
9 Replace old pump and motor with energy efficient pump &
motor
10 Use of alternate fuel against coal
11 Install energy meter to all department
12 Arrest false air in Cooler Bag House
13 Install on load tap changer in Transformer
14 Implement Energy Management System
15 Install new refractory lining in burning zone to reduce Kiln
radiation and convection loss
Cost Demanding
16 Install Waste Heat Recovery Plant and Generate electricity

Energy Audit Guidelines for Industrial Sectors
21
3.3 DAIRY INDUSTRIES
3.3.1 Dairy Industries in Nepal
Dairy industries in Nepal have been instrumental in providing dairy products to the urban
consumers and pull the urban capital to rural areas. Dairy industries have been working to
bridge dairy farmers and the consumers and urban and rural trade. It is said that dairy sector
contributes nearly two-third of the livestock and around 9 percent in the total GDP and regarded
as the most important livestock subsector in Nepal. There are nearly 1603 Milk Producers
Cooperatives (MPCs), six Milk Supply Schemes and 17 cheese factories of Dairy Development
Corporation and 250 private sector dairy industries operating in Nepal (DDB, 2017).
This sector has its importance in reducing poverty through creating employment and income
generating opportunities that is ensured through regular cash flow from urban to the rural areas.
Formal sector contributes less than 20% of the total annual milk produced in the country. The
required yearly milk production growth should be 9% but in contrast current milk production
growth stands only at 3.4 percent per annum (DDB, 2017).
In dairy industries, electricity is used for the operation of machinery, refrigeration, ventilation,
lighting and compressors. Thermal energy, in the form of steam producing from boiler, is used
for heating and cleaning.
3.3.2 Energy Use in Nepalese Dairy Industries
Dairy industries consume both electrical and thermal energy in its production processes. Main
source of electricity is the national grid whereas diesel generators are used in case of load
shedding. Electrical energy is mainly consumed by motors, drives, compressors (both air and
refrigeration), pumps and lighting. The major electricity consuming processes are cold storage,
homogenization and chilling of water. Thermal energy is required for the operation of boilers
that generate steam for the pasteurization of milk and other processes. Fuel used for the boiler
operation is mainly firewood and kerosene. Other sources such as rice husk and diesel are also
used in some industries.
3.3.3 Specific Energy Consumption (SEC) in Dairy Sector
According to the present study findings, the specific energy consumption of the Industrial dairy
in Nepal is given below. Figures derived are based on the energy audit carried out in four dairy
units of Nepal.
Table 3.5: Specific Energy Consumption in Dairy
Specific Energy Consumption
Description Electrical, kWh/KL Thermal, GJ/KL
WECS 2019/20 103.04 1.79
EEC, 2015 Nepal6 40-128 0.25 – 2.85
ESPS/DANIDA, Nepal7 122.5 0.64
India8 16.44 0.1167
6 EEC/FNCCI, 2005 7 ESPS/DANIDA, 2001 to 2005 8 BEE, India
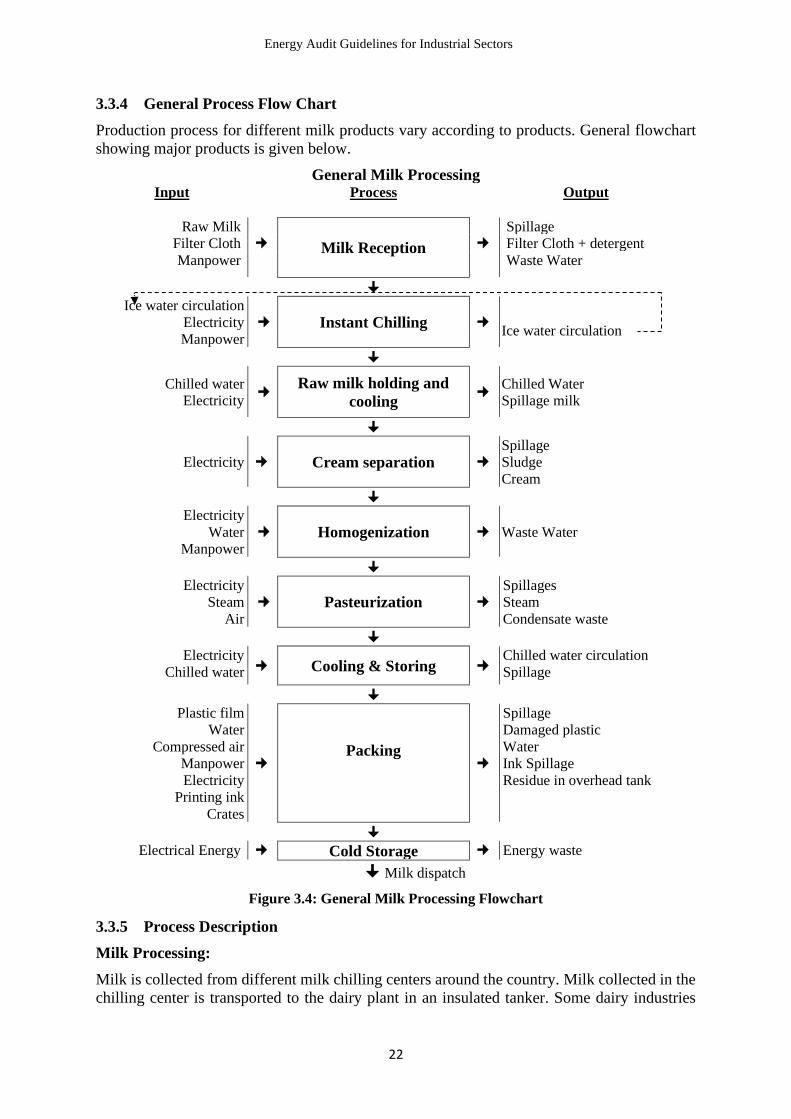
Energy Audit Guidelines for Industrial Sectors
22
3.3.4 General Process Flow Chart
Production process for different milk products vary according to products. General flowchart
showing major products is given below.
General Milk Processing Input Process Output
Raw Milk
Milk Reception
Spillage
Filter Cloth Filter Cloth + detergent
Manpower Waste Water
Ice water circulation
Electricity Instant Chilling
Ice water circulation Manpower
Chilled water
Electricity
Raw milk holding and
cooling
Chilled Water
Spillage milk
Electricity
Cream separation
Spillage
Sludge
Cream
Electricity
Water
Manpower
Homogenization
Waste Water
Electricity
Steam
Air
Pasteurization
Spillages
Steam
Condensate waste
Electricity
Chilled water Cooling & Storing Chilled water circulation
Spillage
Plastic film
Water
Compressed air
Manpower
Electricity
Printing ink
Crates
Packing
Spillage
Damaged plastic
Water
Ink Spillage
Residue in overhead tank
Electrical Energy Cold Storage Energy waste
Milk dispatch
Figure 3.4: General Milk Processing Flowchart
3.3.5 Process Description
Milk Processing:
Milk is collected from different milk chilling centers around the country. Milk collected in the
chilling center is transported to the dairy plant in an insulated tanker. Some dairy industries

Energy Audit Guidelines for Industrial Sectors
23
also have refrigerated van for transportation of milk. Milk is also collected in the plant gate
from farmers who bring milk in the canes from nearby locations. Received milk is checked for
quality after which it is chilled online, filtered and clarified. After clarification milk is stored
in a chilled raw milk silo.
After being held in storage tanks at the processing site, raw milk is heated to separation
temperature in the regeneration zone of the pasteurizer as per the production requirement. The
milk (now hot) is standardized and homogenized by sending to a centrifugal separator where
the cream fraction is removed. The skim is then usually blended back together with the cream
at predefined ratios so that the end product has the desired fat content.
The pasteurization process involves killing most of the bacteria within the raw milk to increase
its shelf life. This is done by rapidly heating the incoming standardized milk to the
pasteurization temperature in a simple holding tube, ensuring that the pasteurization
temperature is held for the correct time (e.g. 72°C for 25 seconds) to destroy the bacteria. The
hot milk is then passed through the regeneration zone, giving up its heat to the incoming cold
milk, and cooled to a level where the growth of any surviving bacteria is slowed to a minimum,
partially sterilizing the milk and increasing shelf life. Typically, this is an in-line process with
the heating and cooling conducted in a plate heat exchanger.
Finally, chilled water is used to control the milk exit temperature from the pasteurizer at
approximately 4°C. As the milk is heated and cooled within a few seconds, there are intense
heating and cooling demands. This process is therefore one of the largest emission sources
within the industry, even though much of the heat is regenerated and re-used in the pasteurizer.
3.3.6 Significant Energy used area and equipment in Dairy Industries
The following area and equipment consume significant amount of energy:
• Boiler and steam distrubution;
• Chilling;
• Lighting;
• Pumping System;
• Packing;
• Cooling Tower;
• Compressor;
• Diesel Generator;
• Heat Exchanger and
• Ice Bank Tank.
3.3.7 Sampling and measurement for energy audit
The following electrical parameters are needed to be measured for electrical energy audit in
dairy industries:
Data Logging: 24 hours of data logging at main electrical pannel with the help of Three Phase
Data Logger. It shows power factor, total load in kW & kVA, peak demand, voltage, current,
harmonics.
Load Measurement: Load measurement in all individual induction motors with the help of
handheld power analyzer. It shows kW, kVA, ampere and power factor.
Lighting Load Measurement: Load measurement at main lighting pannel with the help of
handheld power analyzer.

Energy Audit Guidelines for Industrial Sectors
24
Lighting details: Collection of lighting types with wattages, running hours and installed
location.
Pumping Load Measurement: Measure power consumption and head discharge for
performance evaluation.
Air Compressor: Conduct FAD test, identify leakage in distribution system.
Diesel Generator: Calculate kilowatt hour generation in per litre of fuel.
The following parameters are needed to be measured for thermal energy audit in dairy
industries:
Boiler:
o Flue Gas Analysis: Measure oxygen, carbondioxide, carbonmonoxide, stack &
ambient temperature.
o Surface Heat Loss Measurement: Measure surface temperature of body and steam
pipelines.
o Feed Water Analysis: Measure pH, TDS, hardness, TSS and temperature.
o Blow Down Water Analysis: Measure pH & TDS.
o Economizer & Air Preheater: Measure inlet and outlet temperature.
HVAC: Measure inlet & outlet temperature, flow rate, area and electrical load for COP and
performance evaluation.
Heat Exchanger: Measure inlet and outlet temperature.
Ice Bank Tank & Cooling Tower: Measure inlet and outlet temperature.
3.3.8 Potential Energy Conservation Opportunity in Dairy Industries
The following energy conservation opportunities can be found in dairy industries:
Table 3.6: Energy conservation opportunities in dairy industries
S.N. Energy Conservation Opportunities Types of
investment
1 Electrical Demand Management No Cost
Electrical Phase Balance
2 Regular cleaning of lighting fixtures to get maximum illumination
3 Excess Air Control in Boiler furnace
4 Use less moistured fuel in boiler
5 Make habbits to turn off AC, Fan and Light while not in use
6 Don’t waste steam by washing milk container and carratte
7 Install capacitor bank with APFC units for Power Factor
Improvement
Low Cost
8 Replace conventional lamp with LED
9 VFD for Pumps and Motors
10 Insulate boiler body and steam pipelines, flanges and valves
11 Install condensate recovery system
12 Replace old pump and motor with energy efficient pump & motor
13 Install Economiser in boiler

Energy Audit Guidelines for Industrial Sectors
25
14 Feed soft water in boiler and reduce blow down
15 Install Solar water heater Cost
Demanding 16 Insulation of Ice Bank Tank
17 Install multifuel boiler instead of liquid fuel boiler

Energy Audit Guidelines for Industrial Sectors
26
3.4 NOODLES MAKING INDUSTRIES
3.4.1 Noodles Manufactures in Nepal
Nepal is an attractive market for instant noodles. Growing population of youths, increasing
number of middle-class households and working population are the major reasons behind the
growth of instant noodle industry in Nepal. The market is not matured in Nepal and there is a
huge scope of growth remaining in this market. New instant noodle producing companies are
also entering in the market.
Noodle making industries are producing plain white noodles and instant noodles in Nepal.
These industries are also producing noodles for vegetarian and non-vegetarian. Domestic
consumption of noodles in Nepal is very high, so all the products are consumed locally.
Requirement of such raw materials varies according to the quality and type of noodles.
Required main raw materials are available within the country. Nepalese noodles making
industries are using wheat flour, palm oil, palmolein, salt, MSG, garlic powder, chilli powder,
soya sauce, chicken, wheat gluten and soup paste as raw materials and chemicals.
As per the data of CBS 2011/12, 16 noodles making industries including production of
macaroni are operating in Nepal. More than 3650 employees are directly and indirectly
involved in these industries. Nepalese noodle making industries use the electricity as the major
source of energy. However, rice husk, saw dust and diesel are also used as fuel for thermal
energy generation.
3.4.2 Energy Use in Nepalese Noodle Making Industries
The noodle making industries are considered as energy intensive sector. Energy used for the
cooking, frying and packing of product is mainly electricity for machine operation and heat
energy is used for cooking and oil frying. All noodle making production units are operated with
boiler for steam generation. Most of the noodle making production units use rice husk as fuel
for boiler. The major electrical energy consumption area in the noodle making industry is
electric motors associated with pumps, conveyer, noodle making machines and packing
machine. The other areas include compressors & lighting. Thermal energy in the form of steam
is mainly used for cooking and oil frying.
3.4.3 Specific Energy Consumption (SEC) in Noodle Making Sector
According to the present study findings, the specific energy consumption of the Industrial
noodle making sector in Nepal is given below. Figures derived are based on the energy audit
carried out in four noodle making units of Nepal.
Table 3.7: Specific Energy Consumption in Noodle Making Sector
Specific Energy Consumption Electrical, kWh/MT Thermal, GJ/MT
WECS 2019/20 134.6 12.31
ESPS/DANIDA, Nepal9 201.5 13.64
9 ESPS/DANIDA, 2001 to 2005, Nepal

Energy Audit Guidelines for Industrial Sectors
27
3.4.4 General Process Flow Chart
Production process for noodle making is given below.
Input Process Waste
Wheat Flour
Electricity
Manpower
Screening/Shifting
Flour
Extraneous matter
Sacs
Gluten
Electricity
Manpower
Dough
Mixing/Kneading
Spillages Flour Dust
Gluten
Electricity Feeding Dough pieces
Electricity Dough Rolling Dough Scraps
Electricity
Manpower
Dough Sheet Making Dough Scraps
Electricity
Manpower
Slitting
Dough Scarps
Steaming
Steam
Electricity
Water vapor
Heat
Electricity
Cooling
Pieces of steamed
Noodles
Electricity Cutting/Folding
Steamed Noodles Pieces
Seasoning Liquid
Seasoning
Left seasoning liquid
Electricity
Manpower
Pieces of noodle
Electricity
Drying
Steamed Noodle
Seasoning Liquid
Manpower Moulding
Noodle pieces
Seasoned liquid
Electricity
Manpower
Hot palm Oil
Frying
Burnt noodle
Palm oil

Energy Audit Guidelines for Industrial Sectors
28
Electricity Cooling Broken Noodles
Electricity
Manpower
Sorting /Conveying
Broken noodles
Coded wrappers
Manpower
Electricity
Wrapping
Wrappers
Seasonings
Broken noodles
Carton Box
Tape
Manpower
Packaging
Damaged Box
Tapes
Final Products
Figure 3.5: General process flow chart of Noodle Making
3.4.5 Process Description
Dough is prepared in dough making machine by mixing wheat flour and water. Additional
phosphate as binder, wheat gluten and salt are mixed in the dough. This is passed through a
series of rollers for homogenizing and laminating. Noodle threads are made, folded and cut
into required sizes by passing the laminated dough through rotating thread rollers.
Noodles from previous process are carried by a metal conveyor belt into steaming section.
Steam is supplied from the boiler section. Noodle are steamed at 100 oC during this process
by a series of nozzles located under the conveyor belt. Steamed noodles in conveyor cages are
fried in palm oil heated to 170 oC by steam, which are carried by conveyor to inspection table
where deformed noodle cakes are removed and rest are packed in the packing wrapper.
3.4.6 Significant energy used area and equipment in noodles making industries
Noodles Making Industries uses both electrical as well as thermal energy. The following area
and equipment consume significant amount of energy:
• Boiler and Steam distribution;
• Heat Exchanger;
• Fryer;
• Oil melting;
• Packaging;
• Compressor and
• Diesel Generator.
3.4.7 Sampling and measurement for energy audit
The following electrical parameters are needed to be measured for electrical energy audit in
noodle making industries:
Data Logging: 24 hours of data logging at main electrical pannel with the help of Three Phase
Data Logger. It shows power factor, total load in kW & kVA, peak demand, voltage, current,
harmonics.

Energy Audit Guidelines for Industrial Sectors
29
Load Measurement: Load measurement in all individual induction motors with the help of
handheld power analyzer. It shows kW, kVA, ampere and power factor.
Lighting Load Measurement: Load measurement at main lighting pannel with the help of
handheld power analyzer.
Lighting details: Collection of lighting types with wattages, running hours and installed
location.
Pumping Load Measurement: Measure power consumption and head discharge for
performance evaluation.
Air Compressor: Conduct FAD test, identify leakage in distribution system.
Diesel Generator: Calculate kilowatt hour generation in per litre of fuel.
The following thermal parameters are needed to be measured for thermal energy audit in noodle
making industries:
Boiler:
o Flue Gas Analysis: Measure oxygen, carbondioxide, carbonmonoxide, stack &
ambient temperature.
o Surface Heat Loss Measurement: Measure surface temperature of body and steam
pipelines.
o Feed Water Analysis: Measure pH, TDS, hardness and temperature.
o Blow Down Water Analysis: Measure pH & TDS.
o Economizer & Air Preheater: Measure inlet and outlet temperature.
HVAC: Measure inlet & outlet temperature, flow rate, area and electrical load for COP and
performance evaluation.
Heat Exchanger: Measure inlet and outlet temperature.
3.4.8 Potential energy conservation opportunity in noodle making industries
The following energy conservation opportunities can be found in noodle making industries:
Table 3.8: Energy conservation opportunities in noodle making industries
S.N. Energy Conservation Opportunities Types of
investment
1 Electricity Demand Management No Cost
2 Electrical Phase Balance
3 Excess Air control in Boiler
4 Use low moistured fuel in Boiler
5 Regularly clean lights for maximum illumination
6 Regular cleaning of Heat Exchanger
7 FAD test in Compressor
8 Regular checking of Steam trap
6 Power Factor Improvement by installing capacitor bank with
APFC units
Low Cost
7 Replace conventional lamp with LED

Energy Audit Guidelines for Industrial Sectors
30
8 VFD for Pump and Motor
9 Insulate bare steam pipelines, flanges and valves
10 Install Condensate Recovery System
11 Replace old pump and motor with energy efficient pump & motor
12 Insulation of bare pipes and fittings
13 Install Economiser and Air Pre Heater in Boiler
15 Replace old heat exchanger to energy efficient heat exchanger for
oil heating of fryer
Cost
Demanding
16 Install auto fuel feeding system in Boiler

Energy Audit Guidelines for Industrial Sectors
31
3.5 NON-ALCOHOLIC BEVERAGE INDUSTRIES
3.5.1 Non-Alcoholic Beverage Industries in Nepal
Bottlers Nepal, the oldest non-alcoholic beverage producing company in Nepal started its
production in 1979 AD, marking the establishment of the first global soft drink brand bottling
plant in the country. Nonalcoholic beverages industry in Nepal comprises of liquid refreshment
beverages such as bottled water, carbonated soft drinks, energy drinks, fruit beverages, ready-
to-drink coffee and tea, sports beverages and value-added water. Most of the non-alcoholic
beverage industries are multinational companies operating in Nepal. Most of the international
established brands of non-alcoholic beverages are bottled in Nepal.
As per the data of CBS 2011/12, 54 non-alcoholic beverage industries including production of
mineral water are operating in Nepal. More than 3907 employees are directly and indirectly
involved in these industries.
3.5.2 Energy Use in Nepalese Non-Alcoholic Beverage Industries
The non-alcoholic beverage industries are considered as energy intensive sector. Energy used
for the production of beverage is mainly electricity for machine operation and heat energy for
washing and HVAC system. All cola production units are operated with boiler for steam
generation. Most of the cola production units use diesel and FO as fuel for boiler. The major
electrical energy consumption area in the non-alcoholic beverage industry are electric motors
associated with pumps, washing machines, conveyer, filling machines, refrigeration, HVAC
and vacuum pumps. The other areas include compressors & lighting. Thermal energy in the
form of steam is mainly used for washing of bottles and HVAC system.
3.5.3 Specific Energy Consumption (SEC) in Non-Alcoholic Beverage Sector
According to the present study findings, the specific energy consumption of the Industrial non-
alcoholic beverage sector in Nepal is given below. Figures derived are based on the energy
audit carried out in two Non-Alcoholic units of Nepal.
Table 3.9: Specific Energy Consumption in Non-Alcoholic Beverage
Specific Energy Consumption
Description Electrical, kWh/KL Thermal, GJ/KL
WECS 2019/20 85.22 2.29
ESPS/DANIDA, Nepal10 99.5 3.11
3.5.4 General Process Flow Chart
Production process for Non-Alcoholic Beverage varies according to product type. General
flowchart for cola production is given below. Input Process Waste
Water
Caustic Soda
Energy
Bottle
Washing Wastewater
Sugar
Syrup
Preparation
Syrup
Blending
Carbon
dioxide
Mixing
Blend
Syrup Filling
Broken
Bottles
Wastewater
10 ESPS/DANIDA, 2001 t0 2005, Nepal

Energy Audit Guidelines for Industrial Sectors
32
Date Coding
Crate Crate Filling Wastewater
Bottled
Beverage
Figure 3.6: General Flowchart Cola Product Production
3.5.5 Process Description
All returned bottles in crates are collected in a warehouse then it is transferred to the plant by
forklift, which is sent to the conveyer along with the crates. All the bottles are taken out from
the crates and transferred to the next conveyer for another process. All the bottles are then
transferred to bottle cleaner machines where steam pass at 4 kg/cm2 pressure in chemical
section with maximum temperature around 80C. Basically, the bottle washing machine has
preheating section, chemical section, hydra zone, and rinsing and discharge section. After
washing, all the bottles are transferred on the conveyer to the filling hall and the filling process
is carried out. Filled bottles are checked manually with light and conveyer and only quality
bottles are transferred for further process and broken bottles are rejected.
Syrup are prepared from concentrate, RO water and sugar solution. Prepared syrup is cooled
with glycol. Then the cooled syrup will be filled in the bottle within the filling point.
Carbonification will be completed in final syrup using liquid carbon dioxide. All the filled
bottles are checked manually with light and conveyer and only quality bottles are transferred
for further process. All the bottles are then packaged in crates and transferred to the market and
stores.
3.5.6 Significant energy used area and equipment in non-alcoholic beverages
The following area and equipment consume significant amount of energy:
• Boiler and Steam Distribution;
• Compressors;
• Lighting;
• Water Treatment Plant;
• Cooling Tower;
• Chillers and
• Diesel Generator.
3.5.7 Sampling and measurement for energy audit
The following electrical parameters are needed to be measured for electrical energy audit in
nonalcoholic beverage industries:
Data Logging: 24 hours of data logging at main electrical pannel with the help of Three Phase
Data Logger. It shows power factor, total load in kW & kVA, peak demand, voltage, current,
harmonics.
Load Measurement: Load measurement in all individual induction motors with the help of
handheld power analyzer. It shows kW, kVA, ampere and power factor.
Lighting Load Measurement: Load measurement at main lighting pannel with the help of
handheld power analyzer.

Energy Audit Guidelines for Industrial Sectors
33
Lighting details: Collection of lighting types with wattages, running hours and installed
location.
Pumping Load Measurement: Measure power consumption and head discharge for
performance evaluation.
Air Compressor: Conduct FAD test, identify leakage in distribution system.
Diesel Generator: Calculate kilowatt hour generation in per litre of fuel.
The following thermal parameters are needed to be measured for thermal energy audit in non-
alcoholic beverage industries:
Boiler:
o Flue Gas Analysis: Measure oxygen, carbondioxide, carbonmonoxide, stack &
ambient temperature.
o Surface Heat Loss Measurement: Measure surface temperature of body and steam
pipelines.
o Feed Water Analysis: Measure pH, TDS, hardness and temperature.
o Blow Down Water Analysis: Measure pH & TDS.
o Economizer & Air Preheater: Measure inlet and outlet temperature.
HVAC: Measure inlet & outlet temperature, flow rate, area and electrical load for COP and
performance evaluation.
Heat Exchanger: Measure inlet and outlet temperature.
Cooling Tower: Measure inlet and outlet temperature.

Energy Audit Guidelines for Industrial Sectors
34
3.5.8 Potential Energy Conservation Opportunity in Non-Alcoholic Beverage Industry
The following energy conservation opportunities can be found in non-alcoholic beverage
industries:
Table 3.10: Energy conservation opportunities in non-alcoholic beverage industry
S.N. Energy Conservation Opportunities Types of
investment
1 Electricyty Demand Management No Cost
2 Excess Air Control in Boiler
3 Regular cleaning of cooling tower
4 Regualr FAD of Compressor
5 Calibrate all pressure guage and temperature indicator
6 Optimise the all zone temperature in Bottle Washer
7 Stopped conveyer while not in load
8 Power Factor Improvement by installing capacitor bank with
APFC units
Low Cost
9 Replace conventional lamp with LED
10 Install On load tap changer in Transformer
11 Install VFD for Pumps and Motors
12 Insulation of bare steam pipes and fittings
13 Install Economiser in Boiler
14 Repair and install insulation in cold lines
15 Improve insulation in Bottle washer
16 Install Condensate recovery system
17 Replace liquid fuel fired boiler to biomass or briquette fired boiler Cost
Demanding 18 Replace standard induction motors with energy efficienct motors

Energy Audit Guidelines for Industrial Sectors
35
3.6 PULP AND PAPER INDUSTRIES
3.6.1 Pulp and Paper Making Industries in Nepal
The pulp and paper industry has completed more than four decades of its production life in
Nepal. Before that, the requirement of writing and printing paper used to be fulfilled by Indian
paper industries. Nepalese handmade paper industries are also popular in Nepal but they are
produced only a few ton/year and only have decorative value and belong to cottage industrial
sector. As per the CBS 2011/12, there are 15 pulp and paper industries operational in Nepal.
Presently, the pulp and paper industries are producing mainly two types of products; the white
(bleached writing & printing and newsprint paper) and the brown (unbleached kraft paper).
Wastepaper and biomass are the main raw materials of the paper industries of Nepal. Due to
international market compulsion, Nepalese industries are reducing the consumption of biomass
and more focusing on wastepaper.
Papermaking is a high-energy consuming industry. Wastewater generations from pulping as
black liquor and from bleaching as a white liquid are the major environmental concerns for the
paper industry. These industries consume high amount of steam, which is produced from boiler
mostly using husk as fuel.
3.6.2 Energy Use in Nepalese Pulp and Paper Industries
Energy used for the production of paper is mainly the electricity for machine operation and
heat energy for cooking the raw materials which is derived mainly from biomass. All pulp and
paper units are operated with boiler for steam generation. Most of the pulp and paper units use
rice husk as fuel for boiler. The major electrical energy consumption areas are electric motors
associated with pumps, agitators, paper machine and vacuum pumps. The other areas include
compressors and lighting. Thermal energy in the form of steam is mainly used for cooking raw
materials in digester and drying of paper that come out of the paper machine.
3.6.3 Specific Energy Consumption (SEC) in Pulp and Paper Sector
According to the present study findings, the specific energy consumption of the Industrial pulp
and paper sector in Nepal is given below. Figures derived are based on the energy audit carried
out in four pulp and paper units of Nepal.
Table 3.11: Specific Energy Consumption in Pulp and Paper
Specific Energy Consumption
Description Electrical, kWh/MT Thermal, GJ/MT
WECS 2019/20 879.3 17.49
EEC, 2015 Nepal11 937 15.434
ESPS/DANIDA12 967 19.43
India13 - 2.25 to 3.0
3.6.4 General Process Flow Chart
Production process for pulp and paper vary according to product type. General flowchart for
pulp and paper production is given below.
11 EEC/FNCCI, 2005 12 ESPS/DANIDA, 2001 to 2005, Nepal 13 BEE, India

Energy Audit Guidelines for Industrial Sectors
36
Input Process Waste
Wheat Straw
Cooking
(Digester)
Bagasse
Fresh Water Dust
Caustic
Raw material spillage
Sulphite Steam
Electricity water spillage
Steam from boiler
Manpower
Electricity Blowing and Store water spillage
Electricity Screening
Foreign materials
Manpower Black liquor
Decker water
Poacher Washing and
Refining
Black liquor
Fresh water
Water spillage
Electricity Rejects
Manpower
Alum
Chemical Mixing
Rosin
Soap stone Chemical spillage
Electricity Water spillage
Manpower
Tray water
Centric Cleaning
Fresh water
Wastewater (Reused)
Electricity Water spillage
Manpower
Sodium hypo
chlorite
Bleaching
Wastewater
Electricity Water spillage
Manpower
Electricity
Turbo-beating and
Thickening
Wastewater
Manpower Water spillage
Steam
Paper Making
Pulp spillage
Electricity Condensate
Manpower Broken paper
Packing materials
Re-winding and Packing
Broke paper
Elect energy Damaged packing materials
Manpower
Paper
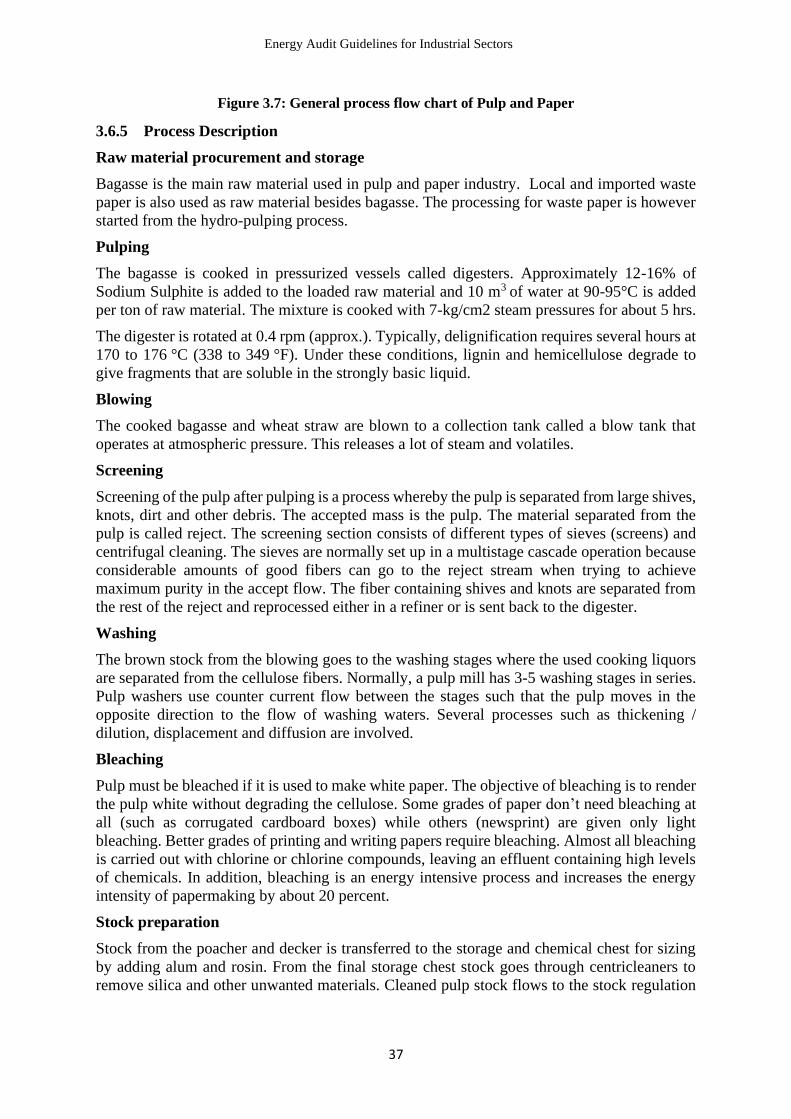
Energy Audit Guidelines for Industrial Sectors
37
Figure 3.7: General process flow chart of Pulp and Paper
3.6.5 Process Description
Raw material procurement and storage
Bagasse is the main raw material used in pulp and paper industry. Local and imported waste
paper is also used as raw material besides bagasse. The processing for waste paper is however
started from the hydro-pulping process.
Pulping
The bagasse is cooked in pressurized vessels called digesters. Approximately 12-16% of
Sodium Sulphite is added to the loaded raw material and 10 m3 of water at 90-95°C is added
per ton of raw material. The mixture is cooked with 7-kg/cm2 steam pressures for about 5 hrs.
The digester is rotated at 0.4 rpm (approx.). Typically, delignification requires several hours at
170 to 176 °C (338 to 349 °F). Under these conditions, lignin and hemicellulose degrade to
give fragments that are soluble in the strongly basic liquid.
Blowing
The cooked bagasse and wheat straw are blown to a collection tank called a blow tank that
operates at atmospheric pressure. This releases a lot of steam and volatiles.
Screening
Screening of the pulp after pulping is a process whereby the pulp is separated from large shives,
knots, dirt and other debris. The accepted mass is the pulp. The material separated from the
pulp is called reject. The screening section consists of different types of sieves (screens) and
centrifugal cleaning. The sieves are normally set up in a multistage cascade operation because
considerable amounts of good fibers can go to the reject stream when trying to achieve
maximum purity in the accept flow. The fiber containing shives and knots are separated from
the rest of the reject and reprocessed either in a refiner or is sent back to the digester.
Washing
The brown stock from the blowing goes to the washing stages where the used cooking liquors
are separated from the cellulose fibers. Normally, a pulp mill has 3-5 washing stages in series.
Pulp washers use counter current flow between the stages such that the pulp moves in the
opposite direction to the flow of washing waters. Several processes such as thickening /
dilution, displacement and diffusion are involved.
Bleaching
Pulp must be bleached if it is used to make white paper. The objective of bleaching is to render
the pulp white without degrading the cellulose. Some grades of paper don’t need bleaching at
all (such as corrugated cardboard boxes) while others (newsprint) are given only light
bleaching. Better grades of printing and writing papers require bleaching. Almost all bleaching
is carried out with chlorine or chlorine compounds, leaving an effluent containing high levels
of chemicals. In addition, bleaching is an energy intensive process and increases the energy
intensity of papermaking by about 20 percent.
Stock preparation
Stock from the poacher and decker is transferred to the storage and chemical chest for sizing
by adding alum and rosin. From the final storage chest stock goes through centricleaners to
remove silica and other unwanted materials. Cleaned pulp stock flows to the stock regulation

Energy Audit Guidelines for Industrial Sectors
38
box for adjustment to the required consistency of the pulp by mixing recycled back water at
fan pump.
Paper Making
Diluted stock is fed to the head box and discharged on the wire part of the paper machine where
fibers form a uniform mat on the wire. Water is discharged through the wire and collected in
the wire pit. The wet paper is de-watered mechanically using suction top vacuum and presses
in 2-stage. The remaining moisture is dried in the MG drier cylinder using thermal energy.
Dried paper is rolled into a spool at pop reel.
Re-winding section
Paper rolls are cut and rewinded to the required width. After quality checking, rolls are
wrapped, strapped and stored for dispatch.
3.6.6 Significant energy used area and equipment in pulp and paper industries
The following area and equipment consume significant amount of energy:
• Boiler and Steam Distribution;
• Induction Motors;
• Compressor;
• Digester;
• Paper Mill and,
• Diesel Generator.
3.6.7 Sampling and measurement for energy audit
For Electrical System
The following electrical parameters are needed to be measured for electrical energy audit in
pulp and paper industries:
Data Logging: 24 hours of data logging at main electrical pannel with the help of Three Phase
Data Logger. It shows power factor, total load in kW & kVA, peak demand, voltage, current,
harmonics.
Load Measurement: Load measurement in all individual induction motors with the help of
handheld power analyzer. It shows kW, kVA, ampere and power factor.
Lighting Load Measurement: Load measurement at main lighting pannel with the help of
handheld power analyzer.
Lighting details: Collection of lighting types with wattages, running hours and installed
location.
Pumping Load Measurement: Measure power consumption and head discharge for
performance evaluation.
Air Compressor: Conduct FAD test, identify leakage in distribution system.
Diesel Generator: Calculate kilowatt hour generation in per litre of fuel.
The following parameters are needed to be measured for thermal energy audit in pulp and paper
industries:
Boiler:
o Flue Gas Analysis: Measure oxygen, carbondioxide, carbonmonoxide, stack &
ambient temperature.

Energy Audit Guidelines for Industrial Sectors
39
o Surface Heat Loss Measurement: Measure surface temperature of body and steam
pipelines.
o Feed Water Analysis: Measure pH, TDS, hardness, TSS and temperature.
o Blow Down Water Analysis: Measure pH & TDS.
o Economizer & Air Preheater: Measure inlet and outlet temperature.
3.6.8 Potential Energy Conservation Opportunity in Pulp and Paper Industries
The following energy conservation opportunities can be found in pulp and paper industries:
Table 3.12: Energy conservation opportunity in pulp and paper industries
S.N. Energy Conservation Opportunities Types of
investment
1 Electricity Demand Management No Cost
2 Excess Air Control in Boiler
3 Feed less moistered fuel to boiler
4 Regular cleaning of lighting sources
5 Regular cleaning of all heat exchanger
6 Install capacitor bank with APFC units for Power Factor
Improvement
Low Cost
7 Replace conventional lamp with LED
8 VFD for vaccuum Pump, agitator and Motor
9 Replace old pump and motor with energy efficient pump & motor
10 Insulation of bare steam pipes and fittings
11 Install Economiser and air pre heater in Boiler
12 Install on load tap changer in transformer
14 Replacement of old compressors with new energy efficient
compresors
Cost
Demanding
15 Install Condensate Recovery System
16 Install Super Heater
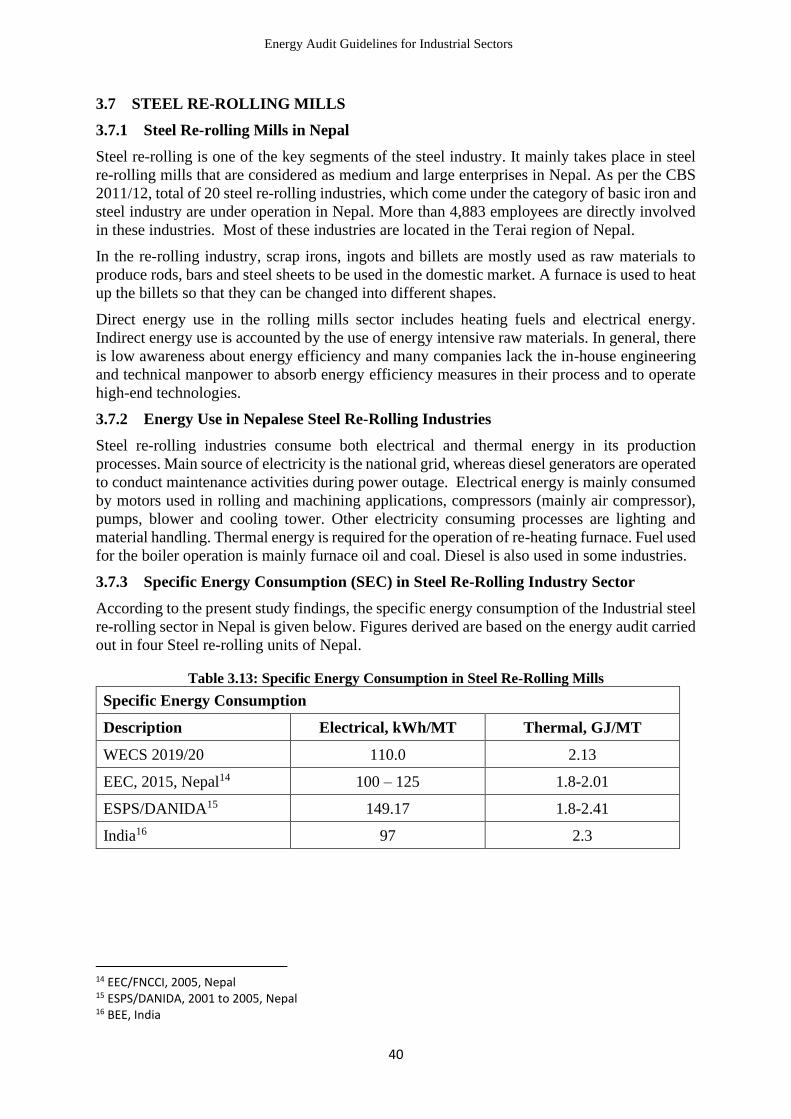
Energy Audit Guidelines for Industrial Sectors
40
3.7 STEEL RE-ROLLING MILLS
3.7.1 Steel Re-rolling Mills in Nepal
Steel re-rolling is one of the key segments of the steel industry. It mainly takes place in steel
re-rolling mills that are considered as medium and large enterprises in Nepal. As per the CBS
2011/12, total of 20 steel re-rolling industries, which come under the category of basic iron and
steel industry are under operation in Nepal. More than 4,883 employees are directly involved
in these industries. Most of these industries are located in the Terai region of Nepal.
In the re-rolling industry, scrap irons, ingots and billets are mostly used as raw materials to
produce rods, bars and steel sheets to be used in the domestic market. A furnace is used to heat
up the billets so that they can be changed into different shapes.
Direct energy use in the rolling mills sector includes heating fuels and electrical energy.
Indirect energy use is accounted by the use of energy intensive raw materials. In general, there
is low awareness about energy efficiency and many companies lack the in-house engineering
and technical manpower to absorb energy efficiency measures in their process and to operate
high-end technologies.
3.7.2 Energy Use in Nepalese Steel Re-Rolling Industries
Steel re-rolling industries consume both electrical and thermal energy in its production
processes. Main source of electricity is the national grid, whereas diesel generators are operated
to conduct maintenance activities during power outage. Electrical energy is mainly consumed
by motors used in rolling and machining applications, compressors (mainly air compressor),
pumps, blower and cooling tower. Other electricity consuming processes are lighting and
material handling. Thermal energy is required for the operation of re-heating furnace. Fuel used
for the boiler operation is mainly furnace oil and coal. Diesel is also used in some industries.
3.7.3 Specific Energy Consumption (SEC) in Steel Re-Rolling Industry Sector
According to the present study findings, the specific energy consumption of the Industrial steel
re-rolling sector in Nepal is given below. Figures derived are based on the energy audit carried
out in four Steel re-rolling units of Nepal.
Table 3.13: Specific Energy Consumption in Steel Re-Rolling Mills
Specific Energy Consumption
Description Electrical, kWh/MT Thermal, GJ/MT
WECS 2019/20 110.0 2.13
EEC, 2015, Nepal14 100 – 125 1.8-2.01
ESPS/DANIDA15 149.17 1.8-2.41
India16 97 2.3
14 EEC/FNCCI, 2005, Nepal 15 ESPS/DANIDA, 2001 to 2005, Nepal 16 BEE, India

Energy Audit Guidelines for Industrial Sectors
41
3.7.4 General Process Flow Chart
General flowchart of TMT bar production process is given below:
Resources Process Wastes & Hazards
Prime Billet → Receiving and Storing → Rust Iron, Iron Scales
Electricity → Billet Shearing → Iron Scale
Rejected billets
Electricity →
Feeding to the furnace → Iron Scale
Electricity
Furnace Oil →
Heating
(in the furnace) →
Heat
Electricity → Primary Rolling → Iron dust, Heat, Fumes
Rejected pieces
Electricity → Intermediate/finish Rolling → Iron dust, Heat, Fumes
Electricity →
End Cutting →
Process Waste
Heat
Compressed air
Water
Electricity →
Quenching
(TMT) →
Heat
Waste water
Electricity →
Quality Inspection
(Hardness test, ring test, tensile
test)
→ Rejected products
Electricity
Rod pieces for bundling → Bundling and Weighing → Cut pieces
TMT Bar
Figure 3.8: General Process flowchart of steel re-rolling mill
3.7.5 Process Description
Mild Steel billets of different area cross-section and length is mainly imported from India.
These billets are the major raw material for the steel re-rolling industry for the production of
TMT bars.
Billet Shearing
MS billets are transferred to the conveyer of the shearing machine by winch or overhead crane
from the adjacent stockpile. The billets travel to the stopper in the conveyer such that the length
of the sheared piece is as set by the operator. The billet is then cut to the required size by the
shearing machine. Some industries also use in house MS ingots.
Billet Heating
Sheared billets or in house ingots are transferred to the chain conveyer of the furnace. These
billets are charged inside the furnace by pusher and travel through preheating zone, heating and

Energy Audit Guidelines for Industrial Sectors
42
soaking zone of the furnace before being ejected for rolling process. Billets are heated up to
1050 - 1150 C in the furnace.
Rolling
The hot billets pass through roughing stands. There are normally four stands in the roughing
unit. The first stand reduces sectional area of billets in eight stages. The second stand reduces
sectional area in two stages, the third stand reduces sectional area in two stages and finally the
fourth stand reduces sectional area in a single stage. After completion of roughing process,
billets now in the form of deformed rod is passed through the finishing mill. There are two
sections in the finishing mill, intermediate and final finishing. In between roughing and
finishing mill, there is a system to cut the ends of rolled heated billets which is important to
overcome the problems of miss roll formation.
TMT (Thermo-mechanical treatment)
The billet temperature again drops down to 900˚C- 950˚C during its travel through mills and
thus reaching quenching process. At quenching stage, the billets are passed through high jet
cold water, where the temperature is instantaneously brought down to 250˚C. The iron rods are
then stockpiled according to the size in a yard and finally loaded and transported by trucks to
destination. The detailed process is presented below:
TMT bar stands for Thermo Mechanically Treated bar. In this process, steel billets/ingots that
are heated in a reheating furnace and rolled through a sequence of rolling stands, which
progressively reduces the cross section of billets/ingots to the finished size and shape of the
TMT reinforcement bar. This hot bar after exiting from the rolling process is quenched and
self-tempered to give the bar more strength and ductility through three steps.
Quenching
A high pressure water spray system is used on the hot rolled bar to turn its periphery into a
martensite zone (hard zone), while keeping its inner surface ferrite perlite.
Self – Tempering
In this stage, the bar leaves the quenching system with the temperature of the core being much
higher than that of the surface. That makes heat to flow from the core to the surface, making
the surface tempered, and a structure that is called "Tempered Martensite".
Atmospheric cooling
In this final stage, cooling takes place on the cooling bed where the final structure consists of
hard outer periphery making it more stronger, more corrosion resistant and fire resistant. The
soft inner surface gives the metal ductility (more bendability & elongation), and better fatigue
resistance able to withstand natural calamities and other forces better. The production of
quality TMT bar depends on three major factors - quality of raw materials, a properly designed
and automated mill, and a well-designed quenching the tempering technology.
Cutting
Shearing machines cut the cooled rolled bars to the specified length.
Bundling and quality control
Specified numbers of bars are then bundled together by rings and are bent from the middle.
They are then tied with “S” shaped hooks. Sampling is done from the finished product for
quality check and approval.

Energy Audit Guidelines for Industrial Sectors
43
3.7.6 Significant energy used area and equipment in steel re-rolling mills
The following area and equipment consume significant amount of energy:
• Furnace;
• Induction;
• Pumping System;
• Cooling Tower;
• Coal Crusher;
• Lighting;
• Compressor and,
• Diesel Generator.
3.7.7 Sampling and measurement for energy audit
The following electrical parameters are needed to be measured for electrical energy audit in
steel re-roling industries:
Data Logging: 24 hours of data logging at main electrical pannel with the help of Three Phase
Data Logger. It shows power factor, total load in kW & kVA, peak demand, voltage, current,
harmonics.
Load Measurement: Load measurement in all individual induction motors with the help of
handheld power analyzer. It shows kW, kVA, ampere and power factor.
Lighting Load Measurement: Load measurement at main lighting pannel with the help of
handheld power analyzer.
Lighting details: Collection of lighting types with wattages, running hours and installed
location.
Pumping Load Measurement: Measure power consumption and head discharge for
performance evaluation.
Air Compressor: Conduct FAD test, identify leakage in distribution system.
Diesel Generator: Calculate kilowatt hour generation in per litre of fuel.
The following thermal parameters are needed to be measured for thermal energy audit in steel
re-roling industries:
Furnace:
o Flue Gas Analysis: Measure oxygen, carbondioxide, carbonmonoxide, stack &
ambient temperature.
o Surface Heat Loss Measurement: Measure surface temperature of body and steam
pipelines.
o Recuperator: Measure inlet and outlet temperature.
Heat Exchanger: Measure inlet and outlet temperature.
Cooling Tower: Measure inlet and outlet temperature.

Energy Audit Guidelines for Industrial Sectors
44
3.7.8 Potential Energy Conservation Opportunity in Steel Re-Rolling Mills
The following energy conservation opportunities can be found in steel re-rolling mills:
Table 3.14: Energy conservation opportunities in steel re-rolling mills
S.N. Energy Conservation Opportunities Types of
investment
1 Electricity Demand Management No Cost
2 Optimum supply of air in Furnace
3 Optimum opening of furnace door to reduce heat loss
4 Use less moistured fuel in Furnace
5 Reduce retention time of billette in furnace for prevention of
scaling
6 Use rolled billets in place of continuous cast billets to save
electrical energy
7 Power Factor Improvement by installing capacitor bank with
APFC units
Low Cost
8 Install Temperature measuring device in all zone of Furnace, stack
and inlet air
9 Replace conventional lamp with LED
10 Install VFD for Pumps and Motors
11 Replace old pump and motor with energy efficient pump & motor
12 Repair Insulation of Furnace
13 Install Recupuretor Cost
Demanding 14 Ceramic paint coating inside the furnace

Energy Audit Guidelines for Industrial Sectors
45
3.8 SUGAR MILLS
3.8.1 Sugar Mills in Nepal
Sugar industries are the agriculture based seasonal industries. As per the CBS 2011/12, there
are 54 sugar industries under operation in Nepal. Among them, only 13 are considered large
scale sugar industries. These mills have 800 to 5000 TCD capacities to crushed sugarcane per
day (DoI, 2019). Due to the availability of the main raw material i.e. sugarcane, most of the
sugar industries are located in the Terai region. Large-scale sugar industries have the semi-
automatic type of production system. It produces different grades of sugar and molasses as a
byproduct. Sugarcane is the main raw material of this industry and it also consumes many
chemicals for processing and purification of sugar.
Larger capacities of boilers are operated in large-scale sugar industries. Sugar mills use their
own byproduct “Baggasse” as a fuel for boiler. All the large-scale sugar industries have
cogeneration system, so they generate electricity for their own use.
3.8.2 Energy Use in Nepalese Sugar Industries
Sugar industries consume both electrical and thermal energy in their production processes. The
combined heat and power (CHP) system also known as co-generation serves as the major
source of energy for the plant during the crushing season. However, electricity supply from the
Nepal Electricity Authority (NEA) is the main source of energy to the plant during non-
crushing season. Major electrical energy consuming areas are motors installed in the cane
cutters, cane kicker, fibriser, milling tandem, pumps, vacuum system, carriers, centrifuges, ID
and FD fans of boiler and compressed air generation. Thermal energy is mainly for generation
of electrical power in the co-generation plant and for process heating.
3.8.3 Specific Energy Consumption (SEC) in Sugar Sector
According to the present study findings, the specific energy consumption of the Industrial sugar
sector in Nepal is given below. Figures derived are based on the energy audit carried out in
four sugar industry units of Nepal.
Table 3.15: Specific Energy Consumption in Sugar Sector
Specific Energy Consumption
Description Electrical, kWh/MT
(Cane Crushed)
Thermal, GJ/MT
(Cane Crushed)
WECS 2019/20 33.5 4.03
ESPS/DANIDA 17 45 – 50 4.11
India18 22 3.48
17 ESPS/DANIDA, 2001 to 2005, Nepal 18 BEE, India

Energy Audit Guidelines for Industrial Sectors
46
3.8.4 General Process Flow Chart
General process flowchart for sugar production is given below:
Input Process Output
Sugar cane Can Preparation & Cutting
Electricity Cane chips spillage
Manpower
Electricity Chopping Cane chips spillage
Manpower
Steam from Boiler Fiberizing
Condensate (Reused)
Electricity Fiber spillage
Manpower Heat loss
Steam from Boiler Four Stage
Milling
Bagasse (Used in Boiler)
Electricity
Condensate (Reused)
Water Juice & water spillage
Manpower Heat loss
Electricity Filtration
Bagasse fiber
Manpower Juice spillage
Electricity Juice weighing Juice spillage
Manpower Heat loss
Steam from Boiler Heating (70
0 C)
Condensate (Reused)
Electricity Juice spillage
Manpower Heat loss
Sulphur
Liming and Sulphitation
Phosphor Sulphur fume
Water Juice spillage
Electricity Wastewater
Manpower
Steam form Boiler Juice Heating (102
0 C)
Condensate
Electricity Heat loss
Manpower
Coagulant Juice Clarification
Water
Electricity Muddy juice
Manpower Electricity
12% dissolved solid Syrup
Steam from Boiler QUAD Evaporation
(T 120- 85 0C; Vacuum 400-700 Hg level)
Condensate (Reused)
Electricity Juice spillage
Manpower Heat loss
60% dissolved solid Syrup T 55-60 0C
Sulphur 2nd Sulphitation (Bleaching)
Sulphur fume
Electricity Syrup spillage
Manpower
Steam from boiler Concentrating /Crystallization
Condensate
Electricity Syrup spillage
Manpower
Boiler
Bagasse Firew ood
Water Electricity
Manpow er
Ash
Heat loss Exhaust gas
Water spillage Press mud
Press
mud
Vacuum
Filtration
Vacuum
Filtration
Dilute juice
Power
generation

Energy Audit Guidelines for Industrial Sectors
47
Figure 3.9: Sugar Production Process Flowchart
3.8.5 Process Description
The process in the sugar plant starts with the cane preparation process and subsequently
followed by processes as described below:
Cane Preparation
The cane from transportation means is unloaded with the help of three unloaders into the cane
carrier. The cane carrier transports cane to the cane mill. Cane kicker installed over the carrier
helps to push back the cane to regulate the flow. The cane leveler further helps to level the cane
to the bed height with the help of rotating knives. Cane cutter, which is a rotating drum with
knives on its hub, cuts the incoming cane to small pieces. The pusher regulates the correct flow
into the fibriser. The fibriser, which consists of rotating drum with arm filled with swing
hammers, helps to fibrise the cane. The preparation index of the prepared cane is maintained
at 80 to 85 %.
Rack Carrier, transports the prepared cane from the fibrizer to the belt conveyor. Over the belt
conveyor, magnetic separator helps in capturing iron pieces, if any. The belt conveyor feeds
the fibrised, cleaned cane to the first mill.
Milling:
There are five sets of mills, each having three rollers. These are the top roller, feed roller and
discharge roller. The rollers squeeze the cane fibers and the juice move to the troughs. The
juice rich bagasse from one mill move to the next mill.
The bagasse obtained after de-juicing the cane in the mills is transported in the rake conveyors
towards the boilers. The opening slots provided in the trough of the rake transporter facilitates
feeding the bagasse to the individual boilers. The balance bagasse is transported to the bagasse
storage yard. The return bagasse carrier transports the bagasse from the bagasse storage yard
to the main carrier whenever necessary.
Input Process Output
Steam from boiler Centrifuging
Condensate
Electricity Mascuite spillage
Manpower Molasses
A Sugar
Steam from boiler Drying
Condensate
Electricity Sugar dust emission
Manpower Sugar spillage
Electricity Cooling Sugar spillage Manpower
Electricity Screening
Sugar spillage
Manpower Off size sugar Sugar dust emission
Packing shacks Packing
Damaged packing shacks
Electricity Sugar spillage
Manpower
Manpower Storing Mice eating
Ready for dispatch
Molasses
Con./Crystal
Con./Crystal
Molasses
C Sugar
B Sugar
Centrifuging
Centrifuging
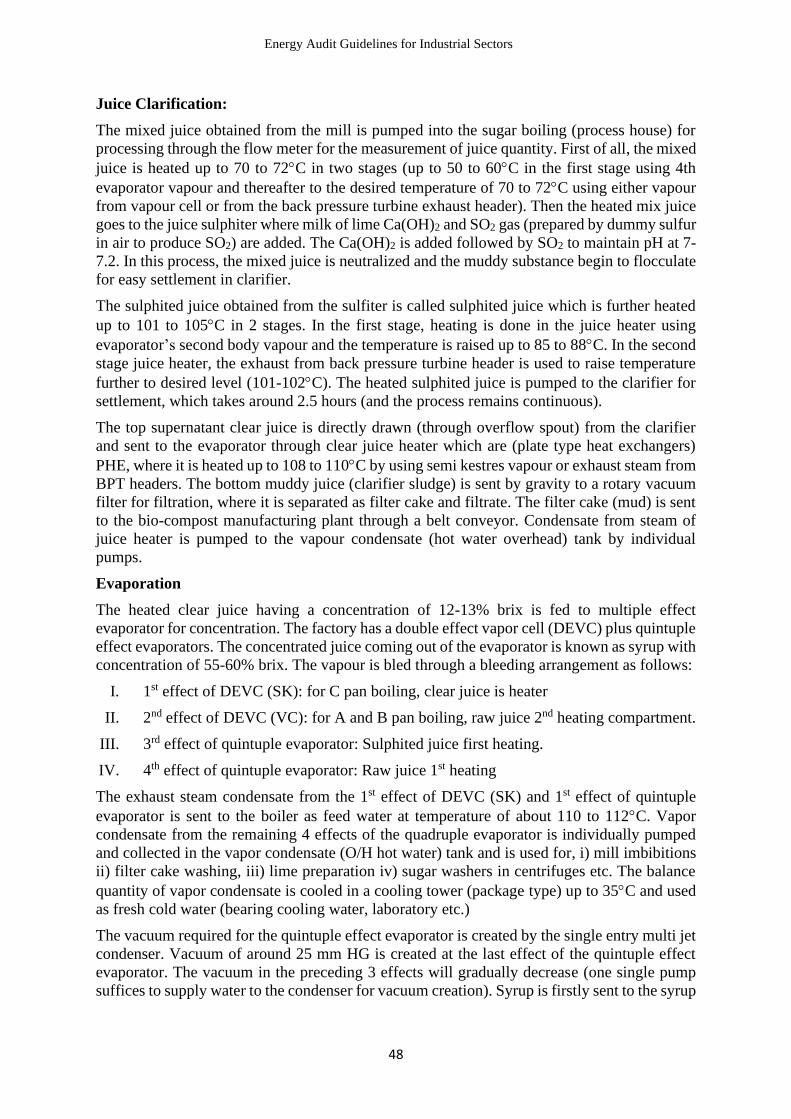
Energy Audit Guidelines for Industrial Sectors
48
Juice Clarification:
The mixed juice obtained from the mill is pumped into the sugar boiling (process house) for
processing through the flow meter for the measurement of juice quantity. First of all, the mixed
juice is heated up to 70 to 72C in two stages (up to 50 to 60C in the first stage using 4th
evaporator vapour and thereafter to the desired temperature of 70 to 72C using either vapour
from vapour cell or from the back pressure turbine exhaust header). Then the heated mix juice
goes to the juice sulphiter where milk of lime Ca(OH)2 and SO2 gas (prepared by dummy sulfur
in air to produce SO2) are added. The Ca(OH)2 is added followed by SO2 to maintain pH at 7-
7.2. In this process, the mixed juice is neutralized and the muddy substance begin to flocculate
for easy settlement in clarifier.
The sulphited juice obtained from the sulfiter is called sulphited juice which is further heated
up to 101 to 105C in 2 stages. In the first stage, heating is done in the juice heater using
evaporator’s second body vapour and the temperature is raised up to 85 to 88C. In the second
stage juice heater, the exhaust from back pressure turbine header is used to raise temperature
further to desired level (101-102C). The heated sulphited juice is pumped to the clarifier for
settlement, which takes around 2.5 hours (and the process remains continuous).
The top supernatant clear juice is directly drawn (through overflow spout) from the clarifier
and sent to the evaporator through clear juice heater which are (plate type heat exchangers)
PHE, where it is heated up to 108 to 110C by using semi kestres vapour or exhaust steam from
BPT headers. The bottom muddy juice (clarifier sludge) is sent by gravity to a rotary vacuum
filter for filtration, where it is separated as filter cake and filtrate. The filter cake (mud) is sent
to the bio-compost manufacturing plant through a belt conveyor. Condensate from steam of
juice heater is pumped to the vapour condensate (hot water overhead) tank by individual
pumps.
Evaporation
The heated clear juice having a concentration of 12-13% brix is fed to multiple effect
evaporator for concentration. The factory has a double effect vapor cell (DEVC) plus quintuple
effect evaporators. The concentrated juice coming out of the evaporator is known as syrup with
concentration of 55-60% brix. The vapour is bled through a bleeding arrangement as follows:
I. 1st effect of DEVC (SK): for C pan boiling, clear juice is heater
II. 2nd effect of DEVC (VC): for A and B pan boiling, raw juice 2nd heating compartment.
III. 3rd effect of quintuple evaporator: Sulphited juice first heating.
IV. 4th effect of quintuple evaporator: Raw juice 1st heating
The exhaust steam condensate from the 1st effect of DEVC (SK) and 1st effect of quintuple
evaporator is sent to the boiler as feed water at temperature of about 110 to 112C. Vapor
condensate from the remaining 4 effects of the quadruple evaporator is individually pumped
and collected in the vapor condensate (O/H hot water) tank and is used for, i) mill imbibitions
ii) filter cake washing, iii) lime preparation iv) sugar washers in centrifuges etc. The balance
quantity of vapor condensate is cooled in a cooling tower (package type) up to 35C and used
as fresh cold water (bearing cooling water, laboratory etc.)
The vacuum required for the quintuple effect evaporator is created by the single entry multi jet
condenser. Vacuum of around 25 mm HG is created at the last effect of the quintuple effect
evaporator. The vacuum in the preceding 3 effects will gradually decrease (one single pump
suffices to supply water to the condenser for vacuum creation). Syrup is firstly sent to the syrup

Energy Audit Guidelines for Industrial Sectors
49
sulfiter where it is sulpited up to the pH of 5.5-5.2 by blowing SO2 gas. Here the bleaching
action occurs and viscosity is reduced.
Juice Crystallization:
Seven numbers of vacuum pans are used for the crystallization of sugar. The distribution is as
follows:
i) 3 nos. for A massecute boiling
ii) 2 nos. for B masecute boiling
iii) 2 nos. for C massecute boiling.
Here, vacuum in each pan is created by individual condensers. The pressurized water is
supplied through a common header fed by four pumps at a time. There are seven condenser
pumps in total, of which one pump is for quintuple evaporator, four are for pans and two are
standby.
“A” massecute is prepared using sulfited syrup, sugar melt obtained from melting of B and C
sugar and dry seed (mother crystals) from sieve of sugar grades. It is dropped to the ‘A’
crystallizer when desired size of crystal is attained. The crystallizer helps further crystallization
as well as acts as a massecute storage vessel.
A massecute is cured using flat bottom plough centrifugal machines where sugar crystals and
mother liquor (molasses) are separated. Sugar is then conveyed and dried in grass- hoppers.
Sugar is then sent to a vibrating screen feeder where it is graded. The Crystals below the desired
size is separated and used as mother crystals (seed) for A-pan boiling. The graded sugar is sent
to the sugar packing section through a belt conveyor where it is bagged in 50 kg bags.
The molasses obtained from the A-massecute in curing is known as A-molasses, which is used
for B-massecute boiling. The B-massecute is similarly centrifuged and the B sugar and B
molasses is obtained. The B molasses is again crystallized in C-pan to obtain C-massecute.
The C-massecute is centrifuged to obtain c-sugar and final molasses. The C-sugar is double
cured (again centrifuged) and the double cured C-sugar along with B-sugar is melted in a sugar
melter and sent to A-pan for A-massecute preparation. The final molasses is sent to the
molasses storage tank as a raw material for distillery plant with a concentration of around 80-
90% brix.
3.8.6 Significant Energy used area and equipment in Sugar Industries
The following area and equipment consume significant amount of energy:
• Boiler and Steam Distribution;
• Co-generation;
• Induction Motors;
• Milling;
• Lighting;
• Pumping System;
• Cooling Tower;
• Compressor;
• Diesel Generator;
• Heat Exchanger and,
• Water Treatment Plant.

Energy Audit Guidelines for Industrial Sectors
50
3.8.7 Sampling and measurement for energy audit
The following electrical parameters are needed to be measured for electrical energy audit in
sugar industries:
Data Logging: 24 hours of data logging at main electrical pannel with the help of Three Phase
Data Logger. It shows power factor, total load in kW & kVA, peak demand, voltage, current,
harmonics.
Load Measurement: Load measurement in all individual induction motors with the help of
handheld power analyzer. It shows kW, kVA, ampere and power factor.
Lighting Load Measurement: Load measurement at main lighting pannel with the help of
handheld power analyzer.
Lighting details: Collection of lighting types with wattages, running hours and installed
location.
Pumping Load Measurement: Measure power consumption and head discharge for
performance evaluation.
Air Compressor: Conduct FAD test, identify leakage in distribution system.
Diesel Generator: Calculate kilowatt hour generation in per litre of fuel.
The following thermal parameters are needed to be measured for thermal energy audit in sugar
industries:
Boiler:
o Flue Gas Analysis: Measure oxygen, carbondioxide, carbonmonoxide, stack &
ambient temperature.
o Surface Heat Loss Measurement: Measure surface temperature of body and steam
pipelines.
o Feed Water Analysis: Measure pH, TDS, hardness, TSS and temperature.
o Blow Down Water Analysis: Measure pH & TDS.
o Economizer & Air Preheater: Measure inlet and outlet temperature.
Heat Exchanger: Measure inlet and outlet temperature.
Cooling Tower: Measure inlet and outlet temperature.
3.8.8 Potential Energy Conservation Opportunity in Sugar Industries
The following energy conservation opportunities can be found in sugar industries:
Table 3.16: Energy conservation opportunities in sugar industries
S.N. Energy Conservation Opportunities Types of
investment
1 Electricity Demand Management No Cost
2 Excess Air Control in Boiler
3 Savings achievable by Proper Boiler tuning.
4 Reduction in moisture content of bagasse used in boiler from 50
% to 30 %.
5 Contro steam leakages from valve and flanges
6 Regualr FAD in Compressor

Energy Audit Guidelines for Industrial Sectors
51
7 Install capacitor bank with APFC units for Power Factor
Improvement
Low Cost
8 Replace conventional lamp with LED
9 Install VFD for Pumps and Motors
10 Replace old pump and motor with energy efficient pump & motor
11 Insulation of bare steam pipes and fittings
12 Install Economiser and Air Pre Heater in Boiler
13 Regular Cleaning of heat exchanger
14 Install Condensate Recovery System Cost
Demanding 15 Install Efficient turbine to generate electricity
16 Install Super Heater
3.8.9 Benefits of Cogeneration in Sugar Industries
Cogeneration is defined as the generation of electricity and heat from the same energy source.
The term is often applied to systems that use waste material from an industrial process to
generate steam, which is used to generate electricity and process heat for the industrial process
itself. Sugar mills, where bagasse leftover from cane crushing is used to generate steam, which
conventionally powers a steam turbine generator and produces heat for the sugar production
process. The electricity produced is often more than what is required in the mill, and is usually
fed into the grid. This surplus electricity is an important asset as it can be sold to the utility.
Bagasse is the fibrous residue of cane stalk obtained after crushing and the extraction of juice
in sugar mills. Each ton of sugarcane can yield 250 kg of bagasse. The composition of bagasse
varies with variety and maturity of sugarcane as well as with harvesting methods used and
efficiency of the sugar mill in processing the sugarcane. Every ton of sugar has an energy
potential equivalent to that of 1.2 barrels of petroleum. Sugar mills have been designed to meet
their energy requirements by burning bagasse: this was seen as an economic means of
producing electricity whilst cheaply disposing of bagasse.
Electricity costs and tariff hikes are making it profitable for sugar mills to generate surplus
electricity from biomass such as bagasse and supply to the grid. In most sugar mills, the bagasse
produced exceeds what is required for both sugar production and mill electricity demand, and
could be used to produce carbon neutral electricity for sale to the grid. The process of bagasse
cogeneration is sketched out in the figure below.
Figure 3.10: Overview of Bagasse Cogeneration
Almost all sugar mills are self-sufficient in terms of energy supply and many of them have
been selling their surplus electricity to the grid. In many mills, the bagasse production is more

Energy Audit Guidelines for Industrial Sectors
52
than required for the daily energy requirements of the mill, and excess can be stored for
electricity production in the off season. This is only possible with a steam cycle where steam
production can be separated from the process steam usage cycle. The inclusion of sugar trash
in the fuel used for boiler makes a tremendous difference to the amount of electricity that can
be generated.
Note: The performance calculation for steam turbine and gas turbine is in Annex 15.

Energy Audit Guidelines for Industrial Sectors
53
CHAPTER 4: ENERGY CONSERVATION OPPORTUNITIES IN
INDUSTRIAL SECTORS
4.1 Electrical load and demand management
In Nepal, electricity billing adopted for industrial sectors has two parts where a consumer pays
for two components:
• For the maximum demand (kVA) recorded during the billing duration; and
• For the energy (kWh) consumed during the billing duration.
Maximum demand charge is related to the fixed cost of capacity blocked for serving a
consumer’s needs. A tri-vector meter installed at the consumer’s end records the maximum
demand registered by a consumer during billing duration, apart from other important
consumption features such as active power (kW), reactive power, apparent power, and power
factor (PF).
Typical billing pattern by NEA for an industrial sector having 11 kV electricity supply is given
below. Tariff scheme for industries/units with different voltage system is not identical and has
to be verified from company’s utility. Tariffs are generally subjected to variation over a period
of time.
Table 4.1: Electricity tariff (NEA) applicable to industrial sectors from Baishak to Mangsir
2074/75
S.N Period NPR./kWh
1. Peak time (5 PM to 11 PM), T1 10.50
2. Normal time (5 AM to 5 PM), T2 08.52
3. Off peak time (11 PM to 5 AM), T3 05.40
Demand charges NPR.250/kVA
Table 4.2: Electricity tariff (NEA) applicable to industrial sectors from Poush to Chaitra
2074/75
S.N Period NPR./kWh
1. Peak time (5 PM to 11 PM), T1 10.50
2. Normal time (5 AM to 5 PM), T2 08.52
3. Off peak time (11 PM to 5 AM), T3 08.52
Demand charges NPR.250/kVA
Electrical load management is the process of scheduling load usage so as to reduce electricity
use during peak load periods. This measure will help in reducing electrical energy cost as the
tariff during normal and off-peak hours is lower than in peak hours.
Demand management commonly refers to a set of measures taken to reduce the maximum
demand of a system without affecting the plant output.
The conventional methods used to achieve this purpose are:
• Staggering of working of sub-plants.
• Shedding (arbitrary) of loads.

Energy Audit Guidelines for Industrial Sectors
54
• Make use of alternative source of electrical energy, providing cogeneration/captive
generating units.
• Storage of products such as water at higher level, components for assembly, fluids at
higher/lower temperature etc.
• Power factor improvement.
Automatic demand controllers could be used to switch off low priority loads to reduce
maximum demand.
4.2 Power factor management
The power factor (PF) is the ratio of working power to apparent power. When current lags the
voltage like in inductive loads, it is known as lagging power factor and when current leads the
voltage like in capacitive loads, it is known as leading power factor.
Power Factor = [Working Power (kW) /Apparent Power (kVA)] = Cos ɸ
PF = [kW/kVA] = Cos ɸ
Where,
If power factor is maintained at close to unity, power drawn by the load is reduced eventually
reducing the maximum demand. It also reduces electrical losses resulting from reduced reactive
current drawn by the load. This helps in enhancing the system capacity.
Installing and maintaining properly sized capacitors help reduce the reactive power of inductive
loads and to improve power factors at the user end. Benefits of improved voltage are also
achieved due to this measure.
Advantages of PF improvement by capacitor addition:
• Reactive component of the network is reduced and hence also the total current in the
system from the source end.
• I2R power losses are reduced in the system because of reduction in current.
• Voltage level at the load end is increased.
• A high power factor can help in utilizing the full capacity of your electrical system.
4.3 Improvement of operational performance of electric motor
Operational performance of electric motor can be achieved in following ways:
4.3.1 Motor System Maintenance
It is vital to ensure that equipment driven by electric motors is kept clean, lubricated and
correctly aligned, paying particular attention to drive couplings and gear or belt systems where
small changes in shaft alignment can result in excessive wear and energy loss, vibration and
premature failure.
Motors should also be maintained regularly including cleaning of ventilation grills and fans to
ensure that they do not overheat. As the temperature of the motor conductors rise, the resistance
increases and the electrical heating losses increase, leading to a lower efficiency and shorter
equipment life.
4.3.2 Maintain supply voltage close to rated specification
Efficiency of an electric motor reduces by approximately 2 to 4 points when operating at less
than 95 % of design voltage and the service temperatures increase up to 20 ºF greatly reducing

Energy Audit Guidelines for Industrial Sectors
55
life of insulation. Running a motor above its design voltage also reduces power factor and
efficiency. Similarly running a motor with unbalanced supply voltage also reduces motor
performance.
4.3.3 Minimize Rewinding Losses
During a motor failure, or in the stripping of the winding from the stator core prior to rewinding,
heating involved causes exposure to high temperatures. These temperatures can, in many cases,
affect the electrical characteristics of the stator core steel and result in increased iron losses and
lower motor efficiency. Rewinding can thus reduce motor efficiency and reliability. It is always
advisable to keep record of no load electrical parameters of any given motor when purchased
to compare it later when rewinding or over hauling is done.
4.3.4 Optimize transmission efficiency by use of efficient belts and gears
Power transmission equipment plays a crucial role in energy consumption by the electric motor.
Motor power transmission equipment, including shafts, belts, chains, and gears, should be
properly installed and maintained. Use of flat belts in place of V-belts improves transmission
efficiency.
4.3.5 Optimize motor loading
Under loading results in lower efficiency and lower power factor, higher first cost for the motor
and related control equipment and installation cost. Under loading also results from selecting
a large motor for an application requiring high starting torque would have been suitable. Large
motors inherent have higher rated efficiencies than smaller motors. Therefore, the replacement
of motors operating at 60-70% of capacity or higher is generally not recommended.
For motors, which normally operate at loads below 40-45% of rated capacity, an inexpensive
and effective measure might be to employ delta/star switches. A change from the standard
delta operation to star operation involves input. Operating in the star mode leads to voltage
reduction of 3 per phase. Motor output falls to one-third of the value in delta mode, but
performance characteristics as a function of load remain unchanged. Thus, full load operation
in star mode gives higher efficiency and power factor than partial load operation in the delta
mode. However, motor operation in the star mode is possible only for applications where
torque to speed requirement also reduces with reduced load.
4.3.6 Speed control of induction motors
An induction motor is an asynchronous motor the speed of which can be varied by changing
the supply frequency. The speed can be varied by other means such as varying the input voltage,
varying the resistance of the rotor circuit, using multi-speed windings, using mechanical means
such as gears and pulleys, eddy current or fluid couplings, or by using rotary or static voltage
and frequency converters. A number of factors such as investment cost, load cycle, range of
speed control required, maintenance, reliability and any special control requirements will have
to be considered before adopting any particular control strategy.
The characteristics of the load are particularly important. Load refers to the torque output and
corresponding speed required and can be broadly classified as constant torque, variable torque
or constant power. Constant torque loads are those for which the output power requirement
may vary with the speed of operation but the torque does not vary as in conveyers, rotary kilns
and constant displacement pumps. Variable torque loads are those for which the torque required
varies with the speed of operation as in centrifugal pumps and fans. Constant power loads are
those for which the torque requirements typically change inversely with speed. Machine tools
are typical examples of constant power load.

Energy Audit Guidelines for Industrial Sectors
56
Variable torque applications account for the largest potential for electricity savings with
variable speed drives.
4.4 Improvement of lighting performance
Energy saving in lighting system could be attained by following means:
• Use of appropriate lighting controls;
• Optimum usage of day light;
• Installation of "exclusive" transformer or lighting voltage controller;
• Installation of high frequency (HF) electronic ballasts in place of conventional ballasts;
• Replace T-12 FTLS by T-8/T-5 FTLS;
• Installation of energy efficient LED lamps in place of “Conventional” lamps.
4.5 Opportunities in Compressed Air System
Compressed air is among the most expensive forms of energy available in a plant because of
its poor efficiency. Typically, only 10 to 20 percent of the electric energy input reaches the
point of end-use. The remaining input energy converts to wasted heat or is lost through leakage.
Because of this, if compressed air is used, it should be constantly monitored and weighed
against alternatives.
Despite the fact that compressors are essential for a plant operation, they are often ignored until
something goes wrong with them, or the compressors fail to keep up with the rising air demand.
Inadequate maintenance can lower compression efficiency and increase air leakage or pressure
variability as well as lead to increased operating temperatures, poor moisture control and
excessive contamination. Improved maintenance will reduce these problems and save energy.
The detail of compressor calculations is in Annex 9. Energy saving in compressed air system
could be attained by following means:
4.5.1 Cool air intake
Every 4C rise in inlet air temperature results in a higher energy consumption by 1% to
compress same volume of air in identical condition. This indicates that cooler the intake air,
better the compression efficiency.
4.5.2 Dust free air intake
A compressor should have an intake air filter installed, or the air used should come from a
clean, cool location, to minimize maintenance of the compressor. Air filters should have high
dust separation capacity, low pressure drops and robust design to avoid frequent cleaning and
replacement. As a thumb rule "for every 250 mm WC pressure drop increase across at the
suction path due to choked filters, etc. the compressor power consumption increases by about
2 percent for the same output".
4.5.3 Dry air intake
Dryer the intake air, better the compression efficiency. Moisture in the intake air will
deteriorate the performance of the compressor parts such as valves and piston rings and
deteriorate energy performance of the compressor.
4.5.4 Reducing delivery pressure
Power consumed by a compressor is in direct relation to the operating pressure and rated
capacity. Higher the operating pressure, higher the energy required to compress same volume
of air. At the same time, higher mechanical load on the moving parts also leads to excessive
wear, leading to further energy wastage. Reduction in the delivery pressure by 1 bar in a
compressor would reduce the power consumption by 6 to 10%.

Energy Audit Guidelines for Industrial Sectors
57
4.5.5 Avoiding Misuse of Compressed Air
Use of compressed air for body cleaning, liquid agitation, floor cleaning, drying, equipment
cooling and other similar uses must be discouraged. Wherever possible, low pressure air from
a blower should be substituted for compressed air, for example secondary air for combustion.
4.5.6 Avoid Air Leaks
In any facility that uses compressed air, leakage is the most common cause of the energy
wastage. Leakage of compressed air to the extent of 40% and above is found to be very
common. Leaks frequently occur at air receivers, relief valves, pipes and hose joints, shut off
valves, quick release couplings, tools and equipment. In most cases, they are due to poor
maintenance and sometimes, improper installation in underground lines.
4.5.7 Heat recovery
As much as 80–93 percent of the electrical energy used by an industrial air compressor is
converted into heat. In many cases, a properly designed heat recovery unit can recover
anywhere from 50–90 per cent of this available thermal energy and put it to use heating air or
water.
Typical uses for recovered heat include space heating, industrial process heating, water heating,
make up air heating and boiler make up water preheating. However, recoverable heat from a
compressed air system is not normally hot enough to be used to produce steam directly.
4.6 Opportunities in Boiler and Steam System
Performance of the boiler, such as efficiency and evaporation ratio reduce with time, due to
poor combustion, heat transfer fouling and poor operation and maintenance. Deterioration of
fuel quality and water quality also leads to poor performance of boiler. Efficiency testing helps
to find out how far the boiler efficiency drifts away from the best efficiency. Any observed
abnormal deviations could therefore be investigated to pinpoint the problem area for necessary
corrective action. Hence it is necessary to find out the current level of efficiency for
performance evaluation, which is a prerequisite for energy conservation action in an industry.
In general, there are two standard methods of measuring efficiency, as given below:
1) The Direct Method: Where the energy gain of the working fluid (water and steam) is
compared with the energy content of the boiler fuel
2) The Indirect Method: Where the efficiency is the difference between the losses and
the energy input
Figure 4.1: Boiler Efficiency Method
Note: The details of Direct and Indirect methods for Boiler Efficiency calculations is in Annex
6 (a) and (b).
• Data collection format for Boiler Performance Assessment is in Annex 6 (d).
• The schematic diagram of boiler and boiler house is in Annex 6 (f).
Boiler Efficiency Evaluation
Direct Method Indirect Method

Energy Audit Guidelines for Industrial Sectors
58
• The detail calculation sheet for surface heat loss calculation is in Annex 8.
4.7 Refrigeration and air-conditioning system
Refrigeration is the process of cooling a space, substance, or system to lower and/or maintain
its temperature below the ambient one. Heat is removed from a low-temperature reservoir and
transferred to a high-temperature reservoir. In other words, refrigeration means artificial
cooling.
Air Conditioning may be regarded as refrigeration in which control of temperature, humidity
and quality of air in a building to a set of chosen or preferred conditions is achieved. To achieve
this, systems need to transfer heat and moisture into and out of the air and control the level of
air pollutants, either by directly removing it or by diluting it to acceptable levels.
In both cases, the work of heat transfer is traditionally driven by mechanical means, but can
also be driven by heat, magnetism, electricity, laser, or other means. Refrigeration has many
applications, including, but not limited to household refrigerators, industrial freezers,
cryogenics, and air conditioning. Heat pumps may use the heat output of the refrigeration
process, and also may be designed to be reversible, but are otherwise similar to air conditioning
units. The detail for HVAC calculation is in Annex 9 and the detail for Cooling Tower
calculation is in Annex 12. Refrigeration and AC may be broadly classified into two types, as
given below:
4.7.1 Vapour Compression type
In natural condition, heat flows from a hotter to a colder body. But in refrigeration system the
opposite occurs i.e., heat flows from a cold to a hotter body. A substance called a refrigerant,
which absorbs heat and boils or evaporates at a low pressure to form a gas is used in
refrigeration system.
The functioning of a refrigeration cycle is illustrated below and can be broken down into the
following stages (BEE 2010):
1 – 2: Low pressure liquid refrigerant in the evaporator absorbs heat from its surroundings,
usually air, water or some other process liquid. During this process it changes its state from a
liquid to a gas, and at the evaporator exit is slightly superheated.
2 – 3: The superheated vapour enters the compressor where its pressure is raised. There will
also be a big increase in temperature, because a proportion of the energy put into the
compression process is transferred to the refrigerant.
3 – 4: The high pressure superheated gas passes from the compressor into the condenser. The
initial part of the cooling process (3 - 3a) de-superheats the gas before it is then turned back
into liquid (3a - 3b). The cooling for this process is usually achieved by using air or water. A
further reduction in temperature happens in the pipe work and liquid receiver (3b - 4) so that
the refrigerant liquid is sub-cooled as it enters the expansion device.
4 – 1: The high-pressure sub-cooled liquid passes through the expansion device, which both
reduces its pressure and controls the flow into the evaporator.
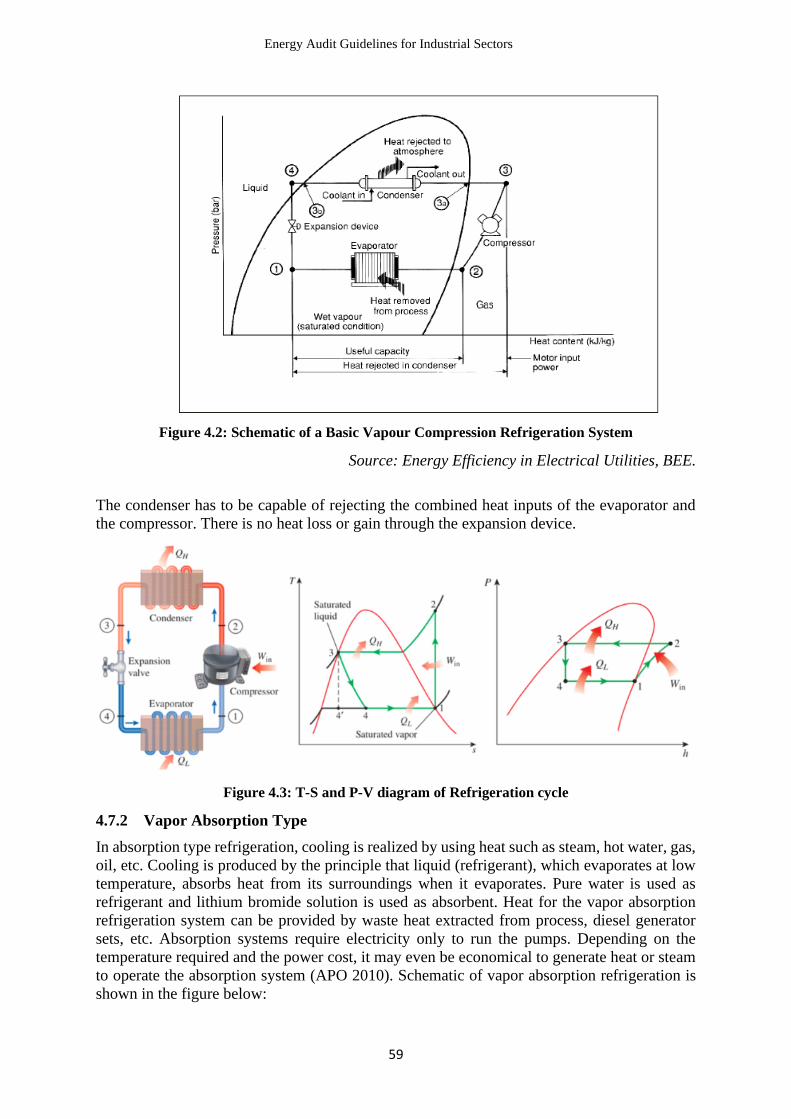
Energy Audit Guidelines for Industrial Sectors
59
Figure 4.2: Schematic of a Basic Vapour Compression Refrigeration System
Source: Energy Efficiency in Electrical Utilities, BEE.
The condenser has to be capable of rejecting the combined heat inputs of the evaporator and
the compressor. There is no heat loss or gain through the expansion device.
Figure 4.3: T-S and P-V diagram of Refrigeration cycle
4.7.2 Vapor Absorption Type
In absorption type refrigeration, cooling is realized by using heat such as steam, hot water, gas,
oil, etc. Cooling is produced by the principle that liquid (refrigerant), which evaporates at low
temperature, absorbs heat from its surroundings when it evaporates. Pure water is used as
refrigerant and lithium bromide solution is used as absorbent. Heat for the vapor absorption
refrigeration system can be provided by waste heat extracted from process, diesel generator
sets, etc. Absorption systems require electricity only to run the pumps. Depending on the
temperature required and the power cost, it may even be economical to generate heat or steam
to operate the absorption system (APO 2010). Schematic of vapor absorption refrigeration is
shown in the figure below:

Energy Audit Guidelines for Industrial Sectors
60
Figure 4.4: Schematic of a Basic Vapour Absorption Refrigeration System
Source: Training Manual on Energy Efficiency for Small and Medium Enterprises, APO.
Energy saving measures:
a. Proper sizing of process heat exchangers and evaporators
Proper sizing of heat transfer areas of process heat exchangers and evaporators as well as
optimization of the temperature requirement is essential for minimizing load on refrigerator &
AC system. A 1o C raise in evaporator temperature can help save almost 3 % on power
consumption.
b. Maintenance of heat exchangers
Keeping the heat exchanger surfaces clean is very important to maintain energy consumption
within the design limits. If the condensers are fouled, compressor has to work harder to attain
the desired capacity as the condensing temperature is increased. In the same way, fouled
evaporators will also result in increased power consumption.
c. Multi-Level Refrigeration
Temperature range and level of refrigeration required is one of the important decisive factors
in selection of refrigeration system. In applications where required temperature range is very
wide, using multi-level refrigeration system is more economical. Many industries use a bank
of compressors at a central location to meet the load.
d. Chilled Water Storage
In applications where a small variation in temperature is acceptable, it is economical to provide
a chilled water storage facility with good cold insulation. The storage facility can be fully filled
to meet the process requirements so that chillers need not be operated continuously. This
system has the added advantage of allowing the chillers to be operated at periods of low
electricity demand to reduce peak demand charges - Low tariffs offered by some electric
utilities for operation at night time can also be taken advantage of by using a storage facility.
An added benefit is that lower ambient temperature at night lowers condenser temperature and
thereby increases the efficiency.

Energy Audit Guidelines for Industrial Sectors
61
e. Insulation
Add insulation to reduce heat flow through the cold surfaces. Use of economic insulation
thickness on cold lines, heat exchangers, considering cost of heat gains is cost effective
measure to realize energy savings. It is applicable especially in large chemical / fertilizer /
process industry. Adoption of roof coatings / cooling systems, false ceilings / as applicable, to
minimize refrigeration load can also be considered.
f. Use of variable Speed drives
Constant-speed reciprocating compressors match capacity to load through loading and
unloading the cylinders. This however is not the efficient way to modulate chiller capacity. In
a given range, variable speed drives offer significant energy savings.
g. Reduce or optimize cooling loads
The importance of optimization of cooling loads on the running costs of refrigeration plant
cannot be stressed too much. If the cooling load is higher than necessary, then more cooling is
needed. This will eventually increase energy consumption and the operating costs become
higher.
h. General measures
• Use of cooling towers with FRP impellers and film fills, PVC drift eliminators, etc.;
• Adoption of energy efficient heat recovery devices such as air to air heat exchangers
to pre-cool the fresh air by indirect heat exchange; control of relative humidity through
indirect heat exchange rather than use of duct heaters after chilling.
• Adoption of variable air volume systems; adoption of sun film application for heat
reflection; optimizing lighting loads in the air-conditioned areas; optimizing number
of air changes in the air conditioned areas are few other examples.
• Condenser water using open cooling sources such as atmospheric cooling towers,
require water treatment to prevent fouling. Erosive conditions—for example, sand
flowing through the tubes at high velocity—may pit tubes, decreasing tube
effectiveness. Untreated water can damage tubes, piping, and other materials.
• The amount of cooling that any chiller can provide depends on how much refrigerant
it moves through the compressor per unit time (second, minutes or hours). It’s
important to maintain the proper level of refrigerant. Leaks, as well as air and
moisture, decrease efficiency and system reliability. Low refrigerant charge, usually
resulting from leaks, causes the compressor to work harder and achieve less cooling.
• Ensure regular maintenance of all AC plant components as per manufacturer
guidelines;
• Ensure adequate quantity of chilled water and cooling water flows, avoid bypass flows
by closing valves of idle equipment;
• Minimize part load operations by matching loads and plant capacity on line; adopt
variable speed drives for varying process load;
• Make efforts to continuously optimize condenser and evaporator parameters for
minimizing specific energy consumption and maximizing capacity.
4.8 Opportunities in Fans and Blowers
A fan is a mechanical device for moving air or other gases. It uses the kinetic energy of the
impellers to increase the pressure of the air/gas stream which in turn moves them against the
resistance caused by ducts, dampers and other components in a system. The detail for
calculation of fan is in Annex 12.

Energy Audit Guidelines for Industrial Sectors
62
Difference between fans, blowers and compressors
Fans, blowers, and compressors are differentiated by the method they use to move the air, and
by the system pressure they must operate against. American Society of Mechanical Engineers
(ASME) distinguishes between fans, blowers, and compressors on the basis of specific ratio.
The ratio of the discharge pressure over the suction pressure is called specific ratio.
Accordingly, fans offer a pressure rise up to 1136 mmWg, blowers offer from 1136 to 2066
mmWg, and compressors offer pressure rises even higher than blowers. Difference is shown in
the table below.
Table 4.3: Difference between Fans and Blowers
Equipment Specific Ratio Pressure Rise (mmWg)
Fans Up to 1.11 1136
Blowers 1.11 to 1.20 1136-2066
Compressors More than 1.20 More than 2066
Energy Savings measures
• Minimizing working pressure;
• Optimization of air volume and reduction of air leaks;
• Use of FRP Fans in Cooling Towers / Humidification Plants;
• Proper fan/blower sizing;
• Use of Variable Frequency Drives (VFDs) to match flow;
• Use of High efficiency belts (cogged belts);
• Minimizing System resistance.
4.9 Opportunities in Pumping System
Studies indicate that the average pumping efficiency in manufacturing plants can be less than
40%. Oversized pumps and the use of throttle valves are identified as the two major
contributors to the loss of efficiency. Energy saving of between 30% and 50% in pumping
systems could be realized through equipment or control system changes. The detail for
calculation of pump is in Annex 11. Some of the potential causes of inefficiency and measures
for improvement are as follows.
Table 4.4: Potential causes of inefficiency and measures for improvement in Pumping System
Causes of Inefficiency Improvement measures
Unnecessary demand on pumping system Reduce demand on system
Oversized pumps
Select pump that operates near to BEP
Change impeller
Trim impeller
Fit multiple-speed pump
Use multiple-pump arrangements
Fit lower speed pump/motor
Pump wear Pump maintenance
Less efficient impeller Change impeller
Inefficient pump throttling controls
As for oversized pumps
Fit adjustable or variable-speed drive
Inefficient pump Change pump
Inefficient piping configuration Change piping inefficiencies
Oversized motor Change motor
Inefficient motor Change to high-efficiency motor

Energy Audit Guidelines for Industrial Sectors
63
4.10 Opportunities in process and Heat Recovery (Boiler)
a. Blow down steam recovery
Boiler blow down is important for maintaining proper steam system water properties. However,
blow down can result in significant thermal loss if the steam is not recovered for beneficial use.
Blow down steam is typically low grade, but can be used for space heating and feed water
preheating. In addition to energy savings, blow down steam recovery may reduce the potential
for corrosion damage in steam system piping.
b. Pre-heating of Boiler Feed Water
Where feasible, adoption of feed water heating, using economizer from flue gases with
economizer application, gives the highest fuel economy, as one can pre-heat feed water almost
up to the saturation temperature of steam. The economizer is a pressure vessel. A lower order
and cheaper alternative for achieving fuel economy through flue gas waste heat recovery would
be a non-pressurized feed water heater, which allows feed water pre-heating up to a maximum
of 100 ºC only. Every rise of 6 ºC in boiler feed water temperature through waste heat recovery
would offer about 1% fuel savings.
c. Pre-heating of Combustion Air
Combustion air preheating is an alternative to feed water heating, and can be adopted, if no
further scope for feed water pre-heating exists and where stack gases still have waste heat
potential left to be tapped. Shell and tube type and rotary regenerative type air pre-heaters and
regenerative burners are some of the options that can be adopted for waste heat recovery.
For every reduction in flue gas temperature by 22 ºC for heat recovery, fuel savings of about
1% can be achieved.
4.11 Benefits of FD & ID Fan in Boiler
a. FD (Forced Draft) Fan
• FD fan provides the required quantity of air to the furnace for smooth and uniform
combustion of fuel and it also provides the secondary air which is the main air supply
for fuel combustion.
• FD fan produces positive pressure inside the furnace.
• FD fan pressurizes boiler so, it is started only after the ID fan is started.
b. ID (Induced Draft) Fan
• ID fan handles the flue gases i.e., hot air.
• ID fan takes the hot flue gases from furnace via dust collector or electrostatic
precipitator and deliver it to stack.
• ID fan produces the negative pressure (pressure lower than the atmospheric pressure)
in the system i.e., furnace to remove the flue gases from furnace.
4.12 Firing optimization and better operating practices (Brick Kiln)
a. Storing of Coal
Proper storage of coal minimizes the chances of self-ignition in the coal stock itself. Improper
storage leads to deterioration of its quality. Therefore,
• Never allow dust and keri to mix with coal;
• Stack coal on a raised platform with proper flooring and drainage;
• Height of the coal stack should not be more than 1.5m;
• Coal should be stored in a shed with proper ventilation.

Energy Audit Guidelines for Industrial Sectors
64
Figure 4.5: Existing Practices
Figure 4.6: Recommended Practice
b. Coal Size
• Recommended coal size: Powdered to 3/4inch. This would help in uniform brick
quality as powdered coal ignites immediately on feeding thereby releasing heat to
the top layer of brick setting, whereas large sized coal particles release heat at the
bottom of the brick setting.
• If large sized coal lumps are fed, bricks at the bottom of the kiln get over- burnt.
• Small sized coal improves air-fuel mixing thus accelerating the rate of combustion.
Appropriate size of coal can be obtained by screening/crushing of large sized coal,
with the use of coal crusher.
• Use coal crushers for crushing of coal.
Figure 4.7: Large Size Coal
Figure 4.8: Recommended Smaller
Size Coal
c. Spoon Size
Use of large spoon of capacity 1.5 –2.0 kg leads to the wastage of fuel and over-burning of
bricks. Therefore,
• Feed coal at uniform intervals with a spoon of 450-650 grams capacity.
• Large size spoon could be used only for raising the temperature in particular lines.
Concrete floor
Coal
Shed

Energy Audit Guidelines for Industrial Sectors
65
Figure 4.9: Convectional large size spoon
Figure 4.10: Recommended small size spoon
d. Fuel Feeding Pattern
Since there is a continuous flow of air in the kiln, ideally fuel feeding should also be done
continuously. This can be achieved by single man firing with Z pattern.
Figure 4.11: Fuel feeding pattern
e. Function of Chimney
In a Bull Trench Kin, a draught is necessary for fire to travel horizontally and for proper
combustion. The draught may be provided by a chimney or a mechanical device (Fan). Draught
available in a BTK can be classified under two heads:
i. Static draught
ii. Operating draught
The static draught depends on the height of the chimney and the temperature gradient and
operating draught is the net draught available for operating the kiln. Apart from the height of
the chimney and temperature gradient, the operating draught also depends upon the diameter
of the chimney.
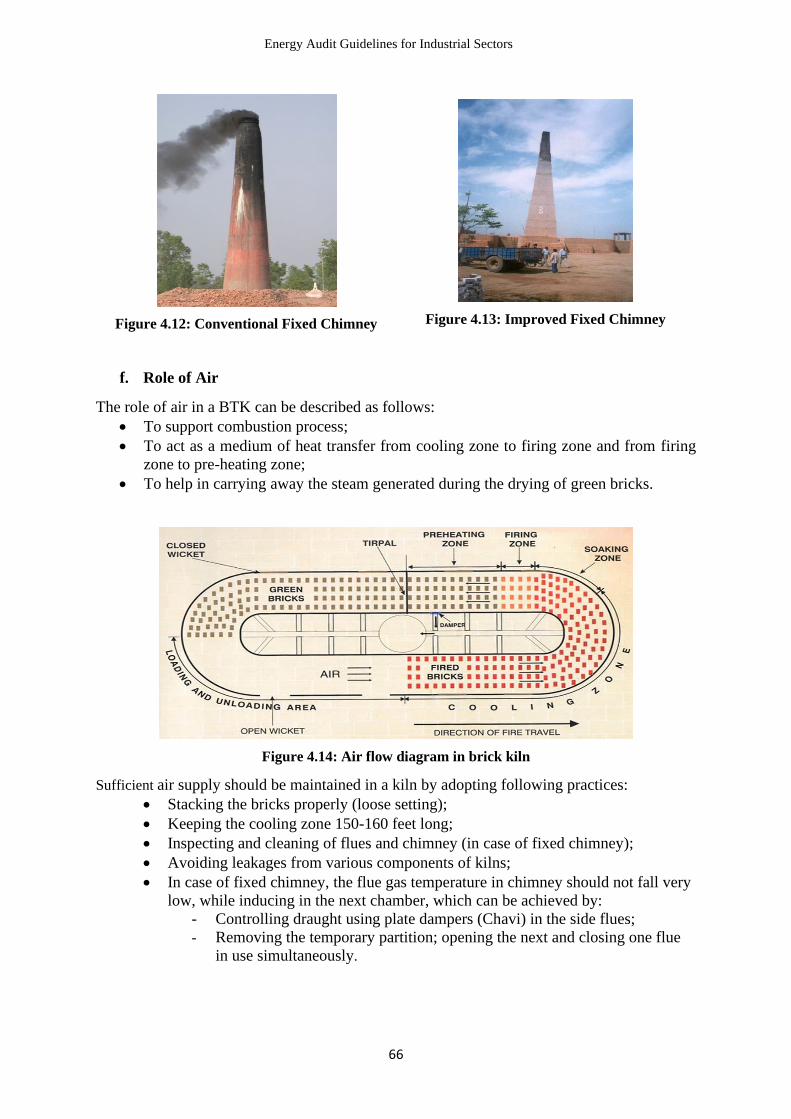
Energy Audit Guidelines for Industrial Sectors
66
Figure 4.12: Conventional Fixed Chimney
Figure 4.13: Improved Fixed Chimney
f. Role of Air
The role of air in a BTK can be described as follows:
• To support combustion process;
• To act as a medium of heat transfer from cooling zone to firing zone and from firing
zone to pre-heating zone;
• To help in carrying away the steam generated during the drying of green bricks.
Figure 4.14: Air flow diagram in brick kiln
Sufficient air supply should be maintained in a kiln by adopting following practices:
• Stacking the bricks properly (loose setting);
• Keeping the cooling zone 150-160 feet long;
• Inspecting and cleaning of flues and chimney (in case of fixed chimney);
• Avoiding leakages from various components of kilns;
• In case of fixed chimney, the flue gas temperature in chimney should not fall very
low, while inducing in the next chamber, which can be achieved by:
- Controlling draught using plate dampers (Chavi) in the side flues;
- Removing the temporary partition; opening the next and closing one flue
in use simultaneously.

Energy Audit Guidelines for Industrial Sectors
67
Figure 4.15: Straight Line Brick Setting
Figure 4.16: Zigzag Brick Setting (Chamber
system)
Figure 4.17: Straight Air flow & Zig Zag Air flow
g. Combustion Practices
The Optimal length of firing/combustion zone depends on the rate of travel of fire in the kiln.
The longer the firing zone, the better the combustion of fuel.
The use of Damper/Tirpal
Tirpal/Dampers are used in a BTK to divide the kiln into different chambers. Various dampers
used in practice are:
- Jute Tirpal;
- Plastic sheet.
Figure 4.18: Jute Tripal

Energy Audit Guidelines for Industrial Sectors
68
Figure 4.19: Plastic sheet
Dampers provided as temporary partition at the time of brick setting are removed whenever a
new chamber is to be induced in the circuit. The following recommendations are made for the
proper use of dampers
• The damper/tirpal should be placed after brick setting (Bharai) at the end of the day. A
minimum distance of 80-90 feet is recommended between the damper and the firing
zone (preheating zone).
• The dampers should be ensured airtight; otherwise, leakage will reduce draught leading
to lower combustion and fuel consumption.
• When green brick with higher moisture content are loaded, it is recommended that
dampers be used at smaller distance. Otherwise, the moisture will accumulate near the
damper that can cause the brick setting to crumble (Dhasan).
4.13 Reduction of Fuel Consumption
Fuel is the largest component in the input cost for the manufacturing of bricks. It accounts for
40–50% of the production cost in fixed chimney kilns and 50-60% in movable kilns. Typical
coal consumption in fixed chimney BTK varies from 8 to 15 tons per lakh of fired bricks.
a. Heat balance from different processes
Only a small amount of fuel supplied (generally in the range of 25-40%) is useful in the kiln.
Here, useful utilization refers to:
• The energy required for removal of moisture in green bricks as set in the kilns;
• Energy required for completing irreversible chemical reactions in the clay.
Rest of the 60-80% of the fuel supplied to the kiln is dissipated in various forms. The main
components of heat losses are:
1. Sensible heat in unloaded fired bricks (5 to 10%);
2. Sensible heat in dry flue gases (5 to 10%);
3. Heat loss from the surface of the kiln, particularly from the top ash covering (15-25%);
4. Heat loss to ground and kiln structure (10-25%);
5. Unburnt fuel in the form of unburnt or partially burnt coal, carbon monoxide and
unburnt hydrocarbon gases (5-10%).
b. Fuel saving by improving operation
Some common measures of better operating practices in kilns can lead 10-20% fuel savings.
Some of the commonly practiced measures of this kind are:
• The fuel required for drying green bricks in the kiln can be reduced by ensuring that
only dry green bricks with moisture contents of 5% or less are loaded on the kiln.

Energy Audit Guidelines for Industrial Sectors
69
• Sensible heat loss in dry flue gases can be reduced by controlling the air quantity and
temperature of flue gases. In general, the excess air level should not exceed 300–400%,
while the temperature of flue gas should be kept between 100-120oC. Almost all the
kilns suffer from the problems of air leakage. Particularly care should be taken to plug
air leakage through wall constructed to block flue ducts, tripal and wicket gates.
• The unburnt fuel/gases can be minimized by improving fuel feeding practices in
following ways:
a) Manual feeding of fuel in small quantity at an interval of 15-20 minutes or restoring
to mechanical coal stoker feeding;
b) Using coal crusher to reduce the coal partial size to less than 20 mm;
c) Starting coal feeding in a fresh row only after ensuring that the temperature at the
bottom of the row is in the excess of 700oC.
c. Fuel saving by minimizing the heat loss through structure
Improvements of kiln design and construction are particularly useful for reducing the kiln
structure losses, which can be as high as 25% in some of the kilns. Following are the major
areas from which maximum heat loss occurs.
a) Heat loss through surface of the kilns;
b) Heat loss to ground;
c) Heat loss from wicket gate (Dwari);
d) Heat loss through feed hole covers (Tawa).
In these cases, we can minimize the heat loss by taking following consideration.
1. Wicket wall: Minimum thickness as 22 inches with 3-4 inches Kerri filling
between the walls and mud plastering on both sides;
2. Side flue cut off wall: 13.5 inches thick with staggered joints and mud
plastering;
3. Kerri thickness at the top of the brick setting should be 7 inch or more;
4. Feedhole cover (Tawa) should be insulated from which remarkable amount of
heat is radiated;
5. Heat loss from the ground can be minimized by putting the insulating material
at the bottom of the kiln during construction.
Figure 4.20: Conventional type wicket wall
Figure 4.21: Recommended type wicket wall
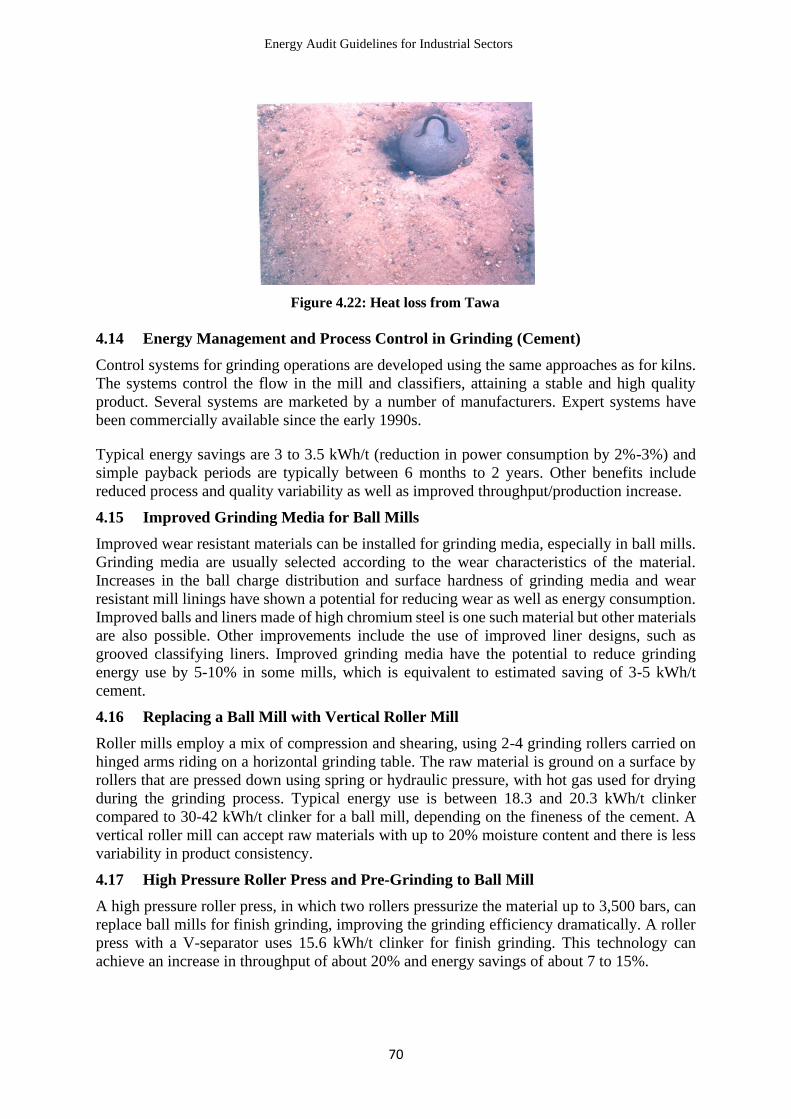
Energy Audit Guidelines for Industrial Sectors
70
Figure 4.22: Heat loss from Tawa
4.14 Energy Management and Process Control in Grinding (Cement)
Control systems for grinding operations are developed using the same approaches as for kilns.
The systems control the flow in the mill and classifiers, attaining a stable and high quality
product. Several systems are marketed by a number of manufacturers. Expert systems have
been commercially available since the early 1990s.
Typical energy savings are 3 to 3.5 kWh/t (reduction in power consumption by 2%-3%) and
simple payback periods are typically between 6 months to 2 years. Other benefits include
reduced process and quality variability as well as improved throughput/production increase.
4.15 Improved Grinding Media for Ball Mills
Improved wear resistant materials can be installed for grinding media, especially in ball mills.
Grinding media are usually selected according to the wear characteristics of the material.
Increases in the ball charge distribution and surface hardness of grinding media and wear
resistant mill linings have shown a potential for reducing wear as well as energy consumption.
Improved balls and liners made of high chromium steel is one such material but other materials
are also possible. Other improvements include the use of improved liner designs, such as
grooved classifying liners. Improved grinding media have the potential to reduce grinding
energy use by 5-10% in some mills, which is equivalent to estimated saving of 3-5 kWh/t
cement.
4.16 Replacing a Ball Mill with Vertical Roller Mill
Roller mills employ a mix of compression and shearing, using 2-4 grinding rollers carried on
hinged arms riding on a horizontal grinding table. The raw material is ground on a surface by
rollers that are pressed down using spring or hydraulic pressure, with hot gas used for drying
during the grinding process. Typical energy use is between 18.3 and 20.3 kWh/t clinker
compared to 30-42 kWh/t clinker for a ball mill, depending on the fineness of the cement. A
vertical roller mill can accept raw materials with up to 20% moisture content and there is less
variability in product consistency.
4.17 High Pressure Roller Press and Pre-Grinding to Ball Mill
A high pressure roller press, in which two rollers pressurize the material up to 3,500 bars, can
replace ball mills for finish grinding, improving the grinding efficiency dramatically. A roller
press with a V-separator uses 15.6 kWh/t clinker for finish grinding. This technology can
achieve an increase in throughput of about 20% and energy savings of about 7 to 15%.

Energy Audit Guidelines for Industrial Sectors
71
4.18 Low Temperature Waste Heat Recovery for Power Generation
A large amount of energy consumption for the production of cement occurs in the calcination
process. This involves passing raw materials through a preheater stack containing cyclone
heaters to a long rotating kiln to create clinker and then cooling clinker in the clinker cooler.
In clinker production process, a significant amount of heat is typically vented to the atmosphere
without utilization. This situation wastes natural resources and causes serious heat pollution in
the workplace. If the waste heat is captured and used for power generation, it can significantly
improve energy efficiency and reduce the amount of power imported from the electric grid.
A Waste Heat Recovery (WHR) system can effectively utilize the low temperature waste heat
of the exit gases from Suspension Preheater (SP) and Air Quenching Chamber (AQC) in
cement production. The WHR captive power plant consists of WHR boilers (SP boiler and
AQC boiler), steam turbine generators, controlling system, water-circulation system and dust-
removal system etc. The steam from SP boiler and AQC boiler is fed to the steam turbine
generator to produce power.
4.19 Blended Cement
The production of blended cement involves the inter-grinding of clinker with one or more
additives (fly ash, pozzolans, blast furnace slag, volcanic ash) in various proportions. Blended
cements demonstrate a higher long-term strength, as well as improved resistance to acids and
sulfates, while using waste materials for high value applications. Short-term strength (measured
after less than 7 days) of blended cement may be lower, although cement containing less than
30% additives will generally have setting times comparable to concrete based on Portland
cement.
Blended cement has been used for many decades around the world. Blended cement was
introduced in the U.S. to reduce production cost for cement (especially energy costs) to expand
capacity without extensive capital cost to reduce emissions from the kiln. The use and
production of blended cement is still limited in the U.S. However, Portland ordinary cement
and Portland slag cement are used widely in other parts of the world. In addition, due to
technical advancement and market development allowing the production of different kinds and
grades of cement, some industrial byproducts such as blast furnace slag, fly ash, coal gangue,
limestone, zeolite, pozzolana as well as natural minerals are widely used in cement production.
Prices for different additives vary greatly. Prices change with location, output, market need,
produce type and ways of handling. Fuel savings of at least 10% is estimated with a similar
increase in production. The use of blended cement is a particularly attractive efficiency option
since the inter-grinding of clinker with other additives not only allows for a reduction in the
energy used (and carbon emissions) in clinker production, but also corresponds to a reduction
in carbon dioxide emissions in calcination as well. For blended cement with, on average, a
clinker/cement ratio of 65%, the reduction in clinker production corresponds to a specific fuel
savings of 1.42 GJ/t cement (48.5 kgce/T cement).
There is an increase in fuel use of 0.09 GJ/t cement (3.1 kgce/t cement) for drying of the blast
furnace slags but a corresponding energy savings of 0.2 GJ/t cement (7 kgce/t cement) for
reducing the need to use energy to bypass kiln exit gases to remove alkali-rich dust. Energy
savings are estimated to be 9 to 23 MJ/t cement (0.3 to 7.1 kgce/t cement) per percent bypass.
The cost of applying additives in cement production may vary. Capital costs are limited to extra
storage capacity for the additives. However, blast furnace slag may need to be dried before
using in cement production. This can be done in the grinding mill, using exhaust from the kiln,
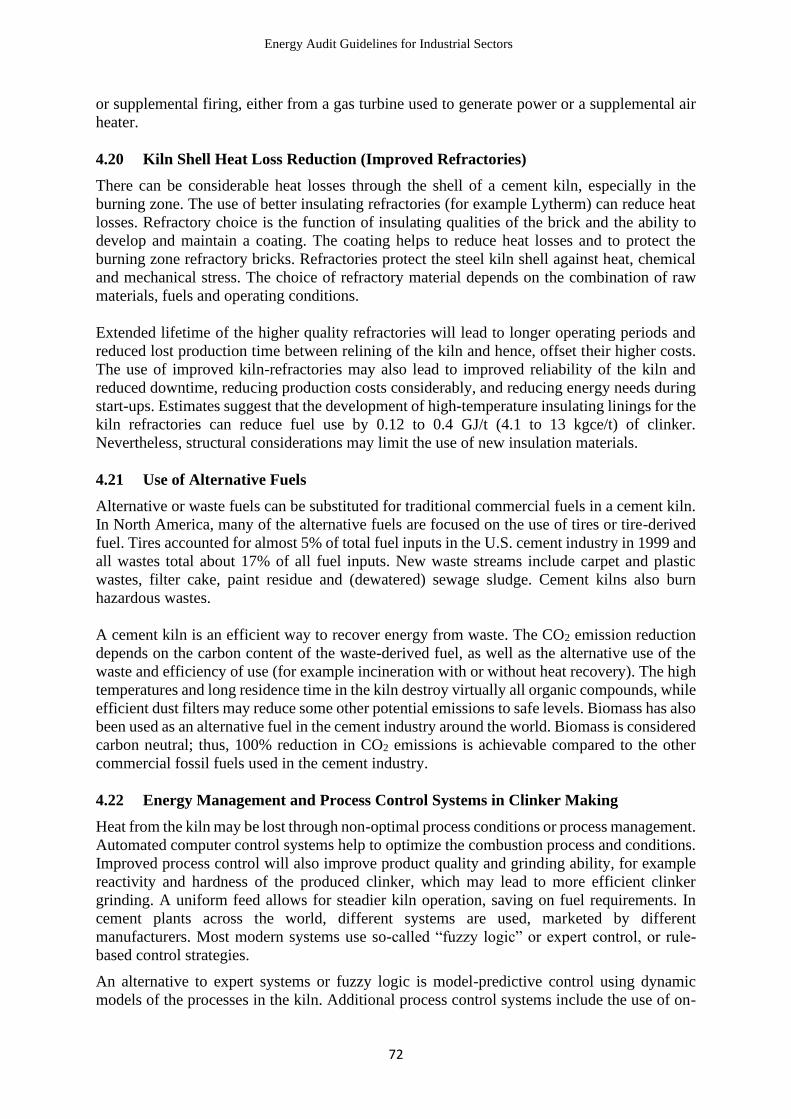
Energy Audit Guidelines for Industrial Sectors
72
or supplemental firing, either from a gas turbine used to generate power or a supplemental air
heater.
4.20 Kiln Shell Heat Loss Reduction (Improved Refractories)
There can be considerable heat losses through the shell of a cement kiln, especially in the
burning zone. The use of better insulating refractories (for example Lytherm) can reduce heat
losses. Refractory choice is the function of insulating qualities of the brick and the ability to
develop and maintain a coating. The coating helps to reduce heat losses and to protect the
burning zone refractory bricks. Refractories protect the steel kiln shell against heat, chemical
and mechanical stress. The choice of refractory material depends on the combination of raw
materials, fuels and operating conditions.
Extended lifetime of the higher quality refractories will lead to longer operating periods and
reduced lost production time between relining of the kiln and hence, offset their higher costs.
The use of improved kiln-refractories may also lead to improved reliability of the kiln and
reduced downtime, reducing production costs considerably, and reducing energy needs during
start-ups. Estimates suggest that the development of high-temperature insulating linings for the
kiln refractories can reduce fuel use by 0.12 to 0.4 GJ/t (4.1 to 13 kgce/t) of clinker.
Nevertheless, structural considerations may limit the use of new insulation materials.
4.21 Use of Alternative Fuels
Alternative or waste fuels can be substituted for traditional commercial fuels in a cement kiln.
In North America, many of the alternative fuels are focused on the use of tires or tire-derived
fuel. Tires accounted for almost 5% of total fuel inputs in the U.S. cement industry in 1999 and
all wastes total about 17% of all fuel inputs. New waste streams include carpet and plastic
wastes, filter cake, paint residue and (dewatered) sewage sludge. Cement kilns also burn
hazardous wastes.
A cement kiln is an efficient way to recover energy from waste. The CO2 emission reduction
depends on the carbon content of the waste-derived fuel, as well as the alternative use of the
waste and efficiency of use (for example incineration with or without heat recovery). The high
temperatures and long residence time in the kiln destroy virtually all organic compounds, while
efficient dust filters may reduce some other potential emissions to safe levels. Biomass has also
been used as an alternative fuel in the cement industry around the world. Biomass is considered
carbon neutral; thus, 100% reduction in CO2 emissions is achievable compared to the other
commercial fossil fuels used in the cement industry.
4.22 Energy Management and Process Control Systems in Clinker Making
Heat from the kiln may be lost through non-optimal process conditions or process management.
Automated computer control systems help to optimize the combustion process and conditions.
Improved process control will also improve product quality and grinding ability, for example
reactivity and hardness of the produced clinker, which may lead to more efficient clinker
grinding. A uniform feed allows for steadier kiln operation, saving on fuel requirements. In
cement plants across the world, different systems are used, marketed by different
manufacturers. Most modern systems use so-called “fuzzy logic” or expert control, or rule-
based control strategies.
An alternative to expert systems or fuzzy logic is model-predictive control using dynamic
models of the processes in the kiln. Additional process control systems include the use of on-

Energy Audit Guidelines for Industrial Sectors
73
line analyzers that permit operators to instantaneously determine the chemical composition of
raw materials being processed, thereby allowing for immediate changes in the blend of raw
materials. Several companies provide optimized information technology for energy
management and process control, such as ABB. Most technologies for this measure are made
by international companies such as Siemens and ABB. Energy savings from process control
systems vary between 2.5% and 10%.
4.23 Optimize Heat Recovery/Update Clinker Cooler.
The clinker cooler has to drop the clinker temperature from 1200°C down to 100°C. The most
common cooler designs are of the planetary (or satellite), traveling and reciprocating grate type.
All coolers heat the secondary air for the kiln combustion process and sometimes also tertiary
air for the pre-calciner. Reciprocating grate coolers are the modern variant and are suitable for
large-scale kilns. Grate coolers use electric fans and excess air.
Grate coolers may recover between 1.3 and 1.6 GJ/t (44 to 55 kgce/t) of clinker sensible heat.
Heat recovery can be improved through reduction of excess air volume, control of clinker bed
depth and new grates such as ring grates. Improving heat recovery efficiency in the cooler
results in fuel savings, but may also influence product quality and emission levels. Control of
cooling air distribution over the grate may result in lower clinker temperatures and high air
temperatures. Additional heat recovery results in reduced energy use in the kiln and pre-
calciner, due to higher combustion air temperatures.
4.24 Opportunities in Furnace
i. Proper storage and Handling
Fuels degraded or contaminated due to poor storage and handling are difficult to burn, requiring
more excess air with lower thermal efficiency. Fuel storage and handling is an important and
often neglected area but needs attention in order to prevent wastage or contamination. In case
of coal and bio-mass, fuel storage over a long period of time deteriorates the quality of fuel and
increase potential for fire hazard. Oxidation loss during storage is common in coal and losses
such as wind and carpet loss is common in all solid fuel including coal.
ii. Optimization of Excess Air Level
The quantity of air required for complete burning of fuel based on the chemical equation, is
known as the stoichiometric or theoretical air requirement. Ideally, this quantity of air is
sufficient to completely burn the fuel. But in practice, it is observed that combustion is not
complete unless some excess air is supplied to the system. The quantity of this additional air
affects the mass flow rate of the flue gases. By maintaining the optimum quantity of excess air,
heat loss through the stack can be minimized. The higher the excess air, the greater the flue
gas volume and hence, loss through the stack becomes higher. Besides, flame temperature and
rate of heat transfer across the heating surface is reduced.
The quantity of excess air in flue gases can be determined by measuring the percentage of either
O2 or CO2 in the flue gases. With the measured value of O2, the percentage excess air can be
calculated by the following formula:
Where, actual O2 % indicates measured O2 % in the flue gas.
After the quantity of excess air has been established, suitable measures to vary combustion air
could be adopted.
% Excess Air = (O2%/21- O2%)*100
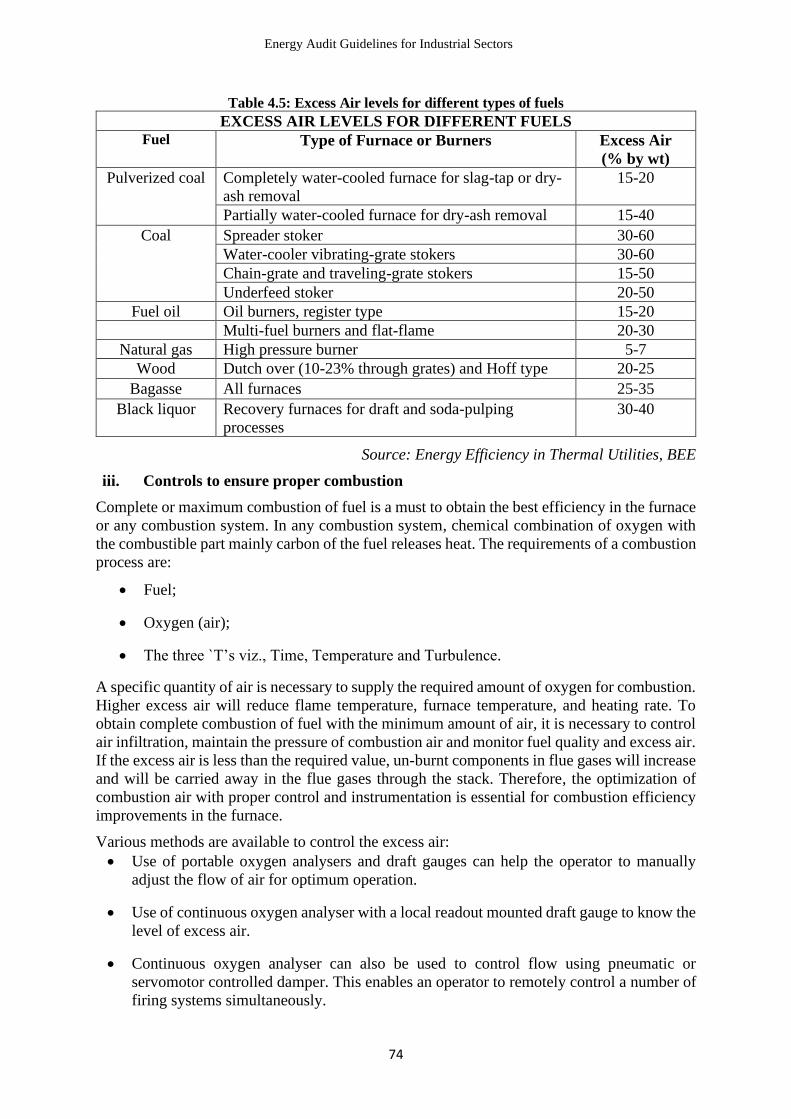
Energy Audit Guidelines for Industrial Sectors
74
Table 4.5: Excess Air levels for different types of fuels
EXCESS AIR LEVELS FOR DIFFERENT FUELS Fuel Type of Furnace or Burners Excess Air
(% by wt)
Pulverized coal Completely water-cooled furnace for slag-tap or dry-
ash removal
15-20
Partially water-cooled furnace for dry-ash removal 15-40
Coal Spreader stoker 30-60
Water-cooler vibrating-grate stokers 30-60
Chain-grate and traveling-grate stokers 15-50
Underfeed stoker 20-50
Fuel oil Oil burners, register type 15-20
Multi-fuel burners and flat-flame 20-30
Natural gas High pressure burner 5-7
Wood Dutch over (10-23% through grates) and Hoff type 20-25
Bagasse All furnaces 25-35
Black liquor Recovery furnaces for draft and soda-pulping
processes
30-40
Source: Energy Efficiency in Thermal Utilities, BEE
iii. Controls to ensure proper combustion
Complete or maximum combustion of fuel is a must to obtain the best efficiency in the furnace
or any combustion system. In any combustion system, chemical combination of oxygen with
the combustible part mainly carbon of the fuel releases heat. The requirements of a combustion
process are:
• Fuel;
• Oxygen (air);
• The three `T’s viz., Time, Temperature and Turbulence.
A specific quantity of air is necessary to supply the required amount of oxygen for combustion.
Higher excess air will reduce flame temperature, furnace temperature, and heating rate. To
obtain complete combustion of fuel with the minimum amount of air, it is necessary to control
air infiltration, maintain the pressure of combustion air and monitor fuel quality and excess air.
If the excess air is less than the required value, un-burnt components in flue gases will increase
and will be carried away in the flue gases through the stack. Therefore, the optimization of
combustion air with proper control and instrumentation is essential for combustion efficiency
improvements in the furnace.
Various methods are available to control the excess air:
• Use of portable oxygen analysers and draft gauges can help the operator to manually
adjust the flow of air for optimum operation.
• Use of continuous oxygen analyser with a local readout mounted draft gauge to know the
level of excess air.
• Continuous oxygen analyser can also be used to control flow using pneumatic or
servomotor controlled damper. This enables an operator to remotely control a number of
firing systems simultaneously.

Energy Audit Guidelines for Industrial Sectors
75
iv. Proper Heat Distribution
For best output from the furnace, heat distribution should be uniform. The flame should not
touch the stock, since this will increase scale losses. Flames from various burners should not
intersect each other, which can be ensured by staggering the burners on either side. The loading
of the charge on the furnace should be arranged so that
• It receives the maximum amount of radiation from the hot surfaces of the heating
chambers and the flames produced;
• The hot gases are efficiently circulated around the heat receiving surfaces.
Stock should not be placed in the following position:
• In the direct path of the burners or where impingement by flame is likely to occur;
• In an area which is likely to cause a blockage or restriction of the flue system of the
furnace;
• Close to any door openings where cold spots are likely to develop.
v. Optimum Furnace Temperature
Temperature maintained within the furnace has to be as per the process requirement and should
not be too high or too low. Maintaining low temperature will deteriorate the quality of product
or may generate more rejects. Operating at too high temperature than the optimum cause heat
loss, excessive oxidation, de-carbonization as well as over stressing of refractories.
vi. Optimum Furnace Loading
Furnaces are designed to offer maximum thermal efficiency at a particular load. If the loading
on the furnace is low, the load consumes a smaller fraction of the heat available and offer low
efficiency. In an over-loaded furnace, the stock may not be uniformly heated, leading to poor
quality and again lower efficiency.
Optimal loading is generally obtained by trial, recording weight of the material in each charge,
time taken to reach the required temperature and amount of fuel used. Load disposition on
furnace hearth should be such that maximum heat is radiated to the load from hot surfaces of
heating chambers and the flames produced. Hot gases should be efficiently circulated around
heat receiving surfaces.
vii. Furnace utilization
Furnace utilization is one of the important aspects that affect furnace efficiency. It is also often
ignored or underestimated. Utilization factor may be reduced due to the reasons such as
frequent breakdown, poor production planning and capacity mismatch.
viii. Control of Furnace Draught
Ingress of uncontrolled free air must be prevented in any furnace. It is better to maintain a slight
excess pressure inside the furnace to avoid air infiltration. If negative pressures exist in the
furnace, air infiltration is liable to occur through the cracks and openings, thereby affecting
air/fuel ratio control. Neglecting furnace pressure could mean problems of cold metal and non-
uniform metal temperatures, which could affect subsequent operations such as forging and
rolling and could result in increased fuel consumption.

Energy Audit Guidelines for Industrial Sectors
76
ix. Oxygen Enrichment
Air contains 21% oxygen and 78% inert nitrogen by volume. During combustion, oxygen
combines with carbon and hydrogen of the fuel to liberate heat. The inert gases of the air
absorb heat from the combustion and carry it out of the furnace resulting in loss of heat, also
reducing flame temperature and thus reducing the rate of heat transfer to the stock. If the inert
content of air could be reduced, more efficient combustion would be attained. This can be
done by addition of oxygen to combustion air. Consequently, when the amount of fuel is not
increased, sensible heat loss in the flue gas is decreased due to the smaller heat capacity of the
lower volume.
x. Minimizing Heat Loss from Furnace Walls
In intermittent or continuous furnaces, heat losses generally account for around 30–40 percent
of the fuel input to the furnace. The appropriate choice of refractory and insulation materials is
very important for achieving fairly high fuel savings in industrial furnaces.
Several materials with different combinations of heat insulation and thermal inertia should be
considered to minimize heat losses through furnace walls. For intermittent furnaces, the use of
insulating refractories of appropriate quality and thickness can cut down heat storage capacity
of walls and the time required to bring the furnace to operating temperature by as much as 60–
70 percent.
xi. Ceramic coatings to improve emissivity
Heat transfer in a furnace depends mainly on radiation, which in turn depends on emissivity.
At higher temperatures, emissivity of the normal refractories decreases whereas the emissivity
of ceramic coating increases. High emissivity refractory coating, if applied on the internal
surface of the furnace, increases emissivity thus contributing to increased heat transfer. Energy
savings of the order of 8-20% have been reported depending on the type of furnace and
operating conditions.
xii. Prevention of Heat Loss through Openings
During operation heat loss from the furnace door and openings is inevitable due to radiation. It
is also caused due to leakage of flue gas through the door/openings. It is necessary to make
sure that the openings are kept to the optimum level to avoid heat loss. The heat loss is about
1% of the total heat generated in the furnace, if the pressure in the furnace is controlled properly
(BEE 2010). Heat loss from an opening is calculated using the following formula:
Where,
T: absolute temperature (K)
a: factor for total radiation
A: area of opening
H: time (Hr)
xiii. Waste Heat Recovery in the furnace
Heat generated in an industrial process by way of fuel combustion or chemical reaction and not
brought to use in a meaningful way is termed as waste heat. Sources of waste heat could be
hot combustion gases discharged to the atmosphere, heated products exiting industrial
processes, and heat transfer from hot equipment surfaces.
Q= 4.88* T ^4*a*A*H/100
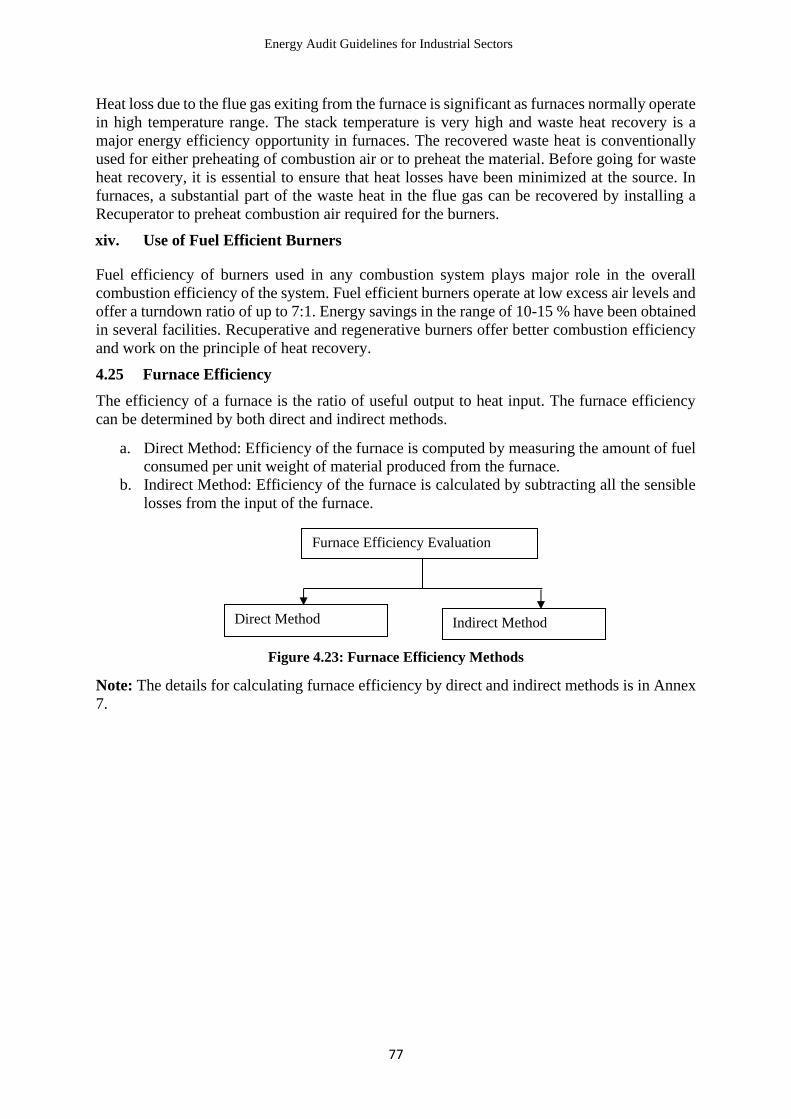
Energy Audit Guidelines for Industrial Sectors
77
Heat loss due to the flue gas exiting from the furnace is significant as furnaces normally operate
in high temperature range. The stack temperature is very high and waste heat recovery is a
major energy efficiency opportunity in furnaces. The recovered waste heat is conventionally
used for either preheating of combustion air or to preheat the material. Before going for waste
heat recovery, it is essential to ensure that heat losses have been minimized at the source. In
furnaces, a substantial part of the waste heat in the flue gas can be recovered by installing a
Recuperator to preheat combustion air required for the burners.
xiv. Use of Fuel Efficient Burners
Fuel efficiency of burners used in any combustion system plays major role in the overall
combustion efficiency of the system. Fuel efficient burners operate at low excess air levels and
offer a turndown ratio of up to 7:1. Energy savings in the range of 10-15 % have been obtained
in several facilities. Recuperative and regenerative burners offer better combustion efficiency
and work on the principle of heat recovery.
4.25 Furnace Efficiency
The efficiency of a furnace is the ratio of useful output to heat input. The furnace efficiency
can be determined by both direct and indirect methods.
a. Direct Method: Efficiency of the furnace is computed by measuring the amount of fuel
consumed per unit weight of material produced from the furnace.
b. Indirect Method: Efficiency of the furnace is calculated by subtracting all the sensible
losses from the input of the furnace.
Figure 4.23: Furnace Efficiency Methods
Note: The details for calculating furnace efficiency by direct and indirect methods is in Annex
7.
Furnace Efficiency Evaluation
Direct Method Indirect Method
Energy Audit Guidelines for Industrial Sectors
78
CHAPTER 5: PREPARING ENERGY AUDIT REPORT
Report preparation is one of the most important steps of the audit. The audit report should be
prepared keeping in mind the various stakeholders who will be using the report. The final
written report should include data, data analysis, recommendations, energy savings, cost
savings; cost of implementation and simple payback period for recommended energy
conservation measures and systems improvements.
Some key issues that should be kept in mind while writing an audit report are:
• The audit report should be written in a way that provides suitable information to the
potential readers of the report which could be the CEO, plant manager, or the supervisor
of engineering or maintenance department, and the plant shift supervisor.
• The audit report should be concise and precise and use direct language that is easy to
understand.
• More graphs should be used rather than tables for the presentation of data, results and
trends.
• The recommendation section should be specific, clear and with adequate details.
• Assumptions made in the analysis should be explained clearly. How changes in the key
assumptions can influence the results should also be explained. A sensitivity analysis
is a very helpful tool for this.
• The auditors should do their best to avoid mistakes and errors in the report especially
in the results. Even a few errors could damage the credibility of the audit.
• The energy audit report should be consistent in structure and terminology used.
• Calculations made in the analysis work may be explained for better understanding.
Based on experiences from the present study and review of different EA reports produced by
different organizations of repute, a standardized flow of an EA report with illustrative examples
is in Annex-2. In order to enable an industry or a facility to implement the recommended
options, it is imperative to know the source of technology and equipment. Therefore, providing
vendor/suppliers’ list for such technology & equipment will help in procurement.
5.1 Cost Benefit Analysis
In order to enable the top management to make investment decisions, it is important to do
financial analysis of identified options. The analysis should be based on:
• Energy savings over a period;
• Financial savings against the achieved energy savings and other improvements such as
services, environmental and reduced maintenance;
• Necessary investments.
As far as possible, opportunities should be assessed over the planned or expected operating
lifetime. There are several methods to carry out cost benefit analysis such as Simple Payback
Period, net present value (NPV) or cash flow method and return on investment (ROI) and
internal rate of return (IRR) method. Simple Payback Method is the simplest method which is
used very often. It is calculated as:
Simple Payback Period: Total Investment/ Net Annual Savings
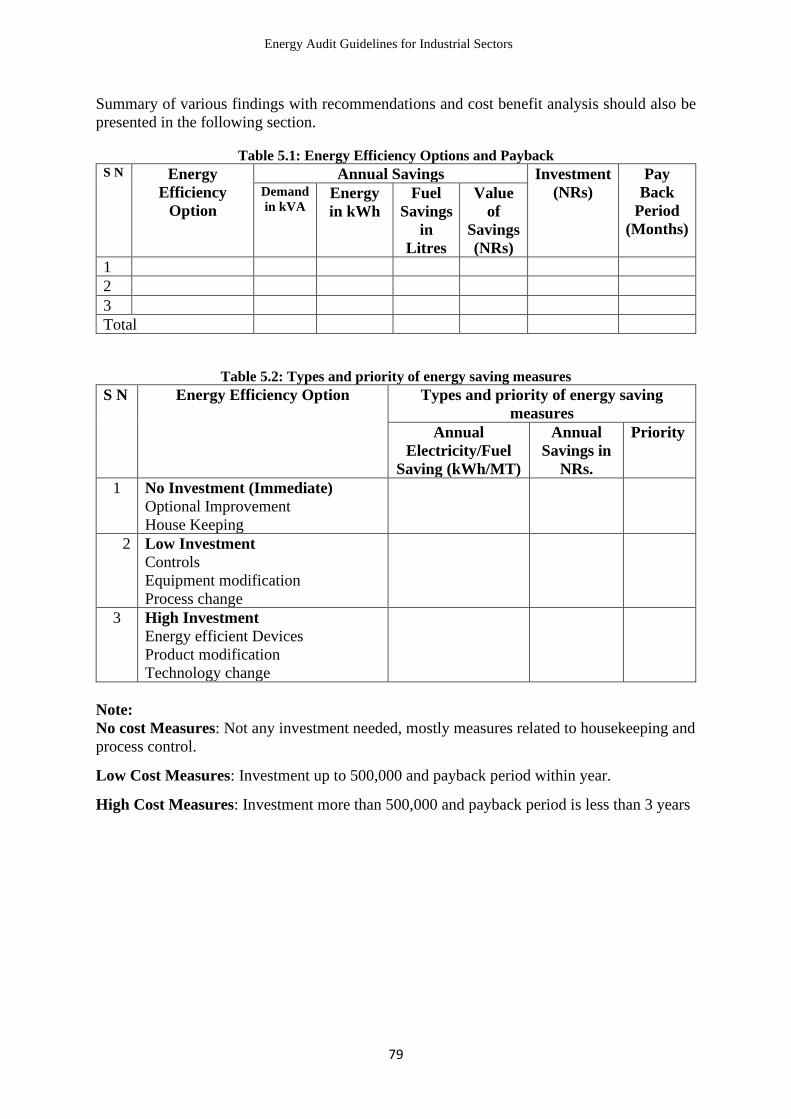
Energy Audit Guidelines for Industrial Sectors
79
Summary of various findings with recommendations and cost benefit analysis should also be
presented in the following section.
Table 5.1: Energy Efficiency Options and Payback S N Energy
Efficiency
Option
Annual Savings Investment
(NRs)
Pay
Back
Period
(Months)
Demand
in kVA Energy
in kWh
Fuel
Savings
in
Litres
Value
of
Savings
(NRs)
1
2
3
Total
Table 5.2: Types and priority of energy saving measures
S N Energy Efficiency Option Types and priority of energy saving
measures
Annual
Electricity/Fuel
Saving (kWh/MT)
Annual
Savings in
NRs.
Priority
1 No Investment (Immediate)
Optional Improvement
House Keeping
2 Low Investment
Controls
Equipment modification
Process change
3 High Investment
Energy efficient Devices
Product modification
Technology change
Note:
No cost Measures: Not any investment needed, mostly measures related to housekeeping and
process control.
Low Cost Measures: Investment up to 500,000 and payback period within year.
High Cost Measures: Investment more than 500,000 and payback period is less than 3 years

Energy Audit Guidelines for Industrial Sectors
80
ANNEXES
Annex 1: Conversion Factors
Units Kcal (000) GJ TCE TOE
Kilo Calorie 1.0000 0.0041868 0.0001429 0.0000972
GJ 238.8459 1.0000000 0.0341208 0.0234622
TCE 7000.00 29.3076000 1.0000000 0.0687622
TOE 10290.00 42.6217000 1.4542880 1.0000000
Fuel type Unit Kcal (000) GJ TCE TOE Other
Traditional Fuel
Fuel wood tonne 4000 16.75 0.57 0.39 1.43 m3
m3 2800 11.72 0.4 0.27 0.7 tonne
Charcoal tonne 7100 29.73 1.01 0.69 2.86 m3
m3 2485 10.4 0.36 0.24 0.35 tonne
Commercial Fuel Unit kCal (000) GJ TCE TOE Others
Coal tonne 6000 25.12 0.86 0.58
LPG KL 30.08 0.611 Tonne
Tonne 11760 49.24 1.68 1.14 1.637 KL
HSD KL 9060 37.93 1.29 0.88 0.83 Tonne
Tonne 10960 45.89 1.57 1.07 1.21 KL
LDO KL 9350 39.15 1.34 0.91 0.85 Tonne
Tonne 10960 45.89 1.57 1.07 1.17 KL
FO KL 9860 41.28 1.41 0.96 0.93 Tonne
Tonne 10560 44.21 1.51 1.03 1.07 KL
Electricity MWh 860 3.6 0.12 0.08 5.78
GHh
from
oil
Source: Energy Synopsis Report WECS, 2010
Energy Audit Guidelines for Industrial Sectors
81
Annex 2: Energy Audit Report format for Industrial Sectors
A. Title Sheet of the report to indicate:
• Report Title;
• Nature of audit namely: Detailed energy audit of electrical systems and energy use;
• Name of the sector/audited entity;
• Name of the auditing entity;
• Duration of audit;
• Sponsors, stakeholders as applicable.
B. Acknowledgements:
The acknowledgements page may acknowledge contributions of key stakeholders associated
in audit activity from client side as well as sponsors, signed by team leader of audit with date.
C. Study Team:
On this page, the list of study team members with designations may be presented, for future
follow up references.
D. Table of Contents, List of Table, List of Figures, Abbreviations, Nomenclature used
in report:
In this page, the report may list the Table of Content, Tables, Figures and abbreviations,
nomenclature used in report, for ease of understanding purposes.
E. List of instruments used:
In this page, the list of instruments used in energy audit need to be mentioned
F. Executive summary:
In this section, the report may present the synopsis of study findings, which would at-least,
include:
• Baseline details of the audited entity;
• EE Option summary listing in a table, covering all EE opportunities identified in
electrical areas the option wise identified annual energy savings potential, Rupee saving
potential per annum, investment needs and simple payback period;
• Prioritized options listing as short term (less than one year simple payback period);
medium term (one to three year simple payback period); long term (over three year
simple payback period).
Chapter 1: INTRODUCTION:
1.1 Background of the study:
1.2 Scope of energy audit:
The scope of the energy audit includes:
• Reporting on total connected load in kW and list (break up) of major electric
drives/loads in the facility, Latest (20xx-yy) year’s month wise baseline data of
production, capacity utilization, NEA electricity consumption, DG based
generation, Cogeneration and RE based generation (if and as applicable), incurred

Energy Audit Guidelines for Industrial Sectors
82
source wise and weighted average cost of electricity and overall specific electricity
consumption, with comments on variations, normative values.
Energy efficiency improvements opportunities with cost benefits in the areas of:
• Power Factor improvement;
• Load Management (Maximum demand optimization);
• DG set performance improvements;
• Cogeneration application potential if any;
• RE application (Solar PV) potential if any;
• Boiler & Stem System audit if any;
• Waste heat recovery;
• HVAC;
• House-keeping, etc.
1.3 About the unit:
(Coverage may present location, year of establishment, facilities, capacity, current capacity,
shifts/day and days/year normal operation, electrical and thermal energy consumption and cost
per annum).
Chapter 2: Plant Energy Systems
2.1 Electrical Energy Use features:
Coverage to present plant/facility features relating to electrical energy and load management
practices, grid, diesel generation, cogeneration cost, power factor, time of use tariffs, maximum
demand trends, specific electrical energy consumption, major equipment (such as drives,
refrigeration, pumping, compressors,) consuming power, breakup and factors affecting
consumption.
2.2 Thermal Energy Use features:
Coverage to present plant/facility features relating to thermal energy use, specific thermal
energy consumption, layout, operational features and specifications of boiler.
Chapter 3: Strategic Energy Management Program
(May cover rationale of a strategic energy management program at the unit, voluntary policy
statement desirable as a measure of management commitment to energy efficiency, desirable
features of a MIS system and any desirable upgrades in plant automation as relevant)
Chapter 4: Energy Efficiency Opportunities
EA report to cover energy efficiency opportunities in electrical systems in this chapter in a
clear manner, presenting for each opportunity the following aspects:
• Title of measure (EE opportunity);
• Present situation;
• Recommendation;
• Cost benefits;
• Approximate investment requires to implement options;
• Cost benefits present simple payback period of measure in months or years.

Energy Audit Guidelines for Industrial Sectors
83
Plan of Action:
The following plan of action should be prepared and submitted in Energy Audit Report:
SN EE
Measures
Responsible Person Implementation
Date
Time Bond Remarks
Start End
Chapter 5: Exhibits: Vendor information as relevant
The menu of EE measures is very exhaustive and sector and application specific and broadly
may include measures such as:
• Maximum demand optimization, load shifting for Time of Use tariff advantages;
• Power factor improvement, Automatic Power Factor Controls (APFC);
• Variable speed drive applications for energy efficient capacity control;
• EE in process utilities like pumps, fans, compressors, refrigeration and lighting;
• Renovation, modernization and process modifications/upgrades;
• Boiler & Steam System;
• Efficiency improvements in DG sets, electric furnaces, heaters, ovens and melting
baths etc.;
• Cogeneration adoption;
• Automation adoption such as temperature controls, occupancy sensors, building
energy management system etc.;
• Loading improvements for better capacity utilization;
• Housekeeping improvements to abate wastages and leakages in compressed air,
pumps, fans, refrigeration;
• Heat Exchanger performance improvements such as condenser de-scaling;
• RE applications, wherever possible.
Chapter6: Exhibits
Each Investment Grade Energy Audit (IGEA) report may include exhibits to support the report
findings, as deemed necessary, for clarity, better understanding, and may include information
such as:
• Line diagrams;
• Technical specifications;

Energy Audit Guidelines for Industrial Sectors
84
• Design data;
• Detailed calculations such as heat balance;
• Details of motor load survey, lighting survey, steam trap survey, insulation survey
etc.;
• Vendor information on product literature;
• Generic tips, housekeeping measures, maintenance guidelines etc.
Exhibits may also address any incentive schemes available from the Government, Ministries,
NEA, or financial institutions or international institutions, that are prevalent and applicable, to
enhance the viability of the EE proposals.
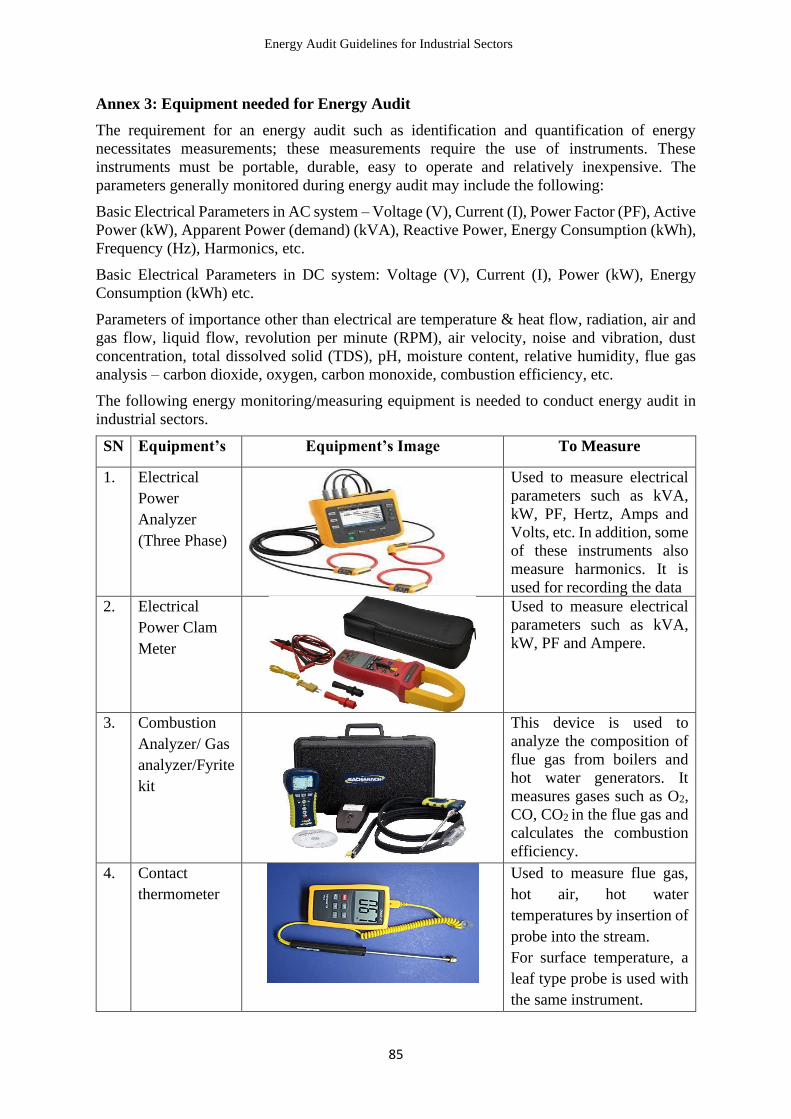
Energy Audit Guidelines for Industrial Sectors
85
Annex 3: Equipment needed for Energy Audit
The requirement for an energy audit such as identification and quantification of energy
necessitates measurements; these measurements require the use of instruments. These
instruments must be portable, durable, easy to operate and relatively inexpensive. The
parameters generally monitored during energy audit may include the following:
Basic Electrical Parameters in AC system – Voltage (V), Current (I), Power Factor (PF), Active
Power (kW), Apparent Power (demand) (kVA), Reactive Power, Energy Consumption (kWh),
Frequency (Hz), Harmonics, etc.
Basic Electrical Parameters in DC system: Voltage (V), Current (I), Power (kW), Energy
Consumption (kWh) etc.
Parameters of importance other than electrical are temperature & heat flow, radiation, air and
gas flow, liquid flow, revolution per minute (RPM), air velocity, noise and vibration, dust
concentration, total dissolved solid (TDS), pH, moisture content, relative humidity, flue gas
analysis – carbon dioxide, oxygen, carbon monoxide, combustion efficiency, etc.
The following energy monitoring/measuring equipment is needed to conduct energy audit in
industrial sectors.
SN Equipment’s Equipment’s Image To Measure
1. Electrical
Power
Analyzer
(Three Phase)
Used to measure electrical
parameters such as kVA,
kW, PF, Hertz, Amps and
Volts, etc. In addition, some
of these instruments also
measure harmonics. It is
used for recording the data
2. Electrical
Power Clam
Meter
Used to measure electrical
parameters such as kVA,
kW, PF and Ampere.
3. Combustion
Analyzer/ Gas
analyzer/Fyrite
kit
This device is used to
analyze the composition of
flue gas from boilers and
hot water generators. It
measures gases such as O2,
CO, CO2 in the flue gas and
calculates the combustion
efficiency.
4. Contact
thermometer
Used to measure flue gas,
hot air, hot water
temperatures by insertion of
probe into the stream.
For surface temperature, a
leaf type probe is used with
the same instrument.

Energy Audit Guidelines for Industrial Sectors
86
5. Infrared
Thermometer
Infrared thermometer when
directed at a heat source
directly gives the
temperature read out. This
instrument is useful for
measuring hot spots in
furnaces, surface
temperatures etc.
6. Anemometer
Used to measure air
velocity to calculate air
flow from a given area.
Total flow is measured by
multiplying air velocity and
area cross-section
7. Ultrasonic
flow meter
Used to measure the flow of
liquid. It uses ultrasonic
transducers that measure
the average velocity along
the path of an emitted beam
of ultrasound based on
which calculates volumetric
flow.
8. Digital
Camera
To capture images
9. Thermal
Image Camera
Measures the temperature at
the surface of the objects.
This devices can detect
overloaded section of the
thermal system. It also
locates the fault, leakages,
damages part of thermal
system.
10. Lux Meter
Illumination levels are
measured with a lux meter.
It consists of a photo cell
which senses the light
output, coverts to electrical
impulses which are
calibrated as lux.

Energy Audit Guidelines for Industrial Sectors
87
11. Humidity
Meter
To measure the humidity,
WET bulb and DRY bulb
thermometer is used.
12. Leak Detector
Ultrasonic instruments are
available which can be used
to detect leaks of
compressed air and other
gases, which are normally
not possible to detect with
human abilities.

Energy Audit Guidelines for Industrial Sectors
88
Annex 4: Safety consideration during energy audit
An energy audit requires working close to machineries and various utilities. Hence, safety
considerations should be very important part for any energy audit team. The audit team should
be thoroughly briefed on safety procedures, Personal Protective Equipment (PPE) and should
never put themselves in a dangerous situation while conducting the audit. Auditors should be
extremely careful making any measurement on electrical systems or high temperature devices
such as boilers, heaters, etc. Electrical or asbestos gloves should be worn whenever necessary.
The auditors should also be very careful when examining any operating piece of equipment,
especially those with open drive shafts, belts or gears, or any form of rotating machinery. The
equipment operator or supervisor should be pre notified that the auditor is going to look at the
equipment to prevent any risk associated with safety of the auditor. The auditor should never
approach a piece of equipment and inspect it without the operator or supervisor being notified
in advance. The audit team should avoid wearing loose clothes as they can be caught by nearby
running machines, if any. A safety checklist should be prepared and carried with the audit team
with followings:
For protection from Electricity and Heat
• Avoid working on live circuits if possible;
• Securely lock off circuits and switches before working on a piece of equipment;
• Implement Log Out Tag Out (LOTO);
• Always try to keep one hand in your pocket while taking measurements on live circuits to
help prevent cardiac arrest;
• Vinyl nitrile gloves, electrical safety shoes should be worn while working in an electrical
system;
• Leather gloves, mechanical safety shoes should be worn while working in an electrical
system;
• Check temperature of any equipment using IR gun before approaching close to the
equipment.
For protection of Respiratory System
• When necessary, wear a full face respirator mask with adequate filtration particle size;
• Use activated carbon cartridges in the mask when working around low concentrations of
noxious gases. Change the cartridges on a regular basis;
• Use a self-contained breathing apparatus while working in a toxic environment.
For protection of Hearing System
• Use ear plugs or ear muffs while working around high noise areas.
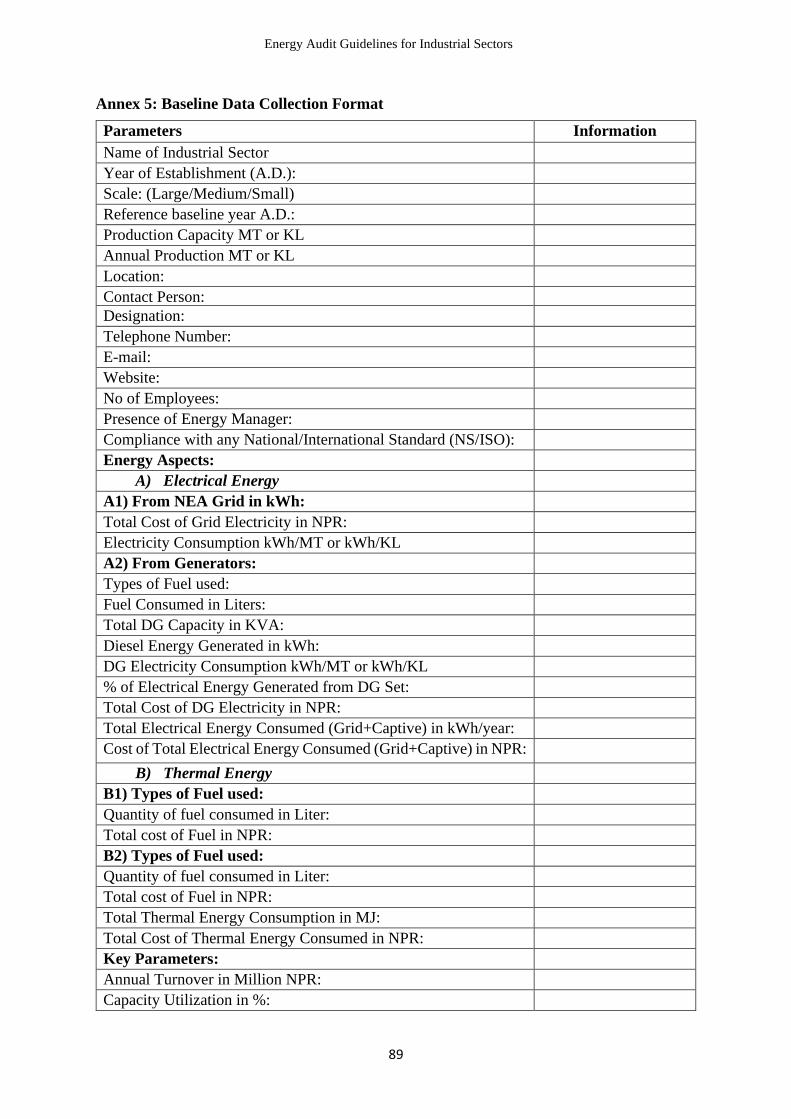
Energy Audit Guidelines for Industrial Sectors
89
Annex 5: Baseline Data Collection Format
Parameters Information
Name of Industrial Sector
Year of Establishment (A.D.):
Scale: (Large/Medium/Small)
Reference baseline year A.D.:
Production Capacity MT or KL
Annual Production MT or KL
Location:
Contact Person:
Designation:
Telephone Number:
E-mail:
Website:
No of Employees:
Presence of Energy Manager:
Compliance with any National/International Standard (NS/ISO):
Energy Aspects:
A) Electrical Energy
A1) From NEA Grid in kWh:
Total Cost of Grid Electricity in NPR:
Electricity Consumption kWh/MT or kWh/KL
A2) From Generators:
Types of Fuel used:
Fuel Consumed in Liters:
Total DG Capacity in KVA:
Diesel Energy Generated in kWh:
DG Electricity Consumption kWh/MT or kWh/KL
% of Electrical Energy Generated from DG Set:
Total Cost of DG Electricity in NPR:
Total Electrical Energy Consumed (Grid+Captive) in kWh/year:
Cost of Total Electrical Energy Consumed (Grid+Captive) in NPR:
B) Thermal Energy
B1) Types of Fuel used:
Quantity of fuel consumed in Liter:
Total cost of Fuel in NPR:
B2) Types of Fuel used:
Quantity of fuel consumed in Liter:
Total cost of Fuel in NPR:
Total Thermal Energy Consumption in MJ:
Total Cost of Thermal Energy Consumed in NPR:
Key Parameters:
Annual Turnover in Million NPR:
Capacity Utilization in %:

Energy Audit Guidelines for Industrial Sectors
90
Weighted Average Unit Cost of Electrical Energy in NPR:
Specific Thermal Energy Consumption in MJ/MT or MJ/KL:
Specific Electrical Energy Consumption in kWh/MT or kWh/KL:
Total Annual Cost of Electrical + Thermal Energy in NPR:

Energy Audit Guidelines for Industrial Sectors
91
Annex 6: Boiler efficiency calculation by direct and indirect methods
a. Direct Method
In this method of efficiency calculation, the ratio of total heat gained by the feed water in
changing its state from water to steam of desired parameter is compared with the total heat
contained in the fuel used. It is also known as ‘input-output method’ due to the fact that it only
needs the useful output (steam) and the heat input (i.e., fuel) for evaluating the efficiency.
Figure 1: Boiler Efficiency by Direct Method
This efficiency is calculated by given formula:
Boiler Efficiency = Heat Output
Heat Input x 100
Boiler Efficiency = Heat addition to Steam
Gross Heat in Fuel x 100
Boiler Efficiency = Steam Flow rate x (Steam enthalpy)−Feed Water flow rate(Feed water enthalpy)
Fuel Firing rate x Gross calorific value x 100
Boiler Efficiency = Qs∗hs−Qf∗hf
q∗GCV x 100
Where,
Qs = Quantity of steam generated in kg/hr.
Qh = Quantity of feed water in kg/hr.
q = Quantity of fuel used in kg/hr.
hs = Enthalpy of saturated steam in kcal/kg of steam.
hf = Enthalpy of feed water in kcal/kg of water.
GCV = Gross calorific value of the fuel in kcal/kg of fuel
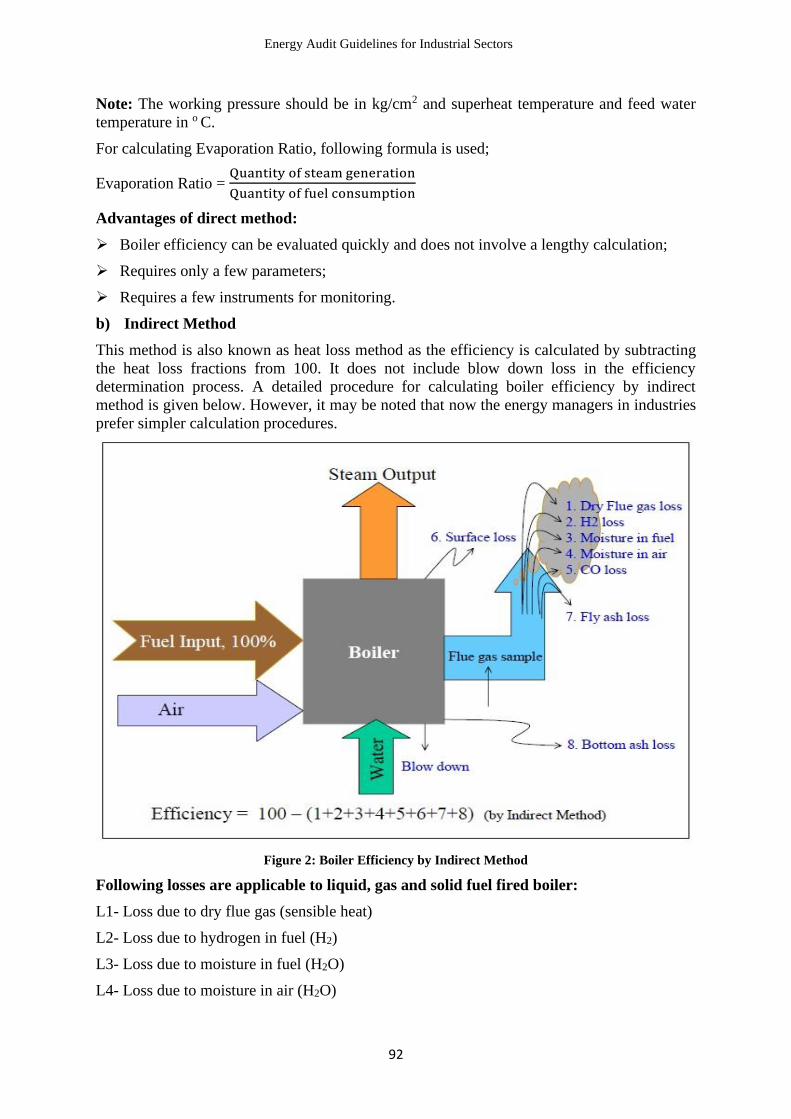
Energy Audit Guidelines for Industrial Sectors
92
Note: The working pressure should be in kg/cm2 and superheat temperature and feed water
temperature in o C.
For calculating Evaporation Ratio, following formula is used;
Evaporation Ratio = Quantity of steam generation
Quantity of fuel consumption
Advantages of direct method:
➢ Boiler efficiency can be evaluated quickly and does not involve a lengthy calculation;
➢ Requires only a few parameters;
➢ Requires a few instruments for monitoring.
b) Indirect Method
This method is also known as heat loss method as the efficiency is calculated by subtracting
the heat loss fractions from 100. It does not include blow down loss in the efficiency
determination process. A detailed procedure for calculating boiler efficiency by indirect
method is given below. However, it may be noted that now the energy managers in industries
prefer simpler calculation procedures.
Figure 2: Boiler Efficiency by Indirect Method
Following losses are applicable to liquid, gas and solid fuel fired boiler:
L1- Loss due to dry flue gas (sensible heat)
L2- Loss due to hydrogen in fuel (H2)
L3- Loss due to moisture in fuel (H2O)
L4- Loss due to moisture in air (H2O)

Energy Audit Guidelines for Industrial Sectors
93
L5- Loss due to carbon monoxide (CO)
L6- Loss due to surface radiation, convection and other unaccounted *
*Losses which are insignificant and are difficult to measure.
The following losses are applicable to solid fuel fired boiler in addition to above;
L7- Loss due to unburnt in fly ash (carbon)
L8- Loss due to unburnt in bottom ash (carbon)
Boiler Efficiency by Indirect Method = 100 – (L1+L2+L3+L4+L5+L6+L7+L8)
Calculation Procedure and Formula for Calculating Boiler Efficiency by Indirect
Method:
In order to calculate the boiler efficiency by indirect method, all the losses that occur in the
boiler must be measured. These losses are conveniently related to the amount of fuel burnt.
A) Theoretical Air required for Combustion =
[(11.6 ∗ C) + {34.8 ∗ (H2 − O2/8)} + (4.35 ∗ S)]
100
Where,
C = Percentage of Carbon present in the fuel.
H2 = Percentage of Hydrogen present in the fuel.
O2 = Percentage of Oxygen present in the fuel.
S = Percentage of Sulphur present in the fuel.
B) % Excess Air (EA) Supplied = O2
21 − O2∗ 100
C) Actual mass of air (AAS) supplied/ kg of fuel =
1 +EA
100∗ 𝑇ℎ𝑒𝑜𝑟𝑒𝑡𝑖𝑐𝑎𝑙 𝐴𝑖𝑟
1) Heat loss due to dry flue gas (L1) =
m ∗ Cp ∗ (Tf − Ta)
GCV of fuel∗ 100
Where,
m = Mass of dry flue gas in kg/kg of fuel (CO2+SO2+ Nitrogen in fuel + Nitrogen in
actual mass of air supplied + O2 in flue gas) or m = AAS + 1 kg of fuel
Cp = Specific heat of flue gas in kCal/kg
Tf = Flue gas temperature in oC
Ta = Ambient air temperature in oC

Energy Audit Guidelines for Industrial Sectors
94
2) Heat loss due to hydrogen in fuel (L2) =
9 ∗ H₂{584 + Cp (Tf − Ta)}
GCV of fuel∗ 100
Where,
H2 = Kg of hydrogen present in fuel on 1 kg basis
Cp = Specific heat of superheated steam in kCal/kg oC
Tf = Flue gas temperature in oC
Ta = Ambient air temperature in oC
584 = Latent heat corresponding to partial pressure of water vapour
3) Heat loss due to moisture present in fuel (L3) =
M ∗ {584 + Cp(Tf − Ta)}
GCV of fuel∗ 100
Where,
M = Kg of moisture in fuel in 1 kg basis
Cp = Specific heat of superheated steam in kCal/kg oC
Tf = Flue gas temperature in oC
Ta = Ambient air temperature in oC
584 = Latent heat corresponding to partial pressure of water vapour
4) Heat loss due to moisture present in air (L4) =
{AAS ∗ Humidity factor ∗ Cp (Tf − Ta)}
GCV of fuel∗ 100
Where,
AAS = Actual mass of air supplied per kg of fuel
Humidity Factor = Kg of water/ kg of dry air
Cf = Specific heat of superheated steam in kCal/kg oC
Tf = Flue gas temperature in oC
Ta = Ambient air temperature in oC (dry bulb)
5) Heat loss due to incomplete combustion (L5) =
%CO ∗ C
%CO + CO₂∗
5744
GCV of fuel∗ 100
Where,
CO = Volume of CO in flue gas leaving economizer (%)
CO2 = Actual volume of CO2 in flue gas (%)
C = Carbon content kg/kg of fuel
5744 = Heat loss due to partial combustion of carbon
6) Heat loss due to radiation and convection (L6) =
0.548 * [(Ts / 55.55)4 - (Ta / 55.55)4] + 1.957 * (Ts – Ta) 1.25 * sq. rt. of [(196.85 Vm + 68.9) /
68.9]
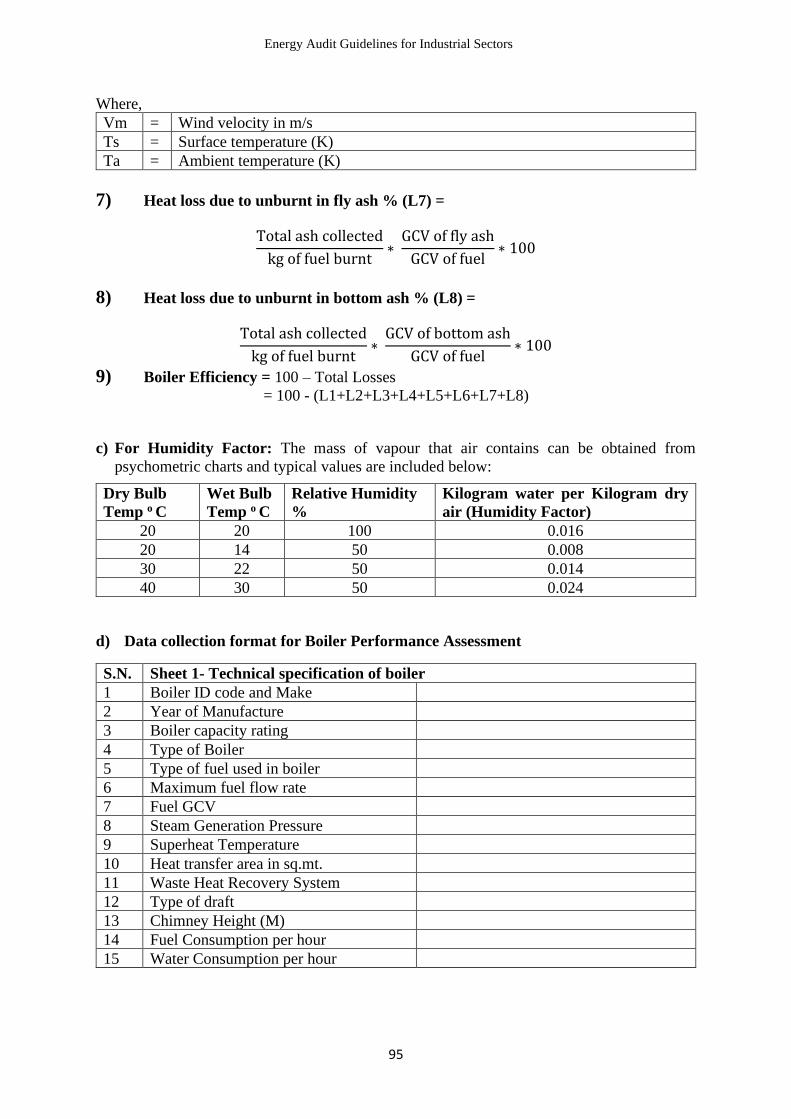
Energy Audit Guidelines for Industrial Sectors
95
Where,
Vm = Wind velocity in m/s
Ts = Surface temperature (K)
Ta = Ambient temperature (K)
7) Heat loss due to unburnt in fly ash % (L7) =
Total ash collected
kg of fuel burnt∗
GCV of fly ash
GCV of fuel∗ 100
8) Heat loss due to unburnt in bottom ash % (L8) =
Total ash collected
kg of fuel burnt∗
GCV of bottom ash
GCV of fuel∗ 100
9) Boiler Efficiency = 100 – Total Losses
= 100 - (L1+L2+L3+L4+L5+L6+L7+L8)
c) For Humidity Factor: The mass of vapour that air contains can be obtained from
psychometric charts and typical values are included below:
Dry Bulb
Temp o C
Wet Bulb
Temp o C
Relative Humidity
%
Kilogram water per Kilogram dry
air (Humidity Factor)
20 20 100 0.016
20 14 50 0.008
30 22 50 0.014
40 30 50 0.024
d) Data collection format for Boiler Performance Assessment
S.N. Sheet 1- Technical specification of boiler
1 Boiler ID code and Make
2 Year of Manufacture
3 Boiler capacity rating
4 Type of Boiler
5 Type of fuel used in boiler
6 Maximum fuel flow rate
7 Fuel GCV
8 Steam Generation Pressure
9 Superheat Temperature
10 Heat transfer area in sq.mt.
11 Waste Heat Recovery System
12 Type of draft
13 Chimney Height (M)
14 Fuel Consumption per hour
15 Water Consumption per hour

Energy Audit Guidelines for Industrial Sectors
96
Sheet 2 – Fuel Analysis Details
Fuel Fired
GCV of fuel
Specific gravity of fuel (Liquid)
Bulk density of fuel (Solid)
S.N. Proximate Analysis Date of Test Unit
1 Fixed carbon %
2 Volatile matter %
3 Ash %
4 Moisture %
S.N. Ultimate Analysis Date of Test Unit
1 Carbon %
2 Hydrogen %
3 Sulphur %
4 Nitrogen %
5 Ash %
6 Moisture %
7 Oxygen %
S.N. Water Analysis Date of Test Unit
1 Feed water TDS PPM
2 Blow down TDS PPM
3 pH of Feed Water
4 pH of blow down
S.N. Flue Gas Analysis Date of Test Unit
1 CO2 %
2 O2 %
3 CO %
4 Flue Gas Temperature o C
Typical instruments used for boiler performance assessment
Instrument Type Measurements
Flue gas analyzer Portable of Fixed % CO2, O2, CO, Temperature (Flue and
Air)
Temperature
indicator
Thermocouple, Liquid
in glass
Fuel temperature, flue gas, combustion air
temperature, boiler surface temperature,
steam temperature
Draft Gauge Manometer,
differential pressure
Amount of draft used or available
TDS meter Conductivity Boiler water, TDS, feed water TDS, make-
up water TDS
Flow meter As applicable Steam flow, Water flow, Fuel flow, air flow

Energy Audit Guidelines for Industrial Sectors
97
Sheet 3: Format sheet for boiler efficiency testing
Date: ………………………………… Boiler Name: …………………………
SN Time Ambient Air Fuel Feed Water Steam Flue Gas Analysis Surface
Temp. of
Boiler,OC Dry bulb
Temp. OC
Wet
bulb
Temp. OC
Flow
rate
kg/hr
Tem
oC
Flow
rate
m3/hr
Tem oC
Flow
rate
m3/hr
Pressure
kg/cm2
Tem
oC
O2
%
CO2
%
CO
%
Tem
oC
………………… ……………….. ……………….
Boiler Operator Boiler In-Charge Boiler Auditor
e) Factors affecting Boiler Efficiency
• Controls to ensure proper combustion of fuel and optimum boiler efficiency;
• Optimization of excess air level;
• Pre-heating of boiler feed water;
• Pre-heating of combustion air;
• Reduction of scaling and soot losses;
• Minimized radiation and convection losses;
• Adoption of automatic blow down controls;
• Optimization of steam pressure;
• Variable speed control for fans, blowers, and pumps;
• Steam line insulation;
• Appropriate trap selection and trap testing;
• Condensate recovery;
• Avoiding/Arresting steam leakage.

Energy Audit Guidelines for Industrial Sectors
98
f) Schematic diagram of boiler system.
Fig 3: Schematic Diagram of Boiler System
g) Theoretical Combustion Data for Common Boilers fuels
THEORETICAL COMBUSTION DATA – COMMON BOILER FUELS
Fuel kg of air
req./kg of
fuel
kg of flue
gas/kg of
fuel
m3
of
flue/kg of
fuel
Theoretical
CO2% in
dry flue gas
CO2% in
flue gas
achieved in
practice
Solid Fuels
Bagasse 3.2 3.43 2.61 20.65 10-12
Coal
(bituminous)
10.8 11.7 9.40 18.70 10-13
Lignite 8.4 9.10 6.97 19.40 9-13
Paddy Husk 4.6 5.63 4.58 19.8 14-15
Wood 5.8 6.4 4.79 20.3 11.13
Liquid Fuels
Furnace oil 13.90 14.30 11.50 15.0 9-14
LSHS 14.04 14.63 10.79 15.5 9-14

Energy Audit Guidelines for Industrial Sectors
99
Annex 7: Furnace Efficiency Direct & Indirect Method
Direct Method:
Thermal Efficiency of the Furnace = Heat in the Stock (Q)
Heat in the fuel consumed
= M ∗ Cp ∗ (T2−T1)
(m∗GCV of fuel)
Where,
Q – Quantity of heat in kCal
M – Weight of the material in Ton/hr
Cp – Mean specific heat, kCal/kg oC
T2 – Final Temperature desired, oC
T1 – Initial Temperature of the charge before it enters the furnace, oC
m – Mass of fuel in Kg or L
Indirect Method:
In order to find out furnace efficiency using indirect method, various parameters required are
hourly furnace oil consumption, material output, excess air quantity, temperature of flue gas,
temperature of furnace at various zones, skin temperature and hot combustion air temperature.
Instruments such as infrared thermometer, fuel efficiency monitor, surface thermocouple and
other measuring devices are required to measure the parameters mentioned below.
Parameters Unit Value
Weight of the input stock, M Ton/hr
Initial temperature of material, T1 oC
Final temperature of material, T2 oC
Specific heat of material, Cp kCal/kg oC
Fuel consumption, m Kg/hr
GCV of fuel used kCal/kg
1. Sensible Heat Loss calculation in Flue Gas:
Excess air in flue gas = (O2 x 100) / (21 – O2)
Where, O2 is the actual % of oxygen measured in the flue gas
Sensible heat loss = m x Cp x ΔT
Where,
m = mass of flue gas (theoretical plus excess air)
Cp = Specific heat
ΔT = Temperature difference between flue gas and combustion air
2. Loss Due to Evaporation of Moisture Present in Fuel
% Loss = M {584 + 0.45 (Tfg-Tamb)}*100/ GCV of Fuel
Where,
M - % Moisture of in 1 kg of fuel oil (0.15 kg/kg of fuel oil)
Tfg - Flue Gas Temperature
Tamb - Ambient temperature

Energy Audit Guidelines for Industrial Sectors
100
GCV - Gross Calorific Value of Fuel
3. Loss Due to Evaporation of Water Formed due to Hydrogen in Fuel
% Loss = 9 x H2 {584 + 0.45 (Tfg-Tamb)}*100/ GCV of Fuel
Where, H2 – % of H2 in 1 kg of fuel oil (0.1123 kg/kg of fuel oil)
4. Heat Loss due to Openings:
If a furnace body has an opening on it, the heat in the furnace escapes to the outside as radiant
heat. Heat loss due to openings can be calculated by computing black body radiation at furnace
temperature, and multiplying these values with emissivity (usually 0.8 for furnace brick work)
and the factor of radiation through openings. The black body radiation losses can be directly
computed from the curves as given in the figure below. Factor for radiation through openings
can be determined with the help of graph shown below.
Graph for Determining Black Body Radiation at a Particular Temperature

Energy Audit Guidelines for Industrial Sectors
101
Factors for determining the equivalent of heat release from openings to the quantity of
heat release from the perfect black body.
5. Heat Loss through Skin:
Surface heat loss forms a large portion of the heat loss that occurs in the furnace system. It is
essential to have an efficient insulation on all hot surfaces including surfaces of combustion air
supply pipes, fuel lines and heat recovery equipment. The recommended thickness of insulation
will mainly depend on the desired surface temperature after insulation. The energy and cost
savings will depend on the total area, the temperature of the hot surface and the surroundings,
heat temperature coefficient and the number of hours of operation of furnace. Simplified
formula for heat loss calculation is given below:
Where,
S = Surface heat loss in kCal/hr/m2
Ts = Hot surface temperature in oC
Ta = Ambient temperature in oC
Total heat loss/hr = S*A
Where ‘A’ is the surface area in m2
6. Unaccounted Loss
These losses comprise of heat storage loss, loss of furnace gases around charging door and
opening, heat loss by incomplete combustion, loss of heat by conduction through hearth, loss
due to formation of scales.
Furnace Efficiency by indirect method is given by 100 minus the sum of all losses from 1 to 6
calculated above.
Furnace Efficiency = 100 – (L1+L2+L3+L4+L5+L6)
h) Data collection format for Furnace Performance Assessment
S.N. Sheet 1- Technical specification of furnace
1 Furnace ID code and Make
2 Year of Manufacture
3 Boiler capacity rating
4 Type of Furnace
5 Type of fuel used in furnace
6 Maximum fuel flow rate
7 Fuel GCV
9 Superheat Temperature
10 Heat transfer area in sq.mt.
11 Waste Heat Recovery System
12 Type of draft
13 Chimney Height (M)
14 Fuel Consumption per hour
S = [10+ (Ts-Ta)/20]*(Ts-Ta)

Energy Audit Guidelines for Industrial Sectors
102
Sheet 2 – Fuel Analysis Details
Fuel Fired
GCV of fuel
Specific gravity of fuel (Liquid)
Bulk density of fuel (Solid)
S.N. Proximate Analysis Date of Test Unit
1 Fixed carbon %
2 Volatile matter %
3 Ash %
4 Moisture %
S.N. Ultimate Analysis Date of Test Unit
1 Carbon %
2 Hydrogen %
3 Sulphur %
4 Nitrogen %
5 Ash %
6 Moisture %
7 Oxygen %
S.N. Flue Gas Analysis Date of Test Unit
1 CO2 %
2 O2 %
3 CO %
4 Flue Gas Temperature o C

Energy Audit Guidelines for Industrial Sectors
103
Annex: 8 Surface Heat Loss Calculation
Particulars Formula/Value Units
Boiler Efficiency = %
Area (A)= m2
Operating hours per day= hrs/day
Operating days per year = days/year
Annual Operating Hours = hrs
GCV of Fuel = Kcal/kg
Cost of Fuel per kg = NPR/kg
Surface Heat Loss (Qs)= [10+(Ts-Ta)/20]*(Ts-Ta) Kcal/hr m2
Total Heat Loss (Q)= Qs*A Kcal
Energy Saving per year= (Q before - Q after) * Annual operating hrs Kcal
Equivalent fuel saving per year = Energy saving per year/(GCV of
fuel*furnace efficiency)
kg/year
Annual savings in NPR = fuel savings per year*cost per kg NPR/year

Energy Audit Guidelines for Industrial Sectors
104
Annex: 9 Compressor Calculation
Compressor Specification Data Format
Make Unit Value/Remarks
Type
No. of stages
Discharge capacity Nm3/min
Discharge pressure kg/cm2
Speed RPM
Receiver capacity m3
Motor rating
Power kW
Full-load current A
Voltage V
Power factor PF
Speed RPM
Frequency Hz
Specific power consumption kW/m3/min
Leakage Test in Compressed Air System
Item Unit Value/Remarks
Compressed air users No. Area/section
Load time (t1) min
Unload time (t2) min
Capacity of compressor m3/min
Leakage = [t1/(t1+t2)] x 100 %
Leakage = % Leakage * Capacity of
compressor
m3/min
Capacity Testing of Compressor
Compressor Reference Unit Remarks/Value
Receiver volume plus volume of
pipeline between receiver and the air
compressor (V)
m3
Suction air temperature (t1) °C
Discharge air temperature (t2) °C
Initial receiver pressure (P1) kg/cm2
Final receiver pressure (P2) kg/cm2
Time taken to fill receiver from P1 to
P2(T)
min
Atmospheric pressure (Po) kg/cm2
Air compressor capacity (free air
delivery) Q =
{(P2-P1)/Po*(V/T)}*(273+t1)/(273+t2)
Nm3/min
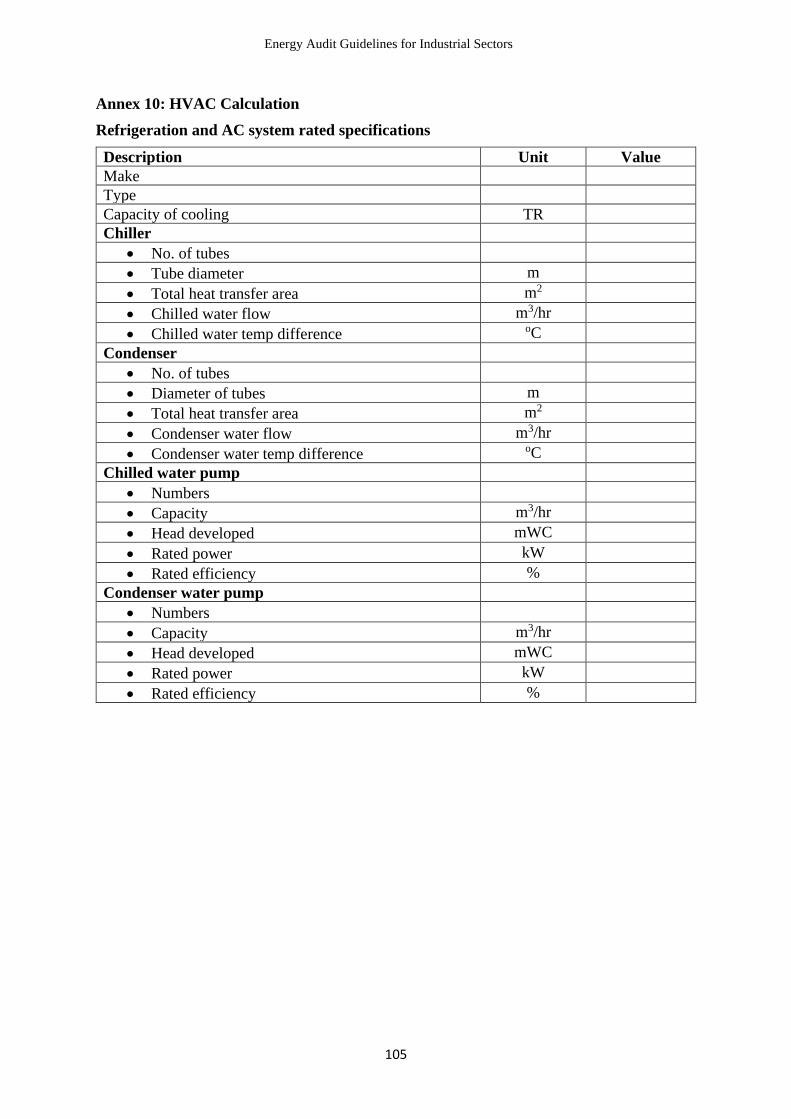
Energy Audit Guidelines for Industrial Sectors
105
Annex 10: HVAC Calculation
Refrigeration and AC system rated specifications
Description Unit Value
Make
Type
Capacity of cooling TR
Chiller
• No. of tubes
• Tube diameter m
• Total heat transfer area m2
• Chilled water flow m3/hr
• Chilled water temp difference oC
Condenser
• No. of tubes
• Diameter of tubes m
• Total heat transfer area m2
• Condenser water flow m3/hr
• Condenser water temp difference oC
Chilled water pump
• Numbers
• Capacity m3/hr
• Head developed mWC
• Rated power kW
• Rated efficiency %
Condenser water pump
• Numbers
• Capacity m3/hr
• Head developed mWC
• Rated power kW
• Rated efficiency %

Energy Audit Guidelines for Industrial Sectors
106
Refrigeration and AC system Operating parameters
S.N. Parameter Unit Values
1. Chilled water flow (using a flow meter or
assessed by level difference)
m3/hr
2. Chilled water pump motor input power kW
3. Chilled water pump suction pressure kg/cm2
4. Chilled water pump discharge pressure kg/cm2
5. Chiller water inlet temperature to chiller oC
6. Chiller water outlet temperature from
Chiller
oC
7. Condenser water inlet temperature oC
8. Condenser pump suction pressure kg/cm2
9. Condenser pump discharge pressure kg/cm2
10. Condenser water outlet temperature oC
11. Chiller (evaporator) outlet refrigerant
Temperature
oC
12. Refrigerant pressure kg/cm2 (or
psig)
13. Condenser inlet refrigerant temperature oC
14. Refrigerant pressure kg/cm2 (or
psig)
15. Actual cooling capacity [(1)*(6-5)/3024] TR
16. COP [11/(10-11)] -
17. Compressor motor input power kW
18. Specific energy consumption kW/TR
19. Input power to CT fan kW
20. Input power to chilled water pumps in
Operation
kW
21. Input power to condenser water pumps
in operation
kW
22. Overall system specific power
consumption [(2+17+19+20)/15]
kW/TR

Energy Audit Guidelines for Industrial Sectors
107
Annex 11: Pump Calculation
S.N. Item reference Units Value/Remarks
1 Design Condition
2 Pump Reference
3 Pump Rated Power kW
4 Rated Flow rate m3/hr
5 Rated Head m
6 Rated Efficiency %
Actual Condition
7 Actual Power (electrical) kW
8 Actual Flow Rate (Q) m3/hr
9 Actual Head (hdis-hsuc) m
10 Fluid density, ρ Kg/m3
11 Acceleration due to gravity (g) m/sec2
12 Hydraulic power =
Q*( hdis-hsuc)* ρ * g/1000
kW
13 Shaft Power (Ps) =
Hydraulic power/pump efficiency, η
kW
14 Electrical Input Power =
Shaft Power/ motor efficiency, η
kW
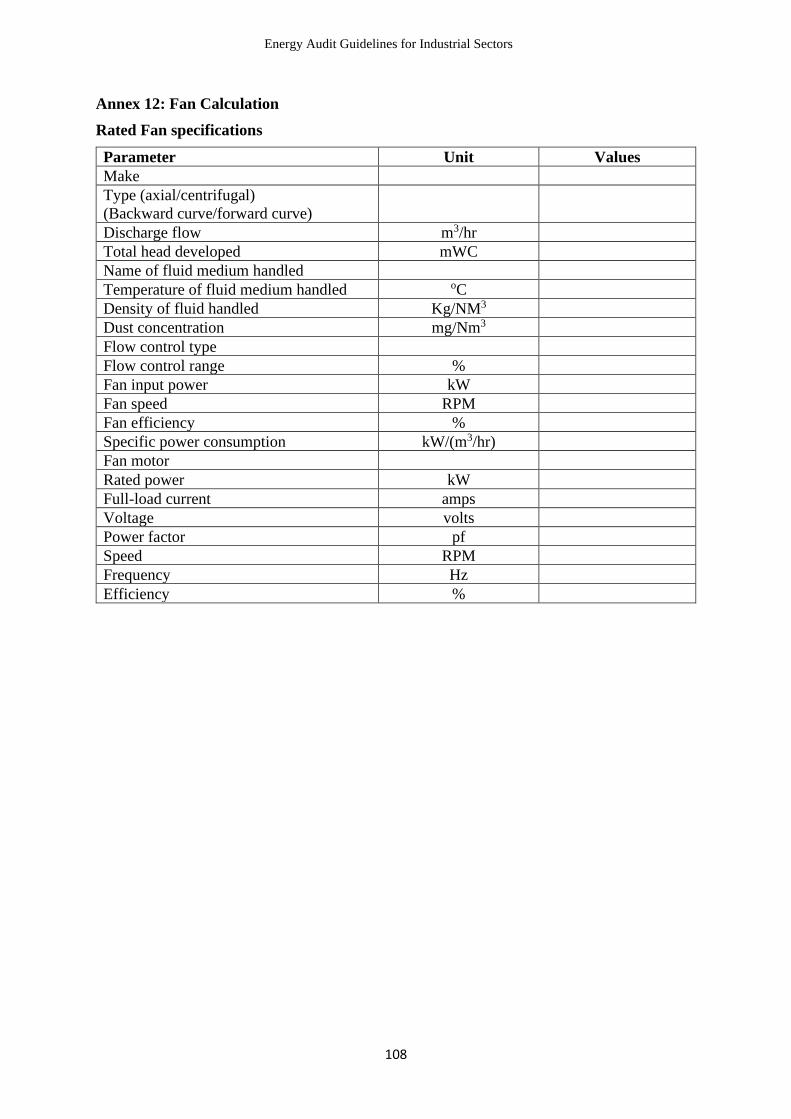
Energy Audit Guidelines for Industrial Sectors
108
Annex 12: Fan Calculation
Rated Fan specifications
Parameter Unit Values
Make
Type (axial/centrifugal)
(Backward curve/forward curve)
Discharge flow m3/hr
Total head developed mWC
Name of fluid medium handled
Temperature of fluid medium handled oC
Density of fluid handled Kg/NM3
Dust concentration mg/Nm3
Flow control type
Flow control range %
Fan input power kW
Fan speed RPM
Fan efficiency %
Specific power consumption kW/(m3/hr)
Fan motor
Rated power kW
Full-load current amps
Voltage volts
Power factor pf
Speed RPM
Frequency Hz
Efficiency %
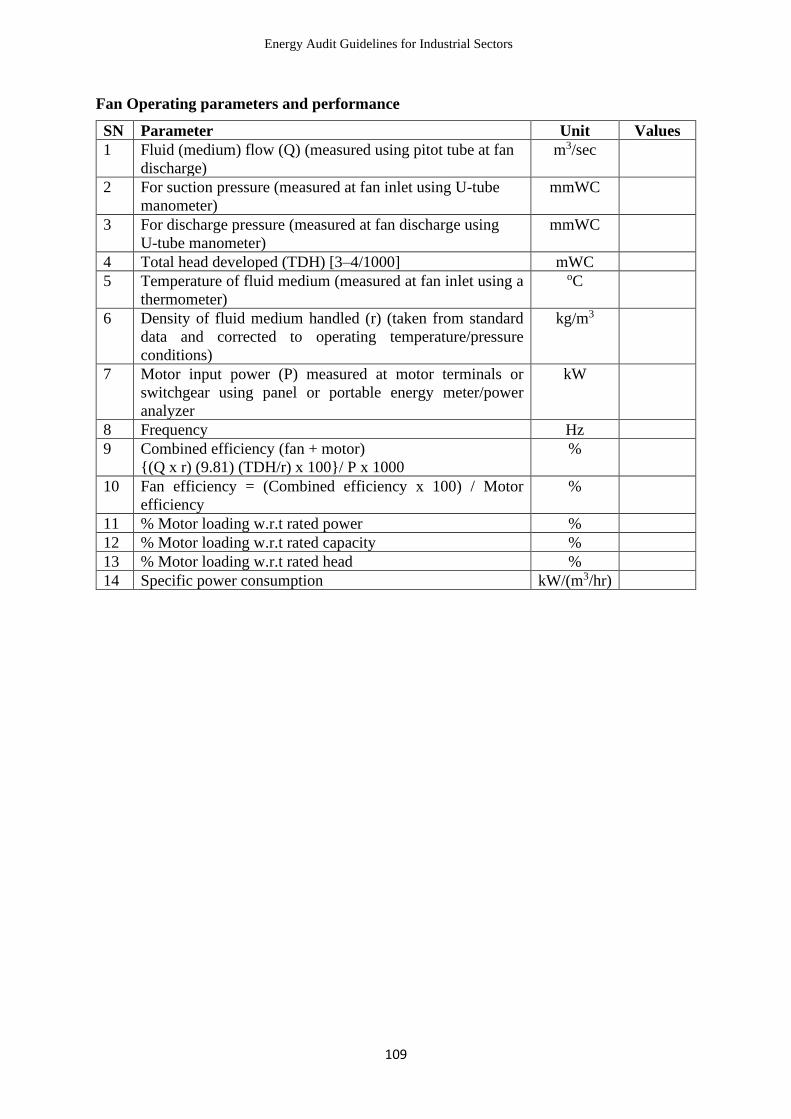
Energy Audit Guidelines for Industrial Sectors
109
Fan Operating parameters and performance
SN Parameter Unit Values
1 Fluid (medium) flow (Q) (measured using pitot tube at fan
discharge)
m3/sec
2 For suction pressure (measured at fan inlet using U-tube
manometer)
mmWC
3 For discharge pressure (measured at fan discharge using
U-tube manometer)
mmWC
4 Total head developed (TDH) [3–4/1000] mWC
5 Temperature of fluid medium (measured at fan inlet using a
thermometer)
oC
6 Density of fluid medium handled (r) (taken from standard
data and corrected to operating temperature/pressure
conditions)
kg/m3
7 Motor input power (P) measured at motor terminals or
switchgear using panel or portable energy meter/power
analyzer
kW
8 Frequency Hz
9 Combined efficiency (fan + motor)
{(Q x r) (9.81) (TDH/r) x 100}/ P x 1000
%
10 Fan efficiency = (Combined efficiency x 100) / Motor
efficiency
%
11 % Motor loading w.r.t rated power %
12 % Motor loading w.r.t rated capacity %
13 % Motor loading w.r.t rated head %
14 Specific power consumption kW/(m3/hr)

Energy Audit Guidelines for Industrial Sectors
110
Annex 13: Methodology for calculating heat losses (Brick Kiln)
I. Calculation of dry flue gas heat losses:
Temperature of flue gas : oC
Flow rate of flue gas : kg/s
Specific heat of flue gas : kJ/kg K
Total dry flue gas heat loss per day : MJ/day
II. Calculation of heat loss due to incomplete combustion:
Average CO concentration : ppm
Heat loss % due to incomplete combustion
((CO% x C% fuel) x 5744) / ((CO% + CO2%) x (GCV)
Calculated heat loss % : %
Total heat loss in MJ/day : MJ/day
III. Calculation of surface temperature heat losses
Ash surface heat loss
Average temperature of the ash surface = oC
Ambient temperature = oC
Convective heat loss = kW
Radiative heat loss = kW
Total heat loss = kW
Total Surface area = m2
Total heat loss in a day (MJ/day) = MJ/day
Heat absorbed by ash from solar radiation (MJ/day) = MJ/day
Net heat loss from the surface (MJ/day) = MJ/day
Tawa surface heat losses
Surface temperature before insulation = oC
Diameter of Tawa = cm,
No. Tawas = N
Total Surface area = m2
Convective heat loss = kW
Radiative heat losses = kW
Total heat loss = MJ/day

Energy Audit Guidelines for Industrial Sectors
111
Annex 14: Cooling Tower Performance.
The important parameters from the point of determining the performance of cooling towers
are:
i. “Range” is the difference between the cooling tower water inlet and outlet temperature.
ii. “Approach” is the difference between the cooling tower outlet cold water temperature
and ambient wet bulb temperature. Although, both range and approach should be
monitored, the `Approach’ is a better indicator of cooling tower performance. Cooling
tower effectiveness (in percentage) is the ratio of range, to the ideal range, i.e.,
difference between cooling water inlet temperature and ambient wet bulb temperature,
or in other words it is = Range / (Range + Approach).
iii. Cooling capacity is the heat rejected in kCal/hr or TR, given as product of mass flow
rate of water, specific heat and temperature difference.
iv. Evaporation loss is the water quantity evaporated for cooling duty and, theoretically,
for every 10,00,000-kCal heat rejected, evaporation quantity works out to 1.8 m3
. An
empirical relation used often is:
Evaporation Loss (m3
/hr) = 0.00085 x 1.8 x circulation rate (m3
/hr) x (T1-T
2)
T1-T
2 = Temperature difference between inlet and outlet water.
Source: Perry’s Chemical Engineers Handbook
v. Cycles of concentration (C.O.C) is the ratio of dissolved solids in circulating water to
the dissolved solids in make-up water.
vi. Blow down losses depend upon cycles of concentration and the evaporation losses and
is given by relation:
Blow Down = Evaporation Loss / (C.O.C. – 1)
vii. Liquid/Gas (L/G) ratio, of a cooling tower is the ratio between the water and the air
mass flow rates. Against design values, seasonal variations require adjustment and
tuning of water and air flow rates to get the best cooling tower effectiveness through
measures like water box loading changes, blade angle adjustments.
Thermodynamics also dictate that the heat removed from the water must be equal to the heat
absorbed by the surrounding air:
L (T1-T2) = G (h2-h1); L/G = (h2-h1)/ (T1-T2)
Where:
L/G = liquid to gas mass flow ratio (kg/kg).
T1
= hot water temperature (oC).
T2
= cold water temperature (oC).
h2
= enthalpy of air-water vapour mixture at exhaust wet-bulb temperature.
h1
= enthalpy of air-water vapour mixture at inlet wet-bulb temperature.

Energy Audit Guidelines for Industrial Sectors
112
Annex 15: Performance Calculation of Turbine
i. Steam Turbine Performance, % =
Actual Enthalpy drop across the turbine, kCal/kg
Isentropic Enthalpy drop across the turbine, kCal/kg∗ 100
ii. Gas Turbine Performance:
a) Air Compressor Efficiency, % =
Theoritical temperature rise across the compressor, (deg. C)
Actual temperature rise, (deg. C)∗ 100
b) b) Overall Gas Turbine Efficiency = (Compressor + Gas Turbine), % =
Power Output, kW ∗ 860
Fuel Input for Gas Turbine,kghr
∗ 𝐺𝐶𝑉 𝑜𝑓 𝑓𝑢𝑒𝑙,𝑘𝑔ℎ𝑟
∗ 100

Energy Audit Guidelines for Industrial Sectors
113
Annex 16: Model Minutes for Energy Audit conduction
Meeting Minutes for Energy Audit
Date:
Opening:
When the meeting was called to order, where it was being held and who called it to order.
Present:
1.
2.
3.
..
Absent:
1.
2.
Agendas:
Agenda 1.
Agenda 2.
..
Decisions:
1:
2:
Conclusion:
Energy Audit Guidelines for Industrial Sectors
114
Annex 17: References
American Society of Mechanical Engineers (ASME), 2009, Energy Assessment for Steam Systems.
http://catalog.asme.org/Codes/PrintBook/EA3_2009
Asian Productivity Organization (APO), 2008, Working Manual on Energy auditing in industry.
http://www.apo-tokyo.org/00e-
ASPS, 2020. Oklahoma USA, Air Compressor Efficiency,
https://www.aspsoklahoma.com/resources/faqs/air-compressor-efficiency/
BEE 2008, Energy Audit Chapter 3.Energy management and audit. India. www.beeindia.nic.in
Bureau of Energy Efficiency-India (BEE), 2008, General Aspect of Energy Management and
Canadian Industry Program for Energy Conservation (CIPEC), 2001, Boilers and Heaters, Improving
Energy-efficiency. Natural Resources Canada, Office of Energy-efficiency, Ottawa, Ontario, Canada.
Canadian Industry Program for Energy Conservation (CIPEC), 2002, Energy Efficiency Planning and
Management Guide. Available at:
Canadian Industry Program for Energy Conservation (CIPEC), 2009, Energy benchmarking and best
practices guidebooks. Available at: http://oee.nrcan.gc.ca/publications/infosource
Central Bureau of Statistics (CBS-Nepal), available at www.cbs.gov.np
Department of Industry,2074/75, Industrial Statistics,
https://www.doind.gov.np/index.php/publications/industry-statistics
DOI, 2017, A Study Report on Competitiveness of Sugar Industries of Nepal
EEC-FNCCI, fact sheets, Brick, 2015. Energy Efficiency Center – Federation of Nepalese Chambers
of Commerce and Industry/Publications, 2015. www.eec-fncci.org
EEC-FNCCI, fact sheets, Cement, 2015. Energy Efficiency Center – Federation of Nepalese Chambers
of Commerce and Industry/Publications, 2015. www.eec-fncci.org
EEC-FNCCI, fact sheets, Dairy, 2015. Energy Efficiency Center – Federation of Nepalese Chambers
of Commerce and Industry/Publications, 2015. www.eec-fncci.org
EEC-FNCCI, fact sheets, Metal, 2015. Energy Efficiency Center – Federation of Nepalese Chambers
of Commerce and Industry/Publications, 2015. www.eec-fncci.org
EEC-FNCCI, fact sheets, Paper, 2015. Energy Efficiency Center – Federation of Nepalese Chambers
of Commerce and Industry/Publications, 2015. www.eec-fncci.org
ESPS/DANIDA, April 2004 Baseline Study of Pulp and Paper Industries of Nepal
ESPS/DANIDA, December 2003. Baseline Study of Brick Industries of Nepal
ESPS/DANIDA, December 2004 Baseline Study of Cement Industries of Nepal
ESPS/DANIDA, June 2003. Baseline Study of Dairy Industries of Nepal
ESPS/DANIDA, November. 2002. Baseline Study of Sugar Industries of Nepal
Morvay, Z.K. and Gvozdenac, D.D., 2008, Applied Industrial Energy and Environmental management.
John Wiley & Sons Ltd. UK.
National Dairy Development Board, 2017, Annul Progress Report 2017 Nepal www.nddb.gov.np
Nepal Electricity Authority/Consumers/Tariff Rates, 2019 www.nea.org.np
Tutterow, V., 1999. American Council for an Energy-efficient Economy (ACEEE), Energy efficiency
in Pumping Systems: Experience and Trends in the Pulp and Paper Industry.
U.S. Department of Energy’s Building Technologies Program (US DOE BTP), 2009.
http://www1.eere.energy.gov/buildings/technologies

Energy Audit Guidelines for Industrial Sectors
115
United Nations Environmental Program (UNEP), 2006.Energy Efficiency Guide for Industry in Asia.
www.energyefficiencyasia.org
WECS, 2010, “Energy Sector Synopsis Report”, Water and Energy Commission Secretariat,
Kathmandu, Nepal
WECS,2012, “National Survey of Energy Consumption and Supply Situation of Nepal”, Water and
Energy Commission Secretariat, Kathmandu, Nepal
WECS,2013, “Energy Data Sheet”, Water and Energy Commission Secretariat, Kathmandu, Nepal
WECS,2013, “Water and Energy Vision-2050”,2013, Water and Energy Commission Secretariat,
Kathmandu, Nepal