energy aspects and ventilation of food retail buildings · and continues by focusing on the role of...
TRANSCRIPT
Full Terms & Conditions of access and use can be found athttp://www.tandfonline.com/action/journalInformation?journalCode=taer20
Download by: [Brunel University London] Date: 28 June 2016, At: 08:28
Advances in Building Energy Research
ISSN: 1751-2549 (Print) 1756-2201 (Online) Journal homepage: http://www.tandfonline.com/loi/taer20
Energy aspects and ventilation of food retailbuildings
Maria Kolokotroni, Savvas A. Tassou & Baboo Lesh Gowreesunker
To cite this article: Maria Kolokotroni, Savvas A. Tassou & Baboo Lesh Gowreesunker (2015)Energy aspects and ventilation of food retail buildings, Advances in Building Energy Research,9:1, 1-19, DOI: 10.1080/17512549.2014.897252
To link to this article: http://dx.doi.org/10.1080/17512549.2014.897252
© 2014 The Author(s). Published by Taylor &Francis.
Published online: 28 Apr 2014.
Submit your article to this journal
Article views: 483
View related articles
View Crossmark data
Energy aspects and ventilation of food retail buildings
Maria Kolokotroni*, Savvas A. Tassou and Baboo Lesh Gowreesunker
RCUK Centre for Sustainable Energy Use in Food Chains, Brunel University, Kingston Lane, Uxbridge UB83PH, UK
Worldwide the food system is responsible for 33% of greenhouse gas emissions. It is estimatedthat by 2050, the total food production should be 70% more than current food productionlevels. In the UK, food chain is responsible for around 18% of final energy use and 20% ofGHG emissions. Estimates indicate that energy savings of the order of 50% are achievablein food chains by appropriate technology changes in food production, processing,packaging, transportation, and consumption. Ventilation and infiltration account for asignificant percentage of the energy use in food retail (supermarkets) and catering facilitiessuch as restaurants and drink outlets. In addition, environmental conditions to maintainindoor air quality and comfort for the users with minimum energy use for such buildings areof primary importance for the business owners and designers. In particular, supermarketsand restaurants present design and operational challenges because the heating ventilationand air-conditioning system has some unique and diverse conditions that it must handle.This paper presents current information on energy use in food retail and catering facilitiesand continues by focusing on the role of ventilation strategies in food retail supermarkets. Itpresents the results of current studies in the UK where operational low carbon supermarketsare predicted to save 66% of CO2 emissions compared to a base case store. It shows thatlow energy ventilation strategies ranging from improved envelope air-tightness, naturalventilation components, reduction of specific fan power, ventilative cooling, novelrefrigeration systems using CO2 combined with ventilation heat recovery and storage withphase change materials can lead to significant savings with attractive investment return.
Keywords: energy use; food chain; ventilation; supermarkets; heat recovery; refrigeration; UK
1. Introduction
The food chain comprises agricultural production, manufacturing, distribution, retail, consump-tion and waste disposal. In Europe, there were just over 48 million people employed withinthe EU–27’s food chain in 2008; this equated to more than one in five of the EU’s total workforce.The food chain was made up of close to 17 million different holdings/enterprises and generatedEUR 751 billion of added value, equivalent to just under 6% of the EU-27’s GDP (Eurostat,2011). In 2010, the food and tobacco industry sector accounted for almost 10% share of thetotal-energy consumed by the EU-27 industry (29 Mtoe vs. 292 Mtoe total), (Eurostat, 2012).
In the UK alone, it is estimated that the food chain is responsible for 195 MtCO2e emissionsfrom domestic food chain activity in 2010, of which 118 MtCO2e are from UK food chain activityand the remainder from food imports; retail and catering account for 7.7 Mtoe/year or 18 MtCO2eemissions. Figure 1 shows these statistics diagrammatically. The food chain is also responsible for
© 2014 The Author(s). Published by Taylor & Francis.This is an Open Access article distributed under the terms of the Creative Commons Attribution-NonCommercial-NoDerivatives License(http://creativecommons.org/Licenses/by-nc-nd/4.0/), which permits non-commercial re-use, distribution, and reproduction in any medium,provided the original work is properly cited, and is not altered, transformed, or built upon in any way.
*Corresponding author. Email: [email protected]
Advances in Building Energy Research, 2015Vol. 9, No. 1, 1–19, http://dx.doi.org/10.1080/17512549.2014.897252
Dow
nloa
ded
by [
Bru
nel U
nive
rsity
Lon
don]
at 0
8:28
28
June
201
6
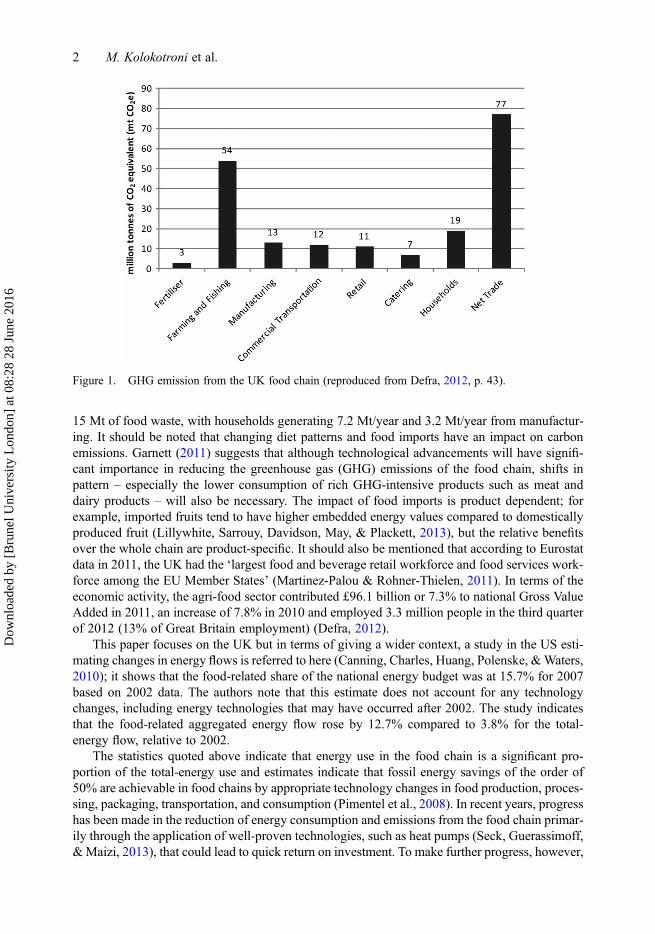
15 Mt of food waste, with households generating 7.2 Mt/year and 3.2 Mt/year from manufactur-ing. It should be noted that changing diet patterns and food imports have an impact on carbonemissions. Garnett (2011) suggests that although technological advancements will have signifi-cant importance in reducing the greenhouse gas (GHG) emissions of the food chain, shifts inpattern – especially the lower consumption of rich GHG-intensive products such as meat anddairy products – will also be necessary. The impact of food imports is product dependent; forexample, imported fruits tend to have higher embedded energy values compared to domesticallyproduced fruit (Lillywhite, Sarrouy, Davidson, May, & Plackett, 2013), but the relative benefitsover the whole chain are product-specific. It should also be mentioned that according to Eurostatdata in 2011, the UK had the ‘largest food and beverage retail workforce and food services work-force among the EU Member States’ (Martinez-Palou & Rohner-Thielen, 2011). In terms of theeconomic activity, the agri-food sector contributed £96.1 billion or 7.3% to national Gross ValueAdded in 2011, an increase of 7.8% in 2010 and employed 3.3 million people in the third quarterof 2012 (13% of Great Britain employment) (Defra, 2012).
This paper focuses on the UK but in terms of giving a wider context, a study in the US esti-mating changes in energy flows is referred to here (Canning, Charles, Huang, Polenske, &Waters,2010); it shows that the food-related share of the national energy budget was at 15.7% for 2007based on 2002 data. The authors note that this estimate does not account for any technologychanges, including energy technologies that may have occurred after 2002. The study indicatesthat the food-related aggregated energy flow rose by 12.7% compared to 3.8% for the total-energy flow, relative to 2002.
The statistics quoted above indicate that energy use in the food chain is a significant pro-portion of the total-energy use and estimates indicate that fossil energy savings of the order of50% are achievable in food chains by appropriate technology changes in food production, proces-sing, packaging, transportation, and consumption (Pimentel et al., 2008). In recent years, progresshas been made in the reduction of energy consumption and emissions from the food chain primar-ily through the application of well-proven technologies, such as heat pumps (Seck, Guerassimoff,&Maizi, 2013), that could lead to quick return on investment. To make further progress, however,
Figure 1. GHG emission from the UK food chain (reproduced from Defra, 2012, p. 43).
2 M. Kolokotroni et al.
Dow
nloa
ded
by [
Bru
nel U
nive
rsity
Lon
don]
at 0
8:28
28
June
201
6
significant innovations will have to be made in approaches and technologies at all stages of thefood chain, taking a holistic view of the chain and the interactions both within the chain andthe external environment.
This paper focuses on the retail (supermarkets) part of the food chain. Through a literaturereview and a UK focus, it aims to show how low energy ventilation technologies can be usedin food retail buildings in order to reduce their energy use. Section 2 presents some energy usestatistics for both food retail and catering buildings whilst Section 3 focusses on the energyrequirements of supermarkets. Section 4 presents examples of low carbon supermarkets in theUK and their ventilation features with separate sections on building design and refrigeration plant.
2. Energy use in food retail and catering
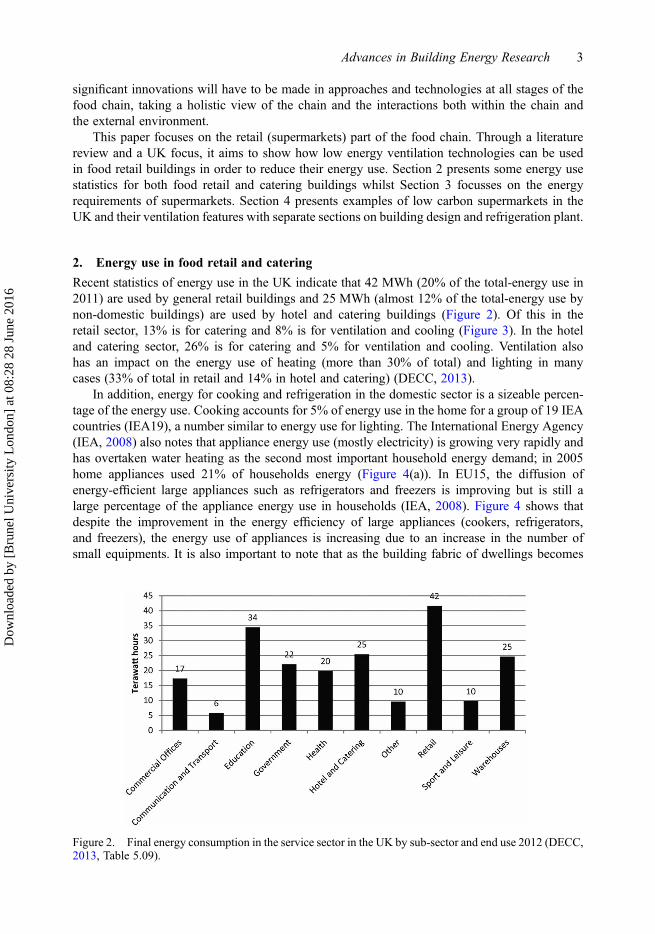
Recent statistics of energy use in the UK indicate that 42 MWh (20% of the total-energy use in2011) are used by general retail buildings and 25 MWh (almost 12% of the total-energy use bynon-domestic buildings) are used by hotel and catering buildings (Figure 2). Of this in theretail sector, 13% is for catering and 8% is for ventilation and cooling (Figure 3). In the hoteland catering sector, 26% is for catering and 5% for ventilation and cooling. Ventilation alsohas an impact on the energy use of heating (more than 30% of total) and lighting in manycases (33% of total in retail and 14% in hotel and catering) (DECC, 2013).
In addition, energy for cooking and refrigeration in the domestic sector is a sizeable percen-tage of the energy use. Cooking accounts for 5% of energy use in the home for a group of 19 IEAcountries (IEA19), a number similar to energy use for lighting. The International Energy Agency(IEA, 2008) also notes that appliance energy use (mostly electricity) is growing very rapidly andhas overtaken water heating as the second most important household energy demand; in 2005home appliances used 21% of households energy (Figure 4(a)). In EU15, the diffusion ofenergy-efficient large appliances such as refrigerators and freezers is improving but is still alarge percentage of the appliance energy use in households (IEA, 2008). Figure 4 shows thatdespite the improvement in the energy efficiency of large appliances (cookers, refrigerators,and freezers), the energy use of appliances is increasing due to an increase in the number ofsmall equipments. It is also important to note that as the building fabric of dwellings becomes
Figure 2. Final energy consumption in the service sector in the UK by sub-sector and end use 2012 (DECC,2013, Table 5.09).
Advances in Building Energy Research 3
Dow
nloa
ded
by [
Bru
nel U
nive
rsity
Lon
don]
at 0
8:28
28
June
201
6

more energy efficient, space conditioning needs will reduce, thus rendering other end uses, suchas cooking, much more important components of energy use and, as a result, there will be a shiftof focus of energy-saving strategies towards these appliances.
In the light of the above statistics, this project will investigate energy use reduction technol-ogies, starting with food retail buildings in the UK which are the focus of the remainder of thispaper.
3. Energy requirements of supermarkets
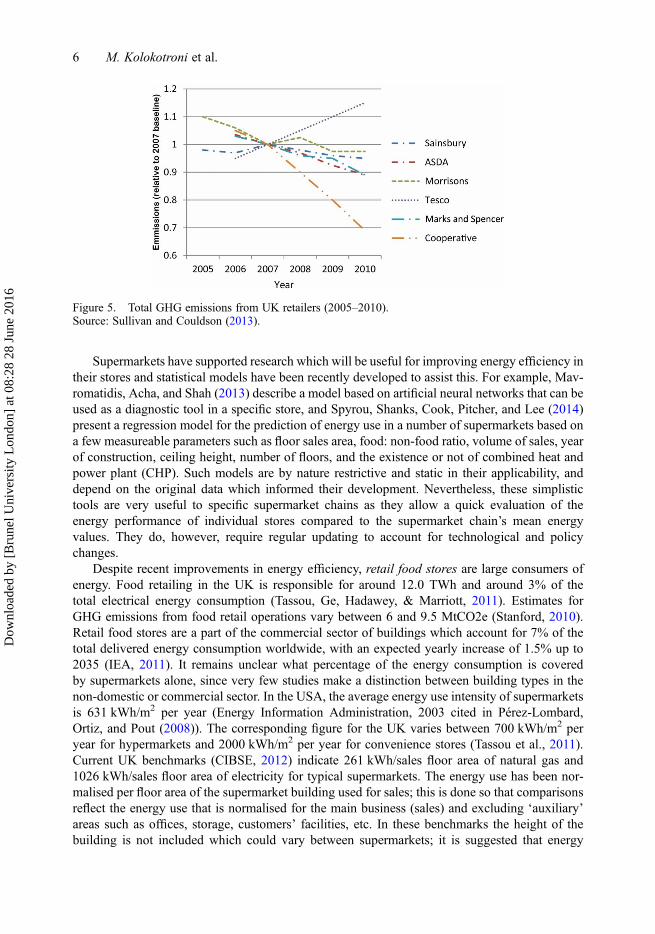
There is evidence that UK supermarkets have significantly improved their operational efficiencyover the period 2000–2010. Figure 5 presents (Sullivan & Gouldson, 2013) the total GHG emis-sions relative to the 2007 baseline of six supermarket chains; it can be seen that the majority haveimproved emissions; one of the supermarket chains reports increased emissions and this is mainlydue to the expansion of operations outside the UK; its UK emissions were reduced by 5%. Sulli-van and Gouldson (2013) suggest that this reduction stems from increased emphasis of these com-panies’ sustainability strategies on climate change considerations since the mid-2000s as reflectedin corporate responsibility reports with specific commitments to reduce operational emissions. Arecent report (British Retail Consortium, 2014) suggests that progress since the mid-2000s is dueto improvements in:
(a) retail operations by improving energy monitoring and control systems; developinginvestment models to support corporate energy demand reduction strategies; and improv-ing the operational efficiency through placing doors on fridges and chillers and imple-menting auto-defrost processes to tackle waste energy consumption;
(b) energy use in buildings by deployment of energy-efficient technologies such as light-emitting diode (LED) lighting; trialling new and innovative technologies in refrigeration,heating, and ventilation equipment; and increasing the use of renewable energy on sitessuch as biomass boilers, solar power, and wind turbines;
(c) transport by increasing the use of alternative fuels in fleets, such as bio-diesel and fuelsfrom waste; and developing better route optimisation models and increasing delivery effi-ciency; and
(d) staff training and behaviour change in energy use and efficient driving techniques wereintroduced.
Figure 3. Final energy consumption in ‘retail’ and ‘hotel & catering’ in the UK by end use in 2012 (DECC,2013, Table 5.09).
4 M. Kolokotroni et al.
Dow
nloa
ded
by [
Bru
nel U
nive
rsity
Lon
don]
at 0
8:28
28
June
201
6

Figure 4. Household energy use by end use and appliances (a) IEA19, (b) EU15, and (c) the share of largeand small appliances in EU15.Source: IEA (2008).
Advances in Building Energy Research 5
Dow
nloa
ded
by [
Bru
nel U
nive
rsity
Lon
don]
at 0
8:28
28
June
201
6
Supermarkets have supported research which will be useful for improving energy efficiency intheir stores and statistical models have been recently developed to assist this. For example, Mav-romatidis, Acha, and Shah (2013) describe a model based on artificial neural networks that can beused as a diagnostic tool in a specific store, and Spyrou, Shanks, Cook, Pitcher, and Lee (2014)present a regression model for the prediction of energy use in a number of supermarkets based ona few measureable parameters such as floor sales area, food: non-food ratio, volume of sales, yearof construction, ceiling height, number of floors, and the existence or not of combined heat andpower plant (CHP). Such models are by nature restrictive and static in their applicability, anddepend on the original data which informed their development. Nevertheless, these simplistictools are very useful to specific supermarket chains as they allow a quick evaluation of theenergy performance of individual stores compared to the supermarket chain’s mean energyvalues. They do, however, require regular updating to account for technological and policychanges.
Despite recent improvements in energy efficiency, retail food stores are large consumers ofenergy. Food retailing in the UK is responsible for around 12.0 TWh and around 3% of thetotal electrical energy consumption (Tassou, Ge, Hadawey, & Marriott, 2011). Estimates forGHG emissions from food retail operations vary between 6 and 9.5 MtCO2e (Stanford, 2010).Retail food stores are a part of the commercial sector of buildings which account for 7% of thetotal delivered energy consumption worldwide, with an expected yearly increase of 1.5% up to2035 (IEA, 2011). It remains unclear what percentage of the energy consumption is coveredby supermarkets alone, since very few studies make a distinction between building types in thenon-domestic or commercial sector. In the USA, the average energy use intensity of supermarketsis 631 kWh/m2 per year (Energy Information Administration, 2003 cited in Pérez-Lombard,Ortiz, and Pout (2008)). The corresponding figure for the UK varies between 700 kWh/m2 peryear for hypermarkets and 2000 kWh/m2 per year for convenience stores (Tassou et al., 2011).Current UK benchmarks (CIBSE, 2012) indicate 261 kWh/sales floor area of natural gas and1026 kWh/sales floor area of electricity for typical supermarkets. The energy use has been nor-malised per floor area of the supermarket building used for sales; this is done so that comparisonsreflect the energy use that is normalised for the main business (sales) and excluding ‘auxiliary’areas such as offices, storage, customers’ facilities, etc. In these benchmarks the height of thebuilding is not included which could vary between supermarkets; it is suggested that energy
Figure 5. Total GHG emissions from UK retailers (2005–2010).Source: Sullivan and Couldson (2013).
6 M. Kolokotroni et al.
Dow
nloa
ded
by [
Bru
nel U
nive
rsity
Lon
don]
at 0
8:28
28
June
201
6

use is also normalised per building volume to take this into account. It should also be noted thatEnergy Performance in Buildings Directive recast calls for the display of energy performance cer-tificates of buildings such as supermarkets and restaurants (Directive 2010/31/UE, 2010, para-graph 24 and article 13).
The energy use in supermarkets will depend on business practices, store format, product mix,shopping activity, the equipment used for in-store food preparation, preservation, and display.This can be reflected in a current classification according to their location/function and salesfloor area that are described in Table 1 [Defra, 2006; IGD, 2013]. Energy use varies butcurrent benchmarks do not reflect this. Research has been carried out for individual categoriesand Figure 6 shows diagrammatically the energy use by various parts in a hypermarket. Ingeneral, the refrigeration systems account for between 30% and 60% of the electricity used(taking into consideration smaller stores), whereas lighting accounts for between 15% and25% with the heating ventilation and air-conditioning (HVAC) equipment and other utilitiessuch as bakery, for the remainder. Gas is normally used for space heating, domestic hot waterand in some cases for cooking and baking and can be as high as 250 kWh/m2 per year inhypermarkets.
Therefore, significant energy savings can be achieved by improving the efficiency of refriger-ation systems, refrigeration and HVAC system integration, heat recovery and amplification usingheat pumps, demand sidemanagement, systemdiagnostics and local combined heat and power gen-eration and trigeneration. Energy-saving opportunities also exist from the use of low energy light-ing systems, improvements in the building fabric, integration of renewable energy sources, and
Table 1. Food retail shops’ classification according to their floor area (Defra, 2006; IGD, 2013).
Category Floor area
Convenience store – usually in a dense urban location, sometimes part of a building <280 m2
Supermarket – usually in an urban location, part of another building or astand-alone building
280–1400 m2
Superstore – usually in a suburban location, mostly a stand-alone building 1400–5000 m2
Hypermarket – usually in an out-of-town shopping area; often with no fooditems included
>5000 m2
Figure 6. Percentage contribution of electrical energy use processes in a hypermarket.Source: Tassou et al. (2011).
Advances in Building Energy Research 7
Dow
nloa
ded
by [
Bru
nel U
nive
rsity
Lon
don]
at 0
8:28
28
June
201
6
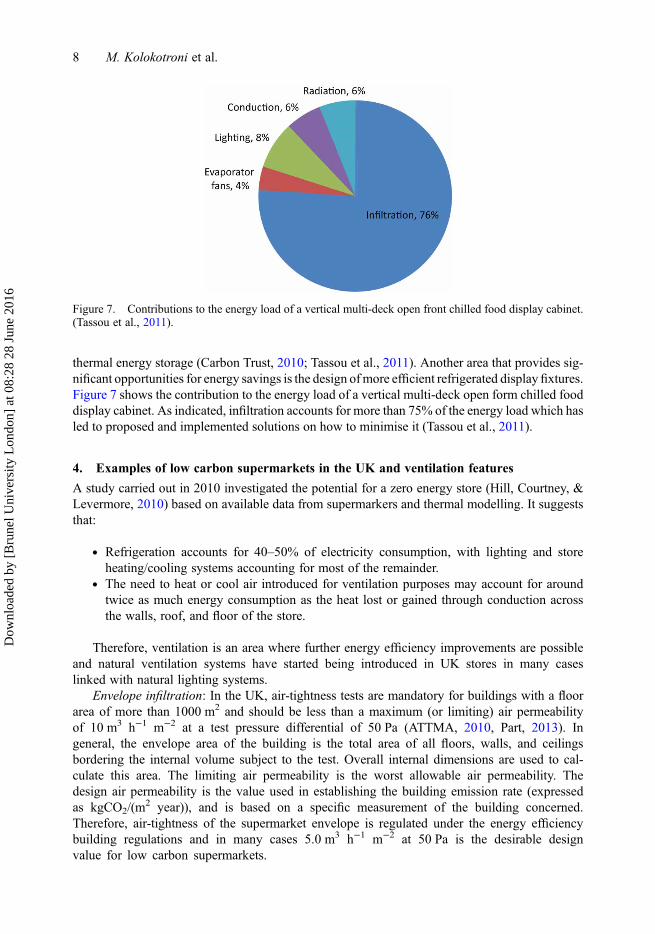
thermal energy storage (Carbon Trust, 2010; Tassou et al., 2011). Another area that provides sig-nificant opportunities for energy savings is the design ofmore efficient refrigerated display fixtures.Figure 7 shows the contribution to the energy load of a vertical multi-deck open form chilled fooddisplay cabinet. As indicated, infiltration accounts for more than 75% of the energy load which hasled to proposed and implemented solutions on how to minimise it (Tassou et al., 2011).
4. Examples of low carbon supermarkets in the UK and ventilation features
A study carried out in 2010 investigated the potential for a zero energy store (Hill, Courtney, &Levermore, 2010) based on available data from supermarkers and thermal modelling. It suggeststhat:
. Refrigeration accounts for 40–50% of electricity consumption, with lighting and storeheating/cooling systems accounting for most of the remainder.
. The need to heat or cool air introduced for ventilation purposes may account for aroundtwice as much energy consumption as the heat lost or gained through conduction acrossthe walls, roof, and floor of the store.
Therefore, ventilation is an area where further energy efficiency improvements are possibleand natural ventilation systems have started being introduced in UK stores in many caseslinked with natural lighting systems.
Envelope infiltration: In the UK, air-tightness tests are mandatory for buildings with a floorarea of more than 1000 m2 and should be less than a maximum (or limiting) air permeabilityof 10 m3 h−1 m−2 at a test pressure differential of 50 Pa (ATTMA, 2010, Part, 2013). Ingeneral, the envelope area of the building is the total area of all floors, walls, and ceilingsbordering the internal volume subject to the test. Overall internal dimensions are used to cal-culate this area. The limiting air permeability is the worst allowable air permeability. Thedesign air permeability is the value used in establishing the building emission rate (expressedas kgCO2/(m
2 year)), and is based on a specific measurement of the building concerned.Therefore, air-tightness of the supermarket envelope is regulated under the energy efficiencybuilding regulations and in many cases 5.0 m3 h−1 m−2 at 50 Pa is the desirable designvalue for low carbon supermarkets.
Figure 7. Contributions to the energy load of a vertical multi-deck open front chilled food display cabinet.(Tassou et al., 2011).
8 M. Kolokotroni et al.
Dow
nloa
ded
by [
Bru
nel U
nive
rsity
Lon
don]
at 0
8:28
28
June
201
6
Ventilation strategies can be divided to those (a) integrated with other low carbon design strat-egies for the building and (b) integrated with the equipment of the supermarket.
4.1. Low carbon design and ventilation
There are examples of low carbon supermarkets and guidelines on how to achieve such buildings.Two reports sponsored by leading UK supermarket chains have been published in the last fewyears (Hill et al., 2010; Target Zero, 2011). In both reports, a base case supermarket wascreated based on the operational details of an existing store and energy efficiency measureswere investigated, including renewables. In this paper, only the energy efficiency improvementsare reviewed.
The results of the (Target Zero, 2011) study are shown in Table 2; the energy efficiencyimprovements introduced were divided into three packages, each with increased energysavings. Table 2 shows that all three energy efficiency packages are predicted to save money.Package B which includes ventilation features such as reduction of specific fan power and ven-tilation heat recovery has a lower net-present value (NPV) than Package A and therefore is moreattractive. For package C which includes additionally highly improved air-tightness at 5 m3 h−1
m−2 at 50 Pa, despite the greater reduction in carbon emissions, its economic performance is lessattractive.
(Hill et al., 2010) report has summarised low energy design initiatives as:
. Enhanced utilisation of daylight.
. A combination of natural and mechanical ventilation, with heat exchange.
. Improved refrigeration cabinets, with doors on frozen food cabinets.
. Improved control over lighting and ventilation, and acceptance of a wider range of internaltemperatures.
. LED display lighting.
. Renewable energy sources, such as biomass or wind power.
The overall effect of these measures is typically to reduce energy consumption to around 400kWh/m², with the proportional reduction in energy use for lighting and refrigeration being slightlyhigher than for heating and cooling. This sets a baseline for considering future reductions inenergy use and emissions.
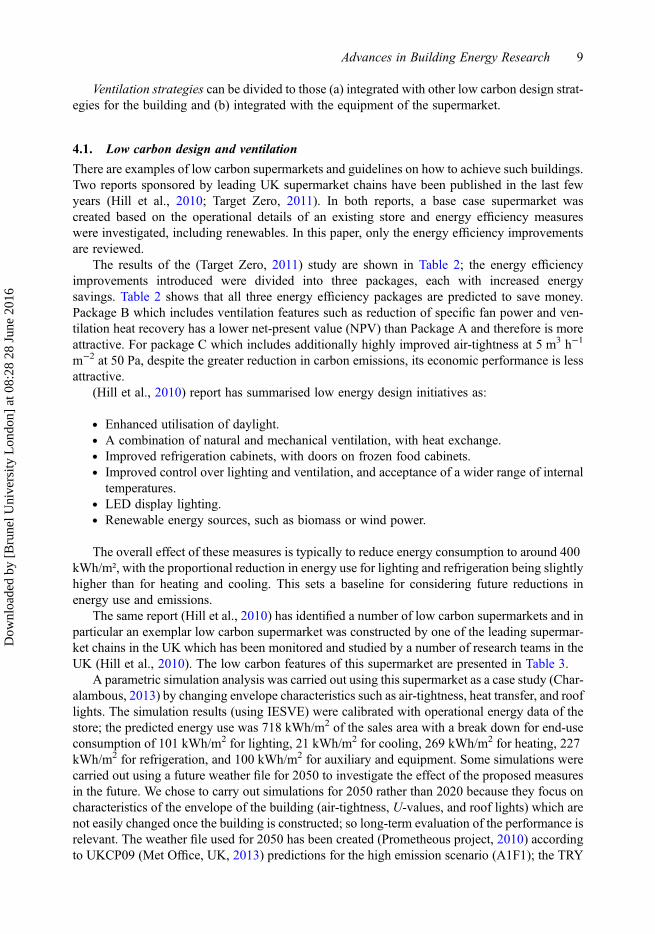
The same report (Hill et al., 2010) has identified a number of low carbon supermarkets and inparticular an exemplar low carbon supermarket was constructed by one of the leading supermar-ket chains in the UK which has been monitored and studied by a number of research teams in theUK (Hill et al., 2010). The low carbon features of this supermarket are presented in Table 3.
A parametric simulation analysis was carried out using this supermarket as a case study (Char-alambous, 2013) by changing envelope characteristics such as air-tightness, heat transfer, and rooflights. The simulation results (using IESVE) were calibrated with operational energy data of thestore; the predicted energy use was 718 kWh/m2 of the sales area with a break down for end-useconsumption of 101 kWh/m2 for lighting, 21 kWh/m2 for cooling, 269 kWh/m2 for heating, 227kWh/m2 for refrigeration, and 100 kWh/m2 for auxiliary and equipment. Some simulations werecarried out using a future weather file for 2050 to investigate the effect of the proposed measuresin the future. We chose to carry out simulations for 2050 rather than 2020 because they focus oncharacteristics of the envelope of the building (air-tightness, U-values, and roof lights) which arenot easily changed once the building is constructed; so long-term evaluation of the performance isrelevant. The weather file used for 2050 has been created (Prometheous project, 2010) accordingto UKCP09 (Met Office, UK, 2013) predictions for the high emission scenario (A1F1); the TRY
Advances in Building Energy Research 9
Dow
nloa
ded
by [
Bru
nel U
nive
rsity
Lon
don]
at 0
8:28
28
June
201
6

Table 2. Energy efficiency measures for zero-carbon stores.
Option Energy efficiency measuresTotal operational CO2 emissions (kgCO2/yr)[change from base case total emissions]
Change in capital cost frombase case building (%)
Change in 25-year NPV frombase case building (£)
Base casebuilding
– 6,99,289 – –
Package A Composite internal floor 5,08,196 −9,73,545High efficiency lamps and luminaires (−27%) (−0.36%)Specific fan power reduced by 20%Motion sensing control throughoutImproved chiller efficiency SEER = 6Improved boiler efficiency to 95%Building oriented so that glazed façadefaces south
Package A plus (or superseded by): 4,19,895 −1,053,332
Package B Very high efficiency lamps andluminaires
(−51%) (0.90%)
Specific fan power reduced by 30%Roof lights 10% with daylight dimmingImproved chiller efficiency SEER = 7Ventilation heat recovery (60% efficient)Improved air-tightness 7 m3/h per m2 at
50 PaPackage B plus (or superseded by): 3,79,548 −4,95,153
Package C Specific fan power reduced by 40% (−46%) (5.1%)Roof lights 15% with daylight dimmingImproved chiller efficiency SEER = 8Highly improved air-tightness 5 m3/hper m2 at 50 Pa
Active chilled beam/radiant ceilingAdvanced thermal bridging (0.013W/m2 K)
Improved wall U-value to 0.25 W/m2 K
Source: Target Zero (2011, p. 21).
10M.Kolokotroni
etal.
Dow
nloa
ded
by [
Bru
nel U
nive
rsity
Lon
don]
at 0
8:28
28
June
201
6
weather file for Manchester was used for the current year simulations, and the UKCP09, A1FI,50th percentile for Manchester was used for 2050.
The results are shown in Figures 8–11. Figure 8 shows the energy use predictions usingcurrent and 2050 weather files for different levels of external envelope air-tightness. The valueused was 1 ACH (which is just below the UK limiting value of 10 m3/h per m2 of the externalbuilding envelope). The values of 7, 3, and 1 m3/h per m2 were used for the simulations. Asexpected, increased air-tightness results in a reduction in the total-energy use in all cases.However, it is also shown that improvement beyond 3 m3/h per m2 yields diminishing results.It also shows that although the energy demand for heating is reduced in all cases, electricitydemand increases due to lower heat losses through the envelope increasing the coolingdemand in the summer. However, this increase could be overcome by carefully controlling thebuilding using ventilative cooling.
Figure 9 shows the energy use predictions using current and 2050 weather files for differentlevels of insulation of the external envelope of the building (walls, roof, and glazing, includingroof lights). The simulations included three scenarios (a) the building as is (walls and roof:0.27 W/m2K and glazing 1.95 W/m2K), (b) improved insulation to current building regulations(walls and roof: 0.15 W/m2K and glazing 1.2 W/m2K), and (c) further improvement to insulation(walls and roof: 0.1 W/m2K and glazing 0.8 W/m2K). The results show that as in the case of air-tightness, improved insulation of the external envelop might yield diminishing results, if a suit-able ventilative cooling strategy is not implemented.
Roof lights have been used increasingly in low energy supermarkets in the UK (Figure 10).Figures 11 and 12 show the energy use predictions using current and 2050 weather files for
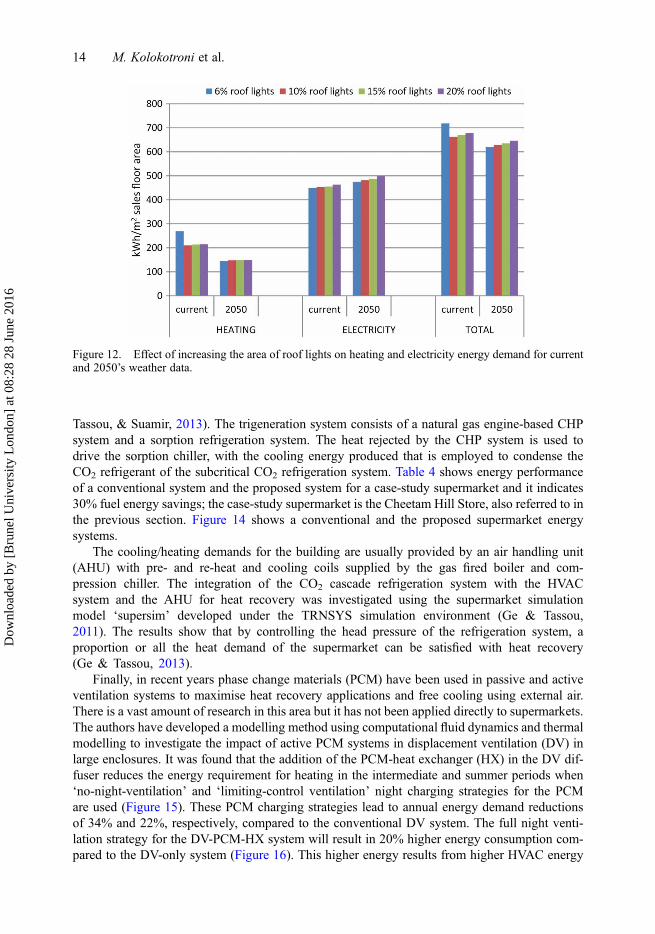
different sizes of roof lights as a percentage of the roof area. Four percentage areas were simu-lated: 6% of the roof area which is the current area of roof lights in the case-study building,10%, 15%, and 20% of the roof area. Figure 11 shows that increasing the area of the rooflights will result to a reduction of energy required for lighting. However, Figure 12 shows thatwhen the total-energy demand is considered, an increase in energy demand is observed forroof light areas more than 10% in all examined cases.
In addition, roof vents have been included in low energy supermarkets which might be a suit-able solution in combination with roof lights to provide an easily controlled ventilative coolingstrategy. A recent example of such installation is in a superstore which opened in January2013 (Figure 13). This followed the installation of bespoke windcatchers at the Cheetam HillStore which has achieved 37% energy use reduction based on energy efficiency measures and
Table 3. Emission reduction measures for zero-carbon stores (Hill et al., 2010, p. 22)
Envelope/glazing Nanogel sandwich skylights1200 mm clerestory glazing
Lighting 900 Lux instead of 1200 luxDALI control system – individually addressable fittingsLED lighting in display cabinets
Ventilation/cooling Windcatchers roof ventsControl by CO2 concentration
Refrigeration Doors on freezer cabinetsAnti-sweat coatingsCO2 refrigerant
Energy supply CHP system powered by biofuel derived from wastesMicro-wind turbine
Forecast energy savings 50% energy use reduction compared with the base case (2006 regulations store)66% emissions reduction
Advances in Building Energy Research 11
Dow
nloa
ded
by [
Bru
nel U
nive
rsity
Lon
don]
at 0
8:28
28
June
201
6

a total of 66% CO2 reduction if the combined cooling heating and power plant room utilisingabsorption chiller technology is included (Campbell & Riley, 2009).
4.2. Refrigeration plant and ventilation
CO2 refrigeration systems have been used in recent years because of the environmental benefitsthey offer in terms of energy use reduction and avoidance of harmful refrigerant leakage to theatmosphere. At Brunel University, novel CO2 refrigeration systems have been developed forsupermarkets, notably with the integration of CO2 refrigeration and trigeneration systemswhere the refrigeration generated by the trigeneration system is used to condense the CO2 refriger-ant in a cascade arrangement (Suamir, Tassou, & Marriot, 2012; Suamir & Tassou, 2013, Ge,
Figure 8. Effect of increased envelope air-tightness (m3/m2 of envelope area at 50 Pa) on heating and elec-tricity energy demand for current and 2050s weather data.
Figure 9. Effect of reduction of envelope (first number) and glazing (second number) heat transfer(W/m2K, U-values) on heating and electricity energy demand for current and 2050s weather data.
12 M. Kolokotroni et al.
Dow
nloa
ded
by [
Bru
nel U
nive
rsity
Lon
don]
at 0
8:28
28
June
201
6
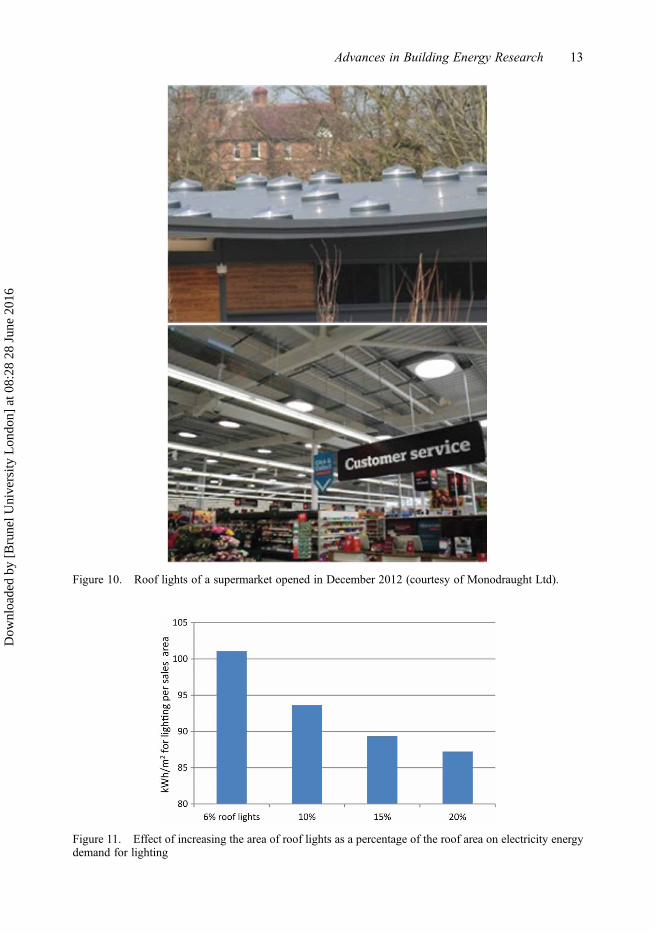
Figure 10. Roof lights of a supermarket opened in December 2012 (courtesy of Monodraught Ltd).
Figure 11. Effect of increasing the area of roof lights as a percentage of the roof area on electricity energydemand for lighting
Advances in Building Energy Research 13
Dow
nloa
ded
by [
Bru
nel U
nive
rsity
Lon
don]
at 0
8:28
28
June
201
6
Tassou, & Suamir, 2013). The trigeneration system consists of a natural gas engine-based CHPsystem and a sorption refrigeration system. The heat rejected by the CHP system is used todrive the sorption chiller, with the cooling energy produced that is employed to condense theCO2 refrigerant of the subcritical CO2 refrigeration system. Table 4 shows energy performanceof a conventional system and the proposed system for a case-study supermarket and it indicates30% fuel energy savings; the case-study supermarket is the Cheetam Hill Store, also referred to inthe previous section. Figure 14 shows a conventional and the proposed supermarket energysystems.
The cooling/heating demands for the building are usually provided by an air handling unit(AHU) with pre- and re-heat and cooling coils supplied by the gas fired boiler and com-pression chiller. The integration of the CO2 cascade refrigeration system with the HVACsystem and the AHU for heat recovery was investigated using the supermarket simulationmodel ‘supersim’ developed under the TRNSYS simulation environment (Ge & Tassou,2011). The results show that by controlling the head pressure of the refrigeration system, aproportion or all the heat demand of the supermarket can be satisfied with heat recovery(Ge & Tassou, 2013).
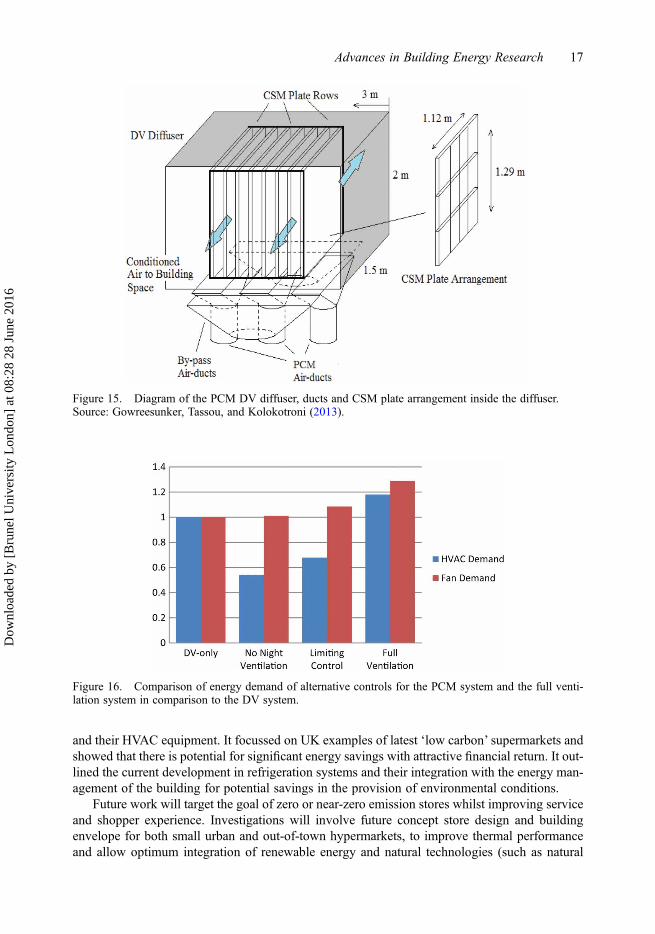
Finally, in recent years phase change materials (PCM) have been used in passive and activeventilation systems to maximise heat recovery applications and free cooling using external air.There is a vast amount of research in this area but it has not been applied directly to supermarkets.The authors have developed a modelling method using computational fluid dynamics and thermalmodelling to investigate the impact of active PCM systems in displacement ventilation (DV) inlarge enclosures. It was found that the addition of the PCM-heat exchanger (HX) in the DV dif-fuser reduces the energy requirement for heating in the intermediate and summer periods when‘no-night-ventilation’ and ‘limiting-control ventilation’ night charging strategies for the PCMare used (Figure 15). These PCM charging strategies lead to annual energy demand reductionsof 34% and 22%, respectively, compared to the conventional DV system. The full night venti-lation strategy for the DV-PCM-HX system will result in 20% higher energy consumption com-pared to the DV-only system (Figure 16). This higher energy results from higher HVAC energy
Figure 12. Effect of increasing the area of roof lights on heating and electricity energy demand for currentand 2050’s weather data.
14 M. Kolokotroni et al.
Dow
nloa
ded
by [
Bru
nel U
nive
rsity
Lon
don]
at 0
8:28
28
June
201
6
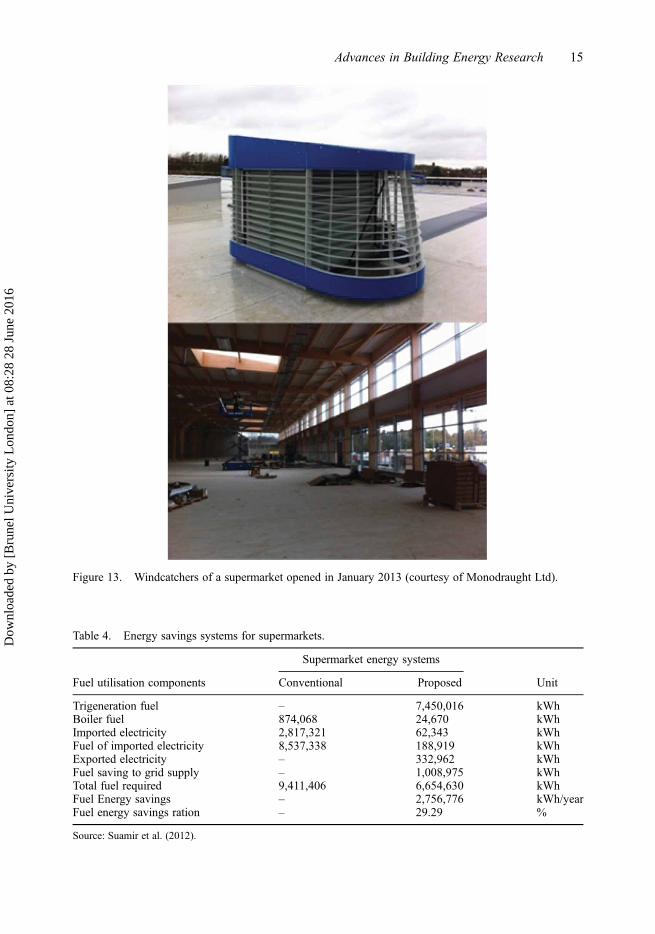
Figure 13. Windcatchers of a supermarket opened in January 2013 (courtesy of Monodraught Ltd).
Table 4. Energy savings systems for supermarkets.
Supermarket energy systems
Fuel utilisation components Conventional Proposed Unit
Trigeneration fuel – 7,450,016 kWhBoiler fuel 874,068 24,670 kWhImported electricity 2,817,321 62,343 kWhFuel of imported electricity 8,537,338 188,919 kWhExported electricity – 332,962 kWhFuel saving to grid supply – 1,008,975 kWhTotal fuel required 9,411,406 6,654,630 kWhFuel Energy savings – 2,756,776 kWh/yearFuel energy savings ration – 29.29 %
Source: Suamir et al. (2012).
Advances in Building Energy Research 15
Dow
nloa
ded
by [
Bru
nel U
nive
rsity
Lon
don]
at 0
8:28
28
June
201
6

due to overcooling of the space and higher fan power. These strategies might have good effective-ness in specific areas of a supermarket such as refrigerated warehouses for occupant comfort aswell as the general customer areas.
5. Conclusions and planned work
This paper presented the current energy use statistics of food retail buildings to demonstrate thehigh potential for the application of energy-efficient technologies in the design of these buildings
Figure 14. Energyflowdiagramof a case-study supermarketwith conventional and proposed energy system.Source: Suamir and Tassou (2013).
16 M. Kolokotroni et al.
Dow
nloa
ded
by [
Bru
nel U
nive
rsity
Lon
don]
at 0
8:28
28
June
201
6
and their HVAC equipment. It focussed on UK examples of latest ‘low carbon’ supermarkets andshowed that there is potential for significant energy savings with attractive financial return. It out-lined the current development in refrigeration systems and their integration with the energy man-agement of the building for potential savings in the provision of environmental conditions.
Future work will target the goal of zero or near-zero emission stores whilst improving serviceand shopper experience. Investigations will involve future concept store design and buildingenvelope for both small urban and out-of-town hypermarkets, to improve thermal performanceand allow optimum integration of renewable energy and natural technologies (such as natural
Figure 15. Diagram of the PCM DV diffuser, ducts and CSM plate arrangement inside the diffuser.Source: Gowreesunker, Tassou, and Kolokotroni (2013).
Figure 16. Comparison of energy demand of alternative controls for the PCM system and the full venti-lation system in comparison to the DV system.
Advances in Building Energy Research 17
Dow
nloa
ded
by [
Bru
nel U
nive
rsity
Lon
don]
at 0
8:28
28
June
201
6
ventilation, day-lighting, and thermal storage using PCMs) with the HVAC equipment and theiroptimum integration within the constraints and objectives to provide flexibility and lowerenvironmental impacts. Shopper surveys will be carried out to assess and improve their shoppingexperiences, whilst reducing their carbon footprints.
AcknowledgementsThis work is carried out as part of the RCUK Centre for Sustainable Energy Use in Food Chains (EP/K011820/1) project. Thanks are due to Adonis Charalambous who carried out the simulations reported inFigures 8, 9, 11, and 12 as part of his Masters Dissertation.
ReferencesATTMA. (2010). Technical standard L2. measuring air permeability of building envelopes (non-dwellings),
October 2010. Retrieved January 2, 2014, from http://www.attma.org/downloads/British Retail Consortium. (2014). A better retailing climate: Driving resource efficiency. Retrieved February
6, 2014, from http://www.brc.org.uk/brc_show_document.asp?id=4434&moid=8074Campbell, A., & Riley, O. (2009). Building services for low carbon supermarkets. Proc. IOR, vol. 106,
Carshalton, Surrey, UK. Retrieved from http://www.ior.org.uk/Canning, P., Charles, A., Huang, S., Polenske, K.R., &Waters, A. (2010). Energy use in the U.S. food system
(Economic Research Report Number 94). United States Department of Agriculture, Economic ResearchService.
Carbon Trust. (2010). Refrigeration road map, CTG021, 56 p. Retrieved from www.carbontrust.co.uk.Charalambous, A. (2013). Energy performance of supermarket buildings in the UK based on climate change
predictions (MSc thesis). Brunel University, Uxbridge, UK.CIBSE. (2012). Guide F: Energy efficiency in buildings. London: CIBSE. Retrieved from http://www.cibse.
org/DECC. (2013). Energy consumption in the UK, Chapter 5: Services Sector Energy consumption. Retrieved
from https://www.gov.uk/government/organisations/department-of-energy-climate-change/series/energy-consumption-in-the-uk
Defra. (2006). Economic note on UK grocery retailing, food and drink Economics branch. Retrieved January2, 2014, from http://archive.defra.gov.uk/evidence/economics/foodfarm/reports/documents/Groceries%20paper%20May%202006.pdf
Defra. (2012). Food statistics pocketbook. Retrieved January 2, 2014, from http://www.defra.gov.uk/statistics/foodfarm/food/
Directive 2010/31/UE. (2010). Retrieved February 12, 2014, from http://eur-lex.europa.eu/LexUriServ/LexUriServ.do?uri=OJ:L:2010:153:0013:0035:EN:PDF
Eurostat. (2011). Food: From farm to fork statistics. Retrieved January 2, 2014, from http://epp.eurostat.ec.europa.eu/cache/ITY_OFFPUB/KS-32-11-743/EN/KS-32-11-743-EN.PDF
Eurostat. (2012). Energy, transport and environment indicators. Retrieved January 2, 2014, from http://epp.eurostat.ec.europa.eu/portal/page/portal/product_details/publication?p_product_code=KS-DK-12-001
Garnett, T. (2011). Where are the best opportunities for reducing greenhouse gas emissions in the foodsystem (including the food chain)? Food Policy, 36, S23–S32.
Ge, Y. T., & Tassou, S. A. (2011). Performance evaluation and optimal design of supermarket refrigerationsystems with supermarket module ‘supersim’, Part I: Model Description and Validation. InternationalJournal of Refrigeration, 34, 540–549.
Ge, Y. T., & Tassou, S. A. (2013, April 1–3). Control strategies to maximise heat recovery form CO2refrigeration systems in supermarket applications in the UK. 2nd IIR International Conference onSustainable and the Cold Chain, Paris, France.
Ge, Y. T., Tassou, S. A., & Suamir, N. (2013). Prediction and analysis of the seasonal performance of tri-generation and CO2 refrigeration systems in supermarkets. Applied Energy, 112, 898–906.
Gowreesunker, B. L., Tassou, S. A., & Kolokotroni, M. (2013). Coupled TRNSYS-CFD simulations eval-uating the performance of PCM plate heat exchangers in an airport terminal building displacement con-ditioning system. Building and Environment, 65, 132–145.
18 M. Kolokotroni et al.
Dow
nloa
ded
by [
Bru
nel U
nive
rsity
Lon
don]
at 0
8:28
28
June
201
6

Hill, F., Courtney, R., & Levermore, G. (2010). Towards a zero energy store – a scoping study (ZEST).Manchester: University of Manchester. Retrieved from wwww.sci.manchester.ac.uk/uploads/zestfinalreport.pdf
IEA. (2008). Worldwide trends in energy use and efficiency key insights from IEA Indicator Analysis. IEA.Retrieved April 2, 2014 from https://www.iea.org/publications/freepublications/publication/Indicators_2008.pdf
IEA. (2011). International Energy Outlook 2011. Retrieved June 15, 2013, from http://www.eia.gov/forecasts/ieo/pdf/0484(2011).pdf
IGD. (2013). UK grocery retailing. Retrieved January 2, 2014, from http://www.igd.com/our-expertise/Retail/retail-outlook/3371/UK-Grocery-Retailing/#2
Lillywhite, R., Sarrouy, C., Davidson, J., May, D., & Plackett, C. (2013). Energy dependency and food chainsecurity DEFRA (FO0415). Retrieved February 6, 2014, from http://randd.defra.gov.uk/Default.aspx?Menu=Menu&Module=More&Location=None&Completed=0&ProjectID=16433
Martinez-Palou, A., & Rohner-Thielen, E. (2011). From farm to fork – a statistical journey along the EU’sfood chain. Eurostat: Statistics in focus. Retrieved February 6, 2014, from http://epp.eurostat.ec.europa.eu/cache/ITY_OFFPUB/KS-SF-11-027/EN/KS-SF-11-027-EN.PDF
Mavromatidis, G., Acha, S., & Shah, N. (2013). Diagnostic tools of energy performance for supermarketsusing Artificial Neural Network algorithms. Energy and Buildings, 62, 304–314.
Met Office, UK. (2013). UK climate projections. Retrieved January 2, 2014, from http://ukclimateprojections.metoffice.gov.uk/21678
Part, L. (2013). Building Regulations Part L2A Conservation of Fuel and Power in new buildings other thandwellings. Retrieved January 2, 2014, from http://www.planningportal.gov.uk/buildingregulations/approveddocuments/partl/approved
Pérez-Lombard, L., Ortiz, J., & Pout, C. (2008). A review on buildings energy consumption information.Energy and Buildings, 40, 394–398.
Pimentel, D., Williamson, S., Alexander, C. E., Gonzalez-Pagan, O., Kontak, C., & Mulkey, S. E. (2008).Reducing energy inputs in the US food system. Human Ecology, 36, 459–471.
Prometheous project. (2010). Univeristy of Exeter, centre for energy and the environment. Retrieved fromhttp://emps.exeter.ac.uk/research/energy-environment/cee/projects/prometheus/
Seck, G. S., Guerassimoff, G., & Maizi, N. (2013). Heat recovery with heat pumps in non-energy intensiveindustry: A detailed bottom-up model analysis in the French food & drink industry. Applied Energy, 111,489–504.
Spyrou, M. S., Shanks, K., Cook, M. J., Pitcher, J., & Lee, R. (2014). An empirical study of electricity andgas demand drivers in large food retail buildings of a national organisation. Energy and Buildings, 68,172–182.
Stanford, J. (2010). Reducing energy consumption and GHG emissions in the food supply chain. FoodProcessing Farada. Interim Report, 40 pgs, Project No. 1125, UK.
Suamir, I. N., & Tassou, S. A. (2013). Performance evaluation of integrated trigeneration and CO2 refriger-ation systems. Applied Thermal Engineering, 50, 1487–1495.
Suamir, I. N., Tassou, S. A., &Marriot, D. (2012). Integration of CO2 refrigeration and trigeneration systemsfor energy and GHG emission savings in supermarkets. International Journal of Refrigeration, 23, 407–417.
Sullivan, R., & Gouldson, A. (2013). Ten years of corporate action on climate change: What do we have toshow for it? Energy Policy, 60, 733–740.
Target Zero. (2011).Guidance on the design and construction of sustainable, low carbon supermarket build-ings. Retrieved January 2, 2014, from http://www.steelconstruction.info/index.php?title=Special:ImagePage&t=Supermarket+guidance+doc+v2.pdf
Tassou, S. A., Ge, Y. T., Hadawey, A., & Marriott, D. (2011). Energy consumption and conservation in foodretailing. Applied Thermal Engineering, 31, 147–156.
Advances in Building Energy Research 19
Dow
nloa
ded
by [
Bru
nel U
nive
rsity
Lon
don]
at 0
8:28
28
June
201
6