energy and protein nutrition of ewes in late pregnancy
TRANSCRIPT

MS – thesis
Energy and protein nutrition of ewes in late pregnancy
Effect on ewe feed intake, live weight, body condition and plasma metabolites, lamb birth
weight and growth rate
Hallfríður Ósk Ólafsdóttir
Department of Land and Animal Resources
Apríl 2012
MS – thesis April 2012
Energy and protein nutrition of ewes in late pregnancy
Effect on ewe feed intake, live weight, body condition and plasma metabolites, lamb birth weight and growth rate
Hallfríður Ósk Ólafsdóttir
Academic supervisors: Jóhannes Sveinbjörnsson and Grétar Hrafn Harðarson
Agriculturarl University of Iceland
Department of Land and Animal Resources


1
Clarification of contribution
I hereby declare that the experiment this work is based on as well as statistical analysis
and writing of the thesis and the two manuscripts is my work under the supervision and
assistance of my advisors Jóhannes Sveinbjörnsson and Grétar Hrafn Harðarson.
The experiment took place at the Icelandic Agricultural University’s experimental farm,
Hestur, in the spring 2008. Daily management during the experimental period was in my
hands with the assistance of the staff at the farm when needed. Postpartum the staff took
over daily management. Feed and refusal sampling as well as dry matter analysis was
performed by me but chemical analysis took place at the laboratory of the Icelandic
Agricultural University under the supervision of Tryggvi Eiríksson. Weighing and
condition scoring of ewes as well as weighing and ultrasound scanning of lambs was
performed by the staff at Hestur. Blood samples were collected by the veterinarians
Grétar Hrafn Harðarson and Gunnar Gauti Gunnarsson with my assistance. I prepared the
samples for the analysis that was performed in the laboratory of Aarhus University at
Foulum, Denmark under the supervision of Torben Larsen .
--------------------------------------- ------------------------------------
Date and place Hallfríður Ósk Ólafsdóttir

II
Acknowledgements
I would like to thank the staff at the experimental farm Hestur spring 2008, Eyjólfur Kristinn
Örnólfsson, Sigvaldi Jónsson and Björg María Þórsdóttir for assistance during the
experimental setup and daily management. Furthermore, the staff at the Icelandic Agricultural
University’s laboratory in Hvanneyri that advised me and assisted regarding dry matter
analysis and preparations of feed samples, Tryggvi Eiríksson who took care of chemical
analysis of feed and Torben Larsen who was in charge of analysing plasma concentration of
metabolites at the Aarhus University all deserve my gratitude.
My advisors, Jóhannes Sveinbjörnsson and Grétar Hrafn Harðarson have been of great support
and guidance from the first day of my work. For their patience and understanding during the
planning and performing of the experiment as well as all the time it took me to analyse the
data and write the thesis I am sincerely grateful.
I also want to present my gratitude for the financial support I received from the presidium of
farmproduct agreement (framkvæmdanefnd búvörusamninga), the Agricultural productivity
fund and fund of Blikastaðir.
All those good friends that have encouraged me deserve my thanks and last but not least I
want to thank my parents and sisters that have encouraged and supported me in any way
possible during all those years of study. Without them I probably would not have started my
further education and I certainly would not have finished!

III
Abstract
Feeding of the pregnant ewe affects its weight and condition and subsequently the ability to
supply the lambs with adequate nutrition. Supplementing is commonly used to secure
adequate birth weight and growth rate but for efficient use the condition of the ewes as well as
total composition of the diet has to be considered thoroughly. In the experiment described here
the effect of feeding different concentrates during the last month prepartum on ewe and lambs
health and performance were tested on 48 ewes and their progenies. Ewes were assigned to
four treatments, each containing equal numbers of single- twin- and triplet bearing ewes. All
lambs were reared as twins. Three of the treatment groups (MIX, EN and PRO) were fed,
along with ad libitum haylage, increasing levels of supplements differing in protein type and
content while the fourth group was control group (CTR) and only fed haylage. Ewes were
weighed and scored for BCS before and after the experimental period, haylage intake recorded
daily and blood samples collected weekly for metabolite analysis. Lambs were weighed at
birth, seven days old, approximately seven weeks old and at last at weaning. Supplemented
ewes ate significantly less haylage than CTR ewes. Though treatment did not affect weight,
BCS nor weight and BCS changes, CTR ewes gained significantly less weight than the PRO
ewes and the MIX group ewes had significantly higher BCS in April than other. Single
bearing ewes gained less weight and were lighter at parturition than other while triplet bearing
ewes had the lowest BCS and lost condition in all supplemented treatments. Treatment
affected glucose, BHB, urea, uric acid, AST, ICDH and calcium level significantly, BHB and
urea level increased with higher levels of undegradable protein. Glucose, urea, uric acid and
ICDH levels were affected by litter size, single bearing ewes having the lowest levels of ICDH
and uric acid but the highest levels of glucose and urea. No significant difference was found
for birth weight between treatments. The first weeks postpartum lambs reared by CTR ewes
had significantly lower growth rate than others but this difference ceased with increasing age.
Type of supplements did not affect growth rate significantly and live weight at weaning did
not differ significantly between treatments. Lambs reared by ewes that had given birth to twins
had significantly higher growth rate the first week postpartum but the difference then ceased
and was not found after seven weeks of age.
Keywords: Birth weight, DM intake, late-pregnancy, nutrition, plasma metabolites, protein sheep

IV
Yfirlit
Fóðrun áa á síðasta hluta meðgöngu er mikilvæg fyrir afkomu sauðfjárbúa þar sem hún getur
haft áhrif á þunga, holdastig og heilsufar ánna og þar með á hversu vel þær ráða við að veita
lömbum þá næringu sem þau þurfa. Í tilrauninni sem hér er lýst voru skoðuð áhrif af fóðrun
með mismunandi kjarnfóðurtegundum síðasta mánuð meðgöngu á heilsufar og afurðir áa og
lamba þeirra. Tilraunaánum 48 var skipt í fjóra meðferðarhópa sem hver innihélt jafnan fjölda
einlemba, tvílemba og þrílemba. Þremur hópanna (MIX, EN, PRO) var gefið, til viðbótar við
hey eftir átlyst, vaxandi skammtar af kjarnfóðri sem innihélt mismunandi magn og gerð af
próteini. Fjórði hópurinn (CTR) var samanburðarhópur, eingöngu fóðraður á heyi eftir átlyst.
Ærnar voru vigtaðar og holdastigaðar í upphafi og enda tilraunar, heyát var mælt og blóðsýni
tekin vikulega til mælinga á efnaskiptaafurðum. Lömbin voru vigtuð innan sólarhrings frá
burði, aftur viku gömul, u.þ.b. sjö vikna gömul og loks fyrir slátrun. Ærnar í
kjarnfóðurhópunum átu marktækt minna hey en CTR ærnar. Þó meðferð hefði ekki marktæk
áhrif á þunga, holdastig né breytingar á þessum þáttum frá upphafi til enda tilraunar bættu ær í
CTR hópnum marktækt minna við sig í þunga en PRO ærnar og MIX ærnar stiguðust
marktækt hærra í holdum en aðrar í lok tilraunar. Einlembur þyngdust minna og voru léttari
við burð en tvílembur og þrílembur en þær síðast nefndu höfðu lægst holdastig við burð og
töpuðu holdum í öllum kjarnfóðurhópunum. Tilraunameðferð hafði marktæk áhrif á styrk
glúkósa, BHB, úrefnis, þvagsýru, AST, ICDH og kalks í blóði. Styrkur BHB og úrefnis í blóði
jókst með auknu magni af torleystu próteini í kjarnfóðri. Styrkur glúkósa, úrefnis, þvagsýru og
ICDH var einnig háður fjölda fóstra og höfðu einlembur lægstan styrk ICDH og þvagsýru en
hæstan af glúkósa og úrefni. Ekki var marktækur munur á fæðingarþunga lambanna eftir
meðferð mæðra. Fyrstu vikurnar þyngdust lömb sem gengu undir CTR ánum marktækt minna
en önnur en þessi munur minnkaði með tímanum. Ekki var marktækur munur á vaxtarhraða
lamba eftir því hvaða kjarnfóður ærnar sem þau gengu undir fengu fyrir burð og meðferð ánna
hafði ekki marktæk áhrif á lífþunga lamba að hausti. Lömb sem gengu undir tvílembdum ám
uxu marktækt hraðar fyrstu vikuna eftir burð en þessi munur dvínaði svo og sást ekki eftir sjö
vikna aldur.
Lykilorð: Átgeta, efnaskiptaafurðir, fóðrun, fæðingarþungi, meðganga, prótein, sauðfé,

V
Table of contents
Clarification of contribution ........................................................................................................ 1 Acknowledgements .................................................................................................................... II Abstract ...................................................................................................................................... III Yfirlit .........................................................................................................................................IV Table of contents ........................................................................................................................ V List of tables ............................................................................................................................ VII List of figures ......................................................................................................................... VIII 1. Introduction ............................................................................................................................. 1
1.1. Late pregnancy nutrition ................................................................................................... 1 1.2. Energy nutrition ................................................................................................................ 2 1.3. Protein nutrition ................................................................................................................ 3 1.4. Weight and body condition .............................................................................................. 6 1.5. Eating capacity ................................................................................................................. 7 1.6. Blood parameters .............................................................................................................. 8 1.7. Lamb birth weight .......................................................................................................... 12 1.8. Lamb growth rate............................................................................................................ 15
2. Aims ...................................................................................................................................... 18 3. Materials and methods ........................................................................................................... 19
3.1. Experimental animals, housing and feeding ................................................................... 19 3.2. Measurements and data sampling ................................................................................... 22 3.3. Chemical analysis ........................................................................................................... 23 3.4. Statistical analysis .......................................................................................................... 24
4. Results ................................................................................................................................... 26 4.1. Feed intake ...................................................................................................................... 26 4.2. Ewe weight and body condition ..................................................................................... 28 4.3. Blood metabolites ........................................................................................................... 29 4.4. Lamb birth weight .......................................................................................................... 35 4.5. Lamb growth rate............................................................................................................ 36
5. Discussion .............................................................................................................................. 37 5.1. Dry matter, energy and protein intake ............................................................................ 37 5.2. Ewe weight and body condition ..................................................................................... 38 5.3. Concentration of blood metabolites ................................................................................ 40 5.4. Lamb birth weight .......................................................................................................... 45 5.5. Lamb growth rate............................................................................................................ 46
6. Conclusion ............................................................................................................................. 48 Appendix ................................................................................................................................... 51 References ................................................................................................................................. 52
Manuscript I submitted to Icelandic Agricultural Science: Energy and protein in the diet of
ewes in late pregnancy: Effect on ewe feed intake, life weight, body condition and
concentration of plasma metabolites. By Hallfríður Ósk Ólafsdóttir, Jóhannes Sveinbjörnsson
and Grétar Hrafn Harðarson

VI
Manuscript II submitted to Icelandic Agricultural Sciences: Energy and protein in the diet of
ewes in late pregnancy: Effect on lamb birth weight and growth rate. By Hallfríður Ósk
Ólafsdóttir, Jóhannes Sveinbjörnsson and Grétar Hrafn Harðarson

VII
List of tables
Table 1. Weight, body condition score, age and index for mothering ability of experimental
ewes……………………………………………………………………………………………19
Table 2. Dry matter content and chemical composition of the feed ………………………….20
Table 3. Daily ration of supplements (g DM ewe-1 day-1) at each time ………………………21

VIII
List of figures
Figure 1. Haylage intake from beginning of experiment until parturition of the first ewe .......26
Figure 2. Changes in total energy intake (FEm day-1 ewe-1) from beginning of experiment until
parturition of the first ewe .........................................................................................................27
Figure 3. Changes in total protein intake (gAAT day-1 ewe-1) from beginning of experiment
until parturition of the first ewe ................................................................................................27
Figure 4. Changes in ewe weight from end of march until parturition of the first ewe in end of
april ...........................................................................................................................................28
Figure 5. Changes in BCS from end of March until parturition of the first ewe in end of
April...........................................................................................................................................29
Figure 6. Plasma glucose level from five weeks prepartum to one week postpartum ..............30
Figure 7. Plasma NEFA level from five weeks prepartum to one week postpartum ................31
Figure 8. Plasma BHB level from five weeks prepartum to one week postpartum ...............31
Figure 9. Plasma Urea level from five weeks prepartum to one week postpartum ..................32
Figure 10. Plasma uric acid level from five weeks prepartum to one week postpartum ..........33
Figure 11. Plasma calcium level from five weeks prepartum to one week postpartum ...........34
Figure 12. Average birth weight of lambs among treatments and litter sizes ...........................35
Figure 13. Lamb growth rate in different periods .....................................................................36

1
1. Introduction
The main goal of sheep husbandry for meat production is to wean, within reasonable amount
of time, healthy lambs that have been able to fill their inherent capacity for growth and
development from ewes that are healthy and in acceptable condition to start their next
production cycle. The transition time, i.e. the late gestational period that is characterized by
rapid foetal growth and preparation of the mammary gland and the first days postpartum when
growth potential of the lamb is highest is extremely important in order to achieve that goal.
Many studies have been performed during the last decades to investigate the metabolic
changes and adaptations occurring in that period in order to supply farmers with information
regarding effective feeding of the pregnant and lactating ewe with respect to different
environment and economical circumstances.
1.1. Late pregnancy nutrition
Since 80% of the foetal growth takes place in the last trimester of the pregnancy (Robinson,
1983, Robinson et al., 1999) nutritional requirements of the ewe increase to a great extent
during this period. During the last six weeks of pregnancy energy requirements of twin
bearing ewe are raised by more than 80 % (Sveinbjörnsson & Ólafsson, 1999) and protein
requirements by 100% (Ólafsson, 1995). At the same time, pregnancy can reduce eating
capacity but increase passage rate through the digestive tract (Gonzalez et al., 1985). Those
combined changes in late pregnancy all make it difficult to fill energy requirements of the
pregnant and lactating ewe without using significant amounts of concentrates along with high
quality roughage (Robinson, 1983).
Nutrition of the pregnant ewe affects the growth of the foetus. Both directly by providing
glucose, amino acids and other chemical elements necessary for development and indirectly
by influencing the endocrine mechanisms that control the uptake and partitioning of nutrients
to the gravid uterus and foetus (Robinson et al., 1999). The nutrition of ewes in this critical
prepartum period not only affects the growth of the developing foetus, but also the ability of
the ewe to supply the lamb with adequate amount of colostrum and milk postpartum
(Robinson, 1983, Treacher, 1983).

2
1.2. Energy nutrition
Substantial part of carbohydrate digestion in the ruminant occurs in the rumen where dietary
carbohydrates are fermented by the rumen microbes. Part of the fermentation products are
absorbed and to some extent metabolized in the rumen epithelium, such as the volatile fatty
acids (VFA; propionate, acetate and butyrate). Remaining products from the ruminal
fermentation are transported with digesta flow to the small intestines where they are, along
with the microbes themselves, digested and absorbed. Concentration and proportion of the
fermentation products is highly influenced by the diet offered to the animal. As an example of
this, higher proportion of straw in the diet results in increased acetate production while
increased starch, such as with barley feeding results in elevated level of propionate. Butyrate
on the other hand is mainly raised when feeding of highly soluble sugars is increased (Oldham
et al., 1977).
The main energetic substrates for foetal development and colostrum/milk production are
glucose and amino acids (Banchero et al., 2006, Ingvartsen, 2006). There is only small amount
of glucose absorbed from the rumen and therefore glucose requiring tissues rely on
gluconeogenesis, mainly in the liver (Annison et al., 2002). Of the fermentation products
mentioned above, propionate is the main precursor for gluconeogenesis. Therefore,
supplementing ewes with high starch diet such as maize and barley can result in increased
foetal weight and colostrum production (Banchero et al., 2007). The use of highly fermentable
concentrates (rich in starch) to supply the pregnant or lactating ewe with adequate
metabolizable energy (ME) has its limitations. It can induce some metabolic disorders such as
rumen acidosis (Imamidoost & Cant, 2005) and reduce degradability of other nutrients fed to
the animal due to alterations of the microbial fauna. The severity of these effects depend on
the type of concentrates as well as the roughage quality, particularly with regard to fibre type
and content (Kaur et al., 2008). Because of that, rapidly fermentable concentrates have to be
used systematically, aiming at maximizing their benefit in the ruminant diet while minimizing
the disadvantages they can cause (Imamidoost & Cant, 2005). According to Kaur et al. (2008)
concentrates can be fed up to a 35% level without affecting fibre digestion and supplementing
above that level does not necessarily affect fibre digestion. Fibre type and frequency of
feeding are among other factors that have effect in this respect and in fact Kaur et al. (2008)
3
supplemented up to 45% concentrates without detecting negative effect on rumen pH.
Subsequently they concluded that significant negative effect found for dry matter (DM) and
fibre digestibility were merely due to type and amount of fibre in the diet than the concentrate
level itself.
Effects of different energy levels in late pregnancy differ to some extent between studies.
Possible reasons are differences in the genotype of the experimental ewes, their body reserves
and overall composition of diet such as combination of energy and protein and concentration
of ME (Robinson & McDonald, 1989, Thorsteinsson & Thorgeirsson, 1989).
Carbohydrates from the diet are not the only gluconeogenic precursors. Dietary protein is also
to some extent used for glucose production. Furthermore, energetic efficiency is reduced when
dietary protein is inadequate (Thorsteinsson et al., 1993) and, as described below, importance
of microbial protein for the ewe makes carbohydrate digestion not only important in regard to
energy supply but also protein. Therefore, neither energy- nor protein nutrition can be
discussed in details without consideration of each other.
1.3. Protein nutrition
Protein available for absorption in the ruminating animal can be divided into two main types.
One is the microbial protein, which is the protein derived from activity of the microbial
population in rumen that hydrolyses dietary protein into smaller units of peptides, amino acids,
organic acids, ammonia and carbon dioxide. These molecules are then reused for production
of microbial cells, ammonia being the key intermediate in this process. Insufficient dietary
protein supply as well as high level of rumen undegradable protein therefore reduces ammonia
concentration in the rumen, hence the growth of the microbial population and subsequently
carbohydrate digestion is reduced. Excessive rumen degradable protein along with deficiency
of the fermentable organic matter needed to sustain microbial growth however raises ammonia
level in the rumen which causes ammonia to be absorbed into the blood and converted to urea
in the liver. Even though some of the urea is conserved and reused by returning it to the rumen
substantial part of it is excreted from the body and therefore wasted. Because of this activity
described above the quantity of protein reaching the small intestines can be greater than the

4
quantity available directly from the food. The microbes are digested and absorbed in the small
intestines, as does the other main protein type – the undegradable protein. Undegradable
protein is the protein content that escapes the rumen undigested and is not utilized in any way
until in the small intestines. A well known source of undegradable protein is fish meal and
other products derived from animals as well as some specially treated plant proteins
(McDonald et al., 2002).
Since the major protein supply in ruminants is microbial protein, the effect of different levels
of nutritional protein is highly related to carbohydrate intake (Annison et al., 2002) as well as
digestibility and fermentation rate of the carbohydrates. As an example, immature forages that
are very rapidly fermented can yield twice as much microbial protein as diet containing high
level of nutrients that are slowly fermented in the rumen (McDonald et al., 2002). Therefore,
energy undernutrition is likely to cause deficiency in protein availability, defined as amino
acid supply in small intestines (AAT) unless diet is supplemented with undegradable protein
(O´Doherty & Crosby, 1997). It also has to be taken into consideration that even though
energy intake is adequate for sufficient total production of microbial protein, supply of certain
essential amino acids may not be enough in relation to the needs of the foetus (Robinson et al.,
1999). Increased passage rate through the rumen that can be achieved with alterations in diet
composition or due to changes in physiological factors – such as pregnancy- results in elevated
level of protein available in the small intestines (Robinson et al., 1999). This is the
consequence of a higher level of dietary protein escaping the rumen undegraded (Gonzalez et
al., 1985) as well as raised production of microbial protein due to faster fermentation of
carbohydrates (Oldham et al., 1977).
Undegradable protein has for the last decades been considered one of the most important
factors in nutrition of the pregnant and lactating ewe (Robinson & McDonald, 1989).
The use of the undegradable protein is generally thought to make it easier for the ewe to use
energy from her body reserves for foetal growth and preparation of lactation (Frutos et al.,
1998, McNeill et al., 1997, Thorsteinsson et al., 1993). This statement is in agreement with
O´Doherty and Crosby (1998) who showed the gap between ME requirements and available

5
ME from maternal reserves and diet to decrease with elevated level of undegradable protein in
the supplements.
It is quite clear that the efficiency of protein supplementing differs to some extent between
studies and the outcome is affected by several factors. This can for example be seen in Bell et
al. (2000) that reviewed several studies regarding the effect of protein supplement on dairy
cows. One of their findings was that positive response to dietary protein on milk yield was
strongest when control diet was particularly low in total protein content and/or level of
undegradable protein. Furthermore, Robinson & McDonald (1989) and later on Dawson et al.
(1999) found strongest effect of undegradable protein when energy content of the diet was
limited, probably as a result of amino acids from the degradable dietary protein in those cases
being used for gluconeogenesis instead of being portioned to the growing foetus and
mammary tissues (Robinson et al., 1999). That makes it necessary to adjust protein
supplementing to energy content of the feed as well as the body condition of the ewe, the latter
also being known to affect the efficiency of protein supplements (Dawson et al., 1999).
Many studies have shown positive effects of undegradable protein supplements in late
pregnancy on udder development and colostrum production (Nottle et al., 1998, O´Doherty &
Crosby, 1997, Robinson & McDonald, 1989) as well as the lambs ability to absorb
immunoglobulin from the colostrum the first hours postpartum (O´Doherty & Crosby, 1997).
According to Bell et al. (2000) the length of experimental treatment seems to be important
factor regarding the effect of protein supplementing on milk yield and protein content of milk
in dairy cows. Furthermore, positive effect of prepartum protein supplementing mainly appear
when lactation diet is low in protein content. Therefore, Bell et al (2000) suggested that high
feeding level postpartum could conceal the effect of prepartum nutrition.
Among other benefits, some sources of undegradable protein, such as fish-meal, have
especially high concentration of certain essential amino acids. Example of this is cystine that
is important in the formation of the lambs birth coat which is one part of the foetus known to
be negatively affected by undernutrition (Black, 1983, Robinson et al., 1999). When
discussing protein supplementation of ruminants it has to be taken into account that, especially

6
in lactation, some of the amino acids available from feed are used for gluconeogenesis when
energy is not adequate. That possibly reduces the effect of protein supplements on protein
demanding processes since part of it is used for energy production (O´Doherty & Crosby,
1997).
1.4. Weight and body condition
Using live weight and weight change as an indicator of adequacy of the ewe’s nutrition in late
pregnancy has its limits, unless the number of foetuses is known and ewes can be compared
only with ewes carrying the same litter size (Russel, 1984). It has been suggested that some
assessment of body condition is better indicator than live weight on the fatness of the animal
(Frutos et al., 1998, Russel, 1984). Body condition scoring (BCS) can be used independently
of litter size (Russel, 1984).
The body fat of the ewe is an important source of energy in late pregnancy and early lactation.
Ruminants have excellent ability to mobilize fat and protein from their body reserves during
undernutrition (Chilliard et al., 2000) and negative energy balance at parturition is in fact quite
normal condition (Ingvartsen, 2006). Up to 80% of initial body fat, can be mobilized when
needed (Chilliard et al., 2000) and research by Wilson et al. 1988, (cited by Bell et al., 2000)
showed up to 34% of casein and 24% of lactose to be derived from body tissue protein.
McNeill et al (1997) and Frutos et al. (1998) found up to 7% and 6% respectively of carcass
protein to be mobilized the last 30 days of pregnancy, but McNeill (1997) stated that carcass
protein was the most important reserve for mobilization of carcass nitrogen. However, it has to
be kept in mind that extensive protein deficiency and subsequent mobilization can be
detrimental for some parts of normal protein metabolism in the body such as sustaining of the
bone matrix and cause bone erosion (Frutos et al., 1998, Robinson et al., 1999). Thorsteinsson
and Thorgeirsson (1989) concluded that it is safe to expect twin bearing ewe to give birth to
lambs of sufficient weight even when fed 30% below feeding standards in the last month of
pregnancy. However, it has to be clear that the validity of those statements depend on the
severity of the undernutrition, the duration of feed restriction as well as the initial body fatness
of the ewe. The ewe must be in excellent body condition as a result of previous feeding if
feeding strategy like this is to be successive (Chilliard et al., 2000, Thorsteinsson &

7
Thorgeirsson, 1989). Mobilization of body tissues for energy and protein supplying is a
process of high energetic cost and furthermore, use of amino acids as energy source is not very
efficient. Therefore use of maternal body protein reserves is not a very profitable way for
energy utilization. (Thorsteinsson et al., 1993).
Based on this knowledge BCS can be considered a useful estimator of mobilization of energy
within the pregnant ewe (Frutos et al., 1998, Russel, 1984) and ewe live weight and BCS
together can serve as an estimator of the sufficiency of nutrition in the last weeks prepartum.
Russel (1984) stated that under adequate feeding level live weight gain higher than the weight
loss from maternal tissues indicates acceptable late pregnancy feeding. Furthermore, as a
general rule, 10% and 18% increase in weight of single and twin bearing ewes respectively, as
well as 0,5 BCS unit loss would be sign of sufficient nutrition the last eight weeks prepartum.
Both ewe weight and BCS can be affected by supplementation of the ewe in late pregnancy
(Frutos et al., 1998, McNeill et al., 1997, Ocak et al., 2005). Ewes that were only fed hay lost
more condition than those supplemented during the last seven weeks prepartum in a “whole
winter feeding trial” at Hestur experimental farm 1983-1986. Supplement type however
neither affected BCS at parturition nor BCS changes the last seven weeks of gestation
(Thorsteinsson & Thorgeirsson, 1989). Restrictively fed ewes loose weight earlier than body
condition (Nørgaard et al., 2008). When acquiring the optimal BCS it has to be kept in mind
that body fatness of the ewe can affect feed intake negatively, for example through changes in
the efficiency of energy utilization (Tolkamp et al., 2007) and reduced space available for
expansion of the digestive tract with increased fat depots in the abdomen (McDonald et al.
2002).
1.5. Eating capacity
Food quality, for example with regard to fibre content and, for silage, concentrations of
fermentary products, is known to affect roughage intake (Roy et al., 1999). Quality of hay is
an extremely important factor regarding feed intake (Annett et al., 2008, Thorsteinsson &
Thorgeirsson, 1989). Example of this could be seen in a three year (1983-1986) experiment in
Hestur experimental farm where difference in hay quality between year resulted in bigger ewe
8
BCS and lamb birth weight differences between years than between treatments within each
year (Thorsteinsson & Thorgeirsson, 1989). Decreased intake with lower energy content of
diet has, among other factors, been related to negative effect on VFA uptake in rumen
epithelium. As a result VFA can accumulate in the rumen and cause decrease in rumen pH as
reviewed by Ingvartsen (2006). Furthermore, low energy diet often has high content of
undegradable fibre which reduces rumen passage rate and subsequently eating capacity
(Ingvartsen, 2006).
Concentrate supplementing decreases roughage intake, especially with high availability and
quality of roughage, a phenomenon known as substitution. Substitution rate is a concept often
used in this relationship and refers to how much roughage intake is reduced per unit the
supplements is increased (Dove, 2002). It is only with lower forage/hay quality the
concentrates fully act as supplementing, i.e. complete addition to the nutrients available from
roughage feeding (Dawson et al., 2005, Frutos et al., 1998, Kerslake et al., 2008) which would
result in substitution rate of zero.
Physiological factors, such as body fatness can affect feed intake to some extent (Tolkamp et
al., 2007). Eating capacity decreases as pregnancy proceeds (Orr & Treacher, 1989, Speijers et
al., 2005) and in dairy cattle pregnancy lowers eating capacity by 20-25% (Ingvartsen, 2006).
Effect of litter size on eating capacity is unclear since experimental results are rather
inconsistent. Some experiments show no effect of litter size (Sormunen-Cristiana &
Jauhiainen, 2001) at least not with single- compared to twin-bearing ewes (Foot & Russel,
1979) while other show great reduction in intake with increased litter size (Orr & Treacher,
1989). Orr & Treacher (1989) linked their results with reduction of free space in their
abdominal cavity but the reasons for no response in the study of Sormunen-Cristiana &
Jauhiainen (2001) remain unknown. Effects of pregnancy diet on intake is not restricted to
pregnancy and early lactation since it can affect voluntary intake until at least 3 months post
weaning (Foot & Russel, 1979).
.
1.6. Blood parameters

9
During late gestation several metabolic changes and adaptations take place in the pregnant
animals body (Ingvartsen, 2006). These changes are to some extent reflected in concentrations
of certain metabolites in plasma which can provide information regarding adequacy of
nutrition at each time. The advantage of measuring blood parameters to estimate nutritional
status is that it gives more immediate information compared to ewe weight and BCS, lamb
birth weight and growth rate, the latter only presenting adequacy of nutrition on a longer term
basis (O´Doherty & Crosby, 1998, Russel, 1984).
Glucose is the main energy source for foetal growth and the undernourished ewe is able to
make several alterations to make sure that the foetal needs for glucose are fulfilled (Robinson
et al., 1999). Elevated glucose need is reflected in the fact that glucose turnover is increased
by 45% during late pregnancy and by 119% during lactation (Schlumbohm & Harmeyer,
2004). Positive relationship has been reported between energy intake and plasma glucose that
is significantly elevated in the end of pregnancy (O´Doherty & Crosby, 1998). Nevertheless,
even though gluconeogenesis is increased in liver and the use of glucose in body tissue (except
for mammary) is reduced, glucose level in plasma usually drops postpartum (Ingvartsen,
2006).
As previously discussed, ruminants have excellent ability to use energy from body reserves to
meet increasing needs in late gestation. As a result of the lipolysis in adipose tissue that occurs
when substrates for foetal growth and preparation of lactation are limited, non-esterified fatty
acids (NEFA) are released into the blood circulation (Chilliard et al., 2000) and serve as an
important source of energy. Therefore NEFA concentration in plasma can be used as an
indicator of adipose tissue mobilization. However, though its usefulness in supplying the
growing uterus and udder with energy, NEFA also serve as one of the central elements in the
development of the metabolic disorder “fatty liver” and can subsequently be a sign of
increased risk of displaced abomasum. NEFA concentration in plasma has been negatively
correlated with dry matter intake (DMI), i.e. dip in DMI of late pregnancy cows causes
elevated levels of NEFA in plasma (Ingvartsen, 2006).
10
High level of ketone bodies such as beta-hydroxy-butyrate (BHB) in plasma, along with low
to normal level of glucose can be signs of the metabolic disorder ketosis. Ketosis is developed
when the ewe unsuccessfully attempts to meet the increasing energy demands of her growing
foetus (Harmeyer & Schlumbohm, 2006) and can develop from few circumstances. One
example is energy deficiency in feed since the undernutrition stimulates lipid transfer from
body reserves (Ingvartsen, 2006) and according to Banchero, et al. (2006), Speijers et al.,
(2005) and O´Doherty & Crosby (1998) great loss of BCS in late pregnancy is reflected in
high BHB concentration in plasma. High butyrate level in diet as well as health problems that
for example cause depression in feed intake and consequently lowered glucose level are
another risk factors for ketosis (Ingvartsen, 2006). Physiological status of the animal affects
plasma BHB level which is significantly higher in late gestation and early lactation compared
to the dry period. Furthermore, twin bearing ewes in late pregnancy and lactation have
elevated BHB levels compared to single bearing ewes (Harmeyer & Schlumbohm, 2006).
Based on the factors listed above it can be suggested that BHB levels are raised as a result of
increased ketogenesis in the liver when difference between required and available ME is
increased (Ingvartsen, 2006, Russel, 1984).
In sheep, the level of ketone bodies in blood and consequently the risk of developing clinical
ketosis or pregnancy toxaemia seem to be highest in late pregnancy. That is inconsistent with
cows that are in the highest risk of pregnancy toxaemia in early lactation which is, in sheep as
well as cows, the period when the gap between required and available energy is highest and
the greatest mobilization of body reserves should occur (Harmeyer & Schlumbohm, 2006).
Specific nutrition factors are known to affect BHB level. Soy bean protein supplementation
resulted in decreased level of plasma BHB the last two weeks of pregnancy (O´Doherty &
Crosby, 1998). So did supplementing concentrates to ewes grazing fields of various sward
heights (Kerslake et al., 2008). On the other hand, ewes only fed silage have shown elevated
BHB levels even though no signs of pregnancy toxaemia or ketosis were found with lowered
energy intake (O´Doherty & Crosby, 1998). Individual difference is however substantial, some
animals showing symptoms of pregnancy toxaemia at BHB levels others can achieve without
expressing any signs of discomfort (Banchero et al., 2006).

11
Relationship between ME and BHB seems to be linear up to certain limit, afterwards BHB
increases with extra energy (O´Doherty & Crosby, 1998) indicating an optimum level of
nutrition. Despite those findings, ketosis in sheep does not seem to be as affected by level of
nutrition as in many other species (Everts & Kupier 1983, c.f. Harmeyer & Schlumbohm,
2006). Hyperketonaemia inhibits hepatic glucose production as well as glucose uptake and
utilization in peripheral tissues and as a result of that it increases negative energy balance.
Ketone bodies are not suitable as fuel for brain function and foetal growth. Therefore risk of
pregnancy toxaemia is increased prepartum since the animal cannot use the ketone bodies to
meet increasing demands of the foetus.
When amino acids in diet exceed what is needed for maintenance and production at each time,
and energy is limited, extra amino acids can be used as an energy source. Efficiency of amino
acids as an energy source is however limited and disposing of extra nitrogen requires energy
(Thorsteinsson et al., 1993). With protein being one of the most expensive nutrients, feeding
dietary protein above requirements can be considered highly unfavourable. Excess dietary
nitrogen degraded in the rumen is absorbed as ammonia which then accounts for substantial
amounts of urea produced, mainly in the liver (Annison et al., 2002). Acquiring the efficiency
of protein feeding, detection of plasma urea level can be useful since urea is the animals way
to transport excess nitrogen without risking toxic effect (Withers, 1998). Plasma urea increases
with undegradable protein supplementing but not, according to O´Doherty & Crosby (1998),
with “non protein supplements” even though they give higher total protein level. Plasma urea
reflects adequacy of protein availability (dietary and maternal protein) compared to needs
(Banchero et al., 2006). Plasma urea as well as uric acid also serves as transporters of the
nucleic acids derived from the small intestine digestion of the rumen microbes (Annison et al.,
2002).
Uric acid is derived from the breakdown of nucleic acids, especially purines, and its
concentration is commonly related to level of microbial growth in the rumen and hence
microbes digested and absorbed in the small intestines. Therefore uric acid in plasma can be
used to evaluate the amount of microbial protein available for absorption in the small
intestines (Dewhurst et al., 2000, Pulido et al., 2010).

12
Since a great portion of nutrient partitioning and utilization takes place in the liver,
concentration of some liver enzymes in plasma can indicate the level of metabolism. As an
example glutamate dehydrogenase (GLDH) and aspartate aminotransferase (AST) reflect the
rate of utilization of ammonia in the liver indicating active protein catabolism and metabolism
and gamma-glutamyl transferase (GGT) plays an important role in peptide formation
(McDonald et al., 2002, Milano et al., 2000). Isocitrate-dehydrogenase (ICDH) however takes
part in lipogenesis (Suagee et al., 2010) and is one of the most active enzymes in that matter.
Based on this, those enzymes levels can be related with fat accumulation in the liver and the
subsequent metabolic disorder fatty liver (McDonald et al., 2002, Suagee et al., 2010).
Requirements for calcium are severely extended the last days prepartum and the first days
postpartum as a result of high calcium level in colostrum and milk. With sufficient supply of
vitamin – D the ewe has good ability to mobilize calcium from her skeleton for use in lactation
but yet, calcium level of the diet at this critical time should be elevated. In that respect it has to
be kept in mind that reduced feed intake, for example caused by insufficient roughage quality,
reduces absorption of calcium from the intestines resulting in lowered level of plasma calcium
(Harmeyer & Schlumbohm, 2006). Furthermore, both roughage and supplements are of great
diversity respecting calcium supply. Fish meal and silage from dicotyledons are examples of
diet having rather high calcium level while many crops and grass species such as timothy,
which is common plant in roughage production in Iceland, are low in calcium and many other
minerals.
1.7. Lamb birth weight
Many studies have shown effect of insufficient nutrition in pregnancy on growth of the foetus
(Frutos et al., 1998, Husted et al., 2008, Husted et al., 2007, Khalaf et al., 1979, Robinson &
McDonald, 1989), the effect ranging from gradually slowing down to complete cessation of
growth with more sudden and severe undernutrition (Robinson & McDonald, 1989). Some
compensation can occur in foetal growth when nutrition is increased after short period of
undernutrition but longer periods result in the foetuses lacking the ability to return to normal
growth (Robinson & McDonald, 1989). Furthermore, late gestational undernutrition can affect

13
the lambs metabolic control postpartum, up to 19 weeks of age (Husted et al., 2007) and in
their adult lives under metabolic stress such as in late pregnancy (Husted et al., 2008).
An example of the effect of gestational undernutrition on birth weight was found in two trials
on the Icelandic experimental farm, Hestur, 1977-1982. Supplementing ewes with
concentrates fulfilling 20% and 35% of energy requirements and 15% and 30% of protein
requirements resulted in 6% and 9% increase in lamb birth weight compared with ewes that
were only fed hay (Thorsteinsson & Thorgeirsson, 1989). However, Nørgaard et al (2008) and
O´Doherty & Crosby (1997 & 1998) found no significant effect of feed restriction or
increasing ME intake on lamb birth weight, even though restricted ewes only were fed 50% of
energy requirements in the previously mentioned research and difference in ME intake was
considerable in the latter. O´Doherty & Crosby (1997) linked their results with relatively small
efficiency of dietary energy for conceptus growth.
Results regarding effect of dietary protein on lamb birth weight are not completely consistent.
Annett et al. (2008) found positive effect of undegradable protein on birth weight while both
Nørgaard et al. (2008) and O´Doherty & Crosby (1997) failed to detect such difference.
O´Doherty & Crosby (1997) suggested that low energy level could have limited the effect the
protein supplements would be expected to have. Thorsteinsson & Thorgeirsson (1989)
however linked the lack of supplementing effect on lamb birth weight to the excellent body
condition the ewes had achieved earlier in pregnancy. Ocak et al. (2005) suggested that
increased litter weight from ewes fed excess protein could be related to elevated production of
propionate compared to other volatile fatty acids (VFA). The propionate being important
source for glucose, its availability to the foetus would be higher with increased protein in diet.
Thorsteinsson & Thorgeirsson (1989) examined the effect of BCS at different times of the
year on birth weight of twin lambs and found BCS in late March to have the strongest effect.
Furthermore, birth weight increased more with improving BCS in the lower range of the scale.
For supplemented ewes increased score above the score of 3,7- 4, that gave the maximal birth
weight, resulted in reduced birth weight. Within the only hay fed ewes however, the
relationship was closer to linearity, birth weight increasing with every increase in BCS, yet
14
with slightly decreasing effect with increasing BCS. Birth weight is also affected by maternal
live weight at parturition, measured at start of lambing. (Scales et al., 1986).
High priority of foetal growth above maternal tissues can be seen where increased level of
nutrition in late gestation results in higher birth weight rather than BCS (Thorsteinsson &
Thorgeirsson, 1989) and therefore it can be stated that birth weight is influenced by some
combination of the condition of the ewe in the latter part of mid pregnancy – as defined by
previous feeding - and late pregnancy nutrition (Kerslake et al., 2008, Thorsteinsson &
Thorgeirsson, 1989). In addition to this, body condition of the ewe (along with its size and
age) also influences the growth of the foetus by taking part in the partitioning of nutrients
between the conceptus and other mammary tissues and the maternal body reserves (Robinson
et al., 1999).
Researches are in good agreement concerning the positive effect of lamb birth weight on lamb
survival, especially around parturition (Gama et al., 1991, Nottle et al., 1998, Robinson &
McDonald, 1989). Partially this is an effect of heavier lambs being more developed and fatter
at parturition, especially with regard to the amount of the brown adipose tissue that is essential
for the thermoregulation and energy supply of lambs during their first hours postpartum
(McNeill et al., 1997, Robinson et al., 1999). Bigger body surface relative to body weight in
lighter lambs compared to those heavier also increase their risk of hypothermia (Andrews &
Mercer, 1985). Moreover, heavier lambs are in less risk of trauma or death because of
respiratory- or digestive problems (Gama et al., 1991). That can to some extent be caused by
the fact that heavier lambs receive more colostrum than the lighter ones and therefore absorb
greater amount of immunoglobulin making them better prepared for infections (Khalaf et al.,
1979). Extremes in birth weight however can result in increased lamb mortality, especially due
to lambing difficulties (Gama et al., 1991). It has therefore been concluded that lamb survival
is highest at some optimal birth weight but decreases both above and below that.
In addition to the effects of ewe nutrition on birth weight found in some studies, litter size (Orr
& Treacher, 1989 & 1994, Sormunen-Cristiana & Jauhiainen, 2001, Thorsteinsson &
Thorgeirsson, 1989), sex of the lamb (Nørgaard et al., 2008) and age of the dam
15
(Thorsteinsson & Thorgeirsson, 1989, Warren & Mysterud, 1995) all affect birth weight of the
lambs although the last factor is possibly to some extent more related to ewe parity than the
age per se (Purser & Young, 1959).
1.8. Lamb growth rate
Although condition of the ewe and birth weight of the lamb are to some extent good indicators
of nutrition during pregnancy the main goal of the prepartum feeding must be to secure
sufficient rearing ability of the ewe i.e. its ability to supply enough milk to meet with the
lambs capacity to grow fast (Ocak et al., 2005).
Robinson & McDonald (1989) and Nottle et al. (1998) found that protein supplements fed to
ewes in late pregnancy increased colostrum production. Similar results were obtained from
Sormunen-Cristiana and Jauhiainen (2001) which found positive effect of elevated energy and
protein levels in late pregnancy upon growth rate of lambs during the first six weeks of their
life. Furthermore, colostrum production in restrictedly fed ewes was only half of that produced
by ad libitum fed ewes (Nørgaard et al., 2008). Banchero et al. (2006) found that feeding 70%
of requirements was insufficient to sustain optimal colostrum production. Moreover, Banchero
et al. (2007) found that supplementing restrictedly fed ewes with energy rich concentrates,
supplying extra ME but not undegradable protein resulted in increased colostrum production.
That is probably because glucose is the main precursor for lactose synthesis and subsequently
milk production and easily fermentable supplements providing high ME content as used in
Banchero et al. (2006) are likely to elevate glucose level rapidly.
Dawson et al. (1999) and Annett & Carson (2005) both failed to detect any response for
undegradable protein supplements above other supplements on colostrum output. They
suggested their results could be affected by the high quality of the forage/silage used in their
experiments while Speijers et al. (2005) and Kerslake et al. (2008) linked similar results also
with good body condition of the experimental ewes.
In addition, reduced colostrum yield with increased crude protein (CP) found by Ocak et al.
(2005) implies that that excessive dietary protein, above certain limit, can negatively affect

16
colostrum production. Importance of this finding however is uncertain since lambs in that
research were not significantly affected. Exactly how high the limit is probably depends on the
nutritional status of the ewe as well as composition of other diet offered.
Even though Nørgaard et al. (2008) detected as much decrease in colostrum output with feed
restriction as described previously, milk production in his restricted experimental ewes had as
soon as five days postpartum reached the level found in the ad libitum fed ewes. Furthermore,
for the whole lactation no significant effect were found on milk production measured as lamb
live weight though lambs from restricted ewes were on average little lighter than others.
O´Doherty (1997) linked decreased colostrum yield in ewes not fed protein supplement with
lower protein availability in the mammary gland.
It can be concluded that variable effect of pregnancy- and early lactation diet on subsequent
milk production is because of the high priority of the foetus and mammary gland above
maternal body tissue for nutrients. Moreover, the ewe’s ability to mobilize maternal tissues to
compensate for insufficient late pregnancy nutrition is extremely important in that matter.
Undernourished ewes have, as a result of extensive tissue mobilization in the critical period
around parturition, less body reserves to rely on postpartum. Negative effect of restricted
pregnancy feeding however can be overridden by successful nutrition during lactation
(Nørgaard et al., 2008) but that requires greater quality and quantity of diet than for better
nourished ewes.
Litter size, i.e. number of lambs reared by one dam, affects growth rate (Sormunen-Cristiana
& Jauhiainen, 2001), probably to some extent because of lower birth weight of lambs with
increasing litter sizes since Greenwood et al., (1998) found lighter lambs to have lower growth
rate the first weeks. This finding is in agreement with Khalaf et al. (1979) that found lambs
reared by undernourished ewes to have restricted growth rate. They suggested this would be
the result of combination of lower birth weight, hence less ability of the lambs, for feed intake,
and decreased colostrum and milk production in the restrictedly fed ewes. Since lamb growth
rate is highest the first six to seven weeks of their life, the effects of ewe undernourishment as
well as other factors affecting lamb birth weight cease with age, except that difference

17
between sexes increases (Thorgeirsson & Thorsteinsson, 1989). As the growth period
proceeds bigger portion of the lambs’ nutrition is derived from herbage allowance compared
to the mothers’ supply of milk. Furthermore, lamb growth rate ceases with advancing age,
both these facts resulting in diminishing effect of late pregnancy and early lactation nutrition
of the ewe on lamb performance (Guðmundsson & Dýrmundsson, 1989).

18
2. Aims
Feeding recommendations available to Icelandic farmers are mainly based upon research work
that took place decades ago. Sheep husbandry in Iceland has changed a great deal during those
years, both with regard to housing and feeding as well as economical circumstances. The main
goal of the research work this current project is a part of is to collect data that can become
basis for revaluing recommendations regarding late pregnancy feeding of ewes under
Icelandic circumstances.
The aim of this particular research was to investigate the effect of combination of roughage
and supplements differing in protein type on the health, performance and metabolic balance of
the ewes as well as the birth weight and growth rate of their lambs.
Manuscript I presents results regarding effects of feeding ewes in late pregnancy different
concentrate types along with ad libitum haylage on their eating capacity, weight, body
condition and metabolic status
Manuscript II presents results regarding effects of feeding ewes in late pregnancy different
concentrate types along with ad libitum haylage on lamb birth weight and growth rate from
birth to weaning.
Both manuscripts will be submitted to Icelandic Agricultural Sciences.
In this thesis the results presented in the two manuscripts are combined into continuum and
attempt made to reveal the connection between the parameters under investigation.

19
3. Materials and methods
The experiment took place at Hestur, the sheep experimental farm of the Agricultural
University of Iceland in the spring 2008.
3.1. Experimental animals, housing and feeding
Forty-eight pregnant ewes of the native Icelandic flock were allocated to one of four dietary
treatments (n=12) from 30-39 days pre-lambing until lambing. The ewes had been scanned for
litter size, each treatment group containing equal numbers of single, twin and triplet bearing
ewes. All treatment, before and after the experimental period, was as traditional at the farm.
Ewes had been housed since November and fed grass silage or haylage ad libitum at all times.
Shearing took place in November and again in March. Ewes were mated in December.
Treatment groups were balanced for ewe BCS assessed in February, age, expected lambing
date and index for mothering ability, evaluated on the scale 0,1-9,9. For calculation of this
index each farms average ewe output is set as the index five and deviation of ewes output from
the mean results in their index raising or decreasing to certain level. Table 1 presents treatment
means and standard deviations for those factors, as well as means for ewe weight and BCS in
late March.
Table 1. Weight, body condition score, age and index for mothering ability of experimental ewes Treatment CTR MIX EN PRO
Mean Std
Dev Mean Std
Dev Mean Std
Dev Mean Std
Dev Body condition score in February 3,67 0,27 3,69 0,24 3,65 0,25 3,64 0,34 Ewe weight in Mars (kg) 82,2 7,7 81,1 7,20 81,80 7,90 79,50 4,60 Body condition score in Mars 3,71 0,23 3,90 0,34 3,79 0,35 3,75 0,32 Ewe age 4,67 1,56 4,67 1,61 4,58 1,68 4,58 1,31 Index for mothering ability 5,10 1,10 5,20 0,70 5,10 0,90 5,10 1,10
Experimental ewes were separated from the flock at April 1st and introduced to the
experimental haylage. Each group was divided into two replications (n=6), with equal
numbers of single, twin and triplet bearing ewes, that were penned and fed separately.
20
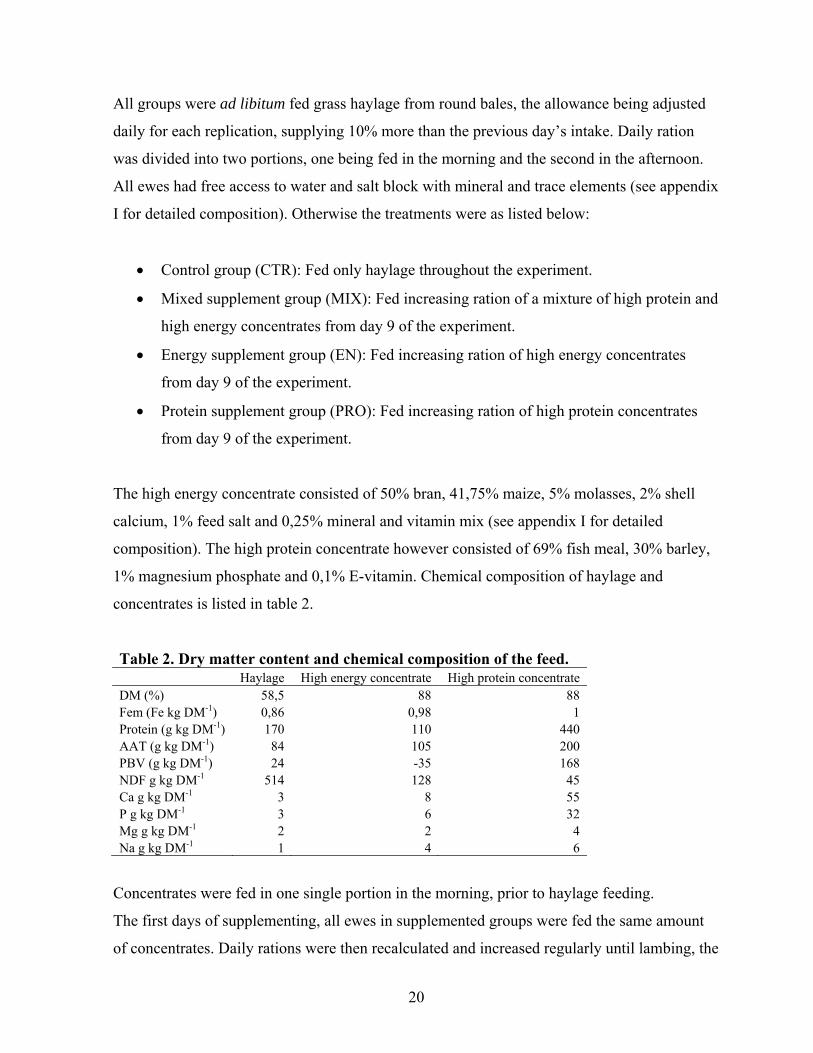
All groups were ad libitum fed grass haylage from round bales, the allowance being adjusted
daily for each replication, supplying 10% more than the previous day’s intake. Daily ration
was divided into two portions, one being fed in the morning and the second in the afternoon.
All ewes had free access to water and salt block with mineral and trace elements (see appendix
I for detailed composition). Otherwise the treatments were as listed below:
Control group (CTR): Fed only haylage throughout the experiment.
Mixed supplement group (MIX): Fed increasing ration of a mixture of high protein and
high energy concentrates from day 9 of the experiment.
Energy supplement group (EN): Fed increasing ration of high energy concentrates
from day 9 of the experiment.
Protein supplement group (PRO): Fed increasing ration of high protein concentrates
from day 9 of the experiment.
The high energy concentrate consisted of 50% bran, 41,75% maize, 5% molasses, 2% shell
calcium, 1% feed salt and 0,25% mineral and vitamin mix (see appendix I for detailed
composition). The high protein concentrate however consisted of 69% fish meal, 30% barley,
1% magnesium phosphate and 0,1% E-vitamin. Chemical composition of haylage and
concentrates is listed in table 2.
Table 2. Dry matter content and chemical composition of the feed. Haylage High energy concentrate High protein concentrate DM (%) 58,5 88 88 Fem (Fe kg DM-1) 0,86 0,98 1 Protein (g kg DM-1) 170 110 440 AAT (g kg DM-1) 84 105 200 PBV (g kg DM-1) 24 -35 168 NDF g kg DM-1 514 128 45 Ca g kg DM-1 3 8 55 P g kg DM-1 3 6 32 Mg g kg DM-1 2 2 4 Na g kg DM-1 1 4 6
Concentrates were fed in one single portion in the morning, prior to haylage feeding.
The first days of supplementing, all ewes in supplemented groups were fed the same amount
of concentrates. Daily rations were then recalculated and increased regularly until lambing, the

21
concentrate ration aiming at supplying all concentrate-fed groups with the same amount of
total gAAT ewe-1 day-1 at each time. Daily ration of supplements at each time is shown in
table 3.
Table 3. Daily ration of supplements (g DM ewe-1 day-1) at each time. CTR MIX EN PRO Experimental week 1 0 *60 60 60 Experimental week 2 0 *100 100 100 Experimental week 3 0 **190 250 131 Experimental week 4 and until lambing 0 ***260 343 180 * equal ration of high energy and high protein supplements ** 125 g high energy supplement and 65 g high protein supplement *** 170 g high energy supplement and 90 g high protein supplement
At parturition ewes were individually penned for around 2 days but moved to groups of
increasing size the next days if no problems occurred. For around 8-12 days postpartum all
ewes received the same ration, approximately 150 g ewe-1 day-1 of the high protein
supplement. Within the first couple of hours after birth lambs were dosed with 40 mg
Clamoxyl to prevent E.coli infection (watery mouth disease). Litter sizes were balanced to two
lambs per ewe directly after birth, i.e. one lamb was removed from each triplet bearing ewe
and one extra lamb, usually triplet or twin from yearling, was added to those that had given
birth to singles. Because of this process and the fact that the ewes did not always lamb on the
day expected, some of the lambs reared by experimental ewes were not born to ewes from the
experiment. One ewe only raised one lamb since no extra lamb was available at parturition.
This ewe was therefore excluded from the postpartum data. Within 24 hours from birth the
lambs were weighed, ear tagged and sex and colour registered. One lamb was stillborn and
two died because of lambing difficulties. Two lambs died within the first 10 days, both reared
by the same dam that only reared one lamb afterwards. Approximately two weeks postpartum
one lamb was found dead in the pasture and one of the experimental ewes died 10 days
postpartum, reason for death in both cases is unknown.
Ewes and lambs were kept indoors but with access to outdoor pen until 8-12 days after
lambing, after last “post parturient” blood sampling. Then they were moved to cultivated
pasture, yet with free access to haylage as well as 50 g ewe-1 day-1 of high protein supplement.
Approximately one month postpartum all sheep were excluded from the cultivated land and

22
grazed rangeland at Hestur until the end of June. At that time all ewes were gathered and taken
to the highlands, except for ewes that had managed to escape to the surrounding farm or lost
their lambs. At September 17th the flock was gathered from the highland and grazed on
rangeland at Hestur until September 22nd when lambs were weaned and grazed on cultivated
pasture until slaughter.
3.2. Measurements and data sampling
The intake of grass silage within each replication was recorded every day from day three, until
lambing of the first ewe. Since it was not possible to individually feed the ewes daily intake is
calculated as mean intake of each replication – that is: (replication allowance-replications
refusals)/number of ewes in replication. Two samples were taken from each round bale and
one from each day’s refusals (compounded from all replications) and frozen down for later dry
matter and chemical analyses.
Blood samples were collected from all ewes every week in one of the replication for each
treatment. Sampling started on day three of the experiment and resulted in total of six or seven
samples per ewe, depending on the day of lambing. The second last sample was taken as
representative of the ewe at lambing and the last representing the changes occurring the first
days (5-9) postpartum. Blood samples were collected from jugular vein by venipuncture using
9 ml Lithium Heparin vacuette® (grainer bio-one) vacutainer. Sampling took place in the
afternoon on sampling days, prior to haylage feeding. Samples were immediately placed on
ice and then centrifuged for 20 minutes. Two times two ml of the plasma was collected into 4
ml tubes and frozen down for later analysis.
Ewe weight and BCS according to the five unit scale described by Russel et al. (1969) was
recorded on day 28 of the experiment.
Birth weight was recorded within 24 hours from birth, stillborn lambs and lambs that died at
parturition included. Seven days old all lambs reared by the experimental ewes were weighed;
however, the lambs from the ewe that died ten days postpartum, and from the two ewes that
only reared one lamb were excluded from the statistical analysis, total number of lambs used

23
for the analysis 24, 22, 22 and 22 lambs in treatment groups 1-4 respectively. In end of June,
when the lambs were 45-57 (average 49) day old the 76 lambs present at that time (18, 22, 21
and 15 lambs in groups 1-4 respectively) were weighed and used for statistical analysis
regarding growth rate from seven days old to end of June. The remaining 14 compared to the
one week old weighing were either not present due to escape of their dams or dead, number in
each category unknown at that time. The lambs were weighed again at weaning when they
were on average 144 days old. Lambs reared by the ewes that were not present in end of June
are excluded from statistical analysis of growth rate from end of June to weaning, data of a
total of 74 lambs being used for this analysis (18, 20, 21 and 15 lambs in groups 1-4
respectively). For weaning weight and growth rate from birth to weaning the data consisted of
85 lambs (24, 20, 21 and 20 lambs in groups 1-4 respectively), those five missing compared to
the one week old weighing having died somewhere in the period from one week old to
weaning.
3.3. Chemical analysis
All feed samples, two from each round bale except only one from the last bale were analyzed
for dry matter, digestibility, energy (FEm kg DM-1) protein (g kgDM-1), AAT (g kg DM-1),
PBV (g kg DM-1) and Neutral Detergent Fibre (NDF). Protein was measured using the
Kjeldahl method and AAT and PBV values were calculated according to Madsen et al. (1995)
NDF was determined using ANKOM technology on Van Soest method (Van Soest et al.,
1991) and for dry matter digestibility the modified method of Tilley and Terry was used
(Tilley & Terry, 1963). Refusal samples were combined making one sample from each round
bale and analyzed by the same methods as feed samples.
For plasma glucose, AST, GGT, urea and uric acid determination standard procedures
(Siemens Diagnostics® Clinical Methods for ADVIA 1650) were used and for NEFA the
Wako, NEFA C ACS-ACOD assay method. Increase in absorbance at 340 nm due to the
production of NADH, at slightly alkaline pH in the presence of ß-OH-butyrate dehydrogenase
was used to determine BHB. Sample blank was included and the method involved oxamic acid
in the media to inhibit lactate dehydrogenase as proposed by (Harano et al., 1985). Activity of
GLDH was quantified in a kinetic, colorimetric assay according to Schmidt & Schmidt,

24
(1995). ICDH was also determined in a kinetic, colorimetric assay using isocitrate as substrate
and NADPH2 as response parameter. The autoanalyzer ADVIA 1650® Chemistry System
(Siemens Medical Solutions, Tarrytown, NY 10591, USA) was used for all analyzes.
3.4. Statistical analysis
Data was analyzed using the REML method of SAS Enterprise Guide 4.1 and 4.2 (SAS
institute, 2004) mixed model analyze. When response variable was individual ewe information
such as ewe BCS and weight we used the following model:
Yijkl = µ + Ti + Lj + Ak + Dl + (T x L)ij + εijkl
Where Yijkl is the response variable, µ is the overall mean of the population, Ti is the mean of
the experimental treatment (i = 1-4), Lj is the mean effect of litter size (j = 1-3), Ak is the
effect of ewe age (k = 3-8) and Dl is the effect of length of the treatment (number of days from
onset of the experiment until lambing; l = 30-39), (T x L)ij is the interaction between treatment
and litter size and εijkl represents the unexplained residual elements that are assumed to be
independent and normally distributed.
Those effects were always included in the model when estimating individual ewe information
though they did not affect response variable significantly in all cases.
When lamb birth weight was the response variable the model was as follows:
Yijk = µ + Ti + Lj + Sm + Ak + Dl + (T x L)ij + εijk
Where Yijklm is the response variable, µ is the overall mean of the population, Ti is the mean of
the experimental treatment (i = 1-4), Lj is the mean effect of litter size (j = 1-3), Sm is the mean
effect of sex of the lamb (m = 1-2), Ak is the effect of ewe age (k = 3-8) and Dl is the effect of
length of the treatment (number of days from onset of the experiment until lambing; l = 30-
39), (T x L)ij is the interaction between treatment and litter size and εijkl represents the
unexplained residual elements that are assumed to be independent and normally distributed.
25
For the data regarding growth rate at any time interval the model was the same as for birth
weight except that litter size refers in that case to the number of lambs the ewe rearing each
particular lamb gave birth to instead of the birth type of the lamb itself. Furthermore, instead
of age of “birth” dam age we used age of the dam that reared the lamb.
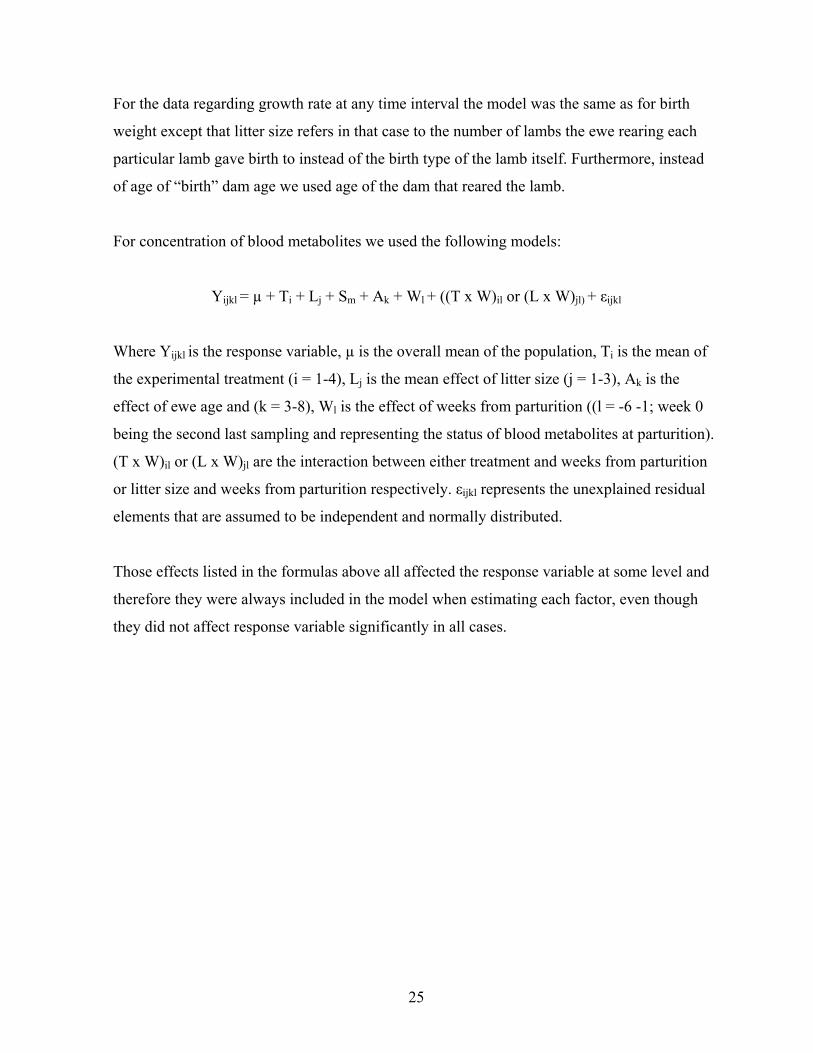
For concentration of blood metabolites we used the following models:
Yijkl = µ + Ti + Lj + Sm + Ak + Wl + ((T x W)il or (L x W)jl) + εijkl
Where Yijkl is the response variable, µ is the overall mean of the population, Ti is the mean of
the experimental treatment (i = 1-4), Lj is the mean effect of litter size (j = 1-3), Ak is the
effect of ewe age and (k = 3-8), Wl is the effect of weeks from parturition ((l = -6 -1; week 0
being the second last sampling and representing the status of blood metabolites at parturition).
(T x W)il or (L x W)jl are the interaction between either treatment and weeks from parturition
or litter size and weeks from parturition respectively. εijkl represents the unexplained residual
elements that are assumed to be independent and normally distributed.
Those effects listed in the formulas above all affected the response variable at some level and
therefore they were always included in the model when estimating each factor, even though
they did not affect response variable significantly in all cases.

26
4. Results
4.1. Feed intake
Haylage intake, as presented in figure 1 was greater in the CTR group than the supplemented
groups (MIX, EN, PRO) throughout the experiment. However, the difference was not
significant until the third week when haylage intake of the control ewes increased while
decreasing in those supplemented.
1,6
1,7
1,7
1,8
1,8
1,9
1,9
2,0
2,0
2,1
1 2 3 4
Experimental week
kg
DM
day
-1 e
we
-1
CTR
MIX
EN
PRO
Pattern of the ewes total intake of energy (FEm day-1 ewe-1) and protein (gAAT day-1 ewe-1),
including the supplements, can be viewed in figures 2 and 3. For comparison the figures
include requirements of twin bearing ewes for energy and protein at each time as described by
Sveinbjörnsson & Ólafsson (1999) and Ólafsson (1995). Adjusted means for DM, FEm and
AAT for each treatment and time interval are presented in manuscript I.
Figure 1. Haylage intake from beginning of experiment until parturition of the first ewe

27
0,0
0,2
0,4
0,6
0,8
1,0
1,2
1,4
1,6
1,8
2,0
1 2 3 4
Experimental week
FE
m d
ay-1
ew
e -
1
CTR
MIX
EN
PRO
Requirements
0
20
40
60
80
100
120
140
160
180
200
1 2 3 4
Experimental week
gAA
T d
ay-1
ew
e -1
CTR
MIX
EN
PRO
Requirements
Figure 2. Changes in total energy intake (FEm day-1 ewe-1) from beginning of experiment until parturition of the first ewe
Figure 3. Changes in total protein intake (g AAT day-1 ewe-1) from beginning of experiment until parturition of the first ewe

28
Energy and protein intake is similar in all the supplemented treatments and all treatments show
the same pattern from time to time. Both the energy and protein intake of the CTR group is, as
expected, lower than in those supplemented but yet, above the requirements of twin bearing
ewes.
4.2. Ewe weight and body condition
Ewe weight did not differ significantly between any of the treatments but litter size affected
ewe weight significantly, single bearing ewes being lighter than twin and triplet bearing ewes
in the end of the experimental period. Weight change of ewes during the experimental period,
that is from late March until the parturition of the first ewe in the end of april, is presented in
figure 4. Treatment did not affect weight change significantly though PRO ewes were
significantly heavier than CTR ewes. As could be expected the single bearing ewes gained less
weight than those carrying twins and triplets.
0,00
2,00
4,00
6,00
8,00
10,00
12,00
CTR MIX EN PRO
Treatment
Wei
ght
chan
ge (
kg)
Single
Twin
Triplets
Triplet bearing ewes gained more weight than those carrying twins in all treatments except the
MIX group where twin bearing ewes had the highest weight gain.
Figure 4. Changes in ewe weight from end of march until parturition of the first ewe in end of april

29
BCS was highest in the MIX group though none of the treatment groups differed significantly
from each other. In the end of the experiment BCS of triplet bearing ewes was lower than of
those carrying singles and twins but the difference between BCS of the latter two was small.
Figure 5 presents changes in BCS during the experimental period, i.e. from late March until
the parturition of the first experimental ewe in end of April.
-0,30
-0,20
-0,10
0,00
0,10
0,20
0,30
0,40
CTR MIX EN PRO
Treatment
BC
S c
han
ge
Singles
Twins
Triplets
Changes in BCS during the experimental period showed more diversity than weight changes.
In all the supplemented groups triplet bearing ewes lost condition while in the CTR group all
litter sizes gained BCS at a similar level. In the MIX treatment single bearing ewes gained
more BCS than those carrying twins while the opposite was found for the EN and PRO group
where twin bearing ewes had the highest BCS gain. Adjustued means for changes in ewe
weight and BCS during the experiment can be found in manuscript I.
4.3. Blood metabolites
Significance of treatment effects on glucose level was mainly due to elevated levels of glucose
in the EN group the last two weeks prepartum. Glucose level increased postpartum in the PRO
group while it decreased in the other treatments. However, during most of the experimental
Figure 5. Changes in BCS from end of March until parturition of the first ewe in end of April

30
period the treatments supplemented with high undegradable protein concentrates (MIX and
PRO groups) had lower glucose level than the CTR and EN groups. As presented in figure 6,
triplet bearing ewes had lower plasma glucose than other litter sizes at all measurements
prepartum. This difference evens out postpartum when glucose levels of single and twin
bearing ewes decrease to a greater extent than of those that had given birth to triplets.
2,5
2,7
2,9
3,1
3,3
3,5
3,7
3,9
4,1
-5 -4 -3 -2 -1 0 1
Week from parturition
Glu
cose
leve
l (m
M)
singles
twins
triplets
Even though treatment did not have significant effect on NEFA concentration in plasma, the
CTR group had the highest NEFA concentration at all measurements from beginning of
supplementation. Nevertheless, as figure 7 presents, changes in NEFA have similar pattern in
all groups throughout the experiment and weeks from parturition were in fact the only factor
tested that significantly affected NEFA.
Figure 6. Plasma glucose level from five weeks prepartum to one week postpartum

31
0
100
200
300
400
500
600
-5 -4 -3 -2 -1 0 1
Week from parturition
NE
FA
leve
l (μ
ekv.
/L)
CTR
MIX
EN
PRO
Pattern of NEFA changes were also similar between all litter sizes but constantly with lower
levels in ewes carrying singles than others.
0,00
0,20
0,40
0,60
0,80
1,00
1,20
-5 -4 -3 -2 -1 0 1
Week from parturition
BH
OB
(m
M)
CTR
MIX
EN
PRO
Figure 7. Plasma NEFA level from five weeks prepartum to one week postpartum
Figure 8. Plasma BHB level from five weeks prepartum to one week postpartum

32
Like NEFA, BHB level was significantly affected by weeks from parturition and showed
similar pattern throughout the experiment within all treatments. Ewe age and treatment also
had significant effect on BHB concentration. The PRO group had highest BHB level at all
measurements until parturition when it decreased more than others and in the last two
measurements it was similar to the levels in the other three groups. Figure 8 presents pattern of
BHB changes within treatments.
The BHB difference was not significant between the two undegradable protein supplemented
treatments (MIX and PRO) but both differed significantly from, and had throughout the
experiment higher levels of BHB than, both CTR and EN groups. Difference was also
significant between those two, the EN group having the lowest level and least changes in BHB
level from time to time. No difference could be found in BHB levels between litter sizes.
0,00
2,00
4,00
6,00
8,00
10,00
12,00
-5 -4 -3 -2 -1 0 1
Week from parturition
Ure
a (m
M)
CTR
MIX
EN
PRO
Urea level in plasma was also significantly affected by weeks from parturition. However,
patterns were not as stable within different treatments and litter sizes as for the other
metabolites. Treatment affected urea level significantly, the effects being strongest for the
PRO group that had, as presented in figure 9, the highest urea level at all measurements until
parturition when urea levels of all treatments approached. The urea levels were similar among
Figure 9. Plasma Urea level from five weeks prepartum to one week postpartum

33
treatments one week postpartum. Plasma urea level seemed to fluctuate to a great extent
within litter sizes, especially in the first three measurements. Nevertheless, litter size effects
were significant and urea levels were lowest in the triplet bearing ewes and in most cases
highest in those carrying singles - all litter sizes differing significantly from each other.
0,00
5,00
10,00
15,00
20,00
25,00
30,00
35,00
-5 -4 -3 -2 -1 0 1
Week from parturition
Uri
c ac
id (μ
mol
/L)
CTR
MIX
EN
PRO
Uric acid levels were significantly affected by treatment, litter size and weeks from
parturition. However, the only treatment group significantly differing from the others was the
EN group that had the highest level from beginning of supplementing. CTR groups level were
lower than the others in the last two measurements prepartum but rose to levels similar to the
other groups at parturition. As for the treatment difference presented in figure 10, litter size
difference is small in the first three measurements but increases in the next two. From two
weeks prepartum until end of measurements single bearing ewes had lower levels of uric acid
in plasma than those carrying twins and triplets.
The liver enzymes tested, AST, GGT, GLDH and ICDH, all were significantly affected by
weeks from parturition. AST and GLDH had rather constant level postpartum, both within
litter sizes and treatment groups, but at parturition levels were greatly elevated. AST level was
significantly affected by treatment, levels being higher in the MIX and PRO treatments, but
Figure 10. Plasma uric acid level from five weeks prepartum to one week postpartum

34
not litter size while the opposite was found for GLDH levels that were higher in single than
twin and triplet bearing ewes.
ICDH and GGT levels also increased during the experiment but more gradually from
beginning of measurements until parturition than AST and GLDH. GGT level was neither
significantly affected by treatment nor litter size though treatment effect were close to
significance and CTR group had significantly higher level than those supplemented with
undegradable protein (MIX and PRO). Both litter size and treatment affected ICDH level
significantly, CTR group being significantly higher than all those supplemented which did not
differ from each other. ICDH level in single bearing ewes were in general, in contrast with the
other liver ensyme measured, lower than in the other litter sizes though the value approaches
twin and triplet bearing ewes postpartum. Adjusted means for the liver enzymes as well as the
other blood metabolites are presented in manuscript I.
0,00
0,50
1,00
1,50
2,00
2,50
3,00
3,50
-5 -4 -3 -2 -1 0 1
Week from parturition
Cal
ciu
m le
vel (
mM
)
CTR
MIX
EN
PRO
Level of calcium in plasma was significantly affected by treatment and weeks from
parturition. As Figure 11 reveals levels were quite stable within all treatments prepartum but
decreased at parturition, the change being greater for the EN treatment than others. However,
in the last measurement, representing plasma calcium status approximately one week
Figure 11. Plasma calcium level from five weeks prepartum to one week postpartum
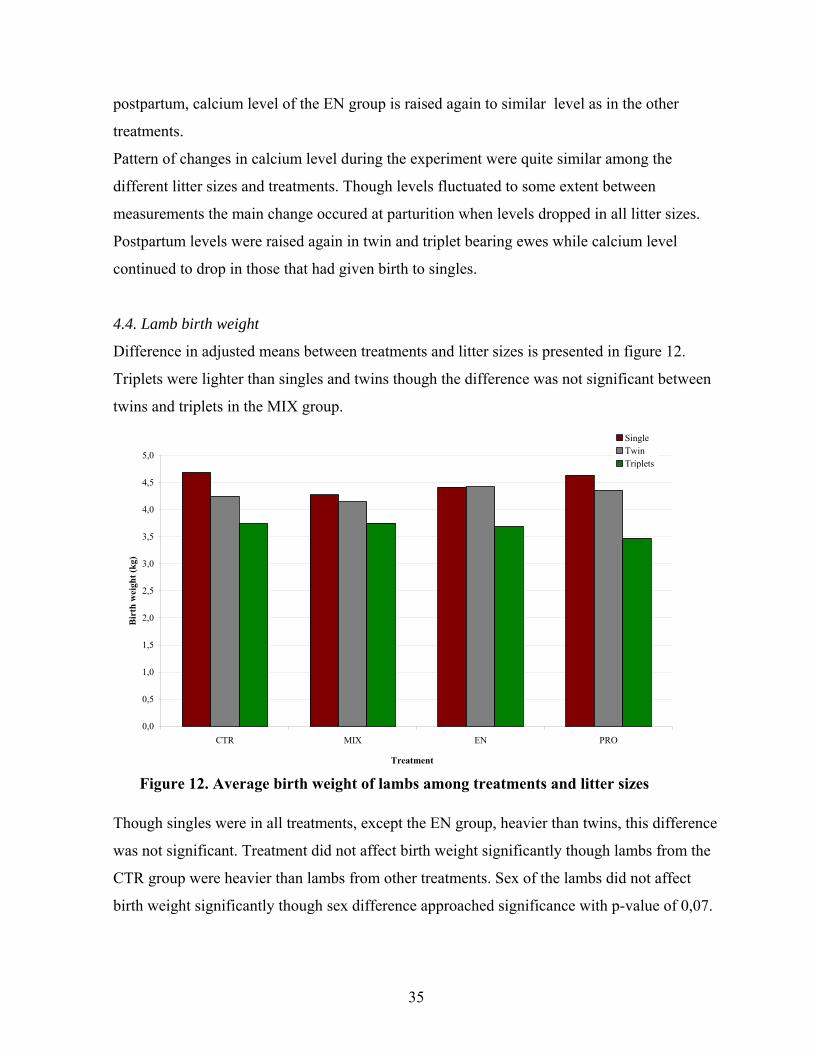
35
postpartum, calcium level of the EN group is raised again to similar level as in the other
treatments.
Pattern of changes in calcium level during the experiment were quite similar among the
different litter sizes and treatments. Though levels fluctuated to some extent between
measurements the main change occured at parturition when levels dropped in all litter sizes.
Postpartum levels were raised again in twin and triplet bearing ewes while calcium level
continued to drop in those that had given birth to singles.
4.4. Lamb birth weight
Difference in adjusted means between treatments and litter sizes is presented in figure 12.
Triplets were lighter than singles and twins though the difference was not significant between
twins and triplets in the MIX group.
0,0
0,5
1,0
1,5
2,0
2,5
3,0
3,5
4,0
4,5
5,0
CTR MIX EN PRO
Treatment
Bir
th w
eigh
t (k
g)
SingleTwinTriplets
Though singles were in all treatments, except the EN group, heavier than twins, this difference
was not significant. Treatment did not affect birth weight significantly though lambs from the
CTR group were heavier than lambs from other treatments. Sex of the lambs did not affect
birth weight significantly though sex difference approached significance with p-value of 0,07.
Figure 12. Average birth weight of lambs among treatments and litter sizes
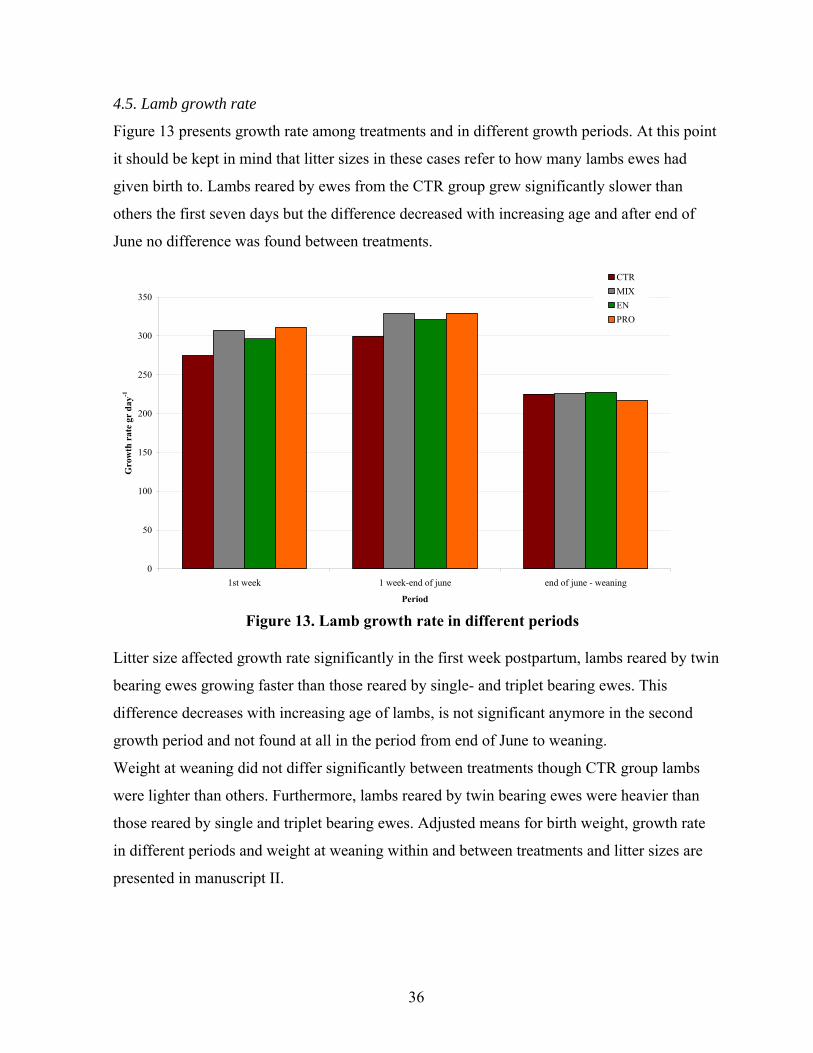
36
4.5. Lamb growth rate
Figure 13 presents growth rate among treatments and in different growth periods. At this point
it should be kept in mind that litter sizes in these cases refer to how many lambs ewes had
given birth to. Lambs reared by ewes from the CTR group grew significantly slower than
others the first seven days but the difference decreased with increasing age and after end of
June no difference was found between treatments.
0
50
100
150
200
250
300
350
1st week 1 week-end of june end of june - weaning
Period
Gro
wth
rat
e gr
day
-1
CTR
MIX
EN
PRO
Litter size affected growth rate significantly in the first week postpartum, lambs reared by twin
bearing ewes growing faster than those reared by single- and triplet bearing ewes. This
difference decreases with increasing age of lambs, is not significant anymore in the second
growth period and not found at all in the period from end of June to weaning.
Weight at weaning did not differ significantly between treatments though CTR group lambs
were lighter than others. Furthermore, lambs reared by twin bearing ewes were heavier than
those reared by single and triplet bearing ewes. Adjusted means for birth weight, growth rate
in different periods and weight at weaning within and between treatments and litter sizes are
presented in manuscript II.
Figure 13. Lamb growth rate in different periods

37
5. Discussion
5.1. Dry matter, energy and protein intake
Robinson (1983) stated that energy and protein requirements of the ewe in late pregnancy and
early lactation could rarely be met without substantial concentrate feeding. In contrast with
this statement the results from the research presented here indicate that with high quality
haylage requirements of the twin bearing pregnant ewe can be met, at least until parturition,
without supplementing. Good quality of the roughage is likely to be a key factor in this matter
as Annett et al. (2008) and Thorsteinsson & Thorgeirsson (1989), among others, consider
roughage quality to be of major importance for eating capacity.
DMI was not affected by type of supplement though it is known that combination of feedstuffs
in the diet can affect passage rate of the digesta through the rumen. Increased feeding of
concentrates in the MIX, EN and PRO groups however decreased intake of haylage
significantly compared to the CTR group. These effects are commonly known as substitution
effects and are especially notable when quality of the roughage fed is high (Dawson et al.,
2005, Frutos et al., 1998, Kerslake et al., 2008) such as in this case. Increased haylage intake
of the CTR group in the last experimental week is in contrast with for example Orr & Treacher
(1989), Ingvartsen (2006) and Speijers et al. (2005) that all state that DMI is reduced when
parturition approaches as was the fact in the supplemented groups.
Since these results indicate that energy and protein requirements of the twin bearing ewe can
be met with haylage alone the addition of supplements results in energy- and protein supply
well above requirements in the supplemented groups, even though haylage intake is reduced.
The protein requirements used here for comparison (Ólafsson, 1995) however are calculated
assuming birth weight of singles and twins to be 4 and 3,25 kg respectively. These numbers
are based upon experimental work from 1993. Our results as well as data from the
experimental farm however reveal substantially higher birth weight of lambs, twins now
having similar birth weights as singles did before and lambs from multiple litters today being
heavier than the average twin at the same farm 19 years ago. This could indicate an
underestimation of the prepartum nutritional requirements used today. Since ewes were not
individually fed and single, twin and triplet bearing ewes were penned together this data does

38
not reveal whether individual difference, such as litter size or ewe fatness affected intake to
some extent. Possible effect of litter size is unclear since studies are inconsistent regarding that
factor (Foot & Russel, 1979, Orr & Treacher, 1989, Sormunen-Cristiana & Jauhiainen, 2001)
but assuming equal feed consumption of all ewes and requirements based on the average litter
size of lambs 19 years ago only the triplet bearing ewes, both in the CTR as well as the
supplemented groups, would have been undernourished but only in the last week prepartum.
5.2. Ewe weight and body condition
In all treatment groups and within all litter sizes ewes gained weight during the last month
prepartum, i.e. during the experimental period as can be expected in well nourished ewes in
late pregnancy. Non-significant effect of treatment on ewe live weight and weight change is in
contrast with both O´Doherty & Crosby (1997) that found increase in live weight gain with
protein supplementing as well as Dawson et al. (2005) that found positive linear relationship
between increased herbage and concentrate allowance and live weight gain. Kerslake et al.
(2008) however found smaller effect of concentrate feeding on live weight when availability
of high quality roughage was increased. Similarly, the high quality of the roughage in our
experiment could to some extent explain the lack of response to concentrate feeding on live
weight gain.
Significance of the positive effect of litter size on live weight gain found here is in agreement
with Sormunen-Cristiana & Jauhiainen (2001) who found prepartum weight gain to increase
with increased litter size. This is as expected, considering relative weight of mammary tissues
carrying and preparing for one, two or three foetuses. Exception from this was found in the
MIX group where ewes carrying twins gained more weight than both single and triplet bearing
ewes.
Lack of treatment effect on BCS is in agreement with Annett et al. (2008) that failed to detect
effect of undegradable protein supplement on BCS. That is, in our case, not surprising at all
since Kerslake et al. (2008) even failed to detect effect on BCS when supplemented ewes were
fed low quality forage and Husted et al. (2008) also found BCS to increase irrespective of
feeding level. Similar BCS gain within all litter sizes in the CTR group compared to the big

39
and somewhat inconsistent difference between litter sizes in the other treatments is a suprise
and in disagreement with for example Dawson et al. (2005). Possible reason for this is the
effect of protein supplements on the ewes ability to mobilize fat and protein from maternal
tissues described for example by Frutos et al. (1998) and McNeill et al. (1997). How the
supplementary protein mediates the tissue mobilization seems rather complicated. At some
level this could to be caused by the fact that substrate cycles and processes regarding lipolysis
are energetically expensive (Chilliard et al., 2000, Cavestany et al., 2009) and extra protein,
above what needed to fill protein requirements, can be used for energy supply via
gluconeogenesis. This however is only one possible explanation, the process of tissue
mobilization and its control is complex and litterature review and research work beyond the
framework of this thesis is needed to explain this in details. Greater milk production of the
supplemented ewes as described later supports that explanation indicating mobilization of
energy towards udder development and preparation for milk production. However, effect of
this would also have been expected to be seen on lamb birth weight since less energy would be
available for foetal growth in the CTR group but that was not the fact in that case.
Furthermore, because of the great feed intake, the need for body tissue mobilization in single
and twin bearing ewes should have been minimal, especially in the supplemented groups and
the condition gain within those litter sizes supports that.
BCS loss of triplet bearing, supplemented ewes are in agreement with the previously
mentioned studies (Chilliard et al., 2000, Frutos et al., 1998, McNeill et al., 1997) regarding
effect of supplementing on mobilization of body tissues. As stated before, with equal feed
intake among litter sizes, energy and protein requirements of the triplet bearing ewes would
have been met until the last week prepartum and therefore severe fat and protein mobilization
should hardly have been needed until then. However, based on this research, especially
considering results from for example Orr & Treacher (1989), we cannot assume equal feed
intake among different litter sizes. Therefore non-supplemented triplet bearing ewes could
have been fed below requirements for longer period than the last week of pregnancy.
Based on the high nutrition level in the supplemented ewes, twin bearing ewes could have
been expected to gain more condition, especially in comparison with condition gain in the

40
single bearing and CTR ewes, than they did. Higher BCS and BCS change of twin than single
bearing ewes in the MIX and PRO groups are surprising considering the bigger gap between
intake of nutrients and requirements in those carrying singles which would have been expected
to result in greater addition to the maternal body fat and protein deposits in those ewes
compared to their twin bearing associates – assuming equal feed intake. In that matter it
should be considered that the energy and protein evaluating systems used for assessment of
requirements in this experiments have certain limitations. Those limitations are of special
consideration when it comes to considering effect of fatness and physiological state of the
animal as well as composition and level of intake of the diet, on for example passage rate of
digesta in the rumen. Since all the ewes in this experiment were of excellent condition, part of
the reason for lack of response of supplements on BCS could be the fact that energetic
efficiency is lower in fat ewes than others (Chilliard et al., 2000).
5.3. Concentration of blood metabolites
Since glucose is the most important energy source for foetal growth and later on for colostrum
and milk production its concentration in blood indicates the amount of energy available for
this activity (O´Doherty & Crosby, 1998). Significant difference between MIX and EN groups
on one hand and CTR and PRO on the other hand mainly reflects fluctuation and increased
glucose level at some points of the experiment rather than indicating that those groups had
elevated glucose level compared to others throughout the experimental period. Interesting
treatment effects were found in the PRO group where glucose level was increased postpartum
while it decreased in the other treatments, even though similar energy and protein intake
compared to needs were observed in all supplemented groups. The patterns for CTR, MIX and
EN treatments were in consistency with those previously observed by Husted et al. (2008) and
Banchero et al. (2006). Significant difference between PRO group and those fed lower level of
undegradable protein is to some extent inconsistant with O´Doherty & Crosby (1998) that
found no effect of protein supplement on glucose concentration in plasma. Though glucose
concentration changes showed the same pattern as found by Husted et al. (2008) changes were
not as great in our case. Husted et al. (2008) found glucose level in plasma to increase by 50%
the last three weeks prepartum, peak around lambing and then decrease again. Level of
fluctuation in the present experiment are more comparable to Banchero et al. (2006). Positive

41
relationship between energy nutrition and plasma glucose concentration as found by
O´Doherty et al. (1998) could in this case have been suppressed by the high level of dietary
energy in the CTR group. Lower level of glucose in triplet bearing ewes than those carrying
singles and twins can be explained by higher glucose requirements for foetal growth in those
ewes, resulting in increased absorbtion, relative to production and consequently lowered level
in plasma.
When viewing results regarding glucose concentration in plasma it has to be kept in mind that
any changes within the animal make very sudden response in glucose concentration
(O´Doherty & Crosby, 1998).
When body of the pregnant ewe fails to produce enough glucose to meet the increasing
demands of the growing foetus and developing mammary gland, fat depots are mobilized, via
lipolysis of adipose tissue, to increase energy supply. Until the fatty acids are absorbed and
utilized as an energy source they circulate in the plasma as NEFA. Therefore concentration of
NEFA in plasma can be used to estimate fat mobilization in animals. In this experiment
treatment did not affect NEFA level significantly even though the CTR group had, at all
sampling dates from beginning of supplementation, higher NEFA concentration than those
supplemented. Because of the slightly lower energy and protein intake in the CTR group and
therefore possibly more need for fat mobilization from maternal tissues this pattern could be
considered logical. However, this finding is inconsistant with the statement previously
described that protein addition (in that case raised AAT level) is necessary for the animal to
mobilize fat from maternal tissue (Frutos et al., 1998, McNeill et al., 1997). In fact NEFA
level was lowest in the PRO group that was fed the highest amount of undegradable protein
which does not indicate the extra protein being used for mobilization of maternal tissues – but
of course the need for such mobilization should have been negligible in that treatment, except
for the triplet bearing ewes.However, again at this point the limitations of the feed evaluation
system used regarding difference in characteristics of diet with changes in overall composition
and its association with physiological and nutritional status of the animal need to be
considered. Furthermore the findings of Dawson et al. (1999) that effects of undegraded
protein on fat and protein mobilization, are strongest when dietary energy is limited, should be
42
kept in mind since energy supply did not seem to be a limiting factor in the experiment
presented here. Lower NEFA concentration in single- compared to twin and triplet bearing
ewes is as expected since single bearing ewes should have had less need for fat mobilization
than others. Small difference between twin- and triplet bearing ewes is more surprising since,
assuming similar intake, energy and protein requirements of the triplet bearing ewes would
hardly have been met the last week. Pattern of NEFA concentration during the experimental
period is similar in all treatments and litter sizes. NEFA concentration remains stable or even
decreases at first, then it is elevated the last week prepartum, the level continuing to rise
postpartum probably as a result of significantly increased energy requirements around
parturition. NEFA concentration in plasma is sensitive to stress in the animal during sampling
(Speijers et al., 2005) which has to be considered when viewing results regarding NEFA
concentration.
BHB is produced as a kind of by-product during utilization of NEFA for energy supply and
can accumulate in blood inducing some clinical symptoms such as ketosis and fatty liver.
Since BHB usually develops as a result of increased fat mobilization its pattern between
treatments and sampling dates would be expected to be somewhat similar to what was found
for NEFA. That, however, was not the case. The MIX and PRO goups, i.e. the groups
receiving undegradable protein supplements, had significantly higher BHB level than other
treatments at all sampling dates. Based on the statement that (undegradable) protein
supplement stimulates fat mobilization (Frutos et al., 1998, McNeill et al., 1997) increased
BHB level would have been expected in the MIX and PRO groups if the diet would not have
met the ewes requirements as well as it did. Those effects should also have been seen for the
NEFA level, which they did not as mentioned above. Once again, possible underestimation of
requirements, f.ex. as a result of higher birth weight of lambs than was used acquiring
requirements (Ólafsson, 1995), higher body condition or other physiological factors of the ewe
as well as the limitations of the present feed evaluation system mentioned before should be
kept in mind.
The lowest BHB level was found for the EN group at all sampling dates which is as expected
since BHB concentration is known to be in opposition with plasma glucose, the EN group

43
having higher glucose level than the other as previously mentioned .Litter size did not affect
BHB significantly which does not indicate large mobilization of energy from fat depots of the
triplet bearing ewes and is in agreement with non-significant difference between NEFA level
in twin and triplet bearing ewes. These results could, to some extent, be affected by the
excellent body condition of the experimental ewes as O´Doherty & Crosby (1998) and
Speijers et al. (2005) found relationship between dietary energy and plasma BHB to decrease
with improving BCS of the ewes. Pattern of BHB changes with time in this study was quite
inconsistant with both Husted (2006) that obtained stable BHB levels as pregnancy proceeds
but a gradual increase during lactation, and Banchero et al. (2006) who stated that most
treatment differences occurs in the beginning of the experimental period but diminishes as
parturition approaches. However, conditions in their study with regard to for example
experimental length, ewe nutrition and body condition may not have been completely
comparable with our study. O´Doherty & Crosby (1998) questioned the use of BHB as an
indicator of energy status since severely undernourished ewes in their experiment failed to
present response in BHB.
Urea level in plasma is used as an indicator of efficiency of protein nutrition. In this
experiment significantly higher urea concentration was found for the PRO group during most
of the experimental period. That is to some extent in disagreement with Banchero et al. (2006)
and O´Doherty & Crosby (1998) that only detected small effect of undegradable protein
supplement on urea level. However, in the latter experiment all treatment groups were
undernourished which probably affected the outcome. Results from the experiment presented
here indicate waste of the expensive dietary protein in the PRO group above others, even
though supplementing rations were calculated to supply the experimental animals with equal
ration of supplementary protein available as AAT. Energy intake and some difference in the
balance between protein and energy in the digestive tract between the treatments could be
affecting the outcome in that matter.
Effect of litter size on urea concentration were significant, triplet bearing ewes having the
lowest level as expected due to their higher protein requirements and subsequently better
utilization of dietary protein. Values were rather stable from time to time, only minimal

44
fluctuations between samplings, which could indicate resonable changes in feeding through
the experiment.
Experimental weeks had significant effect on uric acid level, all treatments having similar
pattern of changes. Uric acid level represents the microbial activity in rumen and hence
production and availability of microbial protein in the small intestines (Dewhurst et al., 2000).
The significantly higher level in the EN group than others throughout the experiment is as
expected since supplementing of that group aimed at comparing effect of microbial protein
and undegradable protein. CTR group ewes had deeper drop prepartum than others, suggesting
decreased rumen activity at that time, possibly due to fall in available energy and nitrogen
from diet compared to needs. In the last measurement, one week postpartum, these ewes uric
acid level had again reached levels similar to other treatments which could be the result the
concentrate feeding starting postpartum.
Significant effect of weeks from parturition on the liver enzymes measured with rising levels
as parturition approaches indicates increased metabolic stress during the experiment. That is as
expected with significantly raising requirements for energy and protein. Levels for AST and
GLDH, the enzyems indicating effective protein metabolism in the liver, are stable until the
last week prepartum when they rise suddenly to great extent which seems reasonable since diet
met requirements rather well until the great rise at parturition. The lower AST level in the EN
group throughout the experiment suggests great efficiency of the use of the microbial protein
production indicated by uric acid level. Higher AST level in the CTR than the supplemented
groups postpartum is as expected, the latter receiving more energy and protein from diet
which results in less pressure on the liver and subsequently less risk of impaired liver function
and release of liver enzymes into the blood. Similar pattern was found for GLDH though not
significant. Higher level of those enzymes in the treatment receiving least dietary protein is in
agreement with the BHB levels that were higher for CTR group that EN as mentioned
previously. GLDH and AST levels were also affected by litter size, though not significantly
for AST. Triplet bearing ewes had significantly lower level than those carrying singles and
twins which is suprising given the insufficient nutrition of the triplet bearing ewes that also is
reflected in their decreased BCS and significantly lower glucose level during the experiment.

45
However, BCS gain in the triplet bearing ewes in the CTR treatment could possibly affect
these results in some way.
Level of GGT and ICDH on the other hand rise gradually from beginning of the experiment.
No effects were found of litter size on GGT level but single beraring ewes had lower ICDH
level than others which is as expected since they should not have neesed as extensive lipid
metabolism as those carrying multible litters. Treatment effect on those metabolites were
mainly due to the higher level of CTR ewes most of the experimental time which is not at all
surprising based on the high NEFA level found for those ewes and less nutrients availability.
However, as mentioned before less intake of protein in this group would have been expected
to limit the mobilization of body reserves. Treatment groups receiving undegradable protein
(MIX and PRO) had lower levels of GGT and ICDH though not significantly for GGT.
Pattern of calcium changes during the experiment reflect the highly increasing demands at
parturition. Because of the high calcium level of the supplement fed to both MIX and PRO
groups, more severe drop in the EN treatment is to some extent as expected. More surprising is
that CTR group ewes had similar level as MIX and PRO in spite of no supplementary feeding.
Possible reason could be that since those ewes received no additional calcium they were better
prepared for using their skeletal reserves, i.e. mild undernutrition of calcium prepartum could
have stimulated calcium release from the skeleton. The same reason could count for single
bearing ewes taking longer time than others to elevate calcium level postpartum, excess
feeding prepartum resulting in the ewes not being ready for calcium release from body
reserves.
5.4. Lamb birth weight
As expected, triplets were significantly lighter than lambs of other litter sizes. Lack of
difference between singles and twins however is in disagreement with Thorsteinsson &
Thorgeirsson (1989), Orr & Treacher (1994) and Sormunen-Cristiana & Jauhiainen (2001)
that all found singles to be heavier than twins and triplets lighter than twins. This result is
particularly interesting since according to calculated intake of both energy and protein, single
bearing ewes were severely overfed which could, according to Thorsteinsson & Thorgeirsson,

46
(1989) and Annett et al. (2008), have led to some extremes in birth weight. Furthermore, lack
of significant difference between treatments and actually higher birth weight of lambs from
the CTR group though not significant, are in disagreement with several research linking
supplementary diet with increased birth weight (Annett et al., 2008, Thorsteinsson &
Thorgeirsson, 1989). Speijers et al. (2005) and Thorsteinsson & Thorgeirsson (1989)
suggested that lack of effect obtained with supplementing pregnant ewes could, at least to
some extent, be caused by high roughage quality and excellent body condition of experimental
ewes, respectively and this could also be the reason in our case. This could also explain the
surprisingly low birth weight of singles compared to twins.
The fact that CTR ewes, though giving birth to the heaviest lambs, were slightly lighter than
those supplemented, could indicate that some mobilization of maternal reserves took place and
higher NEFA concentration in the CTR group supports that suggestion. However, since their
feed intake indicates that energy and protein requirements were met and plasma glucose level
does not contest that finding and hardly BHB nor liver enzyme concentration neither there
should not have been need for mobilization of energy and protein from body tissues in that
treatment above others. Once again, however, possible limitations of feed evaluation system as
well as underestimation of needs caused by raised birth weight of lambs since the feeding
standards were calculated, need to be considered.
5.5. Lamb growth rate
Decreasing effect of treatment and litter size of the dam on lamb growth rate with increasing
lamb age found in this experiment are in agreement with Guðmundsson & Dýrmundsson,
(1989) that found maternal effect on lamb growth rate to decrease with advancing age due to
higher proportion of herbage compared to milk in the diet of lambs as they get older. Lower
growth rate of lambs reared by single or triplet bearing ewes compared to those that had given
birth to twins could be caused by the fact that all lambs reared by triplet bearing ewes, and half
of those reared by single bearing ewes were born as either triplets, or twins from yearlings.
Both of those are normally lighter at birth than twins from adult ewes (Thorsteinsson &
Thorgeirsson, 1989) and consequently they have lower growth rate in the beginning as stated

47
by for example Sormunen-Cristiana & Jauhiainen (2001), Greenwood et al. (1998) and Khalaf
et al. (1979).
Lambs reared by CTR ewes had lower growth rate the first eight weeks but as mentioned
above this difference was not present any more in the period from end of June to weaning.
Lower growth rate of the CTR lambs the first weeks postpartum is in agreement with for
example Robinson & McDonald (1989), Nottle et al. (1998) and Speijers et al. (2005) and
suggests positive effect of supplementing ewes prepartum on their ability for colostrum and
subsequent milk production.

48
6. Conclusion
Based on the experimental work presented above the following conclusions can be made:
Nutrient requirements of twin bearing pregnant ewe, as it is defined today, can be met
without concentrate feeding until parturition but it has to be kept in mind that roughage
qality probably is a key factor in that matter. BCS gain of single and twin bearing ewes
in all treatment groups in this experiment confirms that.
Feeding high quality roughage supplementation does not seem to be needed for triplet
bearing ewes until the last week prepartum. Further research regarding eating capacity
of ewes carrying different litter sizes is needed to estimate how long time prepartum
supplementation is needed.
Viewing these results in comparison with older researches makes it reasonable to
assume that body condition of the ewes is an important factor in the outcome of studies
like this. Therefore it would be interesting to make further research on effects when
BCS is of more diversity.
Supplementing affects the ewes ability to mobilize fat from body reservoirs for energy
production when basal diet is not filling energy needs. Possibly due to use of
supplementary protein as an glucogenic substrats for the energy requiring process of
lipolysis in adipose tissues.
Prepartum supplementing seems to make ewes better prepaired for lactation as
increased growth rate of lambs reared by supplemented ewes presents. However the
slightly higher birth weight of lambs from non-supplemented ewes modifies the effect
of increased growth rate resulting in non-significant difference between weaning
weight of lambs reared by supplemented and non-supplemented ewes. Therefore this
research does not indicate economical advantage of supplementating ewes prepartum.
Better preparation for lactation in the supplemented ewes indicates benefit of feeding
concentrates to single bearing ewes that are expected to rear two lambs for some time
prepartum. Further research is needed in that matter, such as duration and amount of
supplementing as well as economical profitability.
These results indicate positive effect of prepartum supplementation on the milking
ability of the ewes. However, for ewes concuming as much high quality diet as in this

49
case undegradable protein in the supplements did not have advantage above other types
of concentrates.
Concidering these results possible underestimation of requirements based on increased
birth weight of lambs the last decade has to be kept in mind
Furthermore, possible limitations of nutrition evaluation system such as effect of
physiological state of the ewe (BCS, place in the production cycle) as well as particular
characteristics of the diet on f.ex. eating capacity and rate of passage through the
digestive tract need more interest.
Based on this experiments results in addition to an overview of litterature regarding effect of
late pregnancy feeding on lamb birth weigh and growth rate as well as weight, condition and
health of the pregnant and lactating ewe it seems clear that, even though several changes in
feeding, housing and management of sheep the last decades the following statement, originally
published 1989, still describes the most importan things regarding nutrition of the pregnant
ewe:
“It is therefore important to consider the whole winterfeeding strategy all at one, as the
feeding level during any particular phase of pregnancy can not be sensibly decided
without taking into account the previous nutritional history and body condition as well as
the availability and quality of feed for the succeeding period” (Thorsteinsson &
Thorgeirsson, 1989)
The results however raise several questions and ideas for further work in this area; work that
would clear the practical concerns revealed here, such as:
How low can roughage level become to maintain acceptable ewe body condition and
lamb birth weight and growth rate without supplementing
Would different results be obtained with different level of supplementing postpartum
How low level of concentrates fed is enough to stimulate milk production the first
weeks postpartum
How late can supplementing start in order to secure beneficial effect on milk
production

50
Does lack of supplementing and/or supplement type affect availability and metabolism
of the minerals and trace elements pregnant and lactating ewes require to sustain
normal productivity and often receive from supplements
And last but not least, what combination of roughage quality and supplement type and level is
of the best interest, both for the ewe and lamb physiologically and the farmer economically?

51
Appendix
Composition of salt block
Minerals:
Phosphorus (as Dicalcium Phosphate) g kg-1 2,4
Magnesium (as Magnesium oxide) g kg-1 2,1
Sodium (as Sodium Chloride) g kg-1 380
Calcium (as Dicalcium Phosphate) g kg-1 1,5
Trace elements
Manganese (as manganous oxide) mg kg-1 200
Cobalt (as DMP Cobaltous Carbonate mg kg-1 250
Zinc (as Zinc oxide) mg kg-1 125
Iodine (as Calcium Iodate) mg kg-1 250
Selenium (DMP Sodium Selenite) mg kg-1 25
Vitamins
Vitamin D3 iu kg-1 40.000
Composition of mineral and vitamin mix in high energy
supplements:
Cobalt - Co mg kg-1 2
Copper – Cu mg kg-1 30
Iron – Fe mg kg-1 25
Manganese – Mn mg kg-1 100
Selenium – Se mg kg-1 0,35
Iodine – I mg kg-1 5
Zinc – Zn mg kg-1 100
Vitamin A iu g-1 10
Vitamin D3 iu g-1 2,5
Vitamin E - α tocopherol 50
52
References
Andrews, J. F., & Mercer, J. B. (1985). Thermoregulation in the newborn lamb: The first 36 hours. Paper presented at the Factors affecting the survival of newborn lambs - A seminar in the CEC programme of coordination of agricultural research, Brussel.
Annett, R. W., Carson, A. F., & Dawson, L. E. R. (2008). Effects of digestible undegradable protein (DUP) supply and fish oil supplementation of ewes during late pregnancy on colostrums production and lamb output. Animal Feed Science and Techonology, 146, 270-288.
Annison, E. F., Lindsay, D. B., & Nolan, J. V. (2002). Digestion and Metabolism. In M. Freer & H. Dove (Eds.), Sheep nutrition (pp. 95-118). Wallingford: CABI Publishing.
Banchero, G. E., Clariget, P., Bencini, R., Lindsay, D. R., Milton, J. T. B., & Martin, G. B. (2006). Endocrine and metabolic factors involved in the effect of nutrition on the production of colostrum in female sheep. Reprod. Nutr. Dev., 46, 447-460.
Banchero, G. E., Quintans, G., Vazquez, A., Gigena, F., La Manna, A., Lindsay, D. R., et al. (2007). Effect of supplementation of ewes with barley or maize during the last week of pregnancy on colostrum production. Animal 1, 625-630.
Bell, A. W., Burhans, W. S., & Overton , T. R. (2000). Protein nutrition in late pregnancy, maternal protein reserves and lactation performance in dairy cows. Proceedings of the Nutrition Society, 59, 119-126.
Black, J. L. (1983). Growth and development of lambs. In W. Haresign (Ed.), Sheep Production (pp. 576). London: Butterworths.
Cavestany, D., Kulcsar, M., Crespi, D., Chilliard, Y., La Manna, A., Balogh, O., Keresztes, M., Delavaud, C., Huszenicza, G. & Meikle, A. (2009). Effect of Prepartum Energetic Supplementation on Productive and Reproductive Characteristics, and Metabolic and Hormonal Profiles in Dairy Cows under Grazing Conditions. Reproduction in Domestic Animals, 44(4), 663-671.
Chilliard, Y., Ferlay, A., Faulconnier, Y., Bonnet, M., Rouel, J., & Bocquier, F. (2000). Adipose tissue metabolism and its role in adaptions to undernutrition in ruminants. Proceedings of the Nutrition Society, 59, 127-134.
Dawson, L. E. R., Carson, A. F., & Kilpatrick, D. J. (1999). The effect of the digestible undegradable protein of concentrates and protein source offered to ewes in late pregnancy on colostrum production and lamb performance. Animal Feed Science and Techonology, 82, 21-36.
Dawson, L. E. R., Carson, A. F., Kilpatrick, D. J., & Laidlaw, A. S. (2005). Effect of herbage allowance and concentrate food level offered to ewes in late pregnancy on ewe and lamb performance. Animal Science, 81, 413-421.
Dewhurst, R. J., Davies, D. R., & Merry, R. J. (2000). Microbial protein supply from the rumen. Animal Feed Science and Technology, 85(1-2), 1-21.
Dove, H. (2002). Principles of Supplementary Feeding in Sheep-grazing Systems. In M. Freer & H. Dove (Eds.), Sheep nutrition (pp. 119-142). Wallingford: CABI publishing.
Foot, J. Z., & Russel, A. J. F. (1979). The relationship in ewes between voluntary food intake during pregnancy and forage intake during lactation and after weaning. Animal Production, 28, 25-39.
53
Frutos, P., Buratovich, O., Giráldez, F. J., Mantecón, A. R., & Wright, I. A. (1998). Effects on maternal and foetal traits of feeding supplement to grazing pregnant ewes. Animal Science, 66, 667-673.
Gama, L. T., Dickerson, G. E., Young, L. D., & Leymaster, K. A. (1991). Effects of breed, heterosis, age of dam, litter size and birth weight on lamb mortality. Journal of Animal Science, 69, 2727-2743.
Gonzalez, J. J., Robinson, J. J., & Fraser, C. (1985). The effect of physiological state on digestion in the ewe and its influence on the quantity of protein reaching the abomasum. Livestock Production Science, 12, 59-68.
Greenwood, P. L., Hunt, A. S., Hermanson, J. W., & Bell, A. W. (1998). Effects of birth weight and postnatal nutrition on neonatal sheep: I. Body growth and composition and some aspects of energetic efficiency. Journal of Animal Science, 76, 2354-2367.
Guðmundsson, Ó., & Dýrmundsson, Ó. R. (1989). Grazing and lamb growth (Beit og vöxtur lamba). In Ó. R. Dýrmundsson & S. Thorgeirsson (Eds.), Reproduction, growth and nutrition in sheep. Dr. Halldór Pálsson Memorial publication (pp. 147-168). Reykjavík: Búnaðarfélag Íslands og Rannsóknarstofnun landbúnaðarins.
Harano, Y., Ohtsuki, M., Ida, M., Kojima, H., Harada, M., Okanishi, T., et al. (1985). Direct automated assay method for serum or ureine levels of ketone bodies. Clinica Chimica Acta, 151, 177-183.
Harmeyer, J., & Schlumbohm, C. (2006). Pregnancy impairs ketone body disposal in late gestating ewes: Implications for onset of pregnancy toxaemia. Research in Veterinary Science 81, 254-264.
Husted, S. M., Nielsen, M. O., Blache, D., & Ingvartsen, K. L. (2008). Glucose homeostasis and metabolic adaption in the pregnant and lactating sheep are affected by the level of nutrition previously provided during her late fetal life. Domestic animal endocrinology, 34, 419-431.
Husted, S. M., Nielsen, M. O., Tygesen, A., Kiani, A., Blache, D., & Ingvartsen, K. L. (2007). Programming of intermediate metabolism in young lambs affected by late gestational maternal undernourishment. American journal of physiology, endocrinology and metabolism, 293, 548-557.
Imamidoost, R., & Cant, J. P. (2005). Non-steady state modelling of effects of timing and level of concentrate supplementation on ruminal pH and forage intake in high-producing, grazing ewes. Journal of Animal Science, 83, 1102-1115.
Ingvartsen, K. L. (2006). Feeding and management related diseases in the transition cow. Physiological adaptions around calving and strategies to reduce feeding-related diseases. Animal Feed Science and Techonology, 126, 175-213.
Kaur, R., Nandra, K. S., Garcia, S. C., Fulkerson, W. J., & Horadagoda, A. (2008). Efficiency of utilisation of different diets with contrasting forages and concentrate when fed to sheep in a discontinuous feeding pattern. Livestock Science, 119, 77-86.
Kerslake, J. I., Kenyon, P. R., Morris, S. T., Stafford, K. J., & Morel, P. C. H. (2008). Effect of concentrate supplement and sward height on twin bearing ewe body condition and the performance of their offspring. Australian journal of experimental agriculture, 48, 988-994.
Khalaf, A. M., Doxey, D. L., Baxter, J. T., Black, W. J. M., FitzSimons, J., & Ferguson, J. A. (1979). Late pregnancy ewe feeding and lamb performance in early life. 2. Factors associated with perinatal lamb mortality. Animal Production, 29, 401-410.

54
Madsen, J., Hvelplund, T., Weisbjerg, M., Bertilson, J., Olson, I., Spörndly, R., et al. (1995). The AAT/PBV system for ruminants. A revision. . Norwegian Journal of Agricultural Science. Suppl No 19, 37.
McDonald, P., Edwards, R. A., Greenhalgh, J. F. D., & Morgan, C. A. (2002). Animal Nutrition (sixth ed.). London: Pearson Education Limited.
McNeill, D. M., Slepetis, R., Erhardt, R. A., Smith, D. A., & Bell, A. W. (1997). Protein requirements of sheep in late pregnancy: Partioning between gravid uterus and maternal tissues. Journal of Animal Science, 75, 809-816.
Milano, G. D., Hotston-Moore, A., & Lobley, G. E. (2000). Influence of hepatic ammonia removal on ureagenesis, amino acid utilization and energy metabolism in the ovine liver. [Article]. British journal of nutrition, 83(3), 307-315.
Nottle, M. B., Kleemann, D. O., Hockin, V. M., Grosser, T. I., & Seamark, R. F. (1998). Development of a nutritional strategy for increasing lamb survival in merino ewes mated in late spring/early summer. . Animal Reproduction Science, 52, 213-219.
Nørgaard, J. V., Nielsen, M. O., Theil, P. K., Sørensen, M. T., Safayi, S., & Sejrsen, K. (2008). Development of mammary glands of fat sheep submitted to restricted feeding during late pregnancy. Small Ruminant Research, 76, 155-165.
O´Doherty, J. V., & Crosby, T. F. (1997). The effect of diet in late pregnancy on colostrum production and immunoglobulin absorption in sheep. Animal Science, 64, 87-96.
O´Doherty, J. V., & Crosby, T. F. (1998). Blood metabolite concentrations in late pregnant ewes as indicators of nutritional status. Animal Science, 66, 675-683.
Ocak, N., Cam, M. A., & Kuran, M. (2005). The effect of high dietary protein levels during late gestation on colostrum yield an lamb survival rate in singleton bearing ewes. Small Ruminant Research, 56, 89-94.
Oldham, J. D., Buttery, P. J., Swan, H., & Lewis, D. (1977). Interactions between dietary carbohydrate and nitrogen and digestion in sheep. Journal of agricultural science, Cambridge, 89, 467-479.
Orr, R. J., & Treacher, T. T. (1989). The effect of concentrate level on the intake of grass silages by ewes in late pregnancy. Animal Production, 48, 109-120.
Orr, R. J., & Treacher, T. T. (1994). The effect of concentrate level on the intakes of silages or hays by ewes in the 1st month of lactation. Animal Production, 58, 109-116.
Ólafsson, B. L. (1995). AAT-PBV próteinkerfið fyrir jórturdýr [AAT-PBV protein system for ruminants]. Ráðunautafundur 1995, 46-60. [In Icelandic].
Pulido, R. G., Munoz, R., Jara, C., Balocchi, O. A., Smulders, J. P., Wittwer, F., et al. (2010). The effect of pasture allowance and concentrate supplementation type on milk production performance and dry matter intake of autumn-calving dairy cows in early lactation. Livestock Science, 132, 119-125.
Purser, A. F., & Young, G. B. (1959). Lamb survival in two hill flocks. Animal Production, 1, 85-91.
Robinson, J. J. (1983). Nutrition of the pregnant ewe. In W. Haresign (Ed.), Sheep Production (pp. 576). London: Butterworths.
Robinson, J. J., & McDonald, I. (1989). Ewe nutrition, foetal growth and development (Um fóðrun áa og vöxt og þroska fósturs). In Ó. Dýrmundsson & S. Þorgeirsson (Eds.), Reproduction, growth and nutrition in sheep. Dr. Halldór Pálsson Memorial Publication.
Robinson, J. J., Sinclair, K. D., & McEvoy, T. G. (1999). Nutritional effects on foetal growth. Animal Science, 68, 315-331.

55
Roy, A., Laforest, J. P., Castonguay, F., & Brisson, G. J. (1999). Effects of maturity of silage and protein content of concentrates on milk production of ewes rearing twin or triplet lambs. Canadian journal of animal science, 79, 499-508.
Russel, A. J. F. (1984). Means of assessing the adequacy of nutrition of pregnant ewes. Livestock Production Science, 11, 429-436.
Russel, A. J. F., Doney, J. M., & Gunn, R. G. (1969). Subjective assessment of body fat in live sheep. Journal of agricultural science, Cambridge, 72, 451-454.
SAS Institute (2004). SAS/STAT User's Guide, Version 9. SAS Inst. Inc., Cary, NC Scales, G. H., Burton, R. N., & Moss, R. A. (1986). Lamb mortality, birth weight and nutrition
in late pregnancy. New Zealand Journal of Agricultural Research, 29, 75-82. Schlumbohm, C., & Harmeyer, J. (2004). Hyperketonemia impairs glucose metabolism in
pregnant and nonpregnant ewes. Journal of Dairy Science, 87, 350-358. Schmidt, E., & Schmidt, F. W. (1995). Glutamate dehydrogenase (EU 1.4.1.3). In H. U.
Bergmeyer (Ed.), Methods of Enzymatic Analysis 3th edition. Weinheim, Germany. Sormunen-Cristiana, R., & Jauhiainen, L. (2001). Comparison of hay and silage for pregnant
and lactating Finnish Landrace ewes. Small Ruminant Research, 39, 47-57. Speijers, M. H. M., Fraser, M. D., Haresign, W., Theobald, V. J., & Moorby, J. M. (2005).
Effects of ensiled forage legumes on performance of twin bearing ewes and their progeny. . Animal Science, 81, 271-282.
Suagee, J. K., Corl, B. A., Crisman, M. V., Wearn, J. G., McCutcheon, L. J., & Geor, R. J. (2010). De novo fatty acid synthesis and NADPH generation in equine adipose and liver tissue. Comparative Biochemistry and Physiology B-Biochemistry & Molecular Biology, 155(3), 322-326.
Sveinbjörnsson, J., & Ólafsson, B. L. (1999). Orkuþarfir sauðfjár og nautgripa í vexti með hliðsjón af mjólkurfóðureiningakerfi [Energy requirements of sheep and growing cattle with respect to milk feed unit system]. Ráðunautafundur 1999, 127 - 204.
Thorgeirsson, S., & Thorsteinsson, S. S. (1989). Growth, development and carcass characteristics (vöxtur, þroski og kjötgæði). In Ó. R. Dýrmundsson & S. Thorgeirsson (Eds.), Reproduction, growth and nutrition in sheep. Dr. Halldór Pálsson Memorial publication (pp. 169-204). Reykjavík: Búnaðarfélag Íslands og Rannsóknarstofnun landbúnaðarins.
Thorsteinsson, S. S., Sigurðsson, I. G., & Jónsson, S. (1993). Prótein í fóðri tvílembna eftir burð [Protein in the postpartum diet of twin bearing ewes]. Ráðunautafundur 1993. [In Icelandic].
Thorsteinsson, S. S., & Thorgeirsson, S. (1989). Winterfeeding, housing and management (Vetrarfóðrun og hirðing fjár). In Ó. R. Dýrmundsson & S. Thorgeirsson (Eds.), Reproduction, growth and nutrition in sheep. Dr Halldór Pálsson, Memorial Publication. Reykjavík: Búnaðarfélag Íslands og Rannsóknarstofnun landbúnaðarins.
Tilley, J. M. A., & Terry, R. A. (1963). A two-stage technique for the in vitro digestion of forage crops. . Journal of British Grassland Society, 18, 104-111.
Tolkamp, B. J., Yearsley, J. M., Gordon, I. J., Illius, A. W., Speakman, J. R., & Kyriazakis, I. (2007). Predicting the effects of body fatness on food intake and performance of sheep. British journal of nutrition, 97, 1206-1215.
Treacher, T. T. (1983). Nutrient requirements for lactation in the ewe. In W. Haresign (Ed.), Sheep Production (pp. 576). London: Butterworths.

56
Van Soest, P. J., Robertson, J. B., & Lewis, B. A. (1991). Methods for Dietary Fiber, Neutral Detergent Fiber, and Nonstarch Polysaccharides in Relation to Animal Nutrition. Journal of Dairy Science, 74, 3583-3597.
Warren, J. T., & Mysterud, I. (1995). Mortality of domestic sheep in free ranging flocks in southeastern Norway. Journal of Animal Science, 73, 1012-1018.
Withers, P. C. (1998). Urea: Diverse functions of a 'waste' product. [Article]. Clinical and Experimental Pharmacology and Physiology, 25(9), 722-727.

1
Energy and protein in the diet of ewes in late pregnancy: Effect on ewe feed intake, life weight, body condition and concentration of plasma metabolites
Hallfríður Ósk Ólafsdóttir
Jóhannes Sveinbjörnsson AND
Grétar Hrafn Harðarson Agricultural University of Iceland, Hvanneyri, 311 Borgarnes, Iceland
E-mail: [email protected] [email protected] [email protected]
ABSTRACT
Effects of feeding different types of concentrates to ewes during late pregnancy on
feed intake, body weight, body condition score (BCS) and concentration of blood metabolites
were tested on 48 ewes during the last month prepartum. Ewes were assigned to four
treatments, each containing equal numbers of single- twin- and triplet bearing ewes. Three
groups (MIX, EN and PRO) were fed, along with ad libitum haylage, supplements differing in
protein type and content, but the fourth group (CTR) was only fed haylage. Ewes were
weighed and condition scored before and after the experimental period, haylage intake
measured and blood samples collected weekly for analysis of metabolites. Supplemented ewes
ate significantly less haylage than CTR ewes. Ewe weight and BCS as well as weight and BCS
change did not differ significantly between treatments. Single bearing ewes gained less weight
and were lighter at parturition than other while triplet bearing ewes had the lowest BCS and
lost condition in all supplemented treatments. Treatment affected glucose, BHB, urea, ureic
acid, AST, ICDH and calcium levels significantly, BHB and urea level increased with higher
levels of undegradable protein. Glucose, urea, ureic acid and ICDH levels were also affected
by litter size, single bearing ewes having lower levels for ICDH, urea and ureic acid but the
highest glucose levels.
Keywords: DM intake, late-pregnancy, metabolites, nutrition, protein, sheep
2
Yfirlit
Áhrif af fóðrun með mismunandi kjarnfóðurtegundum á átgetu, lífþunga, holdastig og
styrkleika efnaskiptaafurða í blóði voru prófuð á 48 ám á síðasta mánuði meðgöngu. Ánum
var skipt í fjóra hópa sem hver innihélt jafnan fjölda einlemba, tvílemba og þrílemba. Þremur
hópanna (MIX, EN og PRO) var gefið, til viðbótar við hey eftir átlyst, kjarnfóður sem innihélt
prótein af ólíkum uppruna. Fjórði hópurinn (CTR) var samanburðarhópur sem var eingöngu
fóðraður á heyi eftir átlyst. Ærnar voru vigtaðar og holdastigaðar í upphafi og lok tilraunar,
heyát mælt daglega og blóðsýni tekin vikulega til mælinga á efnaskiptaafurðum. Ærnar í
kjarnfóðurhópunum átu marktækt minna hey en CTR ærnar. Meðferð hafði ekki marktæk áhrif
á þunga, holdastig og breytingar á þessum þáttum frá upphafi til enda tilraunarinnar.
Einlembur þyngdust minna og voru léttari við burð en tvílembur og þrílembur en þær síðast
nefndu höfðu lægst holdastig við burð og töpuðu holdum í öllum kjarnfóðurhópunum.
Fóðrunarmeðferð hafði marktæk áhrif á styrk glúkósa, BHB, úrefnis, þvagsýru, AST og ICDH
og kalks í blóði. Styrkur BHB og úrefnis í blóði jókst með auknu magni af torleystu próteini í
kjarnfóðri. Styrkur glúkósa, úrefnis, þvagsýru og ICDH var einnig háður fjölda fóstra og höfðu
einlembur lægstan styrk ICDH, úrefnis og þvagsýru en hæstan af glúkósa.
Lykilorð: Efnaskiptaafurðir, Fóðrun, Heyát, Meðganga, Prótein, Sauðfé,
INTRODUCTION
Energy and protein requirements of twin bearing ewes are raised by over 80% and
100% respectively during the last six weeks prepartum (Ólafsson 1995, Sveinbjörnsson &
Ólafsson 1999). At the same time availability of nutrients is often decreased due to lowered
eating capacity. This creates a great challenge for the pregnant ewe. It has generally been
3
believed that this challenge is rarely met unless the ewe is fed significant amount of
concentrate in addition to high quality roughage (Robinson 1983).
The main energetic substrates for foetal development and colostrum production are
amino acids and glucose (Banchero et al. 2006, Ingvartsen 2006). Since very little glucose is
absorbed directly from the rumen, nutrition of the pregnant ewe aims at providing enough
glucogenic substrates for adequate glucose production (Annison et al. 2002). The growing
foetus and developing mammary tissues require great amount of amino acids. In addition to
the amino acids serving as glucogenic substrates dietary protein has been considered important
for the ewes ability to mobilize tissues from her body. This mobilization is needed to fill the
gap between the requirements of the growing conceptus and available nutrients from the diet.
In that matter undegradable protein has been considered especially useful since research have
shown greater response for increased level of undegradable protein than microbial protein
(Frutos et al. 1998, McNeill et al. 1997, O´Doherty & Crosby, 1998). However, some
researchers have found that effect to be highly linked to condition of the ewe as well as other
qualities of the diet offered (Bell et al. 2000, Dawson et al.1999, Nottle et al. 1998).
Concentrate feeding, if not practised systematically and relative to other diet as well as
condition of the ewe, can cause metabolic disorders such as rumen acidocis and fatty liver
(Imamidoost & Cant 2005) as well as reduced degradability of the other nutrients fed to the
ewe (Kaur et al. 2008). Ewe weight and BCS can be used as an indicator of the ewes
nutritional status and thereupon her ability to fill nutrient requirements by mobilizing body
reserves (Chilliard et al. 2000, Russel 1984, Thorsteinsson & Thorgeirsson 1989).
As indicators of nutritional efficiency, ewe weight and BCS have the disadvantage that
it only presents adequacy of nutrition on a longer term basis. (O´Doherty & Crosby 1998,
Russel 1984). More immediate information can be gained by measuring concentration of some
4
metabolites in plasma since several metabolitical adaptions take place in the body of the
pregnant animal (Ingvartsen 2006). In addition to revealing the metabolical status of the
animal, these metabolites can indicate if the animal is in risk of developing metabolic
disorders.
The aim of the experiment described below was to test the effect of different
concentrate types, especially with regard to type of dietary protein, fed to ewes in late
pregnancy on ewe weight and BCS as well as feed intake and concentration of metabolites in
plasma. A subsequent paper (Ólafsdóttir et al. 2012b) describes the effect of prepartum
supplementing on lamb birth weight and growth rate.
MATERIALS AND METHODS
Experimental animal housing and feeding
The research took place at Hestur, the experimental sheep farm of the Icelandic
agricultural university. Forty-eight pregnant ewes of the native Icelandic flock were allocated
to one of four dietary treatments (n=12) from 30-39 days pre-lambing until lambing, each
treatment group containing equal numbers of single, twin and triplet bearing ewes. All
treatment, before and after the experimental period, was as traditional at the farm.
Treatment groups were balanced for ewe BCS in February, age, expected lambing date
and index for mothering ability, evaluated on the scale 0.1-9.9. For calculation of this index
each farms average ewe output is set as the index five and deviation of ewes output from the
mean results in their index raising or decreasing to certain level. Each group was divided into
two replications (n=6) that were penned and fed separately.

5
All groups were ad libitum fed grass haylage from round bales and had free access to
water and salt block with mineral and trace elements. Otherwise the treatments were as listed
below:
Control group (CTR): Fed only haylage throughout the experiment.
Mixed supplement group (MIX): Fed increasing ration of a mixture of high protein and
high energy concentrates from day 9 of the experiment.
Energy supplement group (EN): Fed increasing ration of high energy concentrates
from day 9 of the experiment.
Protein supplement group (PRO): Fed increasing ration of high protein concentrates
from day 9 of the experiment.
The high energy concentrate consisted of 50% wheat-bran, 41.75% maize, 5%
molasses, 2% shell calcium, 1% feedsalt and 0.25% mineral mix. The high protein concentrate
however consisted of 69% fish meal, 30% barley, 1% magnesium phosphate and 0.1% E-
vitamin. Chemical composition of haylage and concentrates is listed in Table 1.
Concentrates were fed in one single portion in the morning. Daily rations increased
regularly until lambing, rations aiming at supplying all concentrate-fed groups with the same
amount of total g AAT day-1 ewe-1 at each time. Daily ration of supplements at each time is
presented in Table 2.
Litter sizes were balanced to two lambs per ewe directly after birth. Within 24 hours
lambs were weighed, ear tagged and sex and colour registered. Feeding and all treatment and
measurements of ewes and lambs postpartum are described in a companion paper (Ólafsdóttir
et al. 2012b).
Measurement, data sampling and chemical analysis

6
For each treatment, haylage intake was recorded every day from day three, until
lambing of the first ewe. Daily intake is calculated as mean intake of each replication – that is:
(replication allowance-replication refusals)/number of ewes in replication). Samples were
taken daily from both haylage and refusals and frozen down for later dry matter and chemical
analyses. All feed and refusal samples were analyzed for dry matter, digestibility, energy (FEm
kg DM-1) crude protein (g kg DM-1), AAT (g kg DM-1), PBV (g kg DM-1) and Neutral
Detergent Fibre (NDF, g kg DM-1). Crude protein was measured using the Kjeldahl method,
and AAT and PBV values were calculated according to Madsen et al. (1995). NDF was
determined using ANKOM technology on Van Soest method (Van Soest et al. 1991) and for
dry matter digestibility modified method of Tilley and Terry (Tilley & Terry 1963).
Ewe weight and BCS according to the five unit scale described by Russel et al.(1969)
was recorded on day one and 28 of the experiment.
Blood samples were collected every week from half of the ewes from each treatment,
six or seven samples per ewe depending on the day of lambing. The second last sample was
taken as representative of the ewe at lambing and the last representing the changes occurring
the first days (5-9) postpartum. Blood samples were collected from jugular vein by
venipuncture using 9 ml Lithium Heparin vacuette® (grainer bio-one) vacutainer. Samples
were immediately placed on ice and then centrifuged for 20 minutes. Plasma was collected
into 4 ml tubes and frozen down for later analysis.
For plasma glucose, AST, GGT, urea and uric acid determination standard procedures
(Siemens Diagnostics® Clinical Methods for ADVIA 1650) were used and for NEFA the
Wako, NEFA C ACS-ACOD assay method. Increase in absorbance at 340 nm due to the
production of NADH, at slightly alkaline pH in the presence of ß-OH-butyrate dehydrogenase
was used to determine BHB. Sample blank was included and the method involved oxamic acid

7
in the media to inhibit lactate dehydrogenase as proposed by Harano et al. (1985). Activity of
GLDH was quantified in a kinetic, colorimetric assay according to Schmidt & Schmidt (1995).
ICDH was also determined in a kinetic, colorimetric assay using isocitrate as substrate and
NADPH2 as response parameter. The autoanalyzer ADVIA 1650® Chemistry System
(Siemens Medical Solutions, Tarrytown, NY 10591, USA) was used for all analyzes.
Statistical analysis
Data was analyzed using the REML method of SAS Enterprise Guide 4.1 and 4.2 (SAS
institute, 2004) mixed model analyze. When response variable was individual ewe information
such as ewe BCS and weight we used the following model:
Yijkl = µ + Ti + Lj + Ak + Dl + (T x L)ij + εijkl
Where Yijkl is the response variable, µ is the overall mean of the population, Ti is the mean of
the experimental treatment (i = 1-4), Lj is the mean effect of litter size (j = 1-3), Ak is the
effect of ewe age (k = 3-8) and Dl is the effect of length of the treatment (number of days from
onset of the experiment until lambing; l = 30-39), (T x L)ij is the interaction between treatment
and litter size and εijkl represents the unexplained residual elements that are assumed to be
independent and normally distributed. Those effects were always included in the model when
estimating individual ewe information though they did not affect response variable
significantly in all cases.
For concentration of blood metabolites we used the following models:
Yijkl = µ + Ti + Lj + Sm + Ak + Wl + ((T x W)il or (L x W)jl) + εijkl
Where Yijkl is the response variable, µ is the overall mean of the population, Ti is the mean of
the experimental treatment (i = 1-4), Lj is the mean effect of litter size (j = 1-3), Ak is the
effect of ewe age (k = 3-8) and Wl is the effect of weeks from parturition (l = -6 -1; week 0
being the second last sampling and representing the status of blood metabolites at parturition).

8
(T x W)il or (L x W)jl are the interaction between either treatment and weeks from parturition
or litter size and weeks from parturition respectively. εijkl represents the unexplained residual
elements that are assumed to be independent and normally distributed.
Those effects listed in the formulas above all affected the response variable at some
level and therefore they were always included in the model when estimating each factor, even
though they did not affect response variable significantly in all cases.
RESULTS
Dry matter, energy and protein intake
Table 3 presents intake of DM, energy (FEm day-1 ewe-1) and protein (g AAT day-1
ewe-1) from haylage exclusively. Haylage intake was similar among the supplemented
treatments while the CTR group had the highest intake from the second week of the
experiment. However, the difference did not become significant until the third week when
intake of supplemented ewes decreased to a greater extent than that of the CTR ewes that in
fact increased their intake again the last week of measurements.
Table 4 presents total DM, energy (FEm) and protein (gAAT) intake of treatment
groups, including concentrates, week by week.
Least square means for treatments as presented in tables 3 and 4 were adjusted for
experimental week, number of days on experimental diet and interaction between treatment
and experimental week. P-values for these factors are presented below the tables.
Ewe weight and body condition
Average ewe weight at the beginning of the experiment was 82 kg and BCS 3.8. The
only factor significantly affecting ewe weight after the four weeks of experimental treatment
was age (p < 0.05) while litter size had the greatest effect on weight change during the

9
experiment. Neither treatment, litter size, ewe age, length of experimental treatment nor
interaction between treatment and litter size affected BCS in late april significantly though
BCS changes were affected by both litter size and length of experimental treatment.
Ewe weight in end of April did not differ significantly between treatments but single
bearing ewes were significantly lighter than twin- and triplet bearing ewes. BCS was higher in
the MIX group but the difference was not significant between any of the treatments. BCS of
triplet bearing ewes was significantly lower than of those bearing singles or twins, the latter
two showing very little difference. Weight and BCS changes during the experimental period
are presented in Tables 5 and 6. Means regarding BCS and ewe weight, both for treatment and
litter size, are adjusted for ewe age, length of experimental treatment and interaction between
treatment and litter size (ADJ mean).
Lowest weight change was found for the CTR group; its weight change being more
than one kg less than the group where weight change was the second lowest and significantly
less than the PRO group which had the highest weight gain but did not differ significantly
from the MIX and EN treatments. Changes in BCS during the experiment were smallest in the
EN group although group differences in this respect were not significant. Triplet bearing ewes
lost condition during this period except from those in the CTR group where all litter sizes
gained condition at the same level.
Plasma concentrations of metabolites
Table 7 presents adjusted LSD means for all metabolites analyzed by litter sizes but
adjusted LSD means for plasma metabolites by treatments and experimental weeks can be
seen in Tables 8-17.
Treatment affected glucose level significantly but the main difference was found for
the EN group. That was particularly the case in the last two weeks before parturition when

10
glucose levels in the EN group was raised while it remained rather constant in the other groups
throughout the experimental period. Postpartum glucose level was elevated in the PRO group
while it either decreased or remained constant in the other groups. Means of all metabolite
concentration, both for treatment and experimental week are adjusted for ewe age, weeks from
parturition and interaction between treatment and weeks from parturition (ADJ mean).
Table 7 reveals that triplet bearing ewes had significantly lower glucose levels than
others. This difference however was only present prepartum, the difference evened out at
parturition when glucose level of the single and twin bearing ewes dropped.
Weeks from parturition were the only factor significantly affecting plasma NEFA
level. Even though treatment in general did not have significant effect on NEFA, the CTR
group level was significantly higher than the other groups, the difference being present from
starting of supplementing. NEFA levels in the supplemented groups were similar throughout
the experimental period, remaining rather constant until the week before parturition when all
treatment groups had elevated plasma concentrations. NEFA levels in single bearing ewes
were lower than in those carrying twins and triplets but the same pattern was found as in group
means; levels remained similar until parturition approached, when it was strongly elevated.
Plasma BHB levels were significantly affected by ewe age, treatment and weeks from
parturition. The BHB level differed significantly between all groups except between the MIX
and PRO groups. Furthermore, those two treatments had higher levels than found in the other
groups but the EN group had BHB levels significantly lower than all the others. In general
BHB levels had the same trend within all treatments and litter sizes during the experiment;
increased until about week before parturition when it started to decrease gradually throughout
the experimental period.

11
Treatment, litter size and weeks from parturition all affected plasma urea level
significantly. Strongest treatment effects were found for the PRO group that had higher urea
levels from beginning of supplementing. The EN group had the lowest level, though not
significantly different from CTR and MIX group. In all treatment groups urea level decreased
when supplementing started and then remained stable until parturition when it increased again.
Triplet bearing ewes had most of the time lower plasma urea levels than those carrying singles
and twins and all litter sizes differed significantly from the others.
Uric acid level in plasma was significantly affected by treatment, litter size and weeks
from parturition. The only treatment group that differed significantly from the others was the
EN group that had higher levels from beginning of supplementing throughout the experiment.
The CTR group had most of the time the lowest values for uric acid though the difference was
not significant.
The liver enzymes (AST, GGT, GLDH, ICDH) levels are all significantly affected by
weeks from parturition. Those effects are highly significant and showing the same trend within
all treatments and litter sizes for both AST and GLDH which remained stable prepartum but
increased rapidly at parturition. GGT and ICDH also increased during the experiment but
more gradually from the start of the measurements.
AST was significantly affected by treatment, the MIX and PRO groups being higher
than the other two at all times, though only significantly higher than the EN group. Levels of
the PRO group were especially high in the second last measurement which would represent
the status at parturition. Litter size did not affect AST level significantly though single bearing
ewes had significantly higher levels than those carrying triplets.

12
Ewe age had highly significant effect on GGT levels in plasma but neither treatment
nor litter size did, although treatment effect were close to significance with p-value of 0.06.
However, GGT levels of the CTR group were significantly higher than MIX and PRO groups.
The EN group did not differ significantly from any of the others, even though it had slightly
higher level than the PRO group. The MIX and PRO groups also differed from the others in
that their levels increased after birth from levels below the CTR and EN groups up to levels
similar or above. No difference was found for litter size except that GGT levels of triplet
bearing ewes increased more postpartum than single- and twin bearing ewe levels.
GLDH was significantly affected by litter size which all differed significantly from
each other. Single bearing ewes had the highest levels but showed the same trend along the
experimental time as ewes carrying twins and triplets, except for increased level in
experimental week two. Twin and triplet bearing ewes had similar GLDH level during the
experimental period and the significance of the difference between them was most likely due
to a smaller increase of GLDH level in the triplet bearing ewes postpartum. The three
supplemented groups had lower levels of GLDH than the CTR group the whole experimental
period, except for the measurement representing parturition when all levels were similar. The
CTR group differed significantly from the MIX and EN groups but not PRO.
Weeks from parturition, treatment and litter size all affected ICDH level significantly.
As for the GLDH the supplemented treatments had lower level of ICDH than the CTR group
except in two measurements when levels of the MIX and PRO groups were elevated above the
others. The difference between the CTR group and the supplemented was significant but none
of the supplemented differed from one another. Except from the last measurement plasma
ICDH level was lower in single bearing ewes than in those carrying twins or triplets. This is in
contrast with the other liver enzymes measured where single bearing ewes usually had higher

13
plasma levels, if any difference. However, postpartum ICDH level in the triplet bearing ewes
increased while it decreased in the single and twin bearing ewes resulting in quite similar
ICDH levels in the end of the period and non-significant difference between single- and triplet
bearing ewes.
Calcium level in plasma was significantly affected by both treatment and weeks from
parturition. Ewe age effect also approached significance with p-value of 0.078.
Plasma calcium levels remained stable until parturition. Even though differences were
significant between the CTR group and the other treatments very little group difference can
actually be seen. CTR group levels were slightly lower in the middle of the prepartum period
and levels of the EN group ewes were decreased around parturition but, as in the other groups,
increased quickly again postpartum. No clear effect were found of litter size on plasma
calcium level. Pattern of calcium level changes between litter sizes were not as constant as
between treatments but in general showed the same trend; little difference from week to week
prepartum, dropped around parturition and rose again postpartum – except for single bearing
ewes where plasma calcium continued to decrease.
DISCUSSION
Dry matter, energy and protein intake
In contrast with previously published research (Robinson 1983) these results indicate
that with high quality roughage, ewes in late pregnancy are able to consume enough energy
and protein to meet the calculated requirements of a twin bearing ewe, at least until
parturition. As suggested by Annett & Carson (2005) and Thorsteinsson & Thorgeirsson
(1989) high quality of the roughage used, in this case 0.86 FEm and 83.9 gAAT (170 g crude
protein) per kg DM, is probably a key factor in that matter, allowing high level of DM intake
14
throughout the experimental period. However, those calculated requirements (Ólafsson 1995,
Sveinbjörnsson & Ólafsson 1999) can be questioned due to increased birth weight of lambs
the last decades. At the time requirements were last estimated birth weight of singles and twins
was similar or lower than it is of triplets and twins, respectively, on the same farm today
(Thorsteinsson & Thorgeirsson 1989 Thorsteinsson et. al 1993), indicating underestimation of
requirements. The increasing level of DM intake of the CTR ewes throughout the experiment
is in contrast with Orr & Treacher (1989) and Speijers et al.(2005) that found feed intake to
decrease as parturition approached. Since individual feeding was not possible this time it can
not be assessed whether litter size or other individual difference affected eating capacity in late
pregnancy as stated by Orr & Treacher (1989). Therefore it remains unknown whether ewes of
all litter sizes were able to meet their requirements with the roughage exclusively but
assuming equal DMI with all litter sizes and requirements as they have been defined until now
only triplet bearing ewes would have been fed below requirements.
Decreased roughage intake found with increased supplementing –a phenomenon
known as substitution- is probably to some extent result of the high quality roughage offered.
It is particularly when feeding rather low quality roughage that concentrate feeding serves
completely supplementary to other diet offered (Dawson et al. 2005, Frutos et al. 1998,
Kerslake et al. 2008).
Ewe weight and body condition
All treatment groups and litter sizes gained weight during the last month prepartum as
expected due to the rapid growth of the conceptus. Lack of treatment effects on ewe weight
and weight changes the last month prepartum however is in disagreement with both Dawson et
al.(2005) and O´Doherty & Crosby (1997) that found increased protein supplementing and
herbage allowance to induce live weight gain. As for the feed intake, high quality of the
15
roughage offered could be the reason as roughage allowance was the same for all treatments.
Kerslake et al. (2008) found less effect of supplementing on live weight and weight gain when
roughage quality was raised. Greater weight of the gravid uterus and related tissues in ewes
carrying multiple litters explains significant difference between litter sizes and is in agreement
with Sormunen-Cristiana & Jauhiainen (2001).
Since both Annett et al. (2008), Husted et al. (2008) and Kerslake et al. (2008) failed to
connect BCS and prepartum BCS changes to feeding level, lack of treatment effect in our case
is not surprising. Though the CTR group was the one most likely to be undernourished it was
the only treatment where neither single, twin or triplet bearing ewes lost condition. That
supports the finding of for example Frutos et al. (1998), McNeill et al. (1997) and
Thorsteinsson et al. (1993) that supplementary protein induces mobilization of body tissue.
Possible reason, among many others, for these effects of supplementary protein could be that
gluconeogenesis from amino acids provides energy necessary for lipo- and proteolysis
(Dawson et al. 2005, Chilliard et al. 2000, Cavestany et al, 2009). Condition loss of the triplet
bearing ewes in the supplemented groups was as expected and supports that assumption
(Frutos et al. 1998, McNeill et al. 1997), the gap between requirements and intake, as
mentioned in the previous section, probably being greater for them than others. However, due
to the great feed intake and high quality of diet the supplemented ewes, except for the triplet
bearing, should not have needed extensive fat mobilization. Further research are required
regarding eating capacity of ewes carrying different litter sizes as well as the effect of different
physiological status, BCS and feed quality on, for example, passage rate of digesta and uptake
and utilization of nutrients.
Blood metabolites

16
As suggested by O´Doherty & Crosby (1998), high quality of diet as well as great
eating capacity is likely to have decreased the positive effect of high energy concentrate on
plasma glucose and resulted in lack of difference between MIX and EN groups compared to
CTR. Plasma glucose responses rapidly to changes in intake of glucogenic substrates as well
as changes in glucose requirements. Therefore lower levels of glucose in the plasma of triplet
bearing ewes were expected due to their greater needs and possibly lower feeding level.
According to Frutos et al. (1998), McNeill et al. (1997) and Chilliard et al. (2000), a
greater supply of gluconeogenic substrates in the supplemented ewes, though not reflected in
glucose level, would have been expected to increase their ability for fat mobilization.
However, based on the requirements of twin bearing ewes as they are defined in Ólafsson
(1995) and Sveinbjörnsson & Ólafsson (1999) and the roughage intake measured here, little
mobilization should have been needed since even non-supplemented ewes consumed enough
to fill energy and protein requirements (Dawson et al. 1999). Lack of changes in BCS of single
and twin bearing ewes support that. Effect of litter size on NEFA concentration were as
expected with single bearing ewes, having the least need to rely on body reserves, having the
lowest level at almost all times. Though plasma level of NEFA is known to indicate magnitude
of mobilization of body reserves, changes in BCS of the supplemented triplet bearing ewes are
not reflected in NEFA level. In this matter it has to be kept in mind that NEFA levels in
plasma are sensitive to stress in the experimental animal during sampling (Speijers et al. 2005)
Though results regarding NEFA level were somewhat surprising, a greatly rising level around
parturition at the same time as energy requirements are greatly elevated, were as expected.
BHB difference between treatments and sampling dates is not as similar to the pattern
found for NEFA as could be expected with the two metabolites both indicating fat
mobilization. Higher BHB level in the MIX and PRO treatments than others are in agreement

17
with older research work that found protein supplements to stimulate fat mobilization
(Chilliard et al. 2000, Frutos et al. 1998, McNeill et al. 1997). Lowest level of BHB in the EN
group however is suprising, those ewes receiving the same amount of AAT as the other
supplemented groups. That could indicate some advantage of undegradable protein
supplements above microbial protein as a fuel for body tissue mobilization. As mentioned for
the NEFA level, effect of supplementing on BHB level is somewhat surprising because of the
high intake and quality of diet of all treatments which would be expected to minimize the need
for body tissue mobilization. Little effect of litter size does not indicate large fat mobilization
in the triplet bearing ewes, in spite of their loss of BCS during the experiment. Good condition
of the experimental ewes can affect the results found for BHB as O´Doherty & Crosby (1998)
and Speijers et al. (2005) found that with increased BCS of ewes, relationship between dietary
energy and plasma BHB concentration was decreased.
Animal condition, among other factors, could explain some of the difference between
our results and those from Banchero et al. (2006) and O´Doherty & Crosby (1998) that failed
to detect effects of protein supplements on plasma urea. Assuming that urea concentration in
plasma gives information on the efficiency of protein nutrition our results indicate quite
extensive waste of the expensive undegradable protein supplemented to ewes in the PRO
group. It is however interesting that urea level in the PRO group was that much higher than in
the MIX and EN groups since all supplement rations aimed at supplying the ewes with the
same amount of dietary protein, measured as gAAT ewe-1 day-1 the difference only consisting
in the origin of the protein. This discrepancy could be caused by difference in energy intake
between treatments as well as the balance between energy and protein in the digestive tract.
Because of higher protein requirements of triplet bearing ewes, significantly lower level of

18
plasma urea in those was expected and indicates higher utilization and better efficiency of
dietary protein.
Level of the liver enzymes tested, reaching maximum around parturition, reveals the
increase in metabolic stress when requirements rise in late gestation and early lactation. Since
energy and protein requirements in the MIX and PRO treatments should have been met just as
well as in the EN group it is surprising that AST level around parturition was significantly
higher in the MIX and PRO than in the EN treatment. It is possible, at least for the PRO
treatment, that this is some effect of the excess ammonia the liver needs to convert as
indicated by the elevated urea level in that treatment compared to others. For the MIX group
this however can barely be the explanation since urea level in that treatment does not indicate
increased urea production above others. Postpartum AST and GLDH level was highest in the
CTR group indicating increased stress in the liver of non-supplemented ewes and subsequent
release of liver enzymes to the blood. That is in accordance with the slightly highest NEFA
level in the CTR ewes which suggests mobilization of body fat. Lower levels of GGT and
ICDH in the MIX and PRO group are in disagreement with results for BHB that indicated
stronger effect of undegradable than microbial protein supplement on body tissue
mobilization. That however confirms other results from this research that reveal limited effect
of supplying ewes with undegradable protein above other supplements on fat mobilization.
That kind of limitations have in other research work been linked to good condition of the ewes
as well as high quality diet fed which is likely to be the reason in our case. Furthermore, it
should be kept in mind that moderate fat mobilization is not likely to cause strong response in
the plasma metabolites viewed in this project.
Calcium level in plasma reflects the sudden increases in requirements occurring at
onset of lactation. High calcium level in the PRO and MIX supplements results in plasma

19
calcium level of ewes receiving those supplements falling less around parturition than in the
EN treatment. That reveals the importance of choosing supplements with regard to other
nutrients than just energy and protein.
CONCLUSION
As nutrient requirements of pregnant ewes is defined today requirements of single and twin
bearing ewes can be met without concentrate feeding until parturition and triplet bearing ewes
do not need supplementing until the last week prepartum. Roughage quality as well as
previous condition of the ewes probably are key factors in that matter and further research is
needed regarding the effects of supplements when roughage quality and BCS are of greater
diversity. Supplementing seems to affect the ewes ability to mobilize fat from body reserves
for energy production when basal diet is not filling energy needs, possibly due to use of
supplementary protein as an glucogenic substrate for the energy requiring process of lipolysis
in adipose tissues. Concentration of different plasma metabolites however are rather
inconsistent in that matter but high energy level in all treatments could affect those results.
. ACKNOWLEDGEMENTS
The authors want to thank financial support from the presidium of farmproduct
agreement (framkvæmdanefnd búvörusamninga). Furthermore we want to thank the staff at
the experimental farm, Hestur, spring 2008 and at the laboratories of the Icelandic Agricultural
University and Aarhus University with their assistant regarding management of the
experiment as well as the chemical analysis performed on feedstuff and plasma.
REFERENCES

20
Annett RW & Carson AF 2005. The effect of digestible undegradable protein (DUP) content of concentrates on colostrum production and lamb performance of triplet-bearing ewes on grass-based diets during late pregnancy. Animal Science 80, 101-110. Annett RW, Carson AF & Dawson LER 2008. Effects of digestible undegradable protein (DUP) supply and fish oil supplementation of ewes during late pregnancy on colostrums production and lamb output. Animal Feed Science and Techonology, 146, 270-288. Annison EF, Lindsay DB & Nolan JV 2002. Digestion and Metabolism. In M. Freer & H. Dove (Eds.), Sheep nutrition (pp. 95-118). Wallingford: CABI Publishing. Banchero GE, Clariget P, Bencini R, Lindsay DR, Milton JTB & Martin GB 2006. Endocrine and metabolic factors involved in the effect of nutrition on the production of colostrum in female sheep. Reprod. Nutr. Dev., 46, 447-460. Bell AW, Burhans WS & Overton TR 2000. Protein nutrition in late pregnancy, maternal protein reserves and lactation performance in dairy cows. Proceedings of the Nutrition Society, 59, 119-126. Cavestany D, Kulcsar M, Crespi D, Chilliard Y, La Manna A, Balogh O, Keresztes M, Delavaud C, Huszenicza G & Meikle A 2009. Effect of Prepartum Energetic Supplementation on Productive and Reproductive Characteristics, and Metabolic and Hormonal Profiles in Dairy Cows under Grazing Conditions. Reproduction in Domestic Animals, 44(4), 663-671. Chilliard Y, FerlayA, Faulconnier Y, Bonnet M, Rouel J & Bocquier F (2000). Adipose tissue metabolism and its role in adaptions to undernutrition in ruminants. Proceedings of the Nutrition Society, 59, 127-134. Dawson LER, Carson AF & Kilpatrick DJ 1999. The effect of the digestible undegradable protein of concentrates and protein source offered to ewes in late pregnancy on colostrum production and lamb performance. Animal Feed Science and Techonology, 82, 21-36. Dawson LER, Carson AF, Kilpatrick DJ & Laidlaw AS 2005. Effect of herbage allowance and concentrate food level offered to ewes in late pregnancy on ewe and lamb performance. Animal Science, 81, 413-421. Frutos P, Buratovich O, Giráldez FJ, Mantecón AR & Wright IA 1998. Effects on maternal and foetal traits of feeding supplement to grazing pregnant ewes. Animal Science, 66, 667-673. Harano Y, Ohtsuki M, Ida M, Kojima H, Harada M, Okanishi, T, Kashiwagi A, Ochi Y, Uno S & Sihigeta Y 1985. Direct automated assay method for serum or ureine levels of ketone bodies. Clinica Chimica Acta, 151, 177-183. Husted SM, Nielsen MO, Blache D & Ingvartsen KL 2008. Glucose homeostasis and metabolic adaption in the pregnant and lactating sheep are affected by the level of nutrition previously provided during her late fetal life. Domestic animal endocrinology, 34, 419-431. Imamidoost R & Cant JP 2005. Non-steady state modelling of effects of timing and level of concentrate supplementation on ruminal pH and forage intake in high-producing, grazing ewes. Journal of Animal Science, 83, 1102-1115. Ingvartsen KL 2006. Feeding and management related diseases in the transition cow. Physiological adaptions around calving and strategies to reduce feeding-related diseases. Animal Feed Science and Techonology, 126, 175-213. Kaur R, Nandra KS, Garcia SC, Fulkerson WJ & Horadagoda A 2008. Efficiency of utilisation of different diets with contrasting forages and concentrate when fed to sheep in a discontinuous feeding pattern. Livestock Science, 119, 77-86.

21
Kerslake JI, Kenyon PR, Morris ST, Stafford KJ & Morel PCH 2008. Effect of concentrate supplement and sward height on twin bearing ewe body condition and the performance of their offspring. Australian journal of experimental agriculture, 48, 988-994. Madsen J, Hvelplund T, Weisbjerg MR, Bertilson J, Olson I, Spörndly R, Harstad OM, Volden H, Tuori M, Varvikko,T, Huhtanen P & Olafsson BL 1995. The AAT/PBV system for ruminants. A revision. Norwegian Journal of Agricultural Science. Suppl. No 19, 37 McNeill DM, Slepetis R, Erhardt RA, Smith DA & Bell AW 1997. Protein requirements of sheep in late pregnancy: Partioning between gravid uterus and maternal tissues. Journal of Animal Science, 75, 809-816. Nottle MB, Kleemann DO, Hockin VM, Grosser TI & Seamark RF 1998. Development of a nutritional strategy for increasing lamb survival in merino ewes mated in late spring/early summer. . Animal Reproduction Science, 52, 213-219. O´Doherty JV & Crosby TF 1997. The effect of diet in late pregnancy on colostrum production and immunoglobulin absorption in sheep. Animal Science, 64, 87-96. O´Doherty JV & Crosby TF 1998. Blood metabolite concentrations in late pregnant ewes as indicators of nutritional status. Animal Science, 66, 675-683. Orr RJ & Treacher TT 1989. The effect of concentrate level on the intake of grass silages by ewes in late pregnancy. Animal Production, 48, 109-120. Ólafsdóttir HÓ, Sveinbjörnsson J & Harðarson GH 2012b. Energy and protein in the diet of ewes in late pregnancy: Effect on lamb birth weight and growth rate. Submitted to Icelandic Agricultural Sciences Ólafsson BL 1995. AAT-PBV próteinkerfið fyrir jórturdýr [AAT-PBV protein system for ruminants]. Ráðunautafundur 1995, 46-60. [In Icelandic]. Robinson JJ 1983. Nutrition of the pregnant ewe. In W. Haresign (Ed.), Sheep Production (pp. 576). London: Butterworths. Russel AJF 1984. Means of assessing the adequacy of nutrition of pregnant ewes. Livestock Production Science, 11, 429-436. Russel AJF, Doney JM & Gunn RG 1969. Subjective assessment of body fat in live sheep. Journal of agricultural science, Cambridge, 72, 451-454. SAS Institute 2004. SAS/STAT User's Guide, Version 9. SAS Inst. Inc., Cary, NC Schmidt E & Schmidt FW 1995. Glutamate dehydrogenase (EU 1.4.1.3). In H. U. Bergmeyer (Ed.), Methods of Enzymatic Analysis 3th edition. Weinheim, Germany. Sormunen-Cristiana R & Jauhiainen L 2001. Comparison of hay and silage for pregnant and lactating Finnish Landrace ewes. Small Ruminant Research, 39, 47-57. Speijers MHM, Fraser MD, Haresign W, Theobald VJ & Moorby JM 2005. Effects of ensiled forage legumes on performance of twin bearing ewes and their progeny. . Animal Science, 81, 271-282. Sveinbjörnsson J & Ólafsson BL 1999. Orkuþarfir sauðfjár og nautgripa í vexti með hliðsján af mjólkurfóðureiningakerfi [Energy requirements of sheep and growing cattle with respect to milk feed unit system]. Ráðunautafundur 1999. [In Icelandic]. Thorsteinsson SS & Thorgeirsson S 1989. Winterfeeding, housing and management (Vetrarfóðrun og hirðing fjár). In Ó. R. Dýrmundsson & S. Thorgeirsson (Eds.), Reproduction, growth and nutrition in sheep. Dr Halldór Pálsson, Memorial Publication. Reykjavík: Búnaðarfélag Íslands og Rannsóknarstofnun landbúnaðarins. Thorsteinsson SS, Sigurðsson IG & Jónsson S 1993. Prótein í fóðri tvílembna eftir burð [Protein in the postpartum diet of twin bearing ewes]. Ráðunautafundur 1993. [In Icelandic].

22
Tilley JMA & Terry RA 1963. A two-stage technique for the in vitro digestion of forage crops. . Journal of British Grassland Society, 18, 104-111. Van Soest PJ, Robertson JB & Lewis BA 1991. Methods for Dietary Fiber, Neutral Detergent Fiber, and Nonstarch Polysaccharides in Relation to Animal Nutrition. Journal of Dairy Science, 74, 3583-3597.

23
Table 1. Dry matter content and chemical analysis of the experimental feedstuff. Haylage High energy concentrate High Protein concentrate DM % 58.5 88 88 FEm, kg DM-1 0.86 0.98 1 Protein, g kg DM-1 170 110 440 AAT, g kg DM-1 84 105 200 PBV, g kg DM-1 24 -35 168 NDF, g kg DM-1 514 128 45 Ca, g kg DM-1 3 8 55 P g kg DM-1 3 6 32 Mg g kg DM-1 2 2 4 Na g kg DM-1 1 4 6
Table 2. Daily ration of supplements (g DM day-1 ewe-1) at each time CTR MIX EN PRO Experimental week 1 0 *60 60 60 Experimental week 2 0 *100 100 100 Experimental week 3 0 **190 250 131 Experimental week 4 and until lambing 0 ***260 343 180 * equal ration of high energy and high protein supplements ** 125 g high energy supplement and 65 g high protein supplement *** 170 g high energy supplement and 90 g high protein supplement
Table 3. Total haylage intake (kg DM, FEm and gAAT day-1 ewe-1) by treatment groups and weeks. Week 1 Week 2 Week 3 Week 4
Kg DM FEm gAAT
Kg DM FEm gAAT
Kg DM FEm gAAT
Kg DM FEm gAAT
CTR 1,82 1.55 151.1 1.99 1.73 167.7 1.91 1.64 159.4 1.98 1.74 168.3 MIX 1.80 1.53 149.3 1.94 1.69 163.0 1.81 1.56 151.7 1.80 1.58 152.8 EN 1.81 1.54 149.7 1.94 1.69 163.6 1.81 1.57 151.5 1.76 1.55 149.6 PRO 1.80 1.53 149.0 1.95 1.70 164.5 1.82 1.57 152.3 1.78 1.56 150.7 p-values for fixed effects Kg DM FEm gAAT Treatment < 0.0001 < 0.0001 < 0.0001 Experimental week < 0.0001 < 0.0001 < 0.0001 Length of experimental treatment 0.0451 0.0003 0.0259 Treatment * experimental week < 0.0001 < 0.0001 < 0.0001
Table 4. Total intake (kg DM, FEm and gAAT day-1) by treatment groups and weeks. Week 1 Week 2 Week 3 Week 4
Kg DM FEm gAAT
Kg DM FEm gAAT
Kg DM FEm gAAT
kg DM FEm gAAT
CTR 1.82 1.55 151.1 1.99 1.73 167.7 1.91 1.64 159.4 1.99 1.74 168.3 MIX 1.86 1.59 158.5 2.04 1.79 179.2 2.00 1.75 177.8 2.06 1.83 188.7 EN 1.87 1.60 156.0 2.04 1.79 174.1 2.06 1.81 177.8 2.11 1.89 185.6 PRO 1.86 1.59 161.0 2.05 1.80 184.5 1.95 1.71 178.5 1.96 1.74 186.7

24
p-values for fixed effects Kg DM FEm gAAT Treatment <0.0001 <0.0001 <0.0001 Experimental week <0.0001 <0.0001 <0.0001 Length of experimental treatment 0.0451 0.0003 0.0259 Treatment * experimental week <0.0001 <0.0001 <0.0001
Table 5. Changes in ewe weight during experiment Treatment Single Twin Triplets ADJ mean CTR 5.10a 6.58ab 8.99bc 6.89A
MIX 7.60abc 9.12bc 7.21abc 7.98AB EN 6.11ab 7.83abc 10.19c 8.05AB
PRO 6.70ab 8.84bc 9.99c 8.51B
ADJ mean 6.38A 8.09B 9.10B Different letters in superscript represent significant difference p-values for fixed effects Treatment 0.4133 Litter size 0.0111 Ewe age 0.9965 Length of experimental treatment 0.1515 treatment*litter size 0.4348 Table 6 Changes in BCS during experiment Treatment Singles Twins Triplets ADJ mean CTR 0.08bcd 0.08bcd 0.07bcd 0.08NS
MIX 0.29d 0.01abc -0.10ab 0.07 NS EN 0.11bcd 0.17cd -0.23a 0.02 NS PRO 0.09bcd 0.20cd -0.09ab 0.07 NS ADJ mean 0.15A 0.12A -0.09B Different letters in superscript represent significant difference p-values for fixed effects Treatment 0.8367 Litter size 0.0013 Ewe age 0.0563 Length of experimental treatment 0.0143 treatment*litter size 0.1025
Table 7. Adjusted mean for blood metabolites by litter sizes Single twin triplets Glucose (mM) 3.67A 3.74A 3.42B NEFA (μekv L-1) 245 A 322B 317B BHB (mM) 0.71A 0.70A 0.73A Urea (mM) 9.22A 8.60B 7.44C Uric acid (μekv.L-1) 21.63A 23.71B 22.97B AST (u L-1) 160A 152AB 148B GLDH (u L-1) 37.5A 25.4B 17.1C GGT (u L-1) 53.9A 54.8A 55.7A ICDH (u L-1) 20.6A 27.7B 23.3A

25
Calcium (mM) 2.71A 2.67B 2.67AB Different letters in superscript within rows represent significant difference
Table 8. Plasma glucose levels by treatments and experimental weeks (mM) Treatment -5 -4 -3 -2 -1 0 1 ADJ mean CTR 3.42a 3.69a 4.05b 3.60a 3.59a 3.56a 3.42a 3.62B MIX 3.38a 3.66a 3.53a 3.56a 3.76a 3.81a 3.46a 3.59B EN 3.37a 3.73a 3.69a 3.97b 4.26b 3.99b 3.45a 3.78C PRO 3.24a 3.57a 3.53a 3.35a 3.32a 3.60a 3.85a 3.42A ADJ mean 3.35 3.66 3.70 3.62 3.73 3.74 3.42 Different letters in superscript represent significant difference p-values for fixed effects Ewe age 0.9914 Treatment 0.0143 Litter size 0.0029 Weeks from parturition 0.0575 Treatment * week from parturition 0.7108
Table 9. Plasma NEFA levels by treatments and experimental weeks (μekv./L). Treatment -5 -4 -3 -2 -1 0 1 ADJ mean
CTR 301.77a
b 308.10ab 246.56ab 249.49ab 243.78a
b 465.79b 555.51
b 338.71B
MIX 304.07a
b 278.48ab 145.16a 143.42a 153.07a 387.75b 529.73
b 277.38A
EN 352.88a
b 160.57a 164.38a 135.25a 131.45a 461.99b 523.10
b 275.66A
PRO 482.96b 176.03a 143.09a 163.68a 214.53a
b 346.57a
b 440.39
b 281.04A ADJ mean 360.42 230.79 174.80 172.96 185.71 415.52 512.19 Different letters in superscript represent significant difference p-values for fixed effects Ewe age 0.3357 Treatment 0.3479 Litter size 0.0568 Weeks from parturition < 0.0001 Treatment * weeks from parturition 0.9528
Table 10. Plasma BHB level by treatments and experimental weeks (mM). Treatment -5 -4 -3 -2 -1 0 1 ADJ mean
CTR 0.60ab 0.68bc 0.75bc 0.73bc 0.84c 0.66b 0.66b 0.70B MIX 0.59ab 0.72bc 0.82c 0.85c 0.87c 0.75bc 0.64ab 0.75C EN 0.49a 0.60ab 0.65ab 0.63ab 0.66b 0.64ab 0.61ab 0.61A PRO 0.62ab 0.75bc 0.88c 1.03d 0.92cd 0.66b 0.66b 0.79C ADJ mean 0.57 0.69 0.77 0.81 0.82 0.68 0.64
Different letters in superscript represent significant difference p-values for fixed effect Ewe age 0.0092 Treatment < 0.0001

26
Litter size 0.4714 Weeks from parturition < 0.0001 Treatment * Weeks from parturition 0.1263 Table 11. Plasma urea level by treatments and experimental weeks (mM). Treatment -5 -4 -3 -2 -1 0 1 ADJ mean CTR 8.93ab 7.78ab 7.73ab 7.33ab 7.34ab 9.06b 9.61b 8.25A MIX 9.34b 6.84a 7.81ab 8.32ab 8.38ab 6.89a 8.96b 8.08A EN 9.75b 6.94a 8.61ab 6.98a 7.15ab 7.64ab 9.85b 8.13A PRO 10.45b 7.76ab 9.09b 9.82b 9.52b 8.50ab 9.50b 9.23B ADJ mean 9.62 7.33 8.31 8.11 8.10 8.02 9.48 Different letters in superscript represent significant difference p-values for fixed effect Ewe age 0.7602 Treatment 0.0078 Litter size <0.0001 Weeks from parturition 0.0001 Treatment * weeks from parturition 0.4591
Table 12. Plasma Uric acid level by treatments and experimental weeks (μekv./L). Treatment -5 -4 -3 -2 -1 0 1 ADJ mean CTR 22.04a 23.27bc 26.07bc 19.75a 17.08a 22.38bc 19.80ab 21.49A MIX 22.23bc 24.02bc 26.55c 22.23b 19.52ab 22.93bc 22.07b 22.79B EN 21.63ab 24.82bc 27.55c 29.25c 22.50bc 23.65bc 20.87ab 24.32C PRO 21.12ab 23.95bc 25.27bc 27.05c 19.47ab 21.58ab 20.85ab 22.61AB ADJ mean 21.51 24.01 26.36 24.57 19.64 22.64 20.90 Different letters in superscript represent significant difference P-values for fixed effect Ewe age 0.9849 Treatment 0.0099 Litter size 0.0092 Weeks from parturition <0.0001 Treatment * weeks from parturition 0.201
Table 13. Plasma AST level by treatments and experimental weeks (u/L). Treatment -5 -4 -3 -2 -1 0 1 ADJ mean CTR 138.91ab 147.09ab 138.70ab 136.32ab 136.95ab 167.92b 195.95b 151.69B MIX 151.16ab 144.38ab 142.41ab 144.93ab 153.55ab 171.98b 193.31b 157.39BC EN 124.19a 127.60a 127.32a 122.67a 122.12a 166.90b 191.12b 140.27A PRO 147.09ab 149.13ab 151.61ab 144.24ab 148.91ab 225.36c 190.18b 165.22C ADJ mean 140.34 142.05 140.01 137.04 140.38 183.04 192.64 Different letters in superscript represent significant difference P-values for fixed effects Ewe age 0.8439 Treatment 0.0089 Litter size 0.1651 Weeks from parturition <0.0001 Treatment * weeks from parturition 0.851

27
Table 14. Plasma GGT level by treatments and experimental weeks (u/L). Treatment -5 -4 -3 -2 -1 0 1 ADJ mean CTR 46.29ab 53.87ab 55.04ab 56.21ab 64.87b 63.21b 67.54bc 58.15C MIX 44.13a 47.52ab 49.36ab 52.19ab 53.69ab 52.69ab 74.86c 53.49AB EN 46.15ab 53.21ab 54.54ab 55.54ab 60.71b 60.71b 63.21b 56.29BC PRO 43.98a 49.53ab 52.70ab 51.36ab 53.20ab 50.86ab 65.70b 51.26A ADJ mean 45.14 51.03 52.91 53.82 58.12 56.87 65.70 Different letters in superscript represent significant difference p-values for fixed effects Ewe age 0.0001 Treatment 0.0607 Litter size 0.7702 Weeks from parturition <0.0001 Treatment * weeks from parturition 0.09032
Table 15. Plasma GLDH level by treatments and experimental weeks (u/L). Treatment -5 -4 -3 -2 -1 0 1 ADJ mean CTR 20.10ab 41.96ab 24.21ab 23.32ab 23.71ab 10.94a 100.26c 31.93B MIX 20.45ab 19.88ab 12.30a 11.82a 15.18a 14.49a 50.28b 20.62A EN 12.38a 17.81ab 13.64a 10.14a 14.29a 10.46a 83.76c 23.21A PRO 21.55ab 25.97ab 23.29a 13.98a 20.92a 13.61a 82.84bc 28.88AB ADJ mean 18.62 26.40 18.36 14.82 18.52 12.38 79.28 Different letters in superscript represent significant difference P-values for fixed effects Ewe age 0.3587 Treatment 0.1467 Litter size 0.0023 Weeks from parturition <0.0001 Treatment * weeks from parturition 0.9735
Table 16. Plasma ICDH level by treatments and experimental weeks (u/L)
Treatment -5 -4 -3 -2 -1 0 1 ADJ mean CTR 23.84ab 25.65ab 28.06b 23.41ab 27.32ab 33.05b 36.54b 28.27B MIX 18.73ab 22.11ab 23.63ab 24.77ab 21.94ab 24.48ab 17.92ab 21.94A EN 13.45a 24.26b 25.58ab 21.82ab 22.78ab 29.92b 31.46b 24.18A PRO 16.00ab 18.54b 19.82ab 20.12ab 19.03ab 36.73b 20.05a 24.47A ADJ mean 18.01 22.64 24.27 22.53 22.77 31.05 26.49 Different letters in superscript represent significant difference P-value for fixed effect Ewe age 0.9902 Treatment 0.0471 Litter size 0.0086 Weeks from parturition 0.0236 Treatment * weeks from parturition 0.7921
Table 17. Plasma Calcium level by treatments and experimental weeks (mM) treatment -5 -4 -3 -2 -1 0 1 ADJ mean CTR 2.59a 2.65a 2.61a 2.56a 2.67a 2.53a 2.71a 2.62A

28
MIX 2.69a 2.65a 2.67a 2.76ab 2.88b 2.52a 2.67a 2.69B EN 2.57a 2.72a 2.67a 2.79ab 2.85ab 2.16a 2.74ab 2.72B PRO 2.64a 2.73ab 2.79ab 2.76ab 2.76ab 2.54a 2.70a 2.70B ADJ mean 2.62 2.69 2.69 2.71 2.79 2.58 2.70 Different letters in superscript represent significant difference P-values for fixed effect Ewe age 0.0777 Treatment 0.0059 Litter size 0.2244 Weeks from parturition <0.0001 Treatment * weeks from parturition 0.1842

1
Energy and protein in the diet of ewes in late pregnancy: Effect on lamb birth weight and growth rate
Hallfríður Ósk Ólafsdóttir
Jóhannes Sveinbjörnsson AND
Grétar Hrafn Harðarson Agricultural University of Iceland, Hvanneyri, 311 Borgarnes, Iceland
E-mail: [email protected] [email protected] [email protected]
ABSTRACT
Effect of feeding different types of concentrates during late pregnancy on lamb birth
weight and growth rate were tested on 48 ewes the last month prepartum. Ewes were assigned
to four treatments, each containing equal numbers of single- twin- and triplet bearing ewes.
Three of the treatment groups (MIX, EN and PRO) were fed, along with ad libitum haylage,
increasing levels of supplements differing in protein type and content. The fourth group,
control group (CTR), was only fed haylage. All lambs were reared as twins. Lambs were
weighed at birth, seven days old, approximately eight weeks old and at weaning. No
significant birth weight differences were found among treatment groups. The first week
postpartum lambs reared by non-supplemented ewes had significantly lower growth rate than
others but this difference ceased with increasing age. Growth rate was not significantly
different between the supplemented groups. Lambs reared by ewes that had given birth to
twins had significantly higher growth rate the first week postpartum than lambs reared by
ewes that had given birth to singles or triplets.
Keywords: birth weight, growth rate, nutrition, protein, late-pregnancy, sheep
Yfirlit

2
Áhrif af fóðrun með mismunandi kjarnfóðurtegundum á fæðingarþunga og vaxtarhraða
lamba voru prófuð á 48 ám síðasta mánuð meðgöngu. Ánum var skipt í fjóra meðferðarhópa
sem hver innihélt jafnan fjölda einlemba, tvílemba og þrílemba. Þremur hópanna (MIX, EN og
PRO) var gefið, til viðbótar við hey eftir átlyst, vaxandi skammtar af kjarnfóðri sem innihélt
mismunandi magn og gerð af próteini. Fjórði hópurinn (CTR) var samanburðarhópur sem var
eingöngu fóðraður á heyi eftir átlyst. Lömbin voru vigtuð innan sólarhrings frá burði, viku
gömul, við fjallrekstur (u.þ.b. átta vikna gömul) og loks fyrir slátrun. Ekki var marktækur
munur á fæðingarþunga lambanna eftir meðferð mæðra. Fyrstu vikuna þyngdust lömb sem
gengu undir CTR ánum marktækt minna en önnur en þessi munur minnkaði með vaxandi
aldri. Ekki var marktækur munur á vaxtarhraða lamba eftir því hvaða kjarnfóður ærnar sem
þau gengu undir fengu fyrir burð. Lömb sem gengu undir tvílembdum ám uxu marktækt
hraðar fyrstu vikuna eftir burð en þessi munur dvínaði svo og sást ekki eftir átta vikna aldur.
Lykilorð: sauðfé, fæðingarþungi, prótein, fóðrun, meðganga
INTRODUCTION
It is well known that ewe nutrition in late pregnancy can affect birth weight of lambs
and several studies can be mentioned that support that statement (Frutos et al. 1998, Husted et
al. 2007 & 2008, Khalaf et al. 1979, Robinson & McDonald 1989). Even though dietary
protein has generally been considered especially important for the adequacy of nutrition of the
pregnant ewe (Robinson & McDonald 1989), results regarding effect of dietary protein on
lamb birth weight are quite inconsistent. Annett et al. (2008) found positive effect of
undegradable protein on birth weight while both Nørgaard et al. (2008) and O´Doherty &
Crosby (1997) failed to detect such difference. Along with effect of late gestation feeding
level the body condition of the mother also affects lamb birth weight (Thorsteinsson &

3
Thorgeirsson 1989). The fact that ruminants have excellent ability to mobilize and use
nutrients stored in body tissues (Chilliard et al. 2000) as well as the high priority of foetal
growth for nutrients (Thorsteinsson & Thorgeirsson 1989) allows us to state that birth weight
is influenced by some combination of the condition of the ewe in the latter part of mid
pregnancy – as defined by previous feeding - and late pregnancy nutrition (Kerslake et al.
2008).
Lamb survival, especially the first hours postpartum, is affected by birth weight (Gama
et al. 1991, Nottle et al. 1998, Robinson & McDonald 1989). The main reasons for that is
probably more effective thermoregulation and energy supply (Andrews & Mercer 1985,
McNeill et al. 1997, Robinson et al. 1999) and greater resistance to infections (Gama et al.
1991, Khalaf et al. 1979) with increasing birth weight. The latter effects can also be caused by
a greater amount of colostrum available to and consumed by the heavier lambs, probably also
borne to better nourished ewes (Khalaf et al. 1979).
Though keeping ewes in acceptable condition and securing normal birth weight of
lambs is important factor in the sheep husbandry, the main goal of the prepartum feeding must
be to secure sufficient rearing ability of the ewe in order to supply enough milk to meet with
the lamb’s capacity to grow fast (Ocak et al. 2005). As for the birth weight undegradable
protein has been considered important factor in the nutrition of the lactating ewe and several
research have revealed effects of protein supplements on colostrum production (Banchero et
al. 2006, Nottle et al. 1998, Nørgaard et al. 2008, Robinson & McDonald 1989, Sormunen-
Cristiana & Jauhiainen 2001). However, other research, such as Annett & Carson (2005),
Dawson et al. (1999), Kerslake et al. (2008) and Speijers et al. (2005) have failed to detect
such effect but in these cases the authors have linked their results with the excellent body
condition of their experimental ewes as well as high quality of the roughage offered in their

4
experiments. Though adequate colostrum output is a good indicator of the adequacy of
prepartum feeding and promising for the upcoming lactation it is not an indefectible parameter
in that matter. With adequate lactation diet milk production of ewes, though underfed
prepartum to a level known to negatively affect colostrum output, has as soon as five days
postpartum reached the same level as in ad libitum fed ewes (Nørgaard et al. 2008).
Furthermore, Nørgaard et al. (2008) failed to detect effect of prepartum feed restriction on the
complete lactation output measured as lamb weight at weaning.
With advancing age a greater proportion of the lambs nutrition is derived from herbage
compared with the mothers supply of milk. Furthermore, lamb growth rate ceases with
advancing age, both these facts resulting in diminishing effect of late pregnancy and early
lactation nutrition of the ewe on lamb performance (Guðmundsson & Dýrmundsson 1989).
In the experiment described below effect of concentrate types, especially with regard
to type of dietary protein, on lamb birth weight and growth rate were tested. A companion
paper (Ólafsdóttir, et al. 2012a) presents results regarding effect on the ewe (eating capacity,
live weight, body condition and plasma metabolites).
MATERIALS AND METHODS
Experimental animal housing and feeding
The research took place at Hestur, the experimental farm of the Icelandic agricultural
university. Forty-eight pregnant ewes of the native Icelandic flock were allocated to one of
four dietary treatments (n=12) from 30-39 days pre-lambing until lambing, each treatment
group containing equal numbers of single, twin and triplet bearing ewes. All treatment, before
and after the experimental period, was as traditional at the farm.

5
Treatment groups were balanced for ewe BCS in February, age, expected lambing date
and index for mothering ability, evaluated on the scale 0.1-9.9. For calculation of this index
each farms average ewe output is set as the index five and deviation of ewes output from the
mean results in their index raising or decreasing to certain level. Each group was divided into
two replications (n=6) that were penned and fed separately.
All groups were ad libitum fed grass haylage from round bales and had free access to
water and salt block with mineral and trace elements. Otherwise the treatments were as listed
below
Control group (CTR): Fed only haylage throughout the experiment.
Mixed supplement group (MIX): Fed increasing ration of a mixture of high protein and
high energy concentrates from day 9 of the experiment.
Energy supplement group (EN): Fed increasing ration of high energy concentrates
from day 9 of the experiment.
Protein supplement group (PRO): Fed increasing ration of high protein concentrates
from day 9 of the experiment.
The high energy concentrate consisted of 50% wheat-bran, 41.75% maize, 5%
molasses, 2% shell calcium, 1% feedsalt and 0.25% mineral mix. The high protein concentrate
consisted of 69% fish meal, 30% barley, 1% magnesium phosphate and 0.1% E-vitamin.
Chemical composition of haylage and concentrates is listed in table 1.
Concentrates were fed in one single portion in the morning. Daily rations increased
regularly until lambing, rations aiming at supplying all concentrate-fed groups with the same
amount of total g AAT ewe-1 day-1at each time. Daily ration of supplements at each time is
presented in table 2.

6
Litter sizes were balanced to two lambs per ewe directly after birth, i.e. one lamb was
removed from each triplet bearing ewe and one extra lamb, usually triplet or twin from
yearling, was added to those that had given birth to singles. Because of this process and the
fact that the ewes did not always lamb on the day expected, some of the lambs reared by
experimental ewes were not born to ewes from the experiment. One ewe only raised one lamb
since no extra lamb was available at parturition and was therefore excluded from the
postpartum data. One lamb was stillborn and two died because of lambing difficulties. Two
lambs died within the first 10 days, both reared by the same dam that only reared one lamb
afterwards. Approximately two weeks postpartum one lamb was found dead in the pasture and
one of the experimental ewes died 10 days postpartum, reason for death in both cases
unknown.
At parturition ewes were individually penned for around 2 days but moved to groups of
increasing size the next days if no problems occurred. Within 24 hours lambs were weighed,
ear tagged and sex and colour registered. For around 8-12 days postpartum ewes and lambs
were kept indoors but with access to outdoor pen and all ewes received the same ration,
approximately 150 g ewe-1 day-1, of the high protein supplement.
Then they were moved to cultivated pasture, yet with free access to haylage as well as
50 g ewe-1 day-1 of the high protein supplement. Approximately one month postpartum all
sheep were excluded from the cultivated land and grazed rangeland at Hestur until end of
June. At that time all ewes available were taken to the highland. At September 17th the flock
was gathered from the highland and grazed on rangeland at Hestur until September 22nd when
lambs were weaned and grazed on cultivated pasture until slaughter.
Measurements and data sampling

7
Birth weight was recorded within 24 hours from birth, stillborn lambs and lambs that
died at parturition included. On the seventh day postpartum all lambs reared by the
experimental ewes were weighed; however, the lambs from the ewe that died ten days
postpartum and the two ewes that only reared one lamb were excluded from the statistical
analysis. Total number of lambs used for the analysis therefore was 24, 22, 22 and 22 lambs in
treatment groups CTR, MIX, EN and PRO respectively. In end of June when the lambs were
45-57 (average 49) day old the 76 lambs present (18, 22, 21 and 15 lambs in the CTR, MIX,
EN and PRO groups respectively) were weighed and again at weaning when lambs were on
average 144 days old, total of 85 lambs. All lambs that survived from birth to weaning and
were not known to have had any problems that could have affected their growth rate were
included in the analysis regarding average growth rate from birth to weaning, (24, 20, 21 and
20 lambs in CTR, MIX, EN and PRO groups respectively). Lambs that were not present in end
of June are excluded from statistical analysis of growth rate from end of June to weaning
resulting in 74 lambs being used for this analysis (18, 20, 21 and 15 lambs in the CTR, MIX,
EN and PRO respectively).
Statistical analysis
Data was analyzed using the REML method of SAS Enterprise Guide 4.1 and 4.2 (SAS
institute 2004) mixed model analyze. When lamb birth weight was the response variable the
model was as follows:
Yijk = µ + Ti + Lj + Sm + Ak + Dl + (T x L)ij + εijk
Where Yijklm is the response variable, µ is the overall mean of the population, Ti is the
mean of the experimental treatment (i = 1-4), Lj is the mean effect of litter size (j = 1-3), Sm is
the mean effect of sex of the lamb (m = 1-2), Ak is the effect of ewe age (k = 3-8) and Dl is the
effect of length of the treatment (number of days from onset of the experiment until lambing;

8
l= 30-39), (T x L)ij is the interaction between treatment and litter size and εijkl represents the
unexplained residual elements that are assumed to be independent and normally distributed.
For the data regarding growth rate at any time interval the model was the same as for
birth weight except that litter size refers in that case to the number of lambs the ewe rearing
each particular lamb gave birth to instead of the birth type of the lamb itself. Furthermore,
instead of age of “birth” dam we used age of the dam that reared the lamb.
RESULTS
Treatment did not have significant effect on birth weight neither for singles, twins or
triplets. Though not significant, lambs from the CTR group had on average higher birth weight
than those born to ewes from the supplemented groups. Triplets were significantly lighter than
singles in all treatment groups and twins in the EN and PRO groups.
The first seven days postpartum lamb growth rate was significantly affected by litter
size, and age of the dam. It has to be kept in mind that since litter sizes were balanced at birth
and all ewes reared two lambs as described in materials and methods, all postpartum effects of
litter sizes refer to the litter size the dam rearing the lamb gave birth to, not whether the lambs
themselves are born as singles, twins or triplets.
Growth rate of lambs during their first week was significantly higher for lambs reared
by twin bearing ewes than those reared by single- or triplet bearing ewes. Furthermore, lambs
reared by the CTR ewes grew significantly slower the first seven weeks.
In this period, the effect found in the first week postpartum of the litter size ewes had
given birth to on lamb growth rate, was still apparent but not significant anymore. In the last
period, from 7 weeks old to weaning, treatment effect are not present any more and in fact the
only effect significantly affecting growth rate at that time was sex of the lamb.

9
When the whole growth period is viewed as a continuum sex of the lamb is the only
effect tested that significantly affected growth rate. Growth rate of lambs reared by ewes from
CTR and PRO groups however was somewhat lower than of those reared by the MIX and EN
group ewes, though not significant.
Lambs reared by ewes that had given birth to triplets had the highest average growth
rate but those reared by the single bearing ewes had the lowest.
DISCUSSION
Lamb birth weight
Lower birth weight of triplets than singles and twins was as expected and in agreement
with Sormunen-Cristiana & Jauhiainen (2001) and Thorsteinsson & Thorgeirsson (1989) but
non-significant difference between singles and twins were more surprising. That is particularly
interesting due to the high feeding level above requirements for the single bearing ewes which
would have been expected to result in extremes in birth weight (Annett et al. 2008,
Thorsteinsson & Thorgeirsson 1989) and subsequent lambing difficulties (Gama et al. 1991).
The CTR ewes giving birth to the heaviest lambs is inconsistent with several authors
positively linking prepartum nutrition and birth weight (Annett et al. 2008, Thorsteinsson &
Thorgeirsson 1989) though comparable to O´Doherty & Crosby (1997 & 1998) that found no
effect of considerably reduced ME intake on birth weight and suggested their results to be
linked with relatively small efficiency of dietary energy for growth of the conceptus.
The good condition of our experimental ewes as well as high haylage quality is likely
to be important factor regarding this “lack of effect” as stated by (Speijers et al. 2005,
Thorsteinsson & Thorgeirsson 1989), the latter research revealing reduction in birth weight of
supplemented ewes with BCS higher than 3.7-4.

10
Higher birth weight of lambs from CTR group, even though their dams were slightly
lighter than others in end of pregnancy as well as elevated NEFA level could indicate some
mobilization of maternal reserves. That is however surprising since calculated energy and
protein intake should have met these ewes requirements as they are defined now. This is
discussed in our companion paper (Ólafsdóttir et al. 2012a). Non significant effects of
treatment on birth weight should have minimized the effect on subsequent survival and
performance of the lambs. However, some of the lambs reared by the experimental ewes were
triplets or twins from yearling and therefore possibly smaller at birth.
Lamb growth rate
Lower growth rate the first week postpartum of the lambs reared by CTR ewes
indicates positive effect of supplementing ewes prepartum on colostrum and subsequently
milk production and is in agreement with several older research (Nottle et al. 1998, Robinson
& McDonald 1989, Speijers et al. 2005) that have revealed effect of prepartum feeding up to
six weeks postpartum. Many of those researches aimed at estimating effect of feeding
concentrates rich in undegradable protein compared with only haylage feeding. According to
Banchero et al. (2007) high level of undegradable protein in supplements did not have
advantage above concentrates rich in ME but without undegradable protein which is in
agreement with our results that showed no advantage of undegradable protein supplements
above other. In that matter it has to be kept in mind that high energy content of diet as used in
this research results in elevated levels of microbial protein reaching the small intestines,
serving the animal in the same way as undegradable protein. Elevated level of uric acid in
plasma indicates for example increased supply of microbial protein in the EN ewes
(Ólafsdóttir et al. 2012a).

11
All lambs reared by triplet bearing ewes were triplets and half of those reared by single
bearing ewes were either triplets or twins from yearlings and consequently in most cases
lighter than others (Sormunen-Cristiana & Jauhiainen 2001, Thorsteinsson & Thorgeirsson
1989). This is a possible reason for the lower growth rate of lambs reared by single and triplet
bearing ewes the first week postpartum as for example Sormunen-Cristiana & Jauhiainen
(2001), Greenwood et al. (1998) and Khalaf et al. (1979) found growth rate to be positively
related to birth weight.
Maternal effects on growth rate decrease with advancing age as herbage becomes
higher portion of the lambs diet compared to the milk (Guðmundsson & Dýrmundsson 1989).
An example of this can be seen in our results where effect of both treatment and
number of lambs ewes gave birth to decreased with time from parturition and were not
apparent in the period fromafter seven weeks of age until weaning.
CONCLUSION
Extreme feeding level increases birth weight up to some level but not above that,
indicating that the biggest extremes in that matter are not due to feeding level of ewes, at least
not exclusively. Subsequently lambing difficulties are not necessarily increased with raised
feeding level. Concentrate feeding of ewes makes them better prepared for milk production as
can be seen by higher growth rate of the lambs reared by supplemented ewes. Reasonable
level and duration of the supplementing remains to be defined and requires further studies.
Number of lambs ewes gave birth to also seems to affect growth rate. It is not clear whether
that difference is caused by twin bearing ewes being somehow better prepared to nurse two
lambs, or the fact that lambs reared by ewes giving birth to singles and triplets had on average
lower birth weight than those born as twins and raised by their own twin bearing mother. In
opposition with some older research, concentrate type, especially with regard to protein type
12
(i.e. bypass vs. microbial protein), did not seem to affect birth weight, or milking ability of the
ewes. But high quality of the roughage fed as well as good condition of ewes has to be
considered when viewing those results.
REFERENCES
Andrews JF & Mercer JB 1985. Thermoregulation in the newborn lamb: The first 36 hours. Paper presented at the Factors affecting the survival of newborn lambs - A seminar in the CEC programme of coordination of agricultural research, Brussel. Annett RW & Carson AF 2005. The effect of digestible undegradable protein (DUP) content of concentrates on colostrum production and lamb performance of triplet-bearing ewes on grass-based diets during late pregnancy. Animal Science, 80, 101-110. Annett RW, Carson AF & Dawson LER 2008. Effects of digestible undegradable protein (DUP) supply and fish oil supplementation of ewes during late pregnancy on colostrums production and lamb output. Animal Feed Science and Techonology, 146, 270-288. Banchero GE, Clariget P, Bencini R, Lindsay DR, Milton JTB & Martin GB 2006. Endocrine and metabolic factors involved in the effect of nutrition on the production of colostrum in female sheep. Reprod. Nutr. Dev., 46, 447-460. Chilliard Y, Ferlay A, Faulconnier Y, Bonnet M, Rouel J & Bocquier F 2000. Adipose tissue metabolism and its role in adaptions to undernutrition in ruminants. Proceedings of the Nutrition Society, 59, 127-134. Dawson LER, Carson AF & Kilpatrick DJ. 1999. The effect of the digestible undegradable protein of concentrates and protein source offered to ewes in late pregnancy on colostrum production and lamb performance. Animal Feed Science and Techonology, 82, 21-36. Frutos P, Buratovich O, Giráldez FJ, Mantecón AR & Wright IA 1998. Effects on maternal and foetal traits of feeding supplement to grazing pregnant ewes. Animal Science, 66, 667-673. Gama LT, Dickerson GE, Young LD & Leymaster KA 1991. Effects of breed, heterosis, age of dam, litter size and birth weight on lamb mortality. Journal of Animal Science, 69, 2727-2743. Greenwood PL, Hunt AS, Hermanson JW & Bell AW 1998. Effects of birth weight and postnatal nutrition on neonatal sheep: I. Body growth and composition and some aspects of energetic efficiency. Journal of Animal Science, 76, 2354-2367. Guðmundsson Ó & Dýrmundsson ÓR 1989. Grazing and lamb growth (Beit og vöxtur lamba). In Ó. R. Dýrmundsson & S. Thorgeirsson (Eds.), Reproduction, growth and nutrition in sheep. Dr. Halldór Pálsson Memorial publication (pp. 147-168). Reykjavík: Búnaðarfélag Íslands og Rannsóknarstofnun landbúnaðarins. Husted SM, Nielsen MO, Blache D & Ingvartsen KL 2008. Glucose homeostasis and metabolic adaption in the pregnant and lactating sheep are affected by the level of nutrition previously provided during her late fetal life. Domestic animal endocrinology, 34, 419-431. Husted SM, Nielsen MO, Tygesen A, Kiani A, Blache D & Ingvartsen KL 2007. Programming of intermediate metabolism in young lambs affected by late gestational maternal
13
undernourishment. American journal of physiology, endocrinology and metabolism, 293, 548-557. Kerslake JI, Kenyon PR, Morris ST, Stafford KJ & Morel PCH. 2008. Effect of concentrate supplement and sward height on twin bearing ewe body condition and the performance of their offspring. Australian journal of experimental agriculture, 48, 988-994. Khalaf AM, Doxey DL, Baxter JT, Black WJM, FitzSimons J & Ferguson JA 1979. Late pregnancy ewe feeding and lamb performance in early life. 2. Factors associated with perinatal lamb mortality. Animal Production, 29, 401-410. McNeill DM, Slepetis R, Erhardt RA, Smith DA & Bell AW 1997. Protein requirements of sheep in late pregnancy: Partioning between gravid uterus and maternal tissues. Journal of Animal Science, 75, 809-816. Nottle MB, Kleemann DO, Hockin VM, Grosser TI & Seamark RF 1998. Development of a nutritional strategy for increasing lamb survival in merino ewes mated in late spring/early summer. . Animal Reproduction Science, 52, 213-219. Nørgaard JV, Nielsen MO, Theil PK, Sørensen MT, Safayi S & Sejrsen K 2008. Development of mammary glands of fat sheep submitted to restricted feeding during late pregnancy. Small Ruminant Research, 76, 155-165. O´Doherty JV & Crosby TF 1997. The effect of diet in late pregnancy on colostrum production and immunoglobulin absorption in sheep. Animal Science, 64, 87-96. O´Doherty JV & Crosby TF 1998. Blood metabolite concentrations in late pregnant ewes as indicators of nutritional status. Animal Science, 66, 675-683. Ocak N, Cam MA & Kuran M 2005. The effect of high dietary protein levels during late gestation on colostrum yield an lamb survival rate in singleton bearing ewes. Small Ruminant Research, 56, 89-94. Ólafsdóttir HÓ, Sveinbjörnsson J & Harðarson GH 2012a. Energy and protein in the diet of ewes in late pregnancy: Effect on ewe feed intake, life weight, body condition and concentration of plasma metabolites. Submitted to Icelandic Agricultural Sciences Robinson JJ & McDonald I 1989. Ewe nutrition, foetal growth and development (Um fóðrun áa og vöxt og þroska fósturs). In Ó. Dýrmundsson & S. Þorgeirsson (Eds.), Reproduction, growth and nutrition in sheep. Dr. Halldór Pálsson Memorial Publication. Robinson JJ, Sinclair KD & McEvoy TG 1999. Nutritional effects on foetal growth. Animal Science, 68, 315-331. SAS Institute 2004. SAS/STAT User's Guide, Version 9. SAS Inst. Inc., Cary, NC Sormunen-Cristiana R & Jauhiainen L. 2001. Comparison of hay and silage for pregnant and lactating Finnish Landrace ewes. Small Ruminant Research, 39, 47-57. Speijers MHM, Fraser MD, Haresign W, Theobald VJ & Moorby JM 2005. Effects of ensiled forage legumes on performance of twin bearing ewes and their progeny. . Animal Science, 81, 271-282. Thorsteinsson SS & Thorgeirsson S 1989. Winterfeeding, housing and management (Vetrarfóðrun og hirðing fjár). In Ó. R. Dýrmundsson & S. Thorgeirsson (Eds.), Reproduction, growth and nutrition in sheep. Dr Halldór Pálsson, Memorial Publication. Reykjavík: Búnaðarfélag Íslands og Rannsóknarstofnun landbúnaðarins.

14
Table 1. Dry matter content and chemical analysis of feed
Haylage High energy concentrate High Protein concentrate DM (%) 58.5 88 88 Fem (Fem kg DM-1) 0.86 0.98 1 Protein (g kg DM-1) 170 110 440 AAT (g kg DM-1) 84 105 200 PBV (g kg DM-1) 24 -35 168 NDF (g kg DM-1 514 128 45 Ca g kg DM-1 3 8 55 P g kg DM-1 3 6 32 Mg g kg DM-1 2 2 4 Na g kg DM-1 1 4 6
Table 2. Daily ration of supplements (g DM day-1) at each time CTR MIX EN PRO Experimental week 1 0 *60 60 60 Experimental week 2 0 *100 100 100 Experimental week 3 0 **190 250 131 Experimental week 4 and until lambing 0 ***260 343 180 * equal ration of high energy and high protein supplements ** 125 g high energy supplement and 65 g high protein supplement *** 170 g high energy supplement and 90 g high protein supplement
Table 3. Birth weight of lambs (kg) Treatment Singles Twins Triplets ADJ mean
CTR 4.69c 4.25c 3.74ab 4.23A
MIX 4.27c 4.15bc 3.75ab 4.06A
EN 4.41c 4.42c 3.69ab 4.18A
PRO 4.63c 4.36c 3.47a 4.15A
ADJ mean 4.50A 4.29A 3.66A Different letters in superscript represent significant difference
p-values for fixed effects Litter size <0.0001 Sex 0.0682 Age of dam 0.1366 treatment 0.7726 Days on experimental treatment 0.0125 treatment * litter size 0.6687
Table 4. Growth rate of lambs in their first week (g day-1) Treatment Singles Twins Triplets ADJ mean CTR 255.6ab 318.3b 250.5a 274.8A MIX 319.3b 323.5b 278.2ab 307.0B EN 276.7ab 350.1b 291.3ab 306.0B PRO 309.8ab 347.5b 282.7ab 313.3B

15
ADJ mean 290.4A 334.9B 275.7A Different letters in superscript represent significant difference p-value for fixed effects litter size 0.0023 sex 0.1793 age of dam 0.0256 treatment 0.1716 days on treatment 0.2851 treatment * litter size 0.8727
Table 5. Growth rate of lambs from 2-7 weeks of age (g day-1) Treatment Singles Twins Triplets ADJ mean CTR 310.3ab 285.2a 303.2a 299.6A
MIX 344.0ab 329.6ab 318.7ab 330.8B
EN 301.8a 326.2ab 369.3b 332.4B
PRO 344.3ab 329.5ab 308.9a 327.6B
ADJ mean 325.1A 317.6.A 325.0 A Number with different superscript differ significantly p-value for fixed effect litter size 0.1829 sex 0.9032 age of dam 0.4212 treatment 0.8382 Days on treatment 0.3381 treatment * liter size 0.1893
Table 6. Growth rate of lambs from seven week of age to weaning (g day-1) Treatment Singles Twins Triplets ADJ mean CTR 227.8a 232.2 a 216.6 a 225.6 A
MIX 217.6a 212.4 a 245.9 a 225.3 A EN 225.2a 229.9 a 231.3 a 228.8 A
PRO 202.8a 222.9 a 222.3 a 216.0 A ADJ mean 218.4 A 224.3 A 229.0 A Number with different superscript differ significantly p-value for fixed effect litter size 0.5996 sex 0.0105 age of dam 0.7205 treatment 0.7379 days on treatment 0.4024 treatment * litter size 0.5034
Table 7 Growth rate of lambs from birth to weaning (g day -1) Treatment Singles Twins Triplets ADJ mean CTR 245.4 a 252.8 a 254.4 a 250.9 A
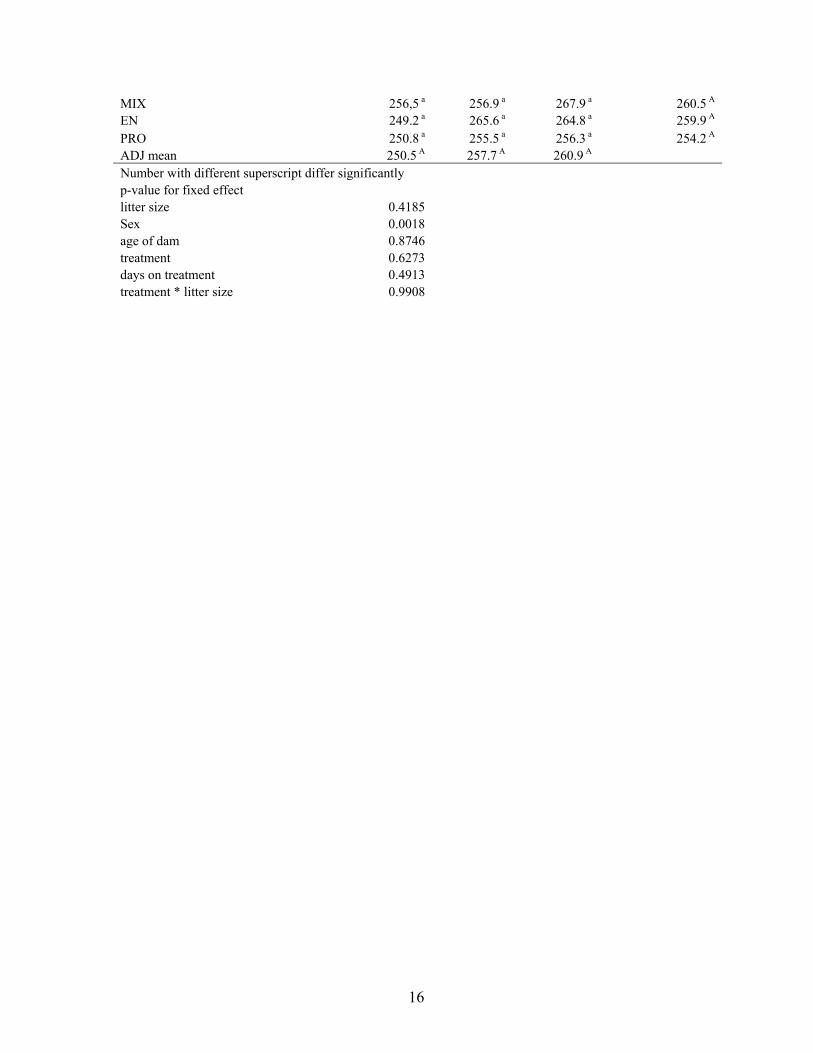
16
MIX 256,5 a 256.9 a 267.9 a 260.5 A EN 249.2 a 265.6 a 264.8 a 259.9 A PRO 250.8 a 255.5 a 256.3 a 254.2 A ADJ mean 250.5 A 257.7 A 260.9 A Number with different superscript differ significantly p-value for fixed effect litter size 0.4185 Sex 0.0018 age of dam 0.8746 treatment 0.6273 days on treatment 0.4913 treatment * litter size 0.9908