energy and environmental research emphasizing low-rank coal … · energy and environmental...
TRANSCRIPT
DOE/MC/30097 -- 5088 (DE96000620)
Energy and Environmental Research Emphasizing Low-Rank Coal -- Task 5.7 Coal Char Fuel Evaporation Canister Sorbent
Topical Report
Ted R. Aulich Ames A. Grisanti Curt L. Knudson
August 1995
Work Performed Under Contract No.: DE-FC21-93MC30097
For U.S. Department of Energy Office of Fossil Energy Morgantown Energy Technology Center Morgantown, West Virginia
BY University of North Dakota Grand Forks, North Dakota
DISCLAIMER
This report was prepared as an account of work sponsored by an agency of the United States Government. Neither the United States Government nor any agency thereof, nor any of their employees, makes any warranty, express or implied, or assumes any legal liability or responsibility for the accuracy, completeness, or usefulness of any information, apparatus, product, or process disclosed, or represents that its use would not infringe privately owned rights. Reference herein to any specific commercial product, process, or service by trade name, trademark, manu- facturer, or otherwise does not necessaiily constitute or imply its endorsement, recommendation, or favoring by the United States Government or any agency thereof. The views and opinions of authors expressed herein do not necessarily state or reflect those of the United States Government or any agency thereof.
This report has been reproduced directly from the best available COPY.
Available to DOE and DOE contractors from the Office of Scientific and Technical Information, 175 Oak Ridge Turnpike, Oak Ridge, TN 37831; prices available at (615) 576-8401.
Available to the public from the National Technical Information Service, U.S. Department of Commerce, 5285 Port Royal Road, Springfield, VA 22161; phone orders accepted at (703) 487-4650.

DOEMCB0097 - 5088 (DE96000620)
Distribution Category UC-106
Energy and Environmental Research Emphasizing Low-Rank Coal -- Task 5.7
Coal Char Fuel Evaporation Canister Sorbent
Topical Report
Ted R. Aulich Ames A. Grisanti Curt L. Knudson
Work Performed Under Contract No.: DE-FC21-93MC30097
For U.S. Department of Energy
Office of Fossil Energy Morgantown Energy Technology Center
P.O. Box 880 Morgantown, West Virginia 26507-0880
BY University of North Dakota
Energy and Environmental Research Center P.O. Box 9018
Grand Forks, North Dakota 58202-901 8
August 1995

ACKNOWLEDGMENT
This report was prepared with the support of the U.S. Department of Energy (DOE) Morgantown Energy Technology Center Cooperative Agreement No. DE-FC2 1-93MC30097. However, any opinions, fmdings, conclusions, or recommendations expressed herein are those of the author@) and do not necessarily reflect the views of the DOE.
EERC DISCLAIMER
LEGAL NOTICE This research report was prepared by the Energy & Environmental Research Center (EERC), an agency of the University of North Dakota, as an account of work sponsored by the U.S. Department of Energy. Because of the research nature of the work performed, neither the EERC nor any of its employees makes any warranty, express or implied, or assumes any legal liability or responsibility for the accuracy, completeness, or usefulness of any information, apparatus, product, or process disclosed, or represents that its use would not infringe privately owned rights. Reference herein to any specific commercial product, process, or service by trade, trademark, manufacturer, or otherwise does not necessarily constitute or imply its endorsement or recommendation by the EERC.
TABLE OF CONTENTS
LISTOFFIGURES ................................................. ii
1.0 INTRODUCTION .............................................. 1
2.0 OBJECTIVES ................................................. 1
3.0 ACCOMPLISHMENTS .......................................... 2 3.1 System Design and Preliminary Testing with Butane .................... 2 3.2 Gasoline Testing ............................................ 3
4.0 CONCLUSIONS ............................................... 7
5.0 FUTUREWORK .............................................. 8
6.0 REFERENCES ................................................ 8
i
..... . . . . . ___.I_. ... _._.___ ...... . . ~ ....

LIST OF FIGURE23
1 Sorbent test system . . . . . . . . . . . . . . . . . . . . . . . . . . . . . . . . . . . . . . . . . . . . . . 3
2 FT-IR spectrum of gasoline vapors . . . . . . . . . . . . . . . . . . . . . . . . . . . . . . . . . . . . 4
3 FT-IR absorbance for trans-olefins and aliphatics in vapor from unleaded regular and E10 gasoline ..................................................... 5
4 Sorbent breakthrough at 100°F with regular unleaded gasoline vapor . . . . . . . . . . . . . . 6
5 Sorbent breakthrough at 100°F with E10 gasoline vapor . . . . . . . . . . . . . . . . . . . . . . 7
6 Comparison of 70% breakthrough times for different chemical compound groups at 70" and 100°F sorbent temperatures . . . . . . . . . . . . . . . . . . . . . . . . . . . . . . . . . 8
.. 11

TASK 5.7 - COAL CHAR FUEL EVAPORATION CANISTER SORBENT
1.0 INTRODUCTION
Automobile evaporative emission canisters contain activated carbon sorbents that trap and store fuel vapors emitted from automobile fuel tanks during periods of hot ambient temperatures and after engine operation. When a vehicle is started, combustion air is pulled through the canister, and adsorbed vapors are removed from the sorbent and routed to the intake manifold for combustion along with fuel from the tank. The two primary requirements of an effective canister sorbent are that 1) it must be a strong enough adsorbent to hold on to the fuel vapors that contact it and 2) it must be a weak enough adsorbent to release the captured vapors in the presence of the airflow required by the engine for fuel combustion. Most currently available commercial canister sorbents are made from wood, which is reacted with phosphoric acid and heat to yield an activated carbon with optimum pore size for gasoline vapor adsorption.
Although current U.S. Environmental Protection Agency (EPA) regulations regarding automobile fuel vapor emissions are concerned primarily with evaporation due to ambient or engine operation temperatures, regulations are being prepared that will require the capture of refueling emissions, which are generated by displacement of fuel vapors (present in the headspace of a partially empty tank) with liquid fuel. Meeting these regulations, which are scheduled to be initiated in 1998 and phased in over the next 2 years, will involve the use of onboard refueling emission canisters. Because of size, aerodynamic, and weight considerations important for optimum mileage, the mandated addition of refueling emission canisters to automobiles will create a need for sorbents that can meet higher vapor capacity and loading rate requirements. Work is ongoing at U.S. and Japanese auto industry and sorbent manufacturing laboratories to develop more efficient activated carbon and synthetic polymeric sorbents for automotive applications.
2.0 OBJECTIVES
The objectives of Task 5.7 were to 1) design and construct a test system for evaluating the performance of different sorbents in trapping and releasing butane, gasoline, and other organic vapors; 2) investigate the use of lignite char as an automobile fuel evaporation canister sorbent; 3) compare the adsorbing and desorbing characteristics of lignite chars with those of several commercial sorbents; and 4) investigate whether the presence of ethanol in fuel vapors affects sorbent performance in any way. The investigations of ethanol effects involved comparing the adsorbing and desorbing capacities of sorbents with unleaded regular base gasoline to the capacities of the sorbents with E10 fuel, a blend of 90 vol% base gasoline with 10 vol% ethanol. The motivation for the work with E10 fuel was provided by comparison of Energy & Environmental Research Center (EERC) National Alternative Fuels Laboratory (NAFL) data on evaporative emission compositions with data from other researchers using SHED (sealed housing for evaporative determination) test methodology. While the NAFL data showed that the ethanol concentration in an evaporative emission from a 10 vol% ethanol/90 vol% base gasoline (E10) blend should be about 13 wt%, published SHED test results for ethanol concentration in E10 evaporative emissions ranged from 2-20 wt% (1). One possible explanation for these differences may involve canister performance with E10 fuels.
1

Probably the most meaningful basis on which to compare fuel evaporation canister sorbent performance is gasoline working capacity (GWC), which is the capacity of a used canister (one that has been through at least 5 load-and-purge cycles) in grams of gasoline vapor adsorbed per unit volume of canister sorbent. GWC is a more valid indication of real-world sorbent performance than the total amount of vapor that a fresh (brand new) canister adsorbs, because of "heel" effects. The heel is the amount of fuel vapor that is too tightly adsorbed to be removable from the canister sorbent by purging. Because each component of the heel takes up an adsorbing site on the sorbent, the effect of the heel is to decrease GWC. Heels usually account for about 25% to 50% of the total adsorbing capacity of a new sorbent.
In addition to GWC, butane working capacity (BWC) is an accepted industry standard method for comparison of canister sorbent performance. The primary advantage of BWC versus GWC is that BWC is easier and less expensive to measure, because butane is a single-component gas at room temperature, whereas gasolines are multicomponent liquids that contain varying concentrations of the volatile organics that make up their vapor emissions. The use of BWC for comparison of canister sorbent performance is widespread throughout the auto and sorbent industries, and BWC is generally assumed to be good indication of GWC. This assumption appears to be valid when gasoline testing is performed with non-ethanol-containing fuels that emit vapors composed primarily of normal butane and other similar-chemistry butanes and pentanes. However, BWC may not be quite as accurate an indication of GWC when GWC is determined using ethanol blends. The test system constructed for this project was designed to enable determination of a sorbent's BWC, GWC, or working capacity with any other organic vapor-emitting liquid or gas.
3.0 ACCOMPLISHMENTS
3.1 System Design and Preliminary Testing with Butane
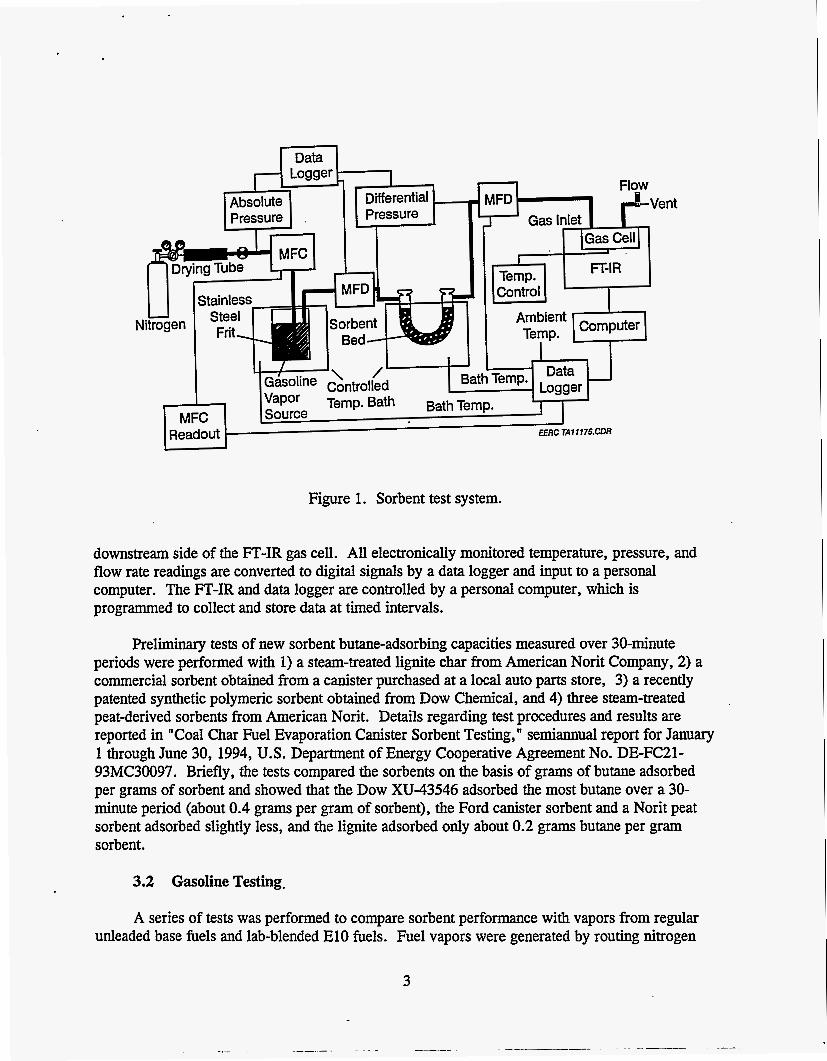
Design of the EERC evaporation canister sorbent test system (Figure 1) was based on published designs of Westvaco Corporation and Dow Chemical Company sorbent test systems (2-4). As shown in Figure 1, the test system is built around a gasoline vapor source that supplies vapors to a sorbent bed. Calibrated mass flow controllers (MFCs) are used to measure nitrogen flow to the gasoline vapor source, nitrogen plus fuel vapor flow into the sorbent bed, and nitrogen plus vapor flow out of the sorbent bed. The output of the sorbent bed is passed through a 10-cm-path-length, 50-cc gas cell mounted in the sample compartment of a Bomem Model B-100 Fourier-transform infrared (FT-IR) spectrometer, which is used to detect and analyze breakthrough vapor emissions. The volume of the "U-tube" sorbent bed, which is approximately 25 cm3, can contain about 7-10 g of sorbent, depending on sorbent density. Temperatures of the gasoline vapor source and the sorbent bed are maintained by controlled temperature baths that use ethylene glycol and Dowtherm as circulating heat-transfer fluids, respectively.
During testing, pressure drop across the sorbent bed is monitored (via a computerized data acquisition program) with an electronic differential pressure transducer. The temperatures of the two temperature baths and the ambient temperature in the lab are also monitored throughout each test. The temperature of the FT-IR gas cell is maintained at 25°C using an electronically controlled heater. A floating ball-type flow indicator is used to monitor the.outlet gas flow on the
2
Logger
Absolute
I
1 Flow
Temp.
Ambient Temp.
I
TemF v a p u i
(Source ' I I I Readout I EERC TA1117S.CDR
Figure 1. Sorbent test system.
downstream side of the FT-IR gas cell. All electronically monitored temperature, pressure, and flow rate readings are converted to digital signals by a data logger and input to a personal computer. The FT-IR and data logger are controlled by a personal computer, which is programmed to collect and store data at timed intervals.
Preliminary tests of new sorbent butane-adsorbing capacities measured over 30-minute periods were performed with 1) a steam-treated lignite char from American Norit Company, 2) a commercial sorbent obtained from a canister purchased at a local auto parts store, 3) a recently patented synthetic polymeric sorbent obtained from Dow Chemical, and 4) three steam-treated peat-derived sorbents from American Norit. Details regarding test procedures and results are reported in "Coal Char Fuel Evaporation Canister Sorbent Testing, " semiannual report for January 1 through June 30, 1994, U.S. Department of Energy Cooperative Agreement No. DE-FC21- 93MC30097. Briefly, the tests compared the sorbents on the basis of grams of butane adsorbed per grams of sorbent and showed that the Dow XU-43546 adsorbed the most butane over a 30- minute period (about 0.4 grams per gram of sorbent), the Ford canister sorbent and a Norit peat sorbent adsorbed slightly less, and the lignite adsorbed only about 0.2 grams butane per gram sorbent.
3.2 Gasoline Testing.
A series of tests was performed to compare sorbent performance with vapors from regular unleaded base fuels and lab-blended E10 fuels. Fuel vapors were generated by routing nitrogen
3

carrier gas (at a flow rate of about 50 cm3/minute) through a sealed (with a rubber stopper) 150-cm3 Erlenmeyer flask containing 100 cm3 of gasoline. As shown in Figure 1, the carrier gas was bubbled into the gasoline through a stainless steel frit immersed in the gasoline.
Before undergoing testing, sorbents were dried for 4 to 6 hours in an oven at 100°C. An appropriate volume of dried sorbent (about 20 cm3) is then poured into the U-tube (the empty weight of which has been recorded), the weight of sorbent added is recorded, and the sorbent bed is sealed and immersed in the 25°C temperature bath. The complete flow system minus the gasoline vapor source is purged with nitrogen flowing at 50 cm3/min for 5 minutes. The gasoline vapor source is then prepared as follows: The empty 150-cm3 flask is weighed and the weight is recorded; then a 100-mL gasoline sample (prepared in advance) is brought from refrigerated storage and poured into the empty flask. The flask plus gasoline is weighed and the weight recorded. The inlet and outlet lines for the nitrogen carrier gas are connected to the flask and it is placed in the temperature bath. Nitrogen carrier gas flow (which is stopped briefly to enable immersion of the nitrogen supply line fritted end into the gasoline) is accurately reset to 50 cm3/min, and the computerized data acquisition program is initiated to collect data at 2-minute intervals.
Figure 2 is a representation of an FT-IR spectrum of an E10 fuel vapor emission, with labeled wavenumbers (reciprocal infared energy wavelengths) that can be used to observe and quantitate (relatively) the presence of compound groups that have specific chemical functionalities. For example, the small peak at Wavenumber 1146 indicates the presence of a group of compounds, each of which has an aliphatic hydrocarbon bond, and the small peak at Wavenumber 970 indicates the presence of another group of compounds, each of which has a trans-olefin bond. A significant
Wavenumber, cm-'
Figure 2. FT-IR spectrum of gasoline vapors.
4

number of compounds will be members of both groups, since many olefins also have aliphatic hydrocarbon bonds. It is important to note that the y-axis of Figure 2 is a relative measure of IR absorbance under the conditions used for analysis and that absolute quantitation of the IR response at a specific wavenumber requires analysis of a series of calibration mixtures.
In order to accurately monitor breakthrough emissions with the FT-IR instrument, it is necessary to establish baseline emission conditions. Figure 3 shows baseline FT-IR evaporative emission data acquired over two separate 6-hour evaporation tests using 100-mL regular unleaded and E10 fuel samples. The figure shows changes in each fuel's evaporative emission composition that occur over time, based on the relative absorbance intensities of trans-olefin- and aliphatic hydrocarbon-bonded compounds. For example, the plot labeled "RU trans-olefin" indicates that the longer the regular unleaded fuel sample is allowed to evaporate, h e lower the cumulative concentration of trans-olefin functionality compounds becomes in the fuel's evaporative emission. As in Figure 2, the y-axis values shown in Figure 3 are relative absorbance values based on instrument response and are not the result of calibrated measurements. However, the values are accurate for making comparisons between fuels and can be used to provide quantitative sorbent breakthrough data. A significant point illustrated by Figure 3 is that while the evaporative emissions from the two fuels have approximately equal concentrations of compounds with aliphatic character, the regular unleaded evaporative emission has a higher concentration of trans-olefin compounds than the E10 evaporative emission. This is consistent with earlier findings (4) and is due to the presence (at about 13 wt%) of ethanol in the E10 emission, which lowers the concentration of trans-olefin species but has little effect on the observed concentration of aliphatic hydrocarbons that make up the bulk of the evaporative emission of both fuels.
5 EERC TA11172.CDR
I RU
4
1
0 I 1 , I , 1 I I 0 50 100 150 200
Evaporation Time, min
Figure 3. FT-IR absorbance for trans-olefins and aliphatics in vapor from unleaded regular and E10 gasoline.
5

Figure 4 shows what happens when a commercial sorbent held at a temperature of 38°C (100°F) is loaded to breakthrough capacity with evaporative emissions from a regular unleaded gasoline. The plots for olefins and hydrocarbons were derived by comparing FT-IR absorbance values from a series of analyses of a "postsorbent" (downstream from the sorbent) gas stream to the absorbance values from the series of analyses of the evaporating gasoline samples depicted in Figure 3. For example, the y-axis aliphatic hydrocarbon value at 100 minutes was calculated by dividing the sorbent test FT-IR absorbance value at 100 minutes by the nonsorbent test FT-IR absorbance value at 100 minutes (from Figure 3). This technique accounts for the changing composition of evaporative emissions over time. The plots show that trans-olefin and aliphatic hydrocarbon breakthrough begin after about 25 minutes of absorbance and that 100% breakthrough (defined as when the absorbance values in each sorbent test gas stream analysis are equal to their values in each "same run-time" nonsorbent test analysis) is achieved at about 45 minutes.
In addition to the plots for tram-olefins and aliphatic hydrocarbons, Figure 4 shows a plot labeled "Out/In. " This plot is based on comparison of MFC values obtained on the upstream (in) and downstream (out) sides of the sorbent bed. Each y-axis value is calculated by dividing each run-time downstream MFC value by its counterpart (same run time) upstream MFC value. The use of two breakthrough determination methods (FT-IR absorbance and mass flow) helps to validate and ensure the credibility of the analytical data.
Figure 5 is similar to Figure 4 and shows what happens when the same commercial sorbent held at a temperature of 38°C (100°F) is loaded to breakthrough capacity with evaporative emissions from an E10 fuel. The figure shows that breakthrough for the trans-olefins and
1.5
1 .o
0.5
0
c ,trans-Olefins
0 50 100 150 200 Evaporation Time, min
Figure 4. Sorbent breakthrough at 100°F with regular unleaded gasoline vapor.
6

EERC TAIi173.CDR I
1.5
1 .O
0.5
0
Mass Flow In
A / 0- 50 100 150 200
Evaporation Time, min
Figure 5. Sorbent breakthrough at 100°F with E10 gasoline vapor.
aliphatics occurs at about the same run time and at the same rate as for the regular unleaded fuel and that breakthrough for the ethanol vapors begins about 25 minutes later and happens at a slower rate. It appears that the sorbent has a different (possibly greater?) affinity for the ethanol vapors than for the trans-olefins and aliphatics. In tests with a lignitederived sorbent, a similar effect was noted, although the observed lignite breakthrough times for all three chemical groups were only about half as long as those observed with the commercial sorbent. Figure 6 compares 70% breakthrough times for the three chemical groups at different sorbent bed temperatures and indicates the difference in the sorbent's affinity 'for ethanol vapors relative to trans-olefin and aliphatic hydrocarbon vapors.
4.0 CONCLUSIONS
Tests with two different sorbents (a woodderived activated carbon and a lignite char) showed that with both sorbents, ethanol vapor breakthrough took about twice as long as hydrocarbon vapor breakthrough. Possible reasons for this, including an increased sorbent affinity for ethanol vapors, will be investigated. If this effect is real (Le., reproducible over an extensive series of tests under varying conditions), it may help explain why ethanol vapor concentrations in SHED test evaporative emissions are often lower than would be expected.
7

EERC TA11176.CDR 250 I
200 -
150 - -
100 -
50 -
RU-25°C RU38"C El0-25°C E1038"C
i I
trans-Olefins Aliphatics Ethanol Bulk Mass 0
Figure 6. Comparison of 70% breakthrough times for different chemical compound groups at 77" and 100°F (25" and 38°C) sorbent temperatures.
5.0 FUTURE WORK
Future work will consist of GWC testing with commercial sorbents at a series of increasing temperatures to provide more understanding of why ethanol vapors appear to behave differently than hydrocarbon vapors and how ethanol vapors affect total evaporative emission levels.
6.0 REFERENCES
1. Aulich, T.R.; He, X.; Grisanti, A.A.; Knudson, C.L. "Gasoline Evaporation - Ethanol and Nonethanol Blends," J. Air & Waste Manage. Assoc. 1994,44, 1004-1009.
2. Johnson, H.R.; Williams, R.S. "Performance of Activated Carbon in Evaporative Loss Control Systems," SAE Paper No. 902119; 1990.
3. McDaniel, R. "Westvaco Technical Lab Procedures - Butane Working Capacity," report available from Westvaco Corporation, Chemical Division, Washington Street, Covington, VA 24426; January 10, 1992.
4. "Dow Polymeric Adsorbent XU43546 Technical Data Sheet, Butane Adsorption Capacity Test," report available from Dow Chemical Company, Midland, Michigan 48674.
8