energetics oflarval red drum, sciaenops sciaenops ...ross i. brightman joseph j. torres joseph...
TRANSCRIPT

431
M. Elizabeth ClarkeDivision of Marine Biology and FisheriesRosenstiel School of Marine and Atmospheric ScienceUniversity of Miami4600 Rickenbacker Causeway. Miami, Florida 33 J49
Energetics of larval red drum,Sciaenops ocellatus.Part II: Growth andbiochemical indicators
Ross I. BrightmanJoseph J. TorresJoseph DonnellyDepartment of Marine ScienceUniversity of South Florida J40Seventh Ave South, St. Petersburg. Florida 33701
E-mail address:[email protected]
Abstract.-The effects ofration leveland temperature on growth were determined for larval red drum, Sciaenopsocellatus, during its first two weeks oflife. Larvae were raised in the laboratory at 20°C at a ration level of5.0 prey/mL, at 25°C at ration levels of 0, 0.1,1.0, and 5.0 prey/mL, and in growoutponds at 25°C and 32°C and at rationlevels of4-6 prey/mL. Growth was measured as standard length. wet mass,and dry mass. Proximate (water, ash,protein, and lipid) and elemental (C, N)composition was determined at larvalages of 0, 2, 4, 6, 10, and 14 d to provide caloric values for the growing larvae and to examine the relative importance ofprotein and lipid during tissuedeposition in the very early life historyofthese larvae. Biochemical indicatorsof growth, RNA-DNA ratio, and activity of the metabolic enzyme lactate dehydrogenase (LDH) were examined inlarvae reared at all temperature andration combinations. The effectivenessof the biochemical indicators as proxies for growth was assessed by comparing the directly measured growth rateswith RNA:DNA levels and LDH activity. Larvae fed a ration of 1.0 prey/mLor less did not survive past the age ofeight days. Growth rate increased withincreasing temperature. reaching amaximum of 60% body mass/d ingrowout ponds at 32°C. Protein level(percent ash free dry mass: %AFDM)increased with increasing age in alltreatments where individuals exhibitedpositive growth, whereas lipid (%AFDM)showed a concomitant decline. Nitrogen(%AFDM) and carbon (%AFDM) varieddirectly with protein and lipid contents,respectively. Biochemical indicators ofgrowth showed a significant correlationwith growth rate. However. the character of the correlation changed withtemperature. RNA-DNA ratios and enzymic activities were lower at highertemperatures for equivalent growthrates. Introduction of a temperatureterm into multiple regression equationsimproved the relation between growthand the biochemical proxies. LDH activity scaled with the size of larvae,whereas RNA:DNA showed no significant relation with size.
Manuscript accepted 4 February 1997.Fishery Bulletin 95:431-444 (1997).
Red drum, Sciaenops ocellatus, is animportant species in commercialand recreational fisheries in thesoutheastern United States, particularly in the Gulf of Mexico. Declines in red drum stocks (Swingle,1990) have stimulated considerableinterest in the early life history ofthis species, resulting in stock enhancement programs and larvalmonitoring programs designed bothto improve and continually to assessthe status of the fish in the field.Studies on red drum and other species indicate clearly that growthduring the pretransformation period of development is particularlycritical to survival (Buckley, 1980;Holt et aI., 1981, a and b; Holt andArnold, 1983; Holt, 1990). The increase in size and mobility thatcharacterizes development duringthe early larval period results in anincrease in the size range of preyitems available to the larvae as forage and a decrease in the size rangeofpotential predators on the larvae.
Two variables with great potential to influence rates ofgrowth are
temperature and ration levels. As asubtropical species, red drum develop at temperatures greater than20°C, grow rapidly, and have agreater energy demand for metabolicprocesses than do larvae developingin colder systems. For example, reddrum eggs at 25°C hatch in 24 h, andlarvae begin feeding in 48-72 h,whereas cold water species, such asAtlantic cod, Gadus morhua, andwinter flounder, Pleuronectes americanus, developing at 4-8OC, spend 30d as developing eggs.! High temperatures during early developmentstimulate rapid growth in red drumbut leave them potentially more vulnerable to rapid starvation in absenceofsufficient food. The interaction between temperature, ration level, andgrowth in size and calories, is an important part of the energetics of larval red drum, basic informationwhich is unavailable for red drumand limited for other subtropical teleosts (Houde and Schekter, 1983).
1 Hempel, G. 1979. Early life history ofmarine fishes; the egg stage. Univ. Washington Press, Seattle, WA, 70 p.

432
Objectives ofthe present study were four-fold. Thefirst was to examine growth in size and energy inlaboratory-reared red drum larvae, from egg to onset of transformation, at a single ration level (5 prey/mL) and at two temperatures (20 and 25°C). Thisexamination was achieved by using direct measurements of standard length and mass with age; thebiochemical composition and caloric value of thegrowing larvae were described by analyzing theirproximate and elemental composition (water, ash,protein, lipid, carbon, and nitrogen). The second wasto examine the relation ofgrowth in size and energyas a function of ration level (0, 0.1, 1.0, and 5.0 prey/mL) at a single temperature (25°C). The third was tocompare growth in size and energy in laboratoryreared larvae at 20 and 25°C and in the more heterogeneous conditions encountered by pond-rearedlarvae at 25 and 32°C. The fourth objective was todescribe the relation between growth, temperature,and biochemical indicators of growth and condition:RNA:DNA ratios and activity of the key intermediate metabolic enzyme lactate dehydrogenase (LDH).
Methods and materials
Laboratory maintenance
Fertilized eggs were obtained from the Florida Department ofEnvironmental Protection (FDEP) hatchery, Port Manatee, Florida. Broodstock were maintained at 25°C and 30 ppt. Eggs were obtained fromfive females and from separate spawnings, from November 1990 to November 1991, for all growth experiments described below. Broodstock females weresimilar in size, kept in highly controlled conditions,and fed well. Spawning was induced naturally bymanipulation ofphotoperiod. As a consequence, eggswere very uniform in size, 0.9 to 1.0 mm in diameter.
Eggs were transported to the USF Marine ScienceLaboratory in St. Petersburg and sorted into 26-L experimental aquaria at a concentration of 2,500-3,000individuals per aquarium. High mortality associatedwith first feeding resulted in a 30-40% reduction ininitial numbers by day 3. Aquaria were placed in aphotoperiod- and temperature-controlled incubator andmaintained at either 20°C or 25°C and at a salinity of30 ppt. Eggs were introduced to the 200C temperatureby slow exchange of water over a 60-minute period. A13-h light and ll-h dark photoperiod was used throughout all experiments. Larvae were fed rotifers (Brachionus plicatilis) beginning at day 3 posthatchuntil flexion (approximately day 14), when experiments wereterminated. Aquaria were aerated and a portion ofthesaltwater in each was changed daily.
Fishery Bulletin 95(3), J997
Rotifers were obtained from Florida Aqua Farms,Dade City, Florida, and cultured according to theprocedure ofHoffand Snell(1987). Rotifers were fedChlarella once a day to avoid any loss in nutritionalvalue. Seawater for culturing was obtained offshore in the GulfofMexico. The seawater was coarsefiltered, then treated with bleach (sodium hypochorite, 5.25%) to remove any additional plankton,and neutralized with sodium thiosulphate. Seawater salinity was adjusted with distilled water andTropic Marine Seasalt to achieve a final salinity of30 ppt.
Pond maintenance
Pond-reared red drum larvae were obtained from theFDEP growout ponds, Port Manatee, Florida. Larvae from a single spawn were added to the plankton-rich ponds within 24 hours after hatching andallowed to grow. Two ponds, one at 25°C and anotherat 32°C, were sampled for the first 18 days of life ofthe red drum larvae. Temperature was monitoredtwice daily; the average temperature for the twoweek sampling period was used to characterize theponds.
Prey items in the ponds were monitored by sieving water samples into two size categories: 35-22011m (copepod nauplii, rotifers, and small copepods)and larger than 220 /l-m lcopepods); prey were thencounted in 200-mL aliquots of each size range. Theconcentration of prey between 35 and 220 Jlm was3-5 prey/mL, whereas that greater than 220 11m was0.5-1 prey/mL in both the 25°C and 32°C ponds.
Growth versus prey density
Eggs from a single spawn were divided into four 26-Laquaria for experiments on growth versus prey density at 25°C. Prey were provided at four densities, 0,0.1, 1.0, and 5.0 prey items per mL, from first feeding (day 3) through the start offlexion lday 14). Preyconcentrations were monitored twice daily by removing a 25-mL sample from each aquarium, countingthe number of prey in 5-mL aliquots, and taking theaverage. Prey concentrations were adjusted as necessary. Larvae reared at 20°C were fed prey at a ration level of 5.0 prey items per mL.
Standard length measurements Growth in standard length was monitored according to prey concentration. Aquaria with 0, 0.1, and 1.0 prey/mL weresampled daily. Aquaria with 5.0 prey/mL weresampled every other day, and ponds were sampledevery third day. The samples were taken each morning before the larvae began to feed. Standard length

Brightman et al.: Energetics of larval Sciaenops ocellatus
of five individual larvae that had been anesthetizedwith MS-222 was measured with the aid of a dissecting microscope. Standard length was consideredto be the distance from the snout to the tip ofthe tailin preflexion larvae and from the snout to the tip ofthe notochord in post-flexion larvae.
Mass measurements Growth in mass was monitored at the same intervals as those used for standard length. At each monitoring interval, 30 individuals were removed for wet, dry, and ash-free drymass analysis. To determine mass, larvae were firstseparated into three groups of ten. Each group oflarvae was filtered onto a preweighed 0.5-cmWhatman glass fiber filter (made with an office holepunch) that was placed in a custom-made miniaturized vacuum funnel. Larvae were then rinsed verybriefly by introducing distilled water into the funnelwith a pasteur pipette and by removing the waterimmediately with the vacuum filter. To minimizeevaporation, samples were immediately placed inpreweighed microcentrifuge tubes which were thenweighed to the nearest IJ.g on a Mettler electrobalanceto determine wet mass. Specimens were dried at 60°Cto a constant mass (about 24 h) to determine drymass.
Average proximate and elementalcomposition of prey items
Rotifers were collected in bulk from two 28-L culture bags (approximately 50 mg dry mass/bag) fordetermination of proximate and elemental composition. Proximate composition (water, ash, protein, andlipid content) was determined by using the methodsof Stickney and Torres (1989) and Donnelly et al.(1990). Elemental composition was determined byusing a C:H:N analyzer.
Average proximate and elementalcomposition of fish larvae
Methods used to estimate the proximate and elemental composition offish larvae were the same as thoseused for prey. Larvae were obtained in bulk (50 mgdry mass) for each day sampled. Each pond wassampled from the hatchery at 0,2,6, 10, and 14 days.Laboratory-raised larvae were sampled at prey concentrations of 0, 0.1, 1.0, and 5.0 prey/mL at 0,2,6,10, and 14 days for each of four spawns. Protein andlipid values as percent ash-free dry mass (%AFDM)were multiplied by individual ash-free dry mass toobtain concentrations as mglindividual. The instantaneous protein growth rate (Gpi) was calculated byusing the formula from Buckley (1982):
433
where M =mass in mg; andt = age in d.
Caloric content of prey and larvae
Caloric content was calculated from proximate compositional data of the rotifers and larvae by using avalue of 0.0048 call1J.g for protein and 0.0095 caVlJ.gfor lipid <Brett and Groves, 1979).
RNA-DNA ratio
Ten to 20 individuals were removed for analysis ofRNA:DNA content each time sampling occurred formeasurements of mass. Larvae were filtered ontopreweighed Whatman glass-fiber filters, rinsed withdistilled water, weighed, placed in microcentrifugetubes, and frozen at -BO°C until analysis. RNA:DNAwas analyzed by first homogenizing the freshlythawed groups oflarvae in 1.2 M NaCI, then by using the sequential enzymatic method of Bentle et al.(1981) to determine RNA:DNA.
Activity of lactate dehydrogenase
Larvae were sampled in bulk (minimum 10-20 mgwet tissue mass) every day at a prey concentrationof 0 prey/mL. Samples were taken at 0, 2, 6, 10, and14 days for larvae fed 5 prey/mL and for those collected in the growout ponds. Tissue was introducedfrozen into the homogenizing medium, ice-cold Tris!HCL buffer (10 mM, pH 7.5 at lOOC), and homogenized by hand at 0 to 4°C with conical glass homogenizers having ground-glass contact surfaces (KontesGlass Co., "Duall" models). Homogenates were centrifuged at 4,500 xg for 10 minutes and the supernatants saved for enzyme analysis.
L-Lactate dehydrogenase (LDH, EC 1.1.1.27; Lactate: NAD+ Oxidoreductase) activity was assayed inthe pyruvate reductase direction by using methodsdescribed in Torres and Somero (1988) at a temperature of25°C. Enzyme activity was expressed as units!gWM (wet mass), where a unit was 1IJ.mole of substrate converted to product per minute.
Statistical analyses
Simple regressions for each relationship were fittedby using the least-squares method (StatgraphicsPlus, Manugistics Corporation). Data from treatmentgroups were compared by using one-way analysis ofvariance (ANOVA). Differences between the means
434 Fishery Bulletin 95(3). J997
were determined by usingthe least-significant-differ- 5.7 -' A':... 10 Dences multiple range t~st.
Multiple regression analy- Y= exp (0.925 + 0.031 X) 8 Y= exp (0.599 + 0.105X)4.7 - ,2 =0.93sis (Statgraphics Plus, ,2 =0.91
Manugistics Corporation) 6
was used to examine the 3.7 -relation between the ob-
~served protein growth rates 2.7: i· !: -
and the following combina-tions of factors: the three 1.7 - 0experimental temperatures 0 3 6 9 12 15 0 3 6 9 12 15 18
<20°C laboratory, 25°C labo- 5.7 10
ratory, 25°C pond, 32°Cpond), the three ration lev- Y= exp (0.756 + 0.047X)
8 Y=exp (0.606 + 0.100X)4.7 ,2 =0.93els at 25°C (0, 5 prey/mL, E ,2 =0.85
and pond), RNA:DNA, and .§. 6
LDH activity. .£: 3.7'6>I: 4
.J!!'E 2.7<1l 2
Results '0I:<1l
Ci5 1.7 0
Growth rate versus 0 3 6 9 12 15 0 3 6 9 12 15 18
prey density 5.7 C
Age (days)
15129
Mass measurements Growth in mass oflaboratoryreared larvae at ration levels less than 5.0 prey/mL(0,0.1, and 1.0 prey/mL) at 25°C was negative, andno larvae survived more than 8 days (Fig. 2). Slopes
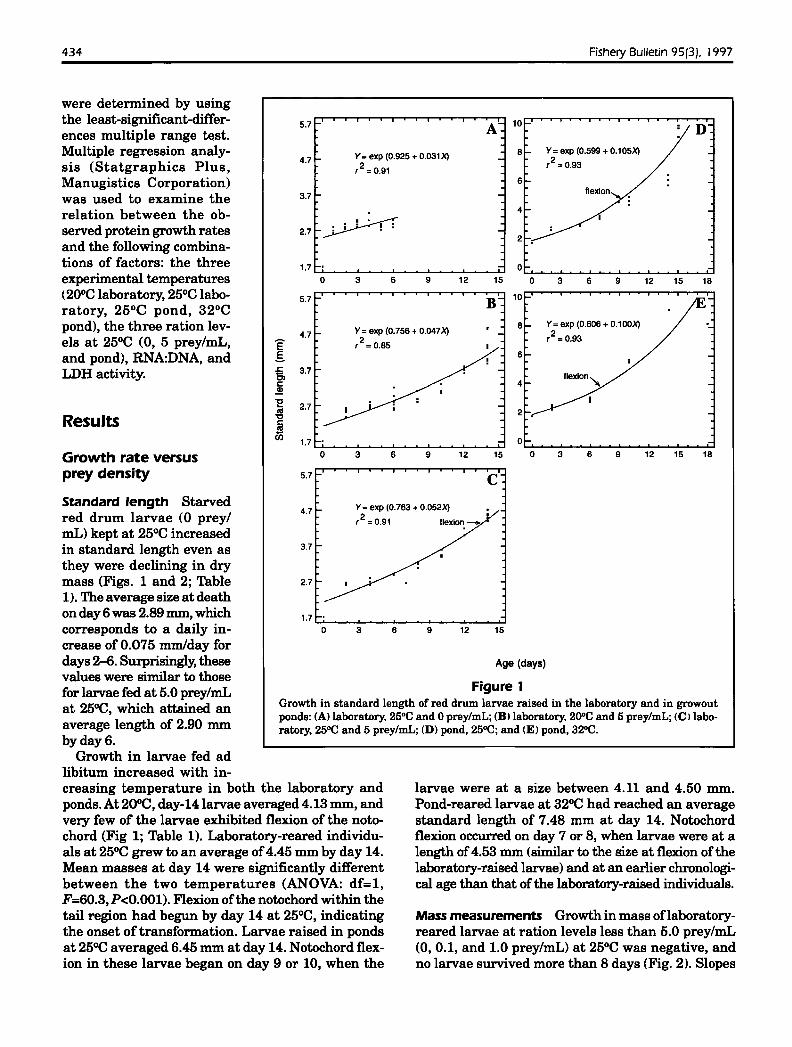
larvae were at a size between 4.11 and 4.50 mm.Pond-reared larvae at 32°C had reached an averagestandard length of 7.48 mm at day 14. Notochordflexion occurred on day 7 or 8, when larvae were at alength of4.53 mm <similar to the size at flexion of thelaboratory-raised larvae) and at an earlier chronological age than that of the laboratory-raised individuals.
63
Y= exp (0.763 + 0.052X)
,2 = 0.91 f1exion_
o
2.7
4.7
3.7
Figure 1Growth in standard length of red drum larvae raised in the laboratory and in growoutponds: (AI laboratory. 25°C and 0 prey/mL; (B I laboratory. 200C and 5 prey/mL; (C) laboratory, 25°C and 5 prey/mL; (D) pond, 25OC; and (E) pond, 32°C.
Standard length Starvedred drum larvae (0 preylmL) kept at 25°C increasedin standard length even asthey were declining in drymass (Figs. 1 and 2; Table1). The average size at deathon day 6 was 2.89 mm, whichcorresponds to a daily increase of 0.075 mmlday fordays 2--6. Surprisingly, thesevalues were similar to thosefor larvae fed at 5.0 prey/mLat 25°C, which attained anaverage length of 2.90 mmby day 6.
Growth in larvae fed adlibitum increased with in-creasing temperature in both the laboratory andponds. At 20°C, day-14 larvae averaged 4.13 mm, andvery few of the larvae exhibited flexion of the notochord (Fig 1; Table 1). Laboratory-reared individuals at 25°C grew to an average of4.45 mm by day 14.Mean masses at day 14 were significantly differentbetween the two temperatures (ANOVA: df=l,F=60.3, P<O.OOI). Flexion ofthe notochord within thetail region had begun by day 14 at 25°C, indicatingthe onset of transformation. Larvae raised in pondsat 25°C averaged 6.45 mm at day 14. Notochord flexion in these larvae began on day 9 or 10, when the

Brightman et al.: Energetics of larval Sciaenops ocellatus 435
40
30
A: Y= exp (3.2 - 0.236X)
! ,2 =0.60
150
120 Y= exp (2.14 + 0.100X)
,2 = 0.86
Ii- 16000f-'
12000 Y = exp (2.56 + 0.325X)
,2 = 0.89
F
90
20 8000
60
104000 "ftv'nn : /
~01-.- . ,-o 8 10 12 14 16 18
30~
O.................................................~.................o 3 6 9 12 158642
0u.....................................J...................J.................uo
O.....................L.o.....................~........~LI·o 2 4 6 8
20~:;••. I .. : !
10 '.!':":. .... .
150 16000 Q
120 Y= exp (2.02 + 0.176X) : Y= exp (1.06 + 0.471 X),2 = 0.77 l 12000
,2 = 0.96
90
8000
60
400030
0 0
0 3 6 9 12 15 0 8 10 12 14 16 18
BY = exp (2.99 - 0.204X)
,2 = 0.45
40 fJ
30
40 ~
: Y = exp (3.21 - 0.231 X)
30 ,2= 0.62
20
10
8642Ou........................~.............."..............u
o
Age (days)
Figure 2Growth in dry mass of red drum larvae raised in the laboratory and in growout ponds: <A)laboratory, 25°C and 0 prey/mL; (B) laboratory, 25"C and 0.1 prey/mL; eel laboratory, 25°Cand 1 prey/mL; CDl laboratory, 20°C and 5 prey/mL; eEl laboratory, 25°C and 5 prey/mL; eF)pond, 25°C; and eGl pond, 32°C.
of the three curves describing the time-dependentdecline in individual dry biomass at the three rationlevels were not significantly different (Student's t-test:P>0.05). Growth in dry mass at a ration level of 5.0prey/mL was significantly higher than at the threelower ration levels (0, 0.1, and 1.0 prey/mL).
In contrast, wet masses in 2-6 day-old larvae wereslightly lower at ration levels of 0, 0.1, and 1.0 prey/mL than at 5.0 prey/mL but were not significantlydifferent. This finding indicated that body water con-
tent was increasing in larvae maintained at the threelower ration levels.
Larvae held at 25°C and fed 5.0 prey/mL had highergrowth rates than those raised at 20°C at the sameration level (Fig. 2; Table 1). Growth averaged 2.86J.Lg/day for the first two weeks oflife in larvae raisedat 20°C and 10.09 J.Lg/day for larvae reared at 25°C.Expressed as a percent increase in mass, larvaereared at 20°C increased 10.5 %BMld and thosereared at 25°C increased 19.3 %BMld.

Table 1Proximate and elemental composition and energetic density of red drum larvae determined at different levels of ration, temperature, and age. (nd = no data; DM=drymass; WM = wet mass;AFDM = ash-free dry mass). Parenthetical values (SD, n) represent standard deviations and sample sizes below each of the mean values in the table.
Ration(preyImL)
TempCo Day
Standardlength(mm)
Wetmass(Ilg)
Drymass(llg1
Caloriesper indo
%Water
AFDMas%DM
%WM
Protein
%AFDM
%WM
Lipid
%AFDM
Carbon%
AFDM
Nitrogen%
AFDMCalories!mgDM
nd nd
47.70 9.10
51.53 10.51
44.35 11.86
46.79 13.14
nd
3.631
4.266
4.353
2.943
nd
nd
nd
4.423
3.983
3.783
3.967
4.182
4.194
3.255
3.896
4.548
3.813
3.382
3.253
3.450
4.707
4.652
4.021
3.658
3.282
3.185
nd
nd
nd
10.46
10.29
nd
nd
10.3110.55.3)
10.4110.52.3)
9.7010.48,4)
9.80(0.50.3)
10.0510.13,3)
10.60(0.23.3)
nd
46.66
49.88
nd
nd
nd
. nd
nd
51.8313.98.3)
48.93(0.93.3)
53.9911.10,4)
49.7914.84,3)
49.79(1.92,3)
46.06(5.81.3)
nd
45.77 12.0310.41.3) (0.14,3)
42.92 11.91
45.73 12.27(1.17.3) (0.50.3)
nd nd
nd nd
nd nd
nd nd
nd nd
nd
9.87
9.17
20.18(2.16,5)
24.54(0.02.5)
17.23
11.74
11.64
18.08
24.82
nd
nd
9.87
24.98
26.36
13.05
11.70
19.72(4.16,15)
18.45(2.08,5)
22.3916.02,10)
21.24(6.06.10)
16.86(4.35,10)
12.67(1.72,5)
13.2911.28,5)
24.34(1.28.5)
20.5413.12,51
10.78
1.15
0.8410.01,5)
1.49(0.01.5)
1.89
1.49
1.2210.16,8)
0.72
1.72
nd
nd
nd
1.99
1.76
1.38
1.23
nd
nd
1.2210.50,15)
1.2310.01,5)
1.74(0.47.10)
1.34(0.29,10!
1.32(0.26.10)
0.83(0.17,5)
1.14(0.01,5)
0.8910.18.5)
1.7010.31,5)
0.95
nd
nd
51.73
43.3910.67,5)
54.640.24,5)
52.91
55.59
55.13
42.70
56.21
nd
56.22
45.62
54.00
65.61
64.16
64.16
43.84(4.47,151
57.33(5.53.5)
55.68(3.79,10)
59.68(5.41.10)
58.7412.48,lO!
62.89(1.20.5)
62.47(3.28,5)
43.74(4.27,5)
53.0814.86,51
53.19
10.18
6.50
1.8110.01.5)
3.2710.01.5)
5.79
7.07
5.59CO.08.8)
1.74
4.42
nd
3.60
6.92
6.71
5.00
nd
nd
nd
2.5810.80,15)
4.0110.81.5)
4.71(0.56,10)
3.9010.47.10)
4.6910.43,10)
4.3310.36.5)
5.21(0.26,5)
2.3510.44.5)
4.2010.49,5)
4.71
nd
87.7
97.412.4,5)
91.811.3,5)
91.3
89.4
86.7(0.7,8)92.56
93.1
nd
nd
87.6
97.2
91.3
91.6
87.1
81.7
91.3(4.5.151
94.5<0.2.5)
90.711.8,10)
90.610.9.10)
90.1(1.2. 10)
89.6(0.7.5)
93.1(1.6.5)
94.8(7.4,5)
93.2(2.3.5)
91.0
85.7
95.710.7.5)
93.5(2.1.5)
88.0
85.8
87.8(0.1,31
95.0
91.4
91.7
nd
nd
93.9
92.7
88.5
88.0
89.3
nd
94.411.4,15)
92.811.2,5)
90.810.7.10)
92.80.0, 10)
91.110.8.10)
91.810.6,5)
91.011.0.5)
95.410.5.5)
90.311.1.5)
90.3
nd
nd
0.1063
0.0698
0.0725
0.0596
0.0438
0.0308
0.0278
0.1230
0.0651
0.0509
nd
nd
0.1056
0.1373
0.0849
0.0775
0.1005
0.3120
0.1008
0.0738
3.1318
0.0806
0.5476
2.1330
6.9808
29.2817.08,18)
16.36(4.52. 15)
16.66(5.54,15!
13.48(4.93.15)
10.9913.31,15)
8.1313.86.15)
7.0011.80,15)
29.40(4.26.0)
15.52(3.78,10)
15.6411.87.10)
20.4312.15,10)
35.9114.57,10)
35.25(1.26.3)
18.67(0.58,5)
20.33(5.47,5)
29.7114.23,6)
98.92(18.43,15)
28.91(4.43.5)
15.6712.71,5)
nd
137.30(23.20.5)
983.301167.60,3)
nd
17.32(4.78.5)136.20
(35.30,5)583.00
1168.40,5)2127.80
1293.00,3)
447.00(86.10, 18)
274.80076.00, 15)
140.40(24.30.15)
126.20(26.30.15)
120.60(21.70, 15)
103.30(26.00.15)
91.50(20.90,15)
363.30009.90,0)
156.80(22.30,10)
192.00006.50, 10)
233.80120.30.10)
384.40147.30,10)
385.8007.40.5)
206.30(85.20,5)
207.80(74.50.5)
273.50021.00,6!
682.80(181.40. 15)
352.30171.00,5)
179.00(62.60,5)
334.05(34.80,5)2833.80
(381.50.5)6010.00
(542.50,5)nd
187.80172.40.5)
374.30(83.50,5)5491.00
(1802.00.5)nd
1.70(0.05,5)
2.69(0.09.5)
2.83(0.06,5)
2.91(0.09,5)
3.01(0.15.5)
2.81(0.07,5)
2.89(0.08.5)
1.70(0.05,5)
2.5410.10,5)
2.79(0.21.5)
3.14(0.10.5)
4.3310.12,5)
1.70(0.09,5)
2.64(0.03,5)
2.90(0.02,5)
3.4610.10.5)
4.53(0.12,5)
1.7210.04.5!
2.7010.12.5)
2.9310.06,5)
4.70(0.03,5)
6.3010.31.5)
1.75(0.04,5)
2.3710.14,5)
2.8910.12.5)
5.6510.10,5)
7.4810.27.3)
o1
14
2
3
4
5
6
o2
6
10
14
o
2
6
10
14
o2
7
10
14
o2
6
10
25
25
25
25
25
25
25
20
20
20
20
20
25
25
25
25
25
25
25
25
25
25
32
32
32
32
32
ooooo
oo5
5
5
5
5
5
5
5
5
5
Pond
Pond
Pond
Pond
Pond
Pond
Pond
Pond
Pond
Pond

Brightman et al.: Energetics of larval Sciaenops ocellatus
Growth rates for pond-raised red drum larvae (Fig.2) were far greater than those for larvae fed rotifersin the laboratory, owing almost certainly to thegreater prey diversity in the ponds. Larvae raised at25°C in the ponds increased in size an average of81.9 f.1g/day over 14 days: a 47.2 %BMld increase.Larvae raised at 32°C in the ponds increased an average of 799.22 mg/day: a 60.2 %BMld increase; anincrease of lOoC in the pond environment resultedin a two- to three-fold increase in absolute daily massgain.
Proximate and elemental composition ofprey
Brachionus plicatilis raised on Chiorella exhibited aprotein level of 32.71% and a lipid level of 9.37% ofits ash-free dry mass (AFDM). Carbohydrate levelwas low, averaging 2.84% (AFDM). The unrecoveredmass was assumed to be due to refractory structuralmolecules that were not assayed for, e.g. chitin. Using a figure of 0.24 f.1g for average individual biomass (Hoff and Snell, 1987) and the caloric valuesfor protein, lipid, and carbohydrate of Brett andGroves (1979, see methods section), we suggest thateach rotifer has an average energetic value of0.000526 calories.
Elemental composition ofthe rotifers showed thatthe percent carbon was 42.02 %AFDM and the percent nitrogen was 10.41 %AFDM. The carbon-nitrogen ratio was 3.56:1.
437
Proximate and elemental composition oflarvae
Proximate composition can be expressed in threeways: as a percent of wet mass (%WM), a percent ofash-free dry mass (%AFDM), and as the total content per larva (mg/individual). Table 1 shows thechanges in proximate composition (%WM and%AFDM) as a function of ration level and age of thelarvae; total content (mg/individual) is reported below in the text.
Red drum eggs exhibited large water content (94.65%WM), a high protein content (42.17 %AFDM) andan intermediate lipid content (19.35 %AFDM)(Table1). Carbohydrate, generally an extremely small fraction of the overall proximate composition of marinespecies, proved to be so in this case as well (0.47%AFDM).
Viewed as a fraction of the total body mass of eachlarva, the protein level (%AFDM) shows an increasethrough time at zero ration (43.84% to 62.47%) accompanied by a reduction in lipid (19.72% to 13.29%),which indicates that, in starving larvae, lipid wasused in preference to protein for energy production.On a Jlg/individual basis, protein actually decreasedin starved larvae from 8.44 f.1g/individual in newlyhatched larvae to 4.07 f.1g/individual for 6-day-oldstarved larvae (Table 2). Lipid values declined from2.59 f.1g/individual on day 3 to 0.87 f.1g/individual onday 6. Percent water remained high until death atday 6, averaging 91.0% throughout the survival period.
Table 2Protein content, protein growth, RNA:DNA, and LDH in red drum larvae. Protein content was calculated from values reported inTable 1. Where values for % protein or % ash-free dry mass were missing, nearest neighbor values were used. Protein growthwas calculated as described in text. RNA:DNA values are the mean for all RNA:DNA measurements within the last 2 d ofthe ageinterval shown in the table. They are reported as mean ±SD (n). Values for the 25°C pond were taken at day 7 instead of day 6and calculated accordingly. AlIlG-14) day RNA:DNA values are significantly different (P<O.05, Students tl. nd = no data
Day
2 6 10 14 2~ 6-10 10-14 2-14 6-14 6 10 14 6-14 6 10 14
Protein (ug/indiv) Protein growth (%ld) RNA:DNA LDH (unitslgWMl
Starved 8.44 4.07 nd nd -18.20 nd nd nd nd 0.68±0.35 nd nd nd 7.48 nd nd(14)
51mL at20C 7.66 7.55 9.29 16.34 -0.40 5.20 14.10 63.00 9.50 1.51±0.43 1.45±0.24 1.49±0.14 1.50±0.30 9.19 14.44 19.69(6) (4) (4) (14)
51mL at 25"C 9.36 9.77 14:80 . 47,33 . .1.10 10.40 29.10 13.50 19.70 1.15±0.20 1.19±0.32 1.26±0.19 1.25±0.21 15.06 24.33 33.60(2) (31 (7) (12)
Pond 25"C 8.16 15.00 67.70 484.30 12.10 50.20 49.20 34.00 49.60 2.89±0.51 3.06±0.81 3.56±0.27 3.09±0.62 18.94 30.86 42.78(4) (4) (2) (10)
Pond 32"C 8.51 82.20 324.60 1,116.20 56.70 34.30 30.90 46.00 32.60 1.19 2.21 1.39 1.60±0.54 12.69 19.44 26.19

438
The counterpoint to O-ration data is provided bythe data at 5.0 prey/mL at 20°C and 25°C (Table 1).
The data clearly demonstrate accumulation of energy as protein and little storage of lipids. Larvaeraised at 20°C increased in protein level (%AFDM)from 43.74% as eggs to 51.73% as day-14 larvae. Lipidlevels decreased (%AFDM) from 24.34% in eggs to9.17% in day-14 larvae. Protein concentrations increased from 7.66 ~g1individual at day 2 to 16.34 ~g1
individual at day 14. Lipid concentrations increasedfrom 1.53 ~g1individual at day 6 to 2.89 ~g1individual
at day 14. An identical pattern was observed in larvae reared at 25°C (Table 1).
The data set for proximate composition values collected on pond-raised larvae was smaller than idealowing to problems in obtaining adequate sample sizesfrom the ponds. However, the data on accumulatedprotein and lipid concentrations give an excellent indication ofmaximum growth. Pond-raised larvae at 25°Cand 320C showed faster accumulation of total proteinand lipid than larvae raised in the laboratory (Table1). Protein levels of larvae increased in %AFDM from42.70% and 45.62%, in eggs, to 56.22% and 64.16% inday-14 larvae, at 25°C and 32OC, respectively. Lipid levels (%AFDM) decreased from 24.98% to 9.87% at 32°C;decreases in lipid percentages were also observed inthe 25°C pond and in the laboratory-raised larvae.
Pond-reared larvae at 25°C increased in total protein content from 8.16 ~g/individual at day 2 to484.30 ~g1individual at day 14, whereas those keptat 32°C increased from 82.20 ~g1individual at day 7to 1,116.20 J.1g at day 14 (Table 2). Thus, an increasein lOoC resulted in a three-fold increase in protein(~g/individual) in 2-week-old larvae raised in theponds. Lipid values for larvae raised at 25°C and 32°Cwere also much higher than those for larvae raisedin the laboratory; day-14 pond larvae on average hadlipid contents of 85.06 ~g1individual and 171.44 ~g1
individual, respectively.Carbon (%AFDM) remained about the same with
age in all rearing conditions (Table 1), whereas nitrogen (%AFDM) remained fairly constant or increased with age at all ration levels. Carbon-nitrogen (C:N) ratios were higher in larvae kept at a ration level of 0 prey/mL than in larvae raised eitherat 5.0 prey/mL or in the ponds, indicating that protein commanded the largest fraction of the starvedlarva's mass. Values for C:N remained high in starvedlarvae until death at day 5 (4.35 ±0".46). Pond-raisedlarvae had values similar to those" observed in larvae reared on 5.0 prey/mL in the laboratory but wereslightly lower at day 14 (3.56 vs. 3.73). Caloric contents of the larvae were calculated from protein andlipid content by using the conversion factors in Brettand Groves (1979) and are reported in Table 1.
Fishery Bulletin 95(3). J997
Protein-specific growth and biochemicalindicators
Table 2 summarizes results for growth in protein(absolute and instantaneous) and the two biochemical indicators, RNA:DNA and LDH activity, for easycomparison. Instantaneous growth shows an interesting trend with the age interval chosen for calculation. Ifgrowth in protein was calculated from day 2to day 14, larvae exhibit the trends discussed previously for growth in dry mass (see results) where lowest growth was observed in the 20°C laboratory treatment and highest in the 32°C ponds. Ifinstantaneousgrowth was calculated instead for the interval fromday 6 to day 14, the highest growth was observed inthe 25°C ponds (Table 2) and would suggest that thegrowth spurt during the first 4 d of feeding in the32°C pond was important in determining growthduring the larvae's first 14 d of life.
RNA-DNA ratio RNA:DNA in each treatmentshowed a decline from a high value typical of theyolk-sac stage (day 1: grand mean for all treatments4.27 ± 0.83; x ± SD) to a plateau at day 4 that characterized the treatment and showed no significantchange over the remaining 10 days (Fig 3; Table 2).In starved larvae RNA:DNA reached a plateau at avalue of 0.7, indicating that protein synthetic capacity was severely diminished after that time.RNA:DNA in larvae raised at 5.0 prey/mL in the laboratory showed a gradual decline to a plateau of 1.5at 20°C and 1.3 at 25°C (Fig 3; Table 2); values at theplateau were significantly different between the twotemperatures (ANOVA: df=25, F=6.31, P=0.019)
Pond-raised larvae had higher growth rates thanlaboratory-reared individuals (Figs. 1 and 2; Tables1 and 2), and values for RNA:DNA were much greaterin the 25°C pond than in any of the laboratory treatments (Fig. 3). Larvae raised in the ponds at 25°Chad a value of 3.6 at 2 weeks of age, whereas thosereared at 32°C averaged 1.5 at day 14. RNA:DNAvalues were significantly different between the twopond treatments (ANOVA: df=12, F=14.19, P=0.003),
Three treatments took place at a temperature of25°C: starved, 5 prey/mL, and pond. Ifprotein growthrates and RNA:DNA are compared between laboratory and ponds at 25°C (Table 2), there is an excellent correlation between protein growth andRNA:DNA. Instantaneous protein growth rate in thelaboratory was 13.5%/d from day 2 to day 14; in thepond it was 34%/d over the same interval: an increaseof 2.5 fold. RNA:DNA showed an increase of 1.3 to3.0 in laboratory- versus pond-reared larvae over thesame interval with a similar 2.3-fold increase. Thenegative growth observed in starved larvae at 25°C

Brightman et al.: Energetics of larval Sciaenops ocellatus 439
4
3
2
A 4
3
2
D
O........_--.L~_~~~~"'""':"::'~ .........':'o 3 6 9 12 15
-
-
-E'-
/fleXion2
3
4B4
:~.-----"---'---
<CZC
~a:
4 c3
2• flexion
--~
Age (days)
Figure 3RNA:DNA of red drum larvae raised in the laboratory and in growout ponds: (A) laboratory, 25·C and 0 prey/mL: (B) laboratory, 20·C and 5 prey/mL; (C) laboratory, 25·C and 5prey/mL; (D) pond. 25OC; and (E) pond, 32OC.
(-18%/d) also showed a much lower value for RNADNA ratio: 0.7:1. Differences in RNA:DNA betweenthe three treatments were highly significant(ANOVA: df=35, F=107.6, P=O.OOO).
Overall, RNA:DNA was only a modest predictor ofprotein growth. Regression analysis ofprotein growth.(Y, % per d) versus RNA:DNA (x), by using all thevalues in Table 2, showed a marginal fit (y = -3.64+14.76x; P=O.Ol; r 2=0.34). However, as"discussedabove, within a temperature, RNA:DNA was an excellent predictor of instantaneous protein growth,
and this was borne out in a regression using onlythe data collected at 25°C: y (% per d) = -12.43 +17.39 (RNA:DNA); P=O.Ol; r2=0.64. The performanceof RNA:DNA as an overall predictor was improvedsignificantly by using a multiple regression equationwith a temperature term (Table 3).
LDH Activity LDH activities of laboratory-raisedlarvae increased with age at ration levels of 0 and5.0 prey/mL and with temperatures of20°C and 25°C(Fig 4). Larvae that were starved continued to pro-

440 Fishery Bulletin 95(3). J997
60 ""- A 60 D50 f-
40 y= -0.129 + 1.268 ±0.139 X
,2 = 0.65
20
30
1512963o
20
10
30
40 Y= 1.06 + 2.98 ± 0.342 X"
,2 = 0.86
1512963o
10~:...01-' I
60
50
40
30
20
10
o
Y= 1.319 + 1.312 ±0.174 X
,2 =0.82
12 15
60
50
40
30
20
10
Y = 2.562 + 1.688 ± 0.750 X
,2 = 0.56
E
c
40 Y= 1.157 + 2.317 ± 0.249 X flexion
,2 =0.9430
20
o 3 6 9 12 15
Age (days)
Figure 4LDH activity (unitslgWM) in red drum larvae raised in the laboratory and in growoutponds: (AI laboratory, 25"C and 0 prey/mL; (B) laboratory. 20°C and 5 prey/mL; (C) laboratory, 25"C and 5 prey/mL; (DI pond. 25°C; and lEI pond. 32°C.
duce LDH, although at lower concentrations thanthose for fed individuals, until death at day 6. Larvae reared at 20°C had LDH values of 20-25 unitslgWM at day 14. These LDH activities were slightlylower than those for larvae raised at 25°C, which hadLDH values ofbetween 30 and 35 unitslgWM at day14. Larvae reared at 25°C in the ponds averaged LDHactivities of 40-50 unitslgWM, higher than the values for larvae raised at 32°C, which averaged 25-30unitslgWM, and higher than the values for larvaereared in the laboratory.
Like RNA:DNA, LDH activity taken overall wasonly a modest predictor of protein growth rate: y (%
per d) =-8.17 + 1.39 (LDH); P=0.02; r 2=0.39. However, within a temperature, its performance as a predictor was much improved. A regression using onlythe 25°C data yielded an excellent coefficient of determination: y (% per d) = -28.74 + 1.94 (LDH);P=0.003; r2=0.86. A multiple regression with a temperature term improved its use as an overall predictor (Table 3).

Brightman et al.: Energetics of larval Sciaenops ocellatus 441
Table 3Multiple regressions describing instantaneous protein-specific growth (Y; %/d) in red drum larvae versus temperature (T), rationW/ml, 5/mL, and pond), RNA:DNA, and LDH activity (unitslgWM). Only significant regressions are presented (P< 0.05).
Equation
1
2
34
567
T
RationT
RNA:DNATLDHT
Ration
RNA:DNA
LDH
Y n r2 P
Y =2.7IX; - 49.52 20 0.21 0.023
Y =6.35X; - 8.53 20 0.45 0.001
Y =2.07X; + 5.67Xii - 58.34 20 0.57 0.022
Y =14.76X; - 3.64 17 0.30 0.013
Y =2.59X; + 14.6IX;; - 69.41 17 0.56 0.007
Y =1.39X; - 8.17 13 0.34 0.022
Y =2.55Xj + 1.26Xii - 70.35 13 0.57 0.034
Discussion
Growth versus prey density
Standard length and mass measurements Thebasic pattern ofgrowth and development in red drumlarvae, e.g. in size at flexion, was similar for larvaeunder a wide variety of rearing conditions. Withinthe basic blueprint, growth and development of reddrum larvae fed to satiation could be accelerated orretarded according to the rearing temperature.
Thus,larvae raised in the laboratory and the pondsunderwent metamorphosis at roughly the same size,independent of the age of the larvae. In the case ofthe 32°C pond, day-7 larvae were already the size ofday-14 larvae reared at 25°C in the laboratory, andwere at the same stage of development. Similarly,dry mass at transformation was approximately thesame in the laboratory and ponds, despite the differences in chronological age.
Proximate and elemental composition of larvae
Red drum larvae, whether fed to satiation or starved,depleted their lipid level from 40% to 50% by day 6.The increase in protein (%AFDM) reflected the decline in lipid and was most evident in the starvedred drum larvae. Larvae that have been starved conserve protein as musculature until the time ofdeath.Conservation of muscular proteins allows the animal to swim as long as possible before completemuscle atrophy, or "point of no return," allowing thelarvae to search out prey in other, possibly more productive, areas.
The loss of dry mass in starving larvae, comparedto fed larvae ofequal age, reflected the catabolism oflipid and protein (Wallace, 1986). A similar, but lesssevere, drop in lipid was observed in all rearing conditions and has been observed in other species offish.
For example, Fraser et a1. (1987) found that larvalAtlantic herring had a lipid level of 23% dry mass(176 ~g) one day after hatching decreasing to 11%(221 ~g) by day 16. Those percentages were similarto those found for red drum larvae in the presentstudy (20.18% to 11.74%) over the first two weeks oflife. It is likely that lipid serves as a buffer fuel during the early life history of red drum. It is not accumulated. When high-quality food energy is availablein excess, larval red drum larvae grow faster ratherthan accumulate an energy reserve. This is best exemplified by the differences in larvae growing at 25°Cin the laboratory and 25°C in the ponds.
Elemental composition agreed well with other published values for red drum (Lee et aI., 1988) and larval herring of similar size (Ehrlich, 1974, a and b;1975) as well as with our own results on proximatecomposition (Table 1). Larvae that are growing normally, as in the 5.0 prey/mL experiments and theponds, show greater increases in protein than in lipid.The increase in %N with age, and the declining %C,mirrored the changes (protein increase, lipid decrease) in proximate composition. This changing elemental composition resulted in a declining C:N innormally growing larvae. Starving individuals hadslightly higher C:N than fed individuals as a resultof their diminished protein synthesis. Larvae raisedin the ponds have the lowest C:N as a result of thehigh protein levels relative to lipid. Thus, the C:Ncan be used as an indicator ofphysiological status indeveloping fish. It should be noted, however, that thisratio applies in the opposite fashion to adult fish. Adeclining C:N in older fish indicates starvation wherelipid is laid down as an energy reserve and is combusted before protein. The rapidly accumulatingmusculature of a healthy, growing fish larva resultsin a declining C:N, giving the appearance ofstarvation when, instead, this ratio indicates that proteinis accumulating at a faster rate than lipid.

442
Protein-specific growth and biochemicalindicators
RNA-DNA ratio Our values for RNA:DNA fall at thelow end of the range of ratios reported in the literature for larvae reared under a variety of differentconditions (Ferron and Legget, 1994). Wright andMartin (1985) found similar RNA-DNA ratios (1 to 2at 19-21°C) for starved striped bass, whereas fedstriped bass larvae had ratios of 3-3.4 during thefirst two weeks after hatching. Robinson and Ware(1988) observed a similar trend in RNA-DNA ratioswith starvation in the early life oflarval Pacific herrings, as we did with red drum; ratios declined up toyolk-sac absorption, where the ratios leveled off. Values for RNA:DNA obtained in the laboratory in thisstudy (1 to 2) were lower than previously reportedvalues (2 to 4) for red drum larvae (Westerman andHolt,1994).
As has been reported previously <Buckley, 1982;Ferron and Legget, 1994), the relation ofgrowth rateand RNA:DNA changed with temperature. Thehigher mass-specific and protein-specific growthrates observed in the laboratory at 25°C, in comparison with those at 20°C and in the ponds at 32°C, aswell as in comparsion with those at 25°C, were accompanied by lower RNA:DNA values (Tables 1 and2). The inverse relation between RNA:DNA and temperature holds true in field-caught larvae as well. Itwas observed by Setzler-Hamilton et al. (1987), whofound that in late spring, values for RNA-DNA ratios in striped bass larvae were higher than valuesmeasured in hotter, early summer months (springvalues were about 3 and summer values were 2 to2.5).
A high growth rate accompanied by a low RNADNA ratio, such as we observed in the 32°C ponds, isprobably due to an increase in the efficiency of ribosomes in initiating protein synthesis and to an increase in the rate of chain elongation due to a directeffect oftemperature, i.e., an increase in the production of protein per unit of ribosomal RNA due to aQ10 effect (cf. Westerman and Holt, 1988>' Despitethe effect oftemperature on the relation ofRNA:DNAand growth rate, RNA:DNAis a useful tool for determining nutritional status offish larvae, particularlyifit is understood that temperature contributes substantially to the relationship between RNA:DNA andgrowth (Buckley, 1982: Buckley et aI., 1984; Ferronand Legget, 1994).
LDH Activity LDH, the terminal enzyme in vertebrate anaerobic glycolysis, is an important factor inthe ability of some fish to produce sudden bursts ofswimming and is found in large quantities in white
Fishery Bulletin 95(3), J997
muscle (Somero and Childress, 1980). The observedincrease in LDH activity with age until death ofstarved larvae seems at first glance to conflict withpriorities expected ofan energy-deprived individual,in which metabolic processes would be expected tobe declining. However, it is to be expected that LDHactivity would be conserved, even in starving larvae,so that the muscle would remain functional as longas possible. A larva with no capability for movementwould be doomed; thus, a metabolic investment inlocomotory capability makes good adaptive sense.
Unlike in RNA:DNA, LDH activity showed a direct correlation with both mass- and protein-specificgrowth rate in the two fed laboratory treatmentsdespite the increase in temperature from 20°C to25°C. In the ponds, LDH activities showed an interaction with temperature similar to that seen inRNA:DNA, i.e. a lower specific activity at 32°C despite a higher growth rate. In the case of LDH, thedeclining activities observed in larvae from the highertemperature pond probably indicate that a lower concentration of enzyme is sufficient to maintain thecatalytic efficiency needed by the tissues at the highertemperature (cf. Hochachka and Somero, 1984>' Thefact that a similar drop was not noted in the laboratory suggests a threshold for the drop in activity between 25°C and 32°C that was not present in thetransition between 20°C and 25°C.
Clarke et al. (1992) found similar values for LDHin red drum larvae raised on wild zooplankton. Values for LDH activity in Clarke's study, assuming 87%water content, averaged 19-26 units/gWM for twoweek-old larvae, slightly lower than the values weobserved in the larvae raised in the laboratory andponds.
Biochemical parameters as predictive tools
Although similar in their use as biochemical proxiesfor growth, LDH activity and RNA:DNA are fundamentally different in many other respects. RNA:DNAis a ratio of measured quantities, whereas LDH activity is a determination ofa rate: a kinetic measurement. Inherent in the measurement ofRNA:DNA isthe assumption that the methods for determining thequantities of RNA and DNA are accurate, but thereis no direct effect oftemperature on the assay itself.For LDH, activities are measured in saturating conditions of substrate, which means that the activitiesare maximal activities (Vmax from Miehaelis-Mentenkinetics; Lehninger, 1982) for each treatment. It istacitly assumed that ifassays are performed in saturating conditions at the same temperature, the differences in activity, or Vmax ' are due to differencesin concentration of the enzyme. This assumption is

Brightman et al.: Energetics of larval Sciaenops ocellatus
a reasonable one. It is important, however, to beaware of other potential causes of variability in therelation of both RNA:DNA and LDH activity togrowth or condition in fish larvae. It has been demonstrated here and elsewhere (Ferron and Legget,1994) that rearing temperature alters the relationof growth and biochemical proxies for growth. Another potential source ofvariability in the relation isthe scaling ofeach ofthe proxies with individual size.
RNA:DNA increases slightly with individual size(Buckley,1982) but overall is insensitive to thechanges in individual mass that would be expectedin a study of larval fish growth within a single fieldsample. This is not the case for LDH activity whichscales strongly with mass in fishes (e.g. Somero andChildress, 1980; Torres and Somero, 1988). In thisstudy, a significant relation was observed betweenLDH activity <S, unitslgWM) and protein mass (x, ).lgprotein): y = 2.25x 0.187 ; P=0.02; r 2=0.43. RNA:DNAshowed no significant change with size. Our studysuggests that, for maximum accuracy, direct comparisons offield-caught larvae for LDH activity are bestconfined to narrow size ranges or the relation between LDH and size is described empirically. On theother hand, it could be argued that since mass-specific LDH activity increases with increasing mass, itis actually incorporating a growth-specific changewithin its scaling behavior, making it a better proxy.Either way, it shows considerable potential.
Acknowledgments
The authors would like to thank Bill Falls, AnneBurke, and Dan Roberts of the Florida Marine Research Institute for providing red drum larvae andfor considerable help in teaching us culturing techniques. This research was supported by DNR contract C-7701 and NSF OCE 92-18505 to J.J. Torres,and NSF OCE 92-17523 to M.E. Clarke.
Literature cited
Bentle, L. A., S. Datta, and J. Metcoff.1981. The sequential enzymatic detenmnation ofRNA and
DNA. Anal. Biochem. 166:5-16.Brett, J. R., and T. D. D. Groves.
1979. Physiological energetics. In W. S. Hoar, D. J.Randall, and J. R. Brett leds.), Fish physiology, vol. VIII:bioenergetics and growth, p. 279-351. Academic Press,New York, NY.
Buckley, L. J.1980. Changes in ribonucleic acid, deoxyribonucleic acid,
and protein content during ontogenesis in winter flounder, Psuedopleuronectes americanus, and the effect ofstarvation. Fish. Bull. 77:703-709
443
1982. Effects of temperature on growth and biochemicalcomposition of larval winter flounder Psuedopleuronectesamericanus. Mar. Ecol. Prog. Ser. 8:181-186.
Buckley, L. J., S. I. Turner, T. A. Halavik, A. S. Smigielski,S. M. Drew, and G. C. Laurence.
1984. Effects of temperature and food availability ongrowth, survival, and RNA-DNA ratio oflarval sand lanceJAmmodytesamericanus). Mar. Ecol. Prog. Ser. 15:91-97.
Clarke, M. E., C. Calvi, M. Domeier, M. Edmonds, andP.J. Walsh.
1992. Effects of nutrition and temperature on metabolicenzyme activities in larval and juvenile red drum,Sciaenops ocellatus, and lane snapper. Lutjanus synagris.Mar. BioI. (Berl.) 112:31-36.
Donnelly, J., J. J. Torres, T. L. Hopkins. andT. M. Lancraft.
1990. Proximate composition of Antarctic mesopelagicfishes. Mar. BioI. (Berl.) 106:13-23.
Ehrlich, K. F.1974&. Chemical changes during growth and starvation of
herring larvae. In J. H. S. Blaxter (ed.), The early life history offish, p. 301-323. Springer-Verlag, New York, NY.
1974b. Chemical changes during growth and starvation oflarval Pleuronectes plateesa. Mar. Bioi. (Berl.) 24:39-48.
1975. A preliminary study of the chemical composition ofsea-caught larval herring and plaice. Compo Biochem.Physiol. 51B:25-28.
Ferron, A., and W. C. Leggett.1994. An appraisal of condition measures for marine fish
larvae. Adv. Mar. BioI. 30:217-303.Fraser, A. J., J. R. Sargent, J. C. Gamble, and
P. MacLachlan.1987. Lipid class and fatty acid composition as indicators
ofthe nutritional condition oflarvalAtlantic herring. Am.Fish. Soc. Symp. 2:129-143.
Hochachka, P. W., and G. N. Somero.1984. Biochemical adaptation. Princeton Univ. Press,
Princeton. NJ, 537 p.Hoff, F. H., and T. W. Snen.
1987. Plankton culture manual. Florida Aqua Farms,Dade City, Florida, 98 p.
Holt, G. J.1990. Growth and development of red drum eggs and
larvae. In G. W. Chamberlain, R. J. Miget and M. G. Haby(eds.), Red drum aquaculture, p. 46--50. Texas A&M Univ,Galveston, TX.
Holt, G. J., and C. R. Arnold.1983. Effects of ammonia and nitrite on growth and devel
opment of red drum eggs and larvae. Trans. Am. Fish.Soc. 112:314-318.
Holt, G. J., R. Godbout, and C. R. Arnold.1981a. Effects of temperature and salinity on egg hatch
ing and larval survival of red drum, Sciaenops ocellatus.Fish. Bull. 79:569-573.
Holt, J., A. G. Johnson, C. R. Arnold, W. A. Fable Jr., andT. D. Williams.
1981b. Description ofeggs and larvae oflaboratory rearedred drum, Sciaenops ocellata. Copeia 4:751-756.
Houde, E. D., and R. C. Schekter.1983. Oxygen uptake and comparative energetics among
eggs and larvae of three subtropical marine fishes. Mar.BioI. (Ber1.l72:283-293.
Lee, W. Y., S. A. Macho, X. H. Mao, and C. R. Arnold.1988. Dynamics ofelemental and biochemical components
in the early life stages .of red drum (Sciaenops ocellatus).Contrib. Mar. Sci. Suppl. 30:194.

444
Lehninger, A. L.1982. Priciples of biochemistry. Worth Pubis., NewYork,
NY. 1011 p.Robinson, S. M. C., and D. M. Ware.
1988. Ontogenetic development of growth rates in larvalPacific herring, Clupea harengus pallasi, measured withRNA-DNA ratios in the Strait of Georgia, BritishColumbia. Can. J. Fish. Aquat. Sci. 45:1422-1429.
Setzler-Hamilton, E. Mo, D. A. Wright, F. D. Martin,C. V. Millsaps, and S. I. Whitlow.
1987. Analysis of nutritional condition and its use in predicting striped bass recruitment: field studies. Am. Fish.Soc. Symp. 2:115-128.
Somero, G. N., and J. J. Childress.1980. A violation ofthe metabolism-size scaling paradigm:
activities ofglycolytic enzymes in muscle increase in largersize fish. Physioi. Zooi. 53:322-337.
Stickney, D. G., and J. J. Torres.1989. Proximate composition and energy content of meso
pelagic fishes from the eastern GulfofMexico. Mar. BioI.<Beri.) 103:13-24.
Fishery Bulletin 95(3). 1997
Swingle, W. E.1990. Status ofthe commercial and recreational fishery. In
G. W. Chamberlain, R. J. Miget, and M. G. Haby (eds.),Red drum aquaculture. p. 22-29. Texas A&M Univ.,Galveston, TX.
Torres, J. J., and G. N. Somero.1988. Metabolism, enzymatic activities and cold adaptation
in Antarctic mesopelagic fishes. Mar. BioI. (Beri.) 98:169180.
Wallace, P. D.1986. A note on the seasonal change in fat content of the
autumn-spawning herring in the northern Irish Sea. J.Mar. BioI. Assoc. <U.K.) 66:71-74.
Westerman, M. E., and G. J. Holt.1988. The RNA-DNA ratio: measurement of nucleic acids
in larval Sciaenops ocellatus. Contrib. Mar. Sci. Suppi.30:117-124.
Wright, D. A., and F. D. Martin.1985. The effect of starvation on RNA:DNA ratios and
growth oflarval striped bass, Morone saxatalis. J. Fish.BioI. 27:479--485.