energetics and the evolution of carnivorous plants
TRANSCRIPT

Energetics and the evolution of carnivorous plants - Darwin's "most wonderful plants in the world"
CitationEllison, Aaron M. and Nicholas J. Gotelli. Energetics and the Evolution of Carnivorous Plants - Darwin's "Most Wonderful Plants in the World." Journal of Experimental Botany 60(1): 19-42.
Published Versionhttp://dx.doi.org/10.1093/jxb/ern179
Permanent linkhttp://nrs.harvard.edu/urn-3:HUL.InstRepos:2265303
Terms of UseThis article was downloaded from Harvard University’s DASH repository, and is made available under the terms and conditions applicable to Open Access Policy Articles, as set forth at http://nrs.harvard.edu/urn-3:HUL.InstRepos:dash.current.terms-of-use#OAP
Share Your StoryThe Harvard community has made this article openly available.Please share how this access benefits you. Submit a story .
Accessibility

1
1
2
3
4
5
6
7
8
9
10
11
12
13
14
15
16
17
18
19
20
21
22
23
24
Energetics and the evolution of carnivorous plants – Darwin’s “most
wonderful plants in the world”
Aaron M. Ellison1,* and Nicholas J. Gotelli2
1Harvard Forest, Harvard University, 324 North Main Street, Petersham,
Massachusetts 01366 USA
2Department of Biology, University of Vermont, 120 Marsh Life Sciences Building,
Burlington, Vermont 05405 USA
Received: 6 May 2008; Revised 3 June 2008; Accepted XX YYYY 2008.
Suggested running head: Carnivorous plants since Darwin
Number of tables: 1
Number of figures: 8
*To whom correspondence should be addressed:
Aaron M. Ellison
Harvard Forest
Harvard University
324 North Main Street
Petersham, Massachusetts 01366 USA
tel: +1-978-724-3302 x278
fax: +1-978-724-3595
Email: [email protected]

2
25
26
27
28
29
30
31
32
33
34
35
36
37
38
39
Abbreviations: Amass, mass-based photosynthetic rate in nmol CO2 g-1 s-1; ANOVA,
analysis of variance; atpB, chloroplast gene encoding the β chain of membrane-bound
ATP synthase; C-value, amount of DNA in a haploid nucleus (in millions of base pairs
[Mbp]); coxI, mitochondrial gene encoding subunit 1 of cyctochrome c oxidase ; ITS,
internal transcribed spacer; JChao, the Chao-Jaccard abundance-weighted index of
similarity; nrITS, nuclear ribosomal ITS; matK, chloroplast gene believed to encode a
maturase, it is located within the trnK intron; PIE, probability of interspecific encounter,
used here as a measure of specialization on prey by carnivorous plants; PRT1, nuclear
gene encoding peptide transferase 1; rbcL, chloroplast gene encoding ribulose-
bisphosphate carboxylase; rps16, a non-coding chloroplast intron; rRNA, ribosomal
ribonucleic acid; RRTree, software for comparing sequence divergence rates among
related lineages. By extension, it has also come to mean the statistical relative-rate test
between groups of sequences on a phylogenetic tree; trnK, a non-coding chloroplast
intron; it includes the matK exon; trnF and trnL, two other non-coding chloroplast
introns; trnL-F, intergenic spacer between the trnL and trnF introns.

3
40
41
42
43
44
45
46
47
48
49
50
51
52
53
54
55
56
57
58
59
60
61
62
63
Abstract
Carnivory has evolved independently at least six times in five angiosperm
orders. In spite of these independent origins, there is a remarkable
morphological convergence of carnivorous plant traps and physiological
convergence of mechanisms for digesting and assimilating prey. These
convergent traits have made carnivorous plants model systems for addressing
questions in plant molecular genetics, physiology, and evolutionary ecology.
New data show that carnivorous plant genera with morphologically complex
traps have higher relative rates of gene substitutions than do those with simple
sticky traps. This observation suggests two alternative mechanisms for the
evolution and diversification of carnivorous plant lineages. The “energetics
hypothesis” posits rapid morphological evolution resulting from a few changes
in regulatory genes responsible for meeting the high energetic demands of
active traps. The “predictable prey capture hypothesis” further posits that
complex traps yield more predictable and frequent prey captures. To evaluate
these hypotheses, available data on the tempo and mode of carnivorous plant
evolution were reviewed; patterns of prey capture by carnivorous plants were
analyzed; and the energetic costs and benefits of botanical carnivory were re-
evaluated. Collectively, the data are more supportive of the energetics
hypothesis than the predictable prey capture hypothesis. The energetics
hypothesis is consistent with a phenomenological cost-benefit model for the
evolution of botanical carnivory and also accounts for data suggesting that
carnivorous plants have leaf construction costs and scaling relationships among
leaf traits that are substantially different from non-carnivorous plants.

4
64
65
66
Key words: carnivorous plants, competition, construction costs, cost-benefit model,
Darwin, energetics, niche overlap, phylogeny, prey capture, universal spectrum of leaf
traits.

5
67
68
69
70
71
72
73
74
75
76
77
78
79
80
81
82
83
84
85
86
87
88
Introduction
“This plant, commonly called Venus’ fly-trap, from the rapidity and force of its
movements, is one of the most wonderful in the world.”
(C. Darwin, Insectivorous Plants, p. 231)1
Carnivorous plants have evolved multiple times among the angiosperms (Fig. 1), and
the degree of morphological and physiological convergence across carnivorous taxa is
remarkable. Molecular sequence data have revealed the phylogenetic history of the
angiosperms (Stevens, 2007) and have yielded a better understanding of the patterns of
evolution of carnivorous plants. The availability of reliable phylogenies, new
observations and experiments, cost-benefit models (Givnish et al., 1984; Laakkonen et
al., 2006), and contemporary statistical methods have allowed carnivorous plants to
emerge as model systems that can be used to address a wide range of questions arising
from plant molecular genetics to physiology and evolutionary ecology (Ellison and
Gotelli, 2001; Ellison et al., 2003).
Charles Darwin laid the foundation for modern research on carnivorous plants.
In Insectivorous Plants, Darwin (1875) applied his then relatively new conception of
homology to illustrate evolutionary and functional convergence across seemingly
unrelated taxa. He provided the first detailed descriptions of the structures by which
eight genera of plants could entrap insects. With careful observations and clever
experiments, Darwin determined for the first time that these plants directly dissolved
1 All quotations from Darwin’s Insectivorous Plants are from the second (1898) edition.

6
89
90
91
92
93
94
95
96
97
98
99
100
101
102
103
104
105
106
107
108
109
110
111
animal protein using enzymes whose action was similar to pepsin and other proteases
(see also Hepburn et al., 1919, 1927). He further showed that dissolved nutrients were
directly absorbed by carnivorous plants and that captured prey contributes significantly
to plant growth (Darwin, 1875).
Drawing on more than 125 years of subsequent research, this review surveys
recent progress in three areas of inquiry that Darwin initiated in Insectivorous Plants:
(1) the tempo and mode of carnivorous plant evolution; (2) patterns and processes of
prey capture; and (3) the energetic costs and benefits of botanical carnivory. These three
research fronts are unified by stable phylogenetic placement of carnivorous taxa, new
data on gene evolution in carnivorous plants (Jobson and Albert, 2002; Müller et al.,
2004), and Laakkonen et al.’s (2006) refinement of the cost-benefit model for the
evolution of botanical carnivory originally formulated by Givnish et al. (1984).
Current understanding of the phylogenetic placement of carnivorous plants re-
affirms the occurrence of convergence in trapping mechanisms. Genomic data suggest
biochemical, physiological, and ecological mechanisms that could have led to the rapid
diversification of at least some carnivorous plant lineages. New analyses of published
data on prey capture permit the evaluation of the degree of specialization among
carnivorous plant genera and link evolutionarily convergent traits with the ecologically
important process of predation. The use of carbon to measure both costs and benefits of
carnivory allows carnivorous plants to be placed into the “universal spectrum of leaf
traits” (Wright et al., 2004, 2005) that reflects fundamental trade-offs associated with
the allocation of carbon to structural tissues and photosynthesis (Shipley et al., 2006).

7
112
113
114
115
116
117
118
119
120
121
122
123
124
125
126
127
128
129
130
131
132
133
134
135
The tempo and mode of carnivorous plant evolution
“By comparing the structure of the leaves, their degree of complication, and
their rudimentary parts in the six genera [Drosophyllum, Roridula, Byblis,
Drosera, Dionaea, and Aldrovanda] , we are led to infer that their common
parent form partook of the characters of Drosophyllum, Roridula, and Byblis.”
(Insectivorous Plants, p. 289)
“It stands accordingly to reason that the carnivorous plants are quite as old as
angiospermy, as an independent angiospermous group bound with still older
groups eventually beyond the limits of angiospermy.”
(Croizat, 1960: 129)
In The Origin of Species, Darwin (1859) asserted the importance of homology – the
similarity of traits resulting from shared ancestry – for understanding evolutionary
relationships. Although the importance of homologous traits (including sequences of
DNA, genes, and proteins) in reconstructing phylogenies is widely recognized, actually
identifying them remains a challenge. Nowhere is this challenge more evident than in
the history of the placement of carnivorous plants in angiosperm phylogenies (Juniper et
al., 1989). A proper interpretation of patterns of prey capture, gene sequence data, and
the evolution of carnivory all rely on firm knowledge of the phylogenetic placement of
carnivorous plants and on stable nomenclature. Therefore, this review begins with a
survey of current knowledge of carnivorous plant systematics, focused on how recent
syntheses of molecular and morphological data illuminate the two most disparate

8
136
137
138
139
140
141
142
143
144
145
146
147
148
149
150
151
152
153
hypotheses for the evolution and diversification of carnivorous plants: Darwin’s (1875)
hypothesis that the specialization and evolutionary novelty of carnivorous plants
indicated convergence in independent lineages, and Croizat’s (1960) hypothesis that
carnivory evolved once near the base of the angiosperm lineage.
Darwin asserted that all of the species with sticky-leaf (or “flypaper”) traps in
the genera Drosera, Byblis, Roridula, and Drosophyllum, along with the snap-trapping
Venus’ fly-trap (Dionaea muscipula Ellis) and the water-wheel plant (Aldrovanda
vesiculosa L.) were closely related (19th century botanists placed all six genera in the
Droseraceae, the sundew family). In Insectivorous Plants, he discussed in detail the
apparent homology of the sessile glands that they use to digest prey. He also asserted
that neither the butterworts (Pinguicula) (or the other Lentibulariaceae: Genlisea and
Utricularia), nor the Asian pitcher plants (Nepenthes) were “at all related to the
Droseraceae” (Insectivorous Plants, p. 292). Darwin appears to have had little
familiarity with the American pitcher plants (Sarracenia, Darlingtonia, and
Heliamphora), nor did he discuss the Australian pitcher plant Cephalotus follicularis
Labill. (Cephalotaceae),2 but it is safe to say that he recognized at least three lineages of
carnivorous plants: his “Droseraceae”, the Lentibulariaceae, and the (Asian) pitcher
plants (Nepenthaceae).
2 Sarracenia is mentioned in passing only on the penultimate page of Insectivorous Plants. In a letter to
W. Thiselton-Dyer (letter 724 in F. Darwin, 1903), he refers to Asa Gray’s examination of Sarracenia. In a letter to J.D. Hooker (letter 726 in F. Darwin, 1903), he writes of hoping that Hooker will resume work on Cephalotus and Sarracenia and provide comparative data for Darwin’s ongoing studies of Utricularia.

9
154
155
156
157
158
159
160
161
162
163
164
165
166
167
168
169
170
In contrast to Darwin, Croizat (1960) asserted a common origin for all
carnivorous plants and placed them close to the base of the entire angiosperm lineage.3
Croizat (1960) asserted that the Lentibulariaceae, and in particular Utricularia, was the
basal angiosperm group, with morphological evolution proceeding from the relatively
amorphous Utricularia with its vestigial leaves, stems, and roots that are barely
distinguishable from one another, to plants with more differentiated characters including
cladodes, shoots, and leaves. In Croizat’s view, Nepenthes was derived directly from
Utricularia.4 Although the scant fossil record of carnivorous plants does suggest a long
evolutionary history for at least some taxa (Thanikaimoni and Vasanthy, 1974; Li, 2005;
Heubl et al., 2006), modern phylogenetic analyses of molecular markers and DNA
sequences suggest that carnivorous plants are highly derived, polyphyletic taxa. And
contrary to Croizat's (1960) assertions, carnivorous plants do not represent a
monophyletic ancestral Ur-angiosperm, nor are the vestigial structures of Utricularia
evolutionary precursors to the more familiar morphological characters of higher plants.
Progress in resolving familial relationships
3 “The ‘carnivorous ancestor’ can of course be figured, as I have, in function of a morphogenetic and
phylogenetic average quantified to fit everything – by tendency – between the Podostemonaceae / Lentibulariaceae and the Sarraceniaceae / Dioncophyllaceae.” (Croizat, 1960: 256)
4 “The difference in all these regards between Nepenthes, and Utricularia and other lentibulariaceous genera is in every respect one of degree, not at all one of kind. The “runner” which in the latter aggregate becomes by easy steps under our own eyes “cladode” and “leaf” (cf., e.g., U. alpina / Pinguicula vulgaris) is by now fully fixed as “foliage” in Nepenthes. ...the interrelations between “foliage” and “stem” turn out to be far more complicated in Nepenthes than they are in the simplest forms of the Lentibulariaceae [i.e., Utricularia].” (Croizat, 1960: 181-182).

10
171
172
173
174
175
176
177
178
179
180
181
182
183
184
185
186
187
188
189
190
“[C]onstructive discussion is out of the question, and attempts made at
demonstrating, e.g., that Utricularia is “derivative” forthwith disqualify their
proponents as essentially ill informed.”
(Croizat, 1960: 120)
Carnivorous plants can be found in four of the major angiosperm lineages (the
Monocots, Core Eudicots, Rosids, and Asterids), and in five orders: Poales,
Caryophyllales, Oxalidales, Ericales, and Lamiales (Fig. 1). Convergence of
carnivorous plants and their traps is most apparent at the ordinal level, whereas gene
sequences have distinguished between convergence and homology within orders,
families, and genera.
Over 95% of the more than 600 species of carnivorous plants are currently
placed within the Caryophyllales and Lamiales (Fig. 1). New combined analyses based
on sequences of the trnK intron and its associated matK gene, additional chloroplast
genes (atpB, rbcL), and nuclear 18S rDNA have clarified relationships among
carnivorous families within the Caryophyllales (Heubl et al., 2006). These analyses
simultaneously confirm one of Darwin’s notions of homology,5 but dispel another:6
Aldrovanda vesiculosa and Dionaea muscipula are sister taxa, and this clade of snap-
trappers is a sister group to the sundews (Drosera) with their sticky leaves (Cameron et
al., 2002, Rivadavia et al., 2003).
5 “these octofid projections [of the footstalk, backs of leaves, and spikes of Dionaea] are no doubt
homologous with the papillae on the leaves of Drosera rotundifolia” (Insectivorous Plants, p. 233) 6 “The circumferential part of the leaf of Aldrovanda thus differs greatly from that of Dionaea; nor can
the points on the rim be considered as homologous with the spikes round the leaves of Dionaea, as these latter are prolongations of the blade, and not mere epidermic productions. They appear also to serve for a widely different purpose.” (Insectivorous Plants, p. 263)

11
191
192
193
194
195
196
197
198
199
200
201
202
203
204
205
206
207
208
209
210
211
212
213
Three other carnivorous families – Nepenthaceae, Drosophyllaceae, and
Dioncophyllaceae – also are clearly rooted within the Caryophyllales (Fig. 1). All three
of these families are in a large clade linked to the Droseraceae by a common ancestor,
presumably one with flypaper traps. Contrary to Darwin’s hypothesis that Nepenthes
was “not at all related to the Droseraceae” (Insectivorous Plants, p. 292), this genus
(i.e., its monogeneric family, the Nepenthaceae) is the sister group of the Droseraceae
(Fig. 1). The dewy pine Drosophyllum lusitanicum Link is now firmly established in its
own family (Drosophyllaceae), and carnivory appears to have been re-derived in the
Dioncophyllaceae by the flypaper-trapping Triphyophyllum peltatum (Hutch. & Dalz.)
Airy Shaw (Cuenoud et al., 2002; Heubl et al., 2006).
Carnivory also had more than one independent origin in the Lamiales (Müller et
al., 2004, 2006; Fig. 1). As in the Caryophyllales, evolution of trap structure in
carnivorous Lamiales has proceeded from flypaper traps in Pinguicula to the more
complex, unidirectionally twisted “eel” traps in Genlisea and the bladder traps of
Utricularia with their unique suction mechanism (Lloyd, 1942; Guisande et al., 2007).
At least half of all described carnivorous species are in these three genera, which
historically were linked based on shared floral characters (Taylor, 1989). Contemporary
molecular analysis unites them based on shared sequences in the trnL and rps16 introns,
rbcL, the functional coxI and matK genes, and 5.8S rDNA (Jobson and Albert, 2002;
Jobson et al., 2003; Cieslak et al., 2005; Müller et al., 2004, 2006). Despite Croizat’s
posthumous protestations to the contrary, both genetic and morphological data support
the monophyly of the Lentibulariaceae, with Pinguicula sister to a Genlisea-Utricularia
clade. However, contrary to Albert et al. (1992), it is clear that the other carnivorous
12
214
215
216
217
218
219
220
221
222
223
224
225
226
227
228
229
230
231
232
233
family in this order, the Byblidaceae (fide Płachno et al., 2006), is neither directly
ancestral to the Lentibulariaceae nor even closely related to it (Fig. 1).
The three remaining carnivorous dicot families – Roridulaceae, Sarraceniaceae,
and Cephalotaceae – illustrate variations on the convergent theme of trap evolution.
Based on rbcL and 18S rDNA analyses, the African endemic Roridulaceae (two species)
was considered to be the sister to the American Sarraceniaceae (three genera, 27
species) in the Ericales (Albert et al., 1992; Conran and Dowd, 1993). But the current
placement of these two families in the overall angiosperm phylogeny (Stevens, 2007)
reverses this, and has the Sarraceniaceae with its pitcher traps sister to a clade
containing the sticky leaved Roridulaceae and the non-carnivorous Actinidicaceae. If
this placement is confirmed, it would represent one instance among carnivorous plant
lineages of morphologically more complex traps (here, pitchers) being ancestral to
simpler sticky traps. Similarly, the Australian endemic Cephalotus follicularis
(Cephalotaceae) has no apparent sticky-leaved ancestor (Fig. 1).
Within the monocots, carnivory also has evolved at least twice in the
Bromeliaceae genera Brocchinia (B. hectioides Mez, B. reducta Baker, and possibly B.
tatei L.B. Smith) (Givnish, et al., 1984; Benzing et al., 1985) and Catopsis berteroniana
(Schultes & Schultes) Mez (Frank and O’Meara, 1984). As with Cephalotus, there is no
apparent sticky-leaved sister group to these bromeliads with pitcher traps.

13
234
235
236
237
238
239
240
241
242
243
244
245
246
247
248
249
250
251
252
253
254
255
Progress in resolving generic and subgeneric relationships
“...at the present moment, I care more about Drosera than the origin of all the
species in the world.”
(Darwin 1860, in a letter to Charles Lyell7)
As the ordinal placement and systematics of carnivorous plant families have stabilized,
attention has turned to resolving relationships among the genera and to resolving
subgeneric relationships in the most speciose carnivorous genera – Drosera, Nepenthes,
Pinguicula, Genlisea, Utricularia, and Sarracenia. In most cases, phylogenetic patterns
based only on inferred homologous morphological traits have been misleading. But
when morphological data have been combined with molecular analyses, novel insights
into the evolution and biogeography of these carnivorous plant genera have emerged.
Drosera
As mentioned above, Drosera, Dionaea, and Aldrovanda form a well-supported clade,
with snap-trapping having evolved only once in the clade consisting of Dionaea and
Aldrovanda (Cameron et al., 2002; Rivadavia et al., 2003). The infrageneric
classification of Drosera, on the other hand, has gone through many revisions. All data
point to the basal position of D. regia Stephens, a South African narrow endemic, in the
monophyletic Drosera clade. Beyond that conclusion, however, there is little
concordance among different proposed phylogenies and subgeneric classifications.
7 Page 492 of the 1911 edition of The Life and Letters of Charles Darwin, edited by F. Darwin.

14
256
257
258
259
260
261
262
263
264
265
266
267
268
269
270
271
272
273
274
275
276
277
278
Seine and Barthlott (1994) proposed a morphology-based classification of
Drosera consisting of three subgenera and 11 sections, but this classification is not
congruent with phylogenies based on molecular data alone (Rivadavia et al., 2003,
Williams et al., 2004) or on combining molecular and morphological data (Rivadavia et
al., 2003). Further, different statistical analyses of rbcL data (e.g., using MacClade in
Rivadavia et al., 2003 and PAUP in Williams et al., 1994) do not concur. For example,
Williams et al. (1994) identified a “capensis” clade consisting of South African and
non-Australian temperate species, but this clade was not clearly identified by Rivadavia
et al. (2003), who sequenced many more species than did Williams et al. (1994).
Rivadavia et al. (2003) hypothesized that Drosera originated in southern Africa or in
Australia; that South American species arose by dispersal from Australia; and that
African species other than D. regia and D. indica L. were subsequently derived from
South American ancestors. While shades of Croizat and Gondwanan vicariance could be
inferred from this analysis, a Gondwanan origin of Drosera is not supported by the
recent evolution of the Droseraceae (Rivadavia et al., 2003). Clearly much more work
remains to be done in this genus.
Nepenthes
About 90 species of Nepenthes, the sister group to the Droseraceae, occur throughout
southeast Asia, with many endemics on Borneo and Sumatra. Biogeographic outliers
(disjuncts) occur in India (N. khasiana Hook. f.), Sri Lanka (N. distillatoria L.), the
Seychelles (N. pervillei Blume), and Madagascar (N. madagascarensis Poir. and N.
masoalensis Schmid-Hollinger) (Dittrich et al., 2001; Meimberg and Heubl, 2006).

15
279
280
281
282
283
284
285
286
287
288
289
290
291
292
293
294
295
296
297
298
299
300
301
Morphology has been of limited use in resolving systematic relationships in this genus
(Jebb and Cheek, 1997), but phylogenetic analysis of Nepenthes has improved
dramatically as molecular data have accrued (Meimberg et al., 2001; Meimberg and
Heubl, 2006). Both chloroplast (trnK intron and matK gene) and nuclear (PRT1 along
with a non-plastid, translocated copy of trnK) genes have been used in phylogenetic
reconstruction (Meimberg et al., 2001; Meimberg and Heubl 2006). These results
suggest that the five western, biogeographically disjunct species listed above are
ancestral to three clades consisting of the Indo-Malayan species. The relatedness and
more importantly the biogeographic origins of these latter species suggest repeated
colonizations and radiations by Nepenthes within the Indonesian islands throughout the
Tertiary (Meimberg and Heubl, 2006).
Pinguicula
As with studies of Drosera and Nepenthes, the new cladistic analyses of Pinguicula do
not agree with historical subgeneric classifications (Casper, 1966; Legendre, 2000).
Based on sequencing of trnK/matK and morphological analysis of 46 of the ~80 species
of Pinguicula, Cieslak et al. (2005) found high levels of support for five discrete,
geographically bounded lineages. This fundamental result supplanted and simplified
earlier subgeneric and sectional classifications (three subgenera and 12 sections; Casper,
1966; Legendre, 2000). In Cieslak et al.’s (2005) new classification, the basal lineage
appears to be tropical, with successive branchings of clades consisting of Eurasian
species, East Asian species, the Eurasian P. alpina L.; and a Central American /
Mexican / Caribbean group (Cieslak et al., 2005; Müller et al., 2006). However,

16
302
303
304
305
306
307
308
309
310
311
312
313
314
315
316
317
318
319
320
321
322
323
324
phylogenetic reconstruction based on sequencing nrITS1 and nrITS2 of 29 species of
Pinguicula offered a different picture (Degtjareva et al., 2006). Although both
phylogenies found some support for a derived Central American / Mexican / Caribbean
clade, and the nrITS-based phylogeny was reasonably congruent with Casper’s (1966)
morphological classification, the remaining clades identified by the nrITS-based
phylogeny were polyphyletic in the trnK-based phylogeny (Cieslak et al., 2005).
Resolving the infrageneric phylogeny of Pinguicula requires clearer definition of
informative morphological and molecular characters as well as sequence data from a
wider range of species.
Genlisea and Utricularia
In contrast with the ongoing systematic confusion in Pinguicula, sequence data from
matK, trnK, rbcL, rps16 and trnL-F (Jobson et al., 2003; Müller et al., 2004, 2006)
generally have supported the infrageneric grouping of the 21 species of Genlisea based
on differences in the way capsules dehisce (Fischer et al., 2000). The South American
subgenus Tayloria is sister to a clade consisting of three African species and five
additional South American species. The African species do not form a natural clade, as
the East African / Madagascan species G. margaretae Hutchinson is more closely
related to the South American species than it is to the remaining African species
(Fischer et al., 2000; Müller et al., 2006).
The ~220 species of Utricularia have been organized into three subgenera and
~21 sections. Analysis of trnL-F, rps16, and trnK sequence data (Jobson et al. 2003;
Müller and Borsch, 2005) suggested a refinement of the three subgenera
17
325
326
327
328
329
330
331
332
333
334
335
336
337
338
339
340
341
342
343
344
345
346
347
Polypompholyx, Bivalvia, and Utricularia. Taylor’s (1989) 34 sections based on
morphology were, with three exceptions (sections Iperua, Setiscapella and
Psyllosperma), upheld as monophyletic. Current analysis suggests a single terrestrial
origin for bladderworts in South America; the aquatic and epiphytic habits of
Utricularia species appear to have been re-derived multiple times within the genus
(Jobson et al., 2003; Müller and Borsch, 2005; Müller et al., 2006).
Greilhuber et al. (2006) reported the remarkable result that many species of
Genlisea and Utricularia have very small nuclear genome sizes. In fact, they found that
Genlisea margaretae (C-value = 63 Mbp), G. aurea St.Hil. (64 Mbp), Utricularia gibba
L. (88 Mbp), U. blanchetii A.DC. (135 Mbp), and U. parthenopipes P. Taylor (140
Mbp) have smaller C-values than that found for the previous record-holder for the
smallest angiosperm genome, Arabidopsis thaliana (L.) Heynh. (157 Mbp). Neither the
functional significance nor the potential role in evolutionary diversification of this
apparent genome simplification in Genlisea and Utricularia is known.
Sarracenia
Recent genetic analyses have revealed perhaps the most taxonomic surprises in the
American pitcher plants (Sarraceniaceae). Three sets of phylogenetic reconstructions,
one based only on the chloroplast rbcL gene (Albert et al., 1992), another that used
rbcL along with two nuclear ITS regions of rDNA (Bayer et al., 1996), and a third that
used ITS-2 along with the 26S rRNA gene (Neyland and Merchant, 2006), all have
supported the monophyly of the Sarraceniaceae. Older analyses of biogeographical
(Croizat, 1960; McDaniel, 1971; Maguire, 1978), palynological (Thanikaimoni and

18
348
349
350
351
352
353
354
355
356
357
358
359
360
361
362
363
364
365
366
367
368
369
370
Vasanthy, 1972), and morphological (Macfarlane, 1893; deBuhr, 1977; Maguire, 1978;
Juniper et al., 1989) data have traditionally grouped the North American genera
Sarracenia and Darlingtonia together and posited that the South American genus
Heliamphora was either sister to, or derived from, a Sarracenia-Darlingtonia clade. In
contrast, all of the molecular data suggest that Darlingtonia is sister to a derived
Sarracenia-Heliamphora clade. This result is concordant with Renner’s (1989)
hypothesis that modern-day Sarraceniaceae are derived from a widespread common
ancestor (or ancestral stock).
These results do not settle the long-standing debate about whether the common
ancestor of modern Sarraceniacae was Neotropical (South America) or subtropical
(southeast North America) (Bayer et al., 1996; Neyland and Merchant 2006). However,
these results do help resolving species-level relationships within the genus Sarracenia.
Three distinct clades now seem plausible in this genus: one consisting of S. psittacina
Michx., S. minor Walt., and S. flava L.; another consisting of S. rubra Walt. (sensu lato),
S. alata Wood, S. oreophila (Kearney) Wherry, and S. leucophylla Raf.; and a third
consisting of S. purpurea L. (sensu lato).
Neither Bayer et al. (1996) nor Neyland and Merchant (2006) provide support
for separation of the S. rubra complex into the separate species and subspecies S. jonesii
Wherry, S. alabamensis Case & Case, S. rubra ssp. gulfensis Schnell, S. rubra ssp.
wherryi (Case & Case) Schnell, and S. rubra ssp. rubra Walt. (Case and Case, 1974,
1976; Schnell, 1977, 1979b; Godt and Hamrick, 1998). Although the S. rubra complex
is clearly derived within the genus (Romeo et al., 1977), the molecular data provide no
apparent discrimination among them. The repeated failure to distinguish them as

19
371
372
373
374
375
376
377
378
379
380
381
382
383
384
385
386
387
388
389
390
391
392
393
distinct taxa raises questions about the separate listing of S. jonesii and S. alabamensis
as endangered species in the United States.
In contrast to the lack of taxonomic differentiation within S. rubra, there do
appear to be significant differences among named taxa within S. purpurea. This species
was divided by Gleason and Cronquist (1991) into two varieties (considered to be
subspecies by Schnell, 2002), S. purpurea purpurea (Raf.) Wherry and S. purpurea
venosa (Raf.) Wherry; the latter has been further subdivided into three varieties: venosa
(Raf.) Fernald; montana Schnell & Determann; and burkii Schnell (Schnell, 1979a,
1993; Schnell and Determann 1997) or two varieties (venosa, montana) and the separate
species S. rosea Naczi, Case & Case (Naczi et al., 1999). The ITS-2 and 26S rRNA
analyses confirmed an earlier study based on allozymes (Godt and Hamrick, 1999); all
data clearly separate S. purpurea venosa var. burkii from the other named varieties of S.
purpurea venosa and S. purpurea purpurea and support its elevation to S. rosea
(Neyland and Merchant, 2006). Because S. rosea is endemic to the Florida panhandle,
additional data on its distribution, demography, and threats to its persistence are
immediately needed to determine if it should be a candidate for listing as threatened or
endangered at either the state or federal level.
Furthermore, both the allozyme work (Godt and Hamrick, 1999) and the
molecular analysis (Neyland and Merchant, 2006) linked the two varieties of S.
purpurea venosa more closely to each other than to S. purpurea purpurea; and the three
taxa diverge from each other by about as much as S. rosea diverges from the S.
purpurea clade (Neyland and Merchant, 2006). Thus, either the three other subspecies /
varieties of S. purpurea each should be raised to species status (as tentatively suggested

20
394
395
396
397
398
399
400
401
402
403
404
405
406
407
408
409
410
411
412
413
by Neyland and Merchant, 2006), or they should be considered as a single species with
broad geographic variability (as suggested by Gleason and Cronquist, 1991; and Ellison
et al., 2004).
Rates of genetic change and new hypotheses arising from carnivorous plant genomics
As phylogenetic hypotheses have stabilized and as more gene sequence data have
accrued for carnivorous plant species, comparative analyses of evolutionary rates of the
different taxa have become possible. Initial attention has focused on the
Lentibulariaceae because of the extreme specialization in trap morphology within the
derived genera Utricularia and Genlisea. Jobson and Albert (2002) found that relative
rates of nucleotide substitutions (based on RRTree computations: Robinson-Rachavi
and Huchon, 2000) in seven loci (trnL/matK intron, trnL second exon, trnL-F spacer,
rps16 intron, cox1, and 5.8S RNA) occurred 4 to 14 times faster in Utricularia than in
Pinguicula. Similarly, Müller et al. (2004) reported that Genlisea and Utricularia have
relative rates of nucleotide substitutions (relative to an Amborella + Nymphaeales out-
group) in matK that are 63% higher than they are in Pinguicula.8 Müller et al. (2004)
also found that substitution rates of Genlisea and Utricularia were higher than those of
292 other angiosperm taxa, and that four other carnivorous plant genera – Pinguicula,
Drosera, Nepenthes, and Sarracenia – had substitution rates more in line with those of
other angiosperms (Fig. 2).
8 This percentage comparison assumes similar molecular clocks and may be biased by using the basal
angiosperm (Amborella + Nymphaeales) as the outgroup in the analysis (Kai Müller, personal communication to A. Ellison, 5 March 2008).
21
414
415
416
417
418
419
420
421
422
423
424
425
426
427
428
429
430
431
432
433
434
435
436
Two hypotheses have been suggested to account for the high rates of molecular
evolution observed in Utricularia and Genlisea. First, Jobson and Albert (2002)
hypothesized that a single or small number of changes in regulatory genes could have
led to rapid morphological evolution in Utricularia. In particular, Jobson et al. (2004)
focused on the coxI subunit of cytochrome c oxidase. They showed that a unique motif
of two contiguous cysteine residues in coxI has been subject to strong selection, and this
novel structure of coxI in Utricularia could help to provide the additional metabolic
energy required to reset Utricularia traps.
As Darwin and Croizat both noted, Utricularia shows little differentiation
between stems, shoots, and leaves. Such “relaxed” morphology is often observed in
aquatic and epiphytic habitats, where neutral buoyancy (in the water) or other
supporting structures (for epiphytes) obviate the need for structural tissues (such as
large stems or wood). Thus, the combination of a unique molecular mutation in a key
metabolic pathway and the relaxed morphological requirements of aquatic and epiphytic
habitats has been hypothesized to be the driver of morphological diversity in this genus
(Jobson et al., 2004; Laakkonen et al., 2006). We refer to this hypothesis as the
“energetics hypothesis”.
Alternatively, Müller et al. (2004) pointed to the extreme specialization of the
traps in Genlisea and Utricularia relative to the sticky leaves of Pinguicula and Drosera
and the pitfalls of Nepenthes and Sarracenia as paralleling the differences in genetic
substitution rates (Fig. 2). Like Jobson et al. (2004), Müller et al. (2004) suggested that
high mutation rates in Utricularia and Genlisea are related to relaxed morphological
constraints. However, Müller et al. (2004) further argued that morphological evolution
22
437
438
439
440
441
442
443
444
445
446
447
448
449
450
451
452
453
454
455
456
457
458
459
in carnivorous plants was achievable because they can directly take up large
biosynthetic building blocks, such as amino acids, peptides, and nucleotides, that the
plants obtain from capturing and dissolving prey. Importantly, Müller et al. (2004)
suggested that Utricularia and Genlisea have more predictable and frequent captures of
prey in their habitats relative to the other carnivorous genera, and that there is a positive
feedback between this reliable supply of prey and further morphological evolution. We
refer to this hypothesis as the “predictable prey capture hypothesis”.
These two hypotheses were formulated for carnivorous Lentibulariaceae
(Genlisea and Utricularia relative to Pinguicula), but the general pattern of complex
traps being derived relative to simple (sticky-leaf) traps (Fig. 1) suggests that these
hypotheses could apply across carnivorous plant lineages. Although the broader
application of these hypotheses to other carnivorous plant lineages is necessarily
speculative, testing between the energetics and predictable prey capture hypotheses
nonetheless could provide further insights into factors driving the evolution of
carnivorous plants. These analyses are the focus of the subsequent sections of this
paper.
Pattern and process in prey capture by carnivorous plants
“Now it would manifestly be a great disadvantage to the plant [Dionaea
muscipula] to waste many days in remaining clasped over a minute insect, and
several additional days or weeks in afterwards recovering its sensibility;
inasmuch as a minute insect would afford but little nutriment. It would be far

23
460
461
462
463
464
465
466
467
468
469
470
471
472
473
474
475
476
477
478
479
480
better for the plant to wait for a time until a moderately large insect was
captured, and to allow all the little ones to escape; and this advantage is
secured by the slowly intercrossing marginal spikes, which act like the large
meshes of a fishing-net, allowing the small and useless fry to escape.”
(Insectivorous Plants, pp. 251-252).
The available phylogenetic data suggest that in all carnivorous lineages except perhaps
the Sarraceniaceae / Roridulaceae clade (Fig. 1), complex traps (pitchers, eel-traps,
bladders) are derived relative to sticky leaved, flypaper traps (Ellison and Gotelli,
2001). Müller et al. (2004) hypothesized that carnivorous genera with rapidly evolving
genomes (Genlisea and Utricularia) have more predictable and frequent captures of
prey than do genera with more slowly evolving genomes; by extension it could be
hypothesized that in general, carnivorous plants with more complex traps should have
more predictable and frequent captures of prey than do those with relatively simple
traps. Increases in predictability and frequency of prey capture could be achieved by
evolving more elaborate mechanisms for attracting prey, by specializing on particular
types of prey, or as Darwin suggested, by specializing on particular (e.g., large) sizes of
prey. In all cases, one would expect that prey actually captured would not be a random
sample of the available prey. Furthermore, when multiple species of carnivorous plants
co-occur, one would predict, again following Darwin,9 that interspecific competition
would lead to specialization on particular kinds of prey.
9 “As species of the same genus have usually, though by no means invariably, some similarity in habits
and constitution, and always in structure, the struggle will generally be more severe between species of the same genus, when they come into competition with each other, than species of distinct genera.” (The Origin of Species, p. 64, 1996 Oxford University Press printing of the 2nd edition [1859]).

24
481
482
483
484
485
486
487
488
489
490
491
492
493
494
495
496
497
498
499
500
501
502
503
The accumulated contents of carnivorous plant traps can provide an aggregate
record of the prey that have been successfully “sampled” by the plant. Over the past 80
years, many naturalists, botanists, and ecologists have gathered data on prey contents of
carnivorous plants from around the world. Such samples can be used to begin to test the
hypothesis that carnivorous plant genera differ in prey composition and to look for
evidence of specialization in prey capture. Here we summarize and synthesize these
data in a meta-analysis to test for differences in prey composition among carnivorous
plant genera, and to look for evidence of specialization in prey capture.
The data
Prey capture data were gathered from 30 studies that were published (in litt. or in
otherwise unpublished M.Sc. and Ph.D. theses) between 1923 and 2007. These studies
encompass 87 records of prey capture for 46 species of carnivorous plants in 8 genera:
Drosera (13 species), Dionaea (1 species), Triphyophyllum (1 species), Nepenthes (11
species), Pinguicula (7 species), Utricularia (5 species), Sarracenia (7 species), and
Brocchinia (1 species). The geographic scope of these data is similarly broad,
encompassing all continents on which carnivorous plants occur. We treated each record
(prey composition of a single plant taxon at a single locality) as an independent
observation, and we did not distinguish within- and between-species variability within
each plant genus. Most studies contained from dozens to thousands of individual prey
items; the one record of Drosera rotundifolia measured by Judd (1959) in southwestern
Ontario, Canada that contained only 6 individual prey items was excluded from the
analysis. Using designations in the original publications, prey were classified into 43

25
504
505
506
507
508
509
510
511
512
513
514
515
516
517
518
519
520
521
522
523
taxonomic groups. For insects, these taxonomic groups were usually orders, although
virtually all authors distinguished ants from other Hymenoptera and this distinction was
retained in the analysis. There were a few coarser classifications (e.g., “Other insects”,
“Mollusca”), but prey in these categories were very rare.
In the majority of the studies, the original data consisted of counts of individual
prey, usually pooled from traps of several plants. Some studies of Pinguicula and other
sticky-leaved plants recorded the number of prey per leaf area, whereas others
summarized data as percentages of captures per trap or as numbers of individuals per
trap. For the purposes of our analyses, all of the observations were converted to the
proportion of prey collected for each species within a study. Most carnivorous plants
consume a wide range of prey; a notable documented exception is Nepenthes
albomarginata Lobb ex Lindl., which, based on field observations (Kato et al., 1993,
Merbach et al., 2002) and stable isotope analysis (Moran et al., 2001), appears to prey
almost exclusively on termites. Among other terrestrial carnivorous plants, captured
prey is dominated by ants and flies (Fig. 3), whereas captured prey of aquatic
Utricularia spp. is dominated by Cladocera (mean = 37% of prey) and cyclopoid
copepods (mean = 36% of prey).10
Do different carnivorous plant genera specialize on particular prey?
Methods of data analysis
10 The raw data and complete list of studies from which the data were drawn is available as dataset HF-
111 from the Harvard Forest data archive: http://harvardforest.fas.harvard.edu/data/p11/hf111/hf111.html.

26
524
525
526
527
528
529
The first question considered was whether there was any indication of specialization by
different carnivorous plant genera. A specialist would be one whose prey consisted of
many individuals of only a few prey taxon, whereas a generalist predator would have
prey consisting of relatively few individuals spread among many different prey taxon. A
useful index of specialization is Hurlbert's (1971) probability of an interspecific
encounter (PIE):
∑−×−
==
S
iip
NNPIE
1
2011
)(. 530
531
532
533
534
535
536
537
538
539
540
541
542
543
544
545
in which S is the number of prey taxa, pi is the proportion of prey taxon i in the sample,
and N is the total number of individual prey items in the sample. PIE ranges from 0 to 1,
and can be calculated for data measured in disparate units such as counts, percentages,
or densities (Gotelli, 2008).
In this analysis, PIE has a simple and direct statistical interpretation: if an
investigator randomly sampled two individual prey items from the same trap (or set of
traps that are pooled for a species in a site), what are the chances that they represented
two different prey taxa? A value of PIE close to 1 implies that the carnivorous plant
genus was not a prey specialist because any two randomly sampled prey items would
likely be from different prey taxa. In contrast, a value of PIE close to 0 implies
specialization on a single prey taxon because any two randomly sampled prey items
would likely be the same. Note that the value of PIE contains no information about the
identity of the prey taxa, only the numbers of prey taxa and the relative distribution of
individuals among them. Thus, two carnivorous plant genera might have identical
values of PIE, but share no prey taxa in common.
27
546
547
548
549
550
551
552
553
554
555
556
557
558
559
560
561
562
563
564
565
566
567
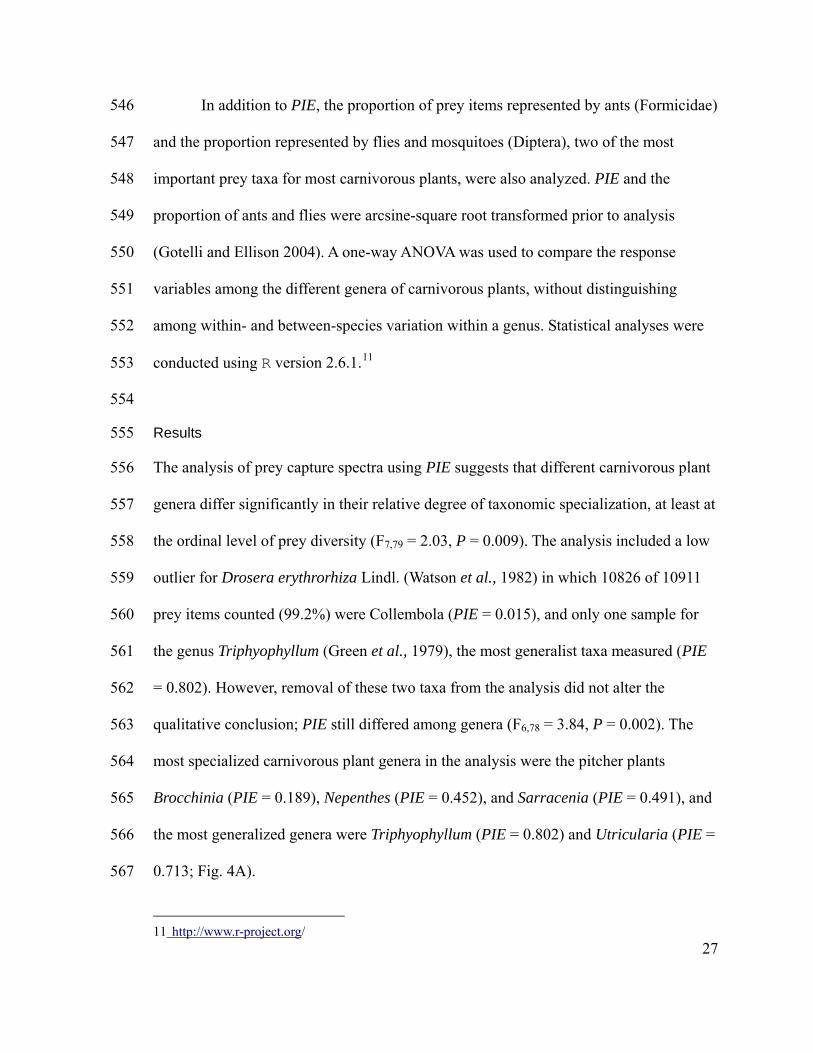
In addition to PIE, the proportion of prey items represented by ants (Formicidae)
and the proportion represented by flies and mosquitoes (Diptera), two of the most
important prey taxa for most carnivorous plants, were also analyzed. PIE and the
proportion of ants and flies were arcsine-square root transformed prior to analysis
(Gotelli and Ellison 2004). A one-way ANOVA was used to compare the response
variables among the different genera of carnivorous plants, without distinguishing
among within- and between-species variation within a genus. Statistical analyses were
conducted using R version 2.6.1.11
Results
The analysis of prey capture spectra using PIE suggests that different carnivorous plant
genera differ significantly in their relative degree of taxonomic specialization, at least at
the ordinal level of prey diversity (F7,79 = 2.03, P = 0.009). The analysis included a low
outlier for Drosera erythrorhiza Lindl. (Watson et al., 1982) in which 10826 of 10911
prey items counted (99.2%) were Collembola (PIE = 0.015), and only one sample for
the genus Triphyophyllum (Green et al., 1979), the most generalist taxa measured (PIE
= 0.802). However, removal of these two taxa from the analysis did not alter the
qualitative conclusion; PIE still differed among genera (F6,78 = 3.84, P = 0.002). The
most specialized carnivorous plant genera in the analysis were the pitcher plants
Brocchinia (PIE = 0.189), Nepenthes (PIE = 0.452), and Sarracenia (PIE = 0.491), and
the most generalized genera were Triphyophyllum (PIE = 0.802) and Utricularia (PIE =
0.713; Fig. 4A).
11 http://www.r-project.org/

28
568
569
570
571
572
573
574
575
576
577
578
579
580
581
582
583
584
585
586
587
588
589
590
Differences among genera in the capture of particular prey taxa also were very
strong. Genera differed dramatically in the proportion of ants and flies captured (ants:
F7.79 = 36.01, P < 10-15; flies F7,79 = 8.29, P = 1.5 × 10⁻⁷). The pitcher plants Brocchinia,
Nepenthes and Sarracenia had the highest proportions of ants in their diets (90%, 73%
and 55% respectively), reflecting their higher specialization values (low PIE). Captures
of ants were much less frequent for the sticky traps of Drosera (3.4%) and Pinguicula
(0.5%), and for the aquatic, bladder-trapping Utricularia (0%). Flies predominated in
the diets of Drosera (44%) and Pinguicula (52%) (Fig. 4C), but were uncommon prey
for Utricularia (3%) and Sarracenia (14%). A notable outlier was a single study of
Sarracenia purpurea by Judd (1959), in which 690 of 1095 prey (63%) were Diptera
(not identified to suborders or families by Judd, 1959).
Collectively, these results illustrate that different genera of carnivorous plants do
indeed selectively capture different prey taxa. In some cases, the differences simply
reflect habitat differences: ants and adult flies are unavailable to aquatic Utricularia or
terrestrial Utricularia with subterranean traps. However, the statistical significance of
differences in captures of flies and ants by pitchers (Sarracenia and Nepenthes) and
sticky traps (Drosera and Pinguicula) is not dependent on the inclusion of Utricularia
in the analysis, but rather do appear to reflect the different morphological
specializations in these genera.
Are they really specialists? Comparisons of captured prey and available prey
Although the frequencies of prey collected in carnivorous plant traps are rarely
equiprobable, a predominance of a single prey taxon, such as ants, need not indicate

29
591
592
593
594
595
596
597
598
599
600
601
602
603
604
605
606
607
608
609
610
611
612
613
specialization because some taxa simply may be more abundant than others. In five
published studies (Watson et al., 1982; Zamora 1990, 1995; Antor and García, 1994;
Harms 1999), the investigators not only collected prey from carnivorous plants but also
used passive traps in the habitat to sample available prey. Watson et al. (1982) used life-
sized and -shaped cardboard models of Drosera erythrorhiza coated with Hyvis 10 (a
tacky inert compound based on polymerized butane) to assess prey available to Drosera
erythrorhiza in the field. Zamora (1990) used life-sized and -shaped paper or wooden
models to assess prey available to Pinguicula nevadense (Lindbg.) and P.
vallisneriifolia Webb., respectively. Antor and García (1994) used sticky cards in one
year (1990) and sticky, life-sized, leaf-shaped models in another year (1991) to assess
prey available to Pinguicula longifolia Ram. ex. DC ssp. longifolia. Harms (1999) used
grab samples to determine prey available to Utricularia intermedia Hayne, U. minor L.
and U. vulgaris L.
The appropriate null hypothesis is that the carnivorous plant is a passive trap:
the relative abundance of the different prey categories does not differ from the relative
abundance of prey in the environment. The alternative hypothesis is that some prey taxa
are selectively attracted or captured by the plant. Under the alternative hypothesis, there
should be a significant difference in the relative proportions of prey caught and the
relative proportions of prey available.
Methods of data analysis
To quantify the similarity of the prey captured by plants with the prey collected in
passive traps, we used the Jaccard Index, J (Jaccard, 1901):
cbaaJ
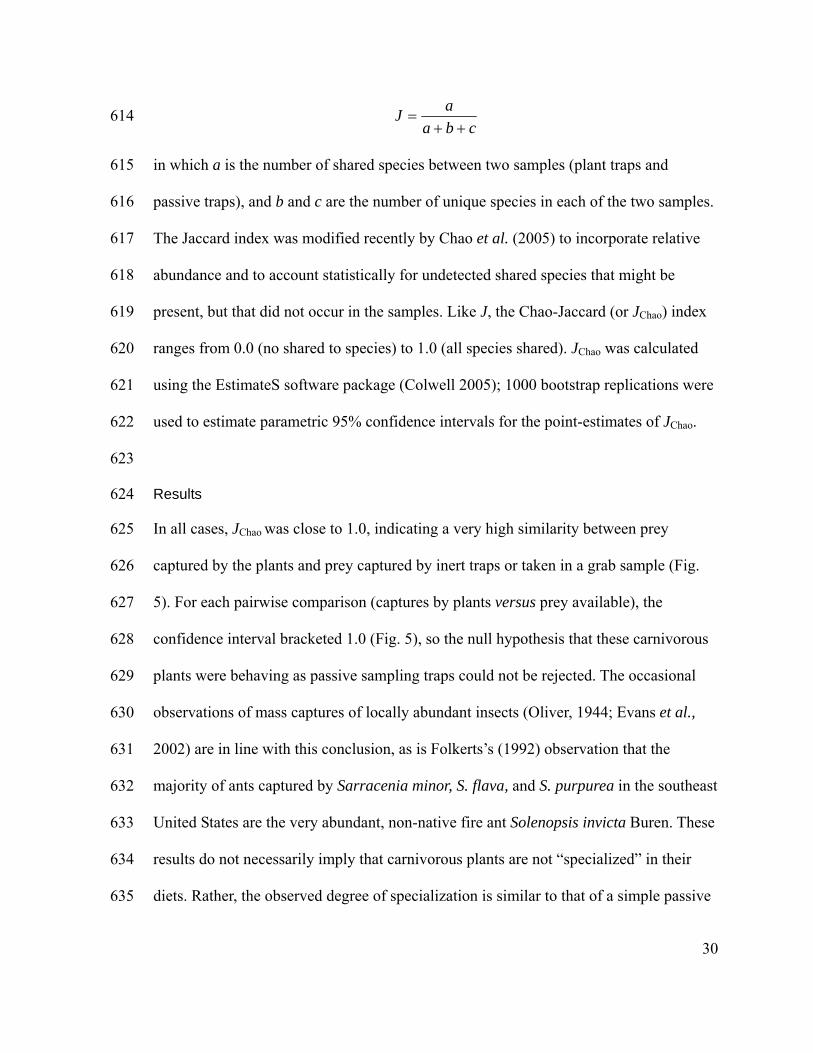
++= 614
615
616
617
618
619
620
621
622
623
624
625
626
627
628
629
630
631
632
633
634
635
in which a is the number of shared species between two samples (plant traps and
passive traps), and b and c are the number of unique species in each of the two samples.
The Jaccard index was modified recently by Chao et al. (2005) to incorporate relative
abundance and to account statistically for undetected shared species that might be
present, but that did not occur in the samples. Like J, the Chao-Jaccard (or JChao) index
ranges from 0.0 (no shared to species) to 1.0 (all species shared). JChao was calculated
using the EstimateS software package (Colwell 2005); 1000 bootstrap replications were
used to estimate parametric 95% confidence intervals for the point-estimates of JChao.
Results
In all cases, JChao was close to 1.0, indicating a very high similarity between prey
captured by the plants and prey captured by inert traps or taken in a grab sample (Fig.
5). For each pairwise comparison (captures by plants versus prey available), the
confidence interval bracketed 1.0 (Fig. 5), so the null hypothesis that these carnivorous
plants were behaving as passive sampling traps could not be rejected. The occasional
observations of mass captures of locally abundant insects (Oliver, 1944; Evans et al.,
2002) are in line with this conclusion, as is Folkerts’s (1992) observation that the
majority of ants captured by Sarracenia minor, S. flava, and S. purpurea in the southeast
United States are the very abundant, non-native fire ant Solenopsis invicta Buren. These
results do not necessarily imply that carnivorous plants are not “specialized” in their
diets. Rather, the observed degree of specialization is similar to that of a simple passive
30

31
636
637
638
639
640
641
642
643
644
645
646
647
648
649
650
651
652
653
654
655
656
657
658
trap of similar size and shape. Unique coloration (e.g., Schaefer and Ruxton, 2008) or
chemical attractants (e.g., Jaffe et al., 1995; Moran, 1996) of some carnivorous plant
genera do not appear to contribute much to the composition of captured prey. Rather,
selectivity of a trap can be understood largely based on the simple geometry of its size,
shape, and orientation. As a caveat, note that the majority of these results are for genera
(Pinguicula, Sarracenia) that have traps that have relatively passive mechanisms for
attracting prey.
Niche overlap among co-occurring carnivorous plants
Darwin (1859) speculated that competition between species is more severe within a
genus. If this is true, co-occurring congeners should partition important ecological
resources, such as space, food, or time (Schoener 1974). Such partitioning should be
reflected in relatively low niche overlap between pairs of species. For carnivorous
plants, this question can be phrased as whether co-occurring congeners show any
evidence of partitioning or specialization on different categories of prey. Folkerts (1992)
provided prey utilization data on five Sarracenia species that co-occur in the
southeastern United States. Porch (1989), Thum (1986), van Achterberg (1973), and
Verbeek and Boasson (1993) provided data on co-occurring species of Drosera in,
respectively, the southeastern United States, Germany, the Netherlands, and
southwestern Australia. These same data were part of the prey utilization analyses
described above, but here these data are isolated for more detailed analysis of niche
overlap.

32
659
660
661
662
Methods of data analysis
How much niche overlap would be expected by chance, in the absence of any
competition? The EcoSim software (Gotelli and Entsminger 2007) was used to quantify
niche overlap using Pianka’s (1973) index of overlap in resource use:
∑
∑=
=
=
n
iii
n
iii
pp
ppO
1
22
21
121
12
))(( 663
664
665
666
667
668
669
670
671
672
673
674
675
676
677
678
679
where p1i and p2i are the proportion of prey used by species 1 and species 2,
respectively. O12 ranges from 0.0 (no shared prey) to 1.0 (identical prey utilization), and
is calculated for each pair of species in an assemblage. For assemblages with more than
two species, we calculated the average of all pairwise values of Oij, where i and j index
each species. Null model analysis (Gotelli and Graves 1996) is a statistical method for
randomizing ecological data to see whether patterns are more extreme than expected by
chance. Thus, to determine whether our average value of Oij differed from that expected
under the null hypothesis that the niche overlap reflected only random interactions, the
software “reshuffled” the observed utilization values to generate expected overlap in a
null community that was unstructured by competition. We used the “RA-3” algorithm in
EcoSim; it retains observed niche breadths within a species, but randomizes the
particular prey categories that were used. This algorithm has good statistical properties
(Winemiller and Pianka 1990) and has been used in many other studies of niche overlap
(reviewed in Gotelli and Graves 1996).
Results

33
680
681
682
683
684
685
686
687
688
689
690
691
692
693
694
695
696
697
698
699
700
701
702
For the most species-rich assemblages (5 species of Sarracenia [Folkerts, 1992] and 5
species of Drosera [Verbeek and Boasson, 1993]), niche segregation was not observed
(Table 1). In the Sarracenia assemblage, the highest observed niche overlap was
between Sarracenia flava and Sarracenia purpurea (overlap = 0.99) and the lowest
overlap was between Sarracenia leucophylla and Sarracenia psittacina (overlap =
0.26). The average overlap for all 10 unique pairs was 0.637 (Table 1), which is about
midway between complete segregation (0.0) and complete overlap (1.0). However, in
the simulated “null assemblages”, the average niche overlap was only 0.197, and the
observed overlap in the real Sarracenia community was larger than that found in 998
out of 1000 simulation trials. Thus, the real five-species Sarracenia assemblage (and all
pairwise comparisons) showed significantly more niche overlap than expected by
chance (P = 0.002), directly contradicting the hypothesis of niche segregation in
sympatry.
Similar results were found for five species of co-occurring Drosera at the
Fitzgerald River site in southwestern Australia (Verbeek and Boasson, 1993). Observed
pairwise niche overlaps ranged from 0.65 (D. menziesii versus D. paleacea) to 0.92 (D.
glanduligera versus D. paleacea). The average overlap for the pooled assemblage was
0.534, larger than 96% of the 1000 simulations (Table 1). This result again suggested
significantly more niche overlap than expected by chance (P = 0.04).
The high overlap in both cases was clear from an inspection of the raw data.
Except for S. leucophylla, which favored Diptera, all co-occurring Sarracenia primarily
captured ants (Folkerts 1992). The relatively modest morphological differences between
coexisting species of Sarracenia did not translate into appreciable differences in

34
703
704
705
706
707
708
709
710
711
712
713
714
715
716
717
718
719
720
721
722
723
724
725
composition of prey captured, suggesting that competition for limiting resources was
not regulating species coexistence. Similarly, among co-occurring Drosera at Fitzgerald
River, prey composition was dominated by Collembola, Homoptera, and Diptera
(Verbeek and Boasson 1993).
We also found no evidence of interspecific competition among the Sarracenia
assemblages composed of two or three species (Folkerts, 1992), or among the two- or
three-species assemblages of Drosera in the southeastern United States, Germany, the
Netherlands, and at Murdoch University (Porch, 1989; van Achterberg, 1973; Thum,
1986; Verbeek and Boasson, 1993) (Table 1). In all cases, the observed niche overlap
was significantly greater than expected (Table 1), which was opposite the pattern that
would be predicted by competitive segregation of prey.
The two caveats to these results are that prey were identified only to orders and
that the analysis assumed that all prey categories were equally abundant. Finer
taxonomic resolution of prey could reveal less overlap among prey. If the assumption of
equal abundance of prey categories is violated, the analytic method used tends to over-
estimate the amount of niche overlap because the results are dominated by common
taxa. In contrast, when independent estimates of prey abundance are available, values of
prey actually used can be rescaled to downweight the importance of common prey (see
Gotelli and Graves, 1996 for further discussion of statistical issues associated with
measures of niche overlap). Unfortunately, the studies we used for assessing niche
overlap did not include independent estimates of prey availability.
Rates and efficiency of prey capture by pitcher plants and bladderworts
35
726
727
728
729
730
731
732
733
734
735
736
737
738
739
740
741
742
743
744
745
746
747
748
749
“From an examination which I made to-day on a leaf of the S. flava about half
grown, I am led to suspect that the surface, where the fly stands so unsteadily,
and from which it finally drops down to the bottom of the tube, is either covered
with an impalpable and loose powder, or that the extremely attenuated
pubescence is loose. This surface gives to the touch the sensation of the most
perfect smoothness. The use of a good microscope will determine this point.”
(Macbride, 1818: 52)
The statistical analysis of the prey spectra (Figs. 3 and 4) revealed that at relatively
coarse taxonomic resolution (genera of plants, orders of prey), carnivorous plants act as
opportunistic sit-and-wait predators, capturing prey in proportion to their availability
(Fig. 5), and rarely competing with co-occurring congeners (Table 1). Additional
evidence from several species of pitcher plants and bladderworts, however, suggests
that these taxa do have some adaptations to increase the rates and efficiency of capture
of specific prey items, at least under certain environmental conditions.
Detailed observations of Sarracenia purpurea using video cameras (Newell and
Nastase, 1998) and of Darlingtonia californica Torrey using multiple observers (Dixon
et al., 2005) found that fewer than 2% of ants visiting S. purpurea or wasps visiting D.
californica were successfully captured by the plants. These observations were made
under sunny and relatively dry field conditions. Similar rates of ant captures by
Nepenthes rafflesiana Jack. (Bohn and Federle, 2004; Bauer et al., 2008) were observed
under sunny and dry conditions. However, when the pitcher lip (peristome) of N.
rafflesiana was wetted by rain, condensation, or secretion of nectar by the extrafloral

36
750
751
752
753
754
755
756
757
758
759
760
761
762
763
764
765
766
767
768
769
770
771
772
nectaries lining the peristome, it became, like that of Macbride’s (1818) Sarracenia
flava, a nearly frictionless surface. Foraging ants that contacted the wetted peristome
“aquaplaned” and slipped into the pitcher in very large numbers (Bauer et al., 2008);
capture rates by N. rafflesiana under humid or wet conditions often reached 100% of
foraging ants (Bauer et al., 2008). As the other pitcher plants – Cephalotus and all the
Sarraceniaceae – also have extrafloral nectaries ringing the peristome (Vogel, 1998;
Płachno et al., 2007), it is not unreasonable to hypothesize that these taxa also have
peristomes that could be wetted to increase prey capture rates. Hopefully, we will not
have to wait another 200 years for a good microscopist to test this hypothesis for the
other groups of pitcher plants!
Adaptations to enhance prey capture by bladderworts have also been postulated.
The suction trap (described in detail by Lloyd, 1942; Guisande et al., 2007) of
Utricularia is a highly specialized structure that is activated when a passing animal
touches a trigger hair (Lloyd, 1942 illustrated it as a “better mousetrap”). When
triggered, the trap opens inward, the prey is sucked in to the water-filled trap, the door
closes, and the prey is digested and absorbed. Finally, the water is pumped out and the
trap is reset. This energy-intensive process appears to be facilitated by the evolutionary
change in coxI described above (Jobson et al., 2004).
Beginning with Darwin (1875) investigators have hypothesized that periphyton
growing on the hairs and bristles surrounding the trap attract zooplankton that graze
their way down to the trigger hairs. This hypothesis was verified experimentally for U.
vulgaris by Meyers and Strickler (1979) and for U. foliosa L. (Díaz-Olarte et al., 2007).
However, the presence and species composition of periphyton on hairs and bristles of

37
773
774
775
776
777
778
779
780
781
782
783
784
785
786
787
788
789
790
791
792
793
794
795
796
Utricularia appears to depend on local environmental conditions (Díaz-Olarte et al.,
2007), not on a direct facilitation of periphyton growth by Utricularia (cf. Ulanowicz,
1995). Determining causal relationships between environmental conditions,
morphological structures, and prey capture rates and efficiency by Utricularia remains
an active area of research.
Do fly-traps really catch only large prey?
[Of 14 Dionaea leaves sent to Darwin by William M. Canby], “[f]our of these
had caught rather small insects, viz. three of them ants, and the fourth a rather
small fly, but the other ten had all caught large insects, namely five elaters, two
chrysomelas, a curculio, a thick and broad spider, and a scolopendra....But
what most concerns us is the size of the ten larger insects. Their average length
from head to tail was 0.256 of an inch, the lobes of the leaves being on average
0.53 of an inch in length, so that the insects were very nearly half as long as the
leaves within which they were enclosed. Only a few of these leaves, therefore,
had wasted their powers by capturing small prey, though it is probable that
many small insects had crawled over them and been caught, but had then
escaped through the bars.”
(Insectivorous Plants, p. 252)
Our analyses suggest that carnivorous plants are not selective predators with respect to
prey composition. But is there any evidence that, as Darwin hypothesized, they capture
only relatively large prey? Here the data are limited to two small collections of prey

38
797
798
799
800
801
802
803
804
805
806
807
808
809
810
811
812
813
814
815
816
817
contents of the Venus’ fly-trap, Dionaea muscipula (Darwin, 1875; Jones, 1923). In
both cases, we had to make some assumptions to reconstruct the data and test the
hypothesis that Dionaea prey are unusually large.
Darwin (1875) provided the average size of only the ten largest prey (0.256 inch
= 6.5 mm); the sizes of the four smaller prey items (three ants and a fly) were not
reported. Jones (1923) gave a bit more detail for 50 dissected Dionaea leaves, each with
one prey item: of the 50 prey items recovered, “only one was less than 5 mm in length,
and only seven, less than 6 mm; ten were 10mm or more in length, with a maximum of
30 mm” (Jones 1923: 593). Jones also reported that the average length of the prey was
8.6 mm, and the normal minimum observed was 6.4 mm (approximately the average
length of Darwin’s sub-sample).
Based on Jones’s (1923) reported size intervals, prey size distributions were
simulated using R version 2.6.1 as being drawn from a mixture of three normal
distributions (N(5.5, 0.25), N(20, 5), and N(8, 1))12, with sample sizes respectively
equal to 7 (“less than 6 mm”, but more than 5 mm), 10 (“10mm or more in length, with
a maximum of 30 mm”), and 32 (the remainder, unenumerated by Jones, but by
inference being between 6 and 10 mm long), plus one outlier (4 mm), corresponding to
the one “less than 5 mm in length”). This mixture gave a skewed distribution of prey
sizes with mean = 9.3 mm, and a median = 7.6 mm. Darwin’s distribution of prey was
similarly simulated as a mixture of two normals: N(6.5, 1) and N(5.5, 0.25) with
sample sizes of 10 and 4, respectively. Because Darwin gave no information on the size
12 The notation N(μ, σ) means a normal distribution with mean = μ and standard deviation = σ. We
used the R command rnorm(...) to generate our size distributions.

39
818
819
820
821
822
823
824
825
826
827
828
829
830
831
832
833
834
835
836
837
838
839
840
of the four small prey items, the sample of small prey sizes in this mixture was drawn
from the same distribution as Jones’s small prey. This mixture gave a skewed
distribution of prey sizes with mean = 6.0 mm and a median = 5.8 mm. The two
distributions are shown in Fig. 6.
The relevant question is whether either of these data sets support the hypothesis
that the average size of prey that Dionaea captures is at least half the length of a 13.5
mm leaf (Darwin’s “0.53 of an inch”). A plausible way to determine this is to create
replicate bootstrapped samples (i.e., with replacement) of the available data and use
these bootstrapped samples to estimate the population mean and confidence intervals
(Efron, 1982).
We used the sample function in R to create 10 000 bootstrapped samples of
both Darwin’s and Jones’s prey size data. The estimated mean of the small population
from which Darwin drew his sample was 6 mm (95% CI = [5.70, 6.38]), which fails to
support the hypothesis that Dionaea catches prey that is on average half as large as the
trap (6.75 mm). In contrast, the estimated population mean of Jones’s larger sample was
9.3 mm (95% CI = [7.92, 10.86]), a result that is more in line with Darwin’s expectation.
What do they do with all that prey? The energetics of botanical carnivory
Ordinary plants...procure the requisite inorganic elements from the soil by
means of their roots....[T]here is a class of plants which digest and afterwards
absorb the animal matter, namely, all the Droseraceae, Pinguicula, and, as
discovered by Dr. Hooker, Nepenthes.

40
841
842
843
844
845
846
847
848
849
850
851
852
853
854
855
856
857
858
859
860
861
862
863
(Insectivorous Plants, p. 365)
Based on his detailed observations of feeding behavior and nutrient absorption, Darwin
discussed how carnivorous structures might have evolved in plants. Later authors (e.g.,
Lloyd, 1942; Juniper et al., 1989) generally followed his lead. Little attention was paid
to why botanical carnivory might evolve until Givnish et al. (1984) proposed a cost-
benefit model to explain why carnivorous plants are most common in habitats that are
bright and wet but very low in nutrients. Givnish et al.’s (1984) model postulated a
trade-off between the nutrients gained by capturing animals and the energy foregone by
constructing photosynthetically inefficient traps instead of leaves. Givnish et al. (1984)
asserted that carnivory would be expected to evolve if the increased nutrients provided
by carnivory gave plants possessing carnivorous structure an energetic advantage
relative to co-occurring non-carnivorous plants. This model was elaborated by Benzing
(2000), who additionally considered decaying litter as a nutrient source and a third axis
of selection. Both models were initially derived from studies of carnivorous bromeliads,
but the cost-benefit framework has been used to interpret results from a wide range of
observational and experimental studies on many carnivorous plant species (reviewed by
Ellison and Gotelli, 2001; Ellison, 2006).
The benefits of carnivory
Givnish et al. (1984) identified three ways in which nutrients acquired through
carnivory could result in energetic benefits to the plants. First, photosynthesis could
increase with increasing nutrient uptake (following prey capture and digestion). This

41
864
865
866
867
868
869
870
871
872
873
874
875
876
877
878
879
880
881
882
883
884
885
886
photosynthetic benefit could be realized either through an increase in the total mass of
leaves the plant can support or an increased Amass. Second, the excess nutrients derived
from carnivory could be disproportionately allocated to reproduction. This allocation to
reproduction should be measurable either as a positive relationship between prey
captured and seeds produced or an increase in nutrient content within the seeds. Third,
if carnivorous plants could extract carbon from prey, they could bypass photosynthesis
as a means of producing sugars. This last benefit could be most important for aquatic
carnivorous plants, as CO2 used for photosynthesis is often limiting because it must be
obtained by diffusion from the surrounding water (Adamec, 1997a, 1997b, 2006).
Most studies on the benefits of carnivory have found that plants significantly
increase growth (in terms of leaf mass or total biomass) in response to prey additions
(see Table 1 of Ellison, 2006). However, detailed measurements of photosynthesis of
carnivorous plants in response to prey or nutrient additions – the primary measure of the
first hypothesized benefit of carnivory – have generated more equivocal results. Méndez
and Karlsson (1999) reported no significant increase in photosynthetic rates of
Pinguicula villosa L., P. vulgaris L., or Drosera rotundifolia when they were provided
supplemental prey. Adamec (2008) found that photosynthetic rate of Aldrovanda
vesiculosa increased following prey additions, but that of Utricularia australis
decreased following prey additions. But for both species, supplemental prey caused an
increase in growth rates. (Adamec, 2008). Wakefield et al. (2005) also reported no
significant change in photosynthetic rates of Sarracenia purpurea pitchers fed additional
prey in a field study, although tissue N and P concentrations did increase with feeding
level. Nutrient storage in new Sarracenia pitchers (Butler and Ellison, 2007) or

42
887
888
889
890
891
892
893
894
895
896
897
898
899
900
901
902
903
904
905
906
907
908
909
reproductive structures (see below) are alternative sinks for excess nutrients derived
from prey captured by existing pitchers. For example, in a greenhouse study of prey
addition to ten species of Sarracenia, Amass increased in new pitchers and photosystem
II stress (as measured by fluorescence) decreased with prey additions (Farnsworth and
Ellison 2008).
The second postulated benefit of carnivory also has been demonstrated.
Temperate-zone Pinguicula species, which exhibit reproductive preformation (buds set
in year y flower and produce seeds in year y+1; Worley and Harder, 1999) increased
vegetative reproduction in the year of prey additions and also increased sexual
reproduction in subsequent years (Thorén and Karlsson, 1998; Worley and Harder
1999). In P. vallisneriifolia, neither flower set nor fruit set changed with prey additions,
but seed set (measured as seed:ovule ratio) did increase (Zamora et al., 1997). A similar
increase in seed:ovule ratio in response to prey availability and inorganic nutrient
addition was observed in Sarracenia purpurea (Ne’eman et al., 2006), which also
makes preformed buds (Shreve, 1906). Three other Pinguicula species (P. alpina, P.
villosa, and P. vulgaris) all preferentially allocated nitrogen to reproductive structures
(Eckstein and Karlsson 2001). Both fruit set and seed set of Drosera intermedia and D.
rotundifolia were positively correlated with prey captured (Thum, 1989; Stewart and
Nilsen, 1992). Experimental prey additions subsequently confirmed these correlative
results (Thum, 1988).
In summary, increases in plant growth, nutrient storage, and reproduction in
response to increased prey have been documented in a number of carnivorous plant
species, although evidence for elevated photosynthetic rates is weak. To date, there is

43
910
911
912
913
914
915
916
917
918
919
920
921
922
923
924
925
926
927
928
929
930
931
932
only scant evidence for Givnish et al.’s (1984) third prediction, that of heterotrophic
uptake of C from prey. Fabian-Galan and Savageanu (1968) found that 14C from labeled
Daphnia fed to both Aldrovanda vesiculosa and Drosera capensis L. was incorporated
into leaf and stem tissues and into new growing tips of these carnivorous plants.
Similarly, Drosera erythrorhiza stored 14C from labeled flies in new growth (Dixon et
al., 1980). Additional evidence for facultative heterotrophy in carnivorous plants is
most likely to be found in aquatic carnivorous plants (Adamec, 1997a, 1997b, 2006), as
dissolved CO2 can limited photosynthetic rates in submerged plants.
The costs of carnivory
The costs of carnivory have been assessed much less frequently than the benefits,
perhaps because measuring energy foregone is more difficult than measuring increased
growth, photosynthetic rates, or seed set. But the existing measurements do suggest that
the costs can be substantial. Among carnivorous plants with flypaper traps, carbon and
nutrients (in proteins) must be allocated to construction of specialized leaf glands,
sticky mucilage, and digestive enzymes. Pate (unpublished data, as cited in Pate 1986,
p. 320) reported that Australian Drosera spp. allocated 3-6% of net photosynthate to the
production of mucilage for leaf glands. In shaded conditions when light levels fell well
below photosynthetic saturation, Pinguicula vallisneriifolia reduced its mucilage
production, presumably because it lacked sufficient carbon (Zamora et al. 1998). At the
opposite extreme, when nutrients were added to the soil, Drosera rotundifolia reduced
its mucus gland production (Thorén et al. 2003). This result was attributable to the
avoidance of the costs of carnivory when nutrients were obtained at a lower carbon cost.

44
933
934
935
936
937
938
939
940
941
942
943
944
945
946
947
948
949
950
951
952
953
954
955
Similar plasticity has been observed in Utricularia spp. and Sarracenia spp.
When prey or dissolved nutrients were plentiful, the number of carnivorous bladders
declined significantly in U. macrorhiza Le Conte (Knight and Frost, 1991), U. vulgaris
(Friday, 1992), and U. foliosa (Guisande et al., 2000, 2004). Bladder traps are
photosynthetically inefficient, and Knight (1992) calculated that U. macrorhiza of a
given mass without bladders would grow 1.2 – 4.7 × faster than U. macrorhiza of the
same mass with bladders. Likewise, Sarracenia purpurea produced non-carnivorous
leaves (phyllodia) when inorganic nutrients were added to levels comparable to
atmospheric inputs from anthropogenic sources, and these phyllodia photosynthesized
~25% faster than did carnivorous pitchers (Ellison and Gotelli, 2002). Similar results
were obtained for S. purpurea and eight other species of Sarracenia fed supplemental
prey (Farnsworth and Ellison, 2008). The related Darlingtonia californica had absolute
levels of Amass of carnivorous plants that were 30-50% lower than predicted from
scaling relationships between leaf nitrogen content and Amass of non-carnivorous plants
(Ellison and Farnsworth, 2005), and similar departures from the universal spectrum of
leaf traits have been observed for other species of Sarracenia (Farnsworth and Ellison,
2008).
Photosystems of carnivorous plants do appear to be nutrient-limited.
Fluorescence measurements of greenhouse-grown Sarracenia species suggested
significant “stress” of photosystem II at low levels of prey capture, and this stress was
alleviated by prey additions (Farnsworth and Ellison, 2008). Observations of spectral
reflectance also implied low chlorophyll content and similar photosystem stress in
Nepenthes rafflesiana in the field (Moran and Moran, 1998). Overall photosynthetic

45
956
957
958
959
960
961
962
963
964
965
966
967
968
969
970
971
972
973
974
975
976
977
978
nitrogen use efficiency (μmol CO2 · mol N · s-1; Aerts and Chapin, 2000) is 50% lower
for carnivorous plants than for non-carnivorous plants (P = 1.3 × 10⁻¹⁴, t-test; Fig. 7);
and photosynthetic phosphorus use efficiency is 60% lower for carnivorous plants than
for non-carnivorous plants (P = 5.5 × 10⁻⁷, t-test; Fig. 7). These data on photosynthetic
nutrient use efficiency further support the hypothesis that carnivorous plants are outliers
with respect to scaling relationships between tissue nutrient content and Amass that have
been compiled for thousands of non-carnivorous species (Wright et al., 2004, 2005).
However, the data for non-carnivorous plants come from a wide range of habitats and
plant life-forms. It is not known whether carnivorous plants have higher photosynthetic
nutrient use efficiencies than co-occurring non-carnivorous plants. However, there is no
evidence to suggest that carnivorous plants and non-carnivorous plants are actually
competing for nutrients (Brewer, 1999a, 1999b, 2003).
Can carnivorous plants escape Hobson’s Choice?
Where to elect there is but one,
'Tis Hobson's choice—take that, or none.
(from England’s Reformation, by Thomas Ward; 1710)
The observations that carnivory appears to be energetically costly, that excess nutrients
do not lead directly to increasing photosynthetic rates in existing leaves or traps, and
that photosynthetic nutrient use efficiency of carnivorous plants is extremely low led
Ellison and Farnsworth (2005) to suggest that botanical carnivory is an evolutionary

46
979
980
981
982
983
984
985
986
987
988
989
990
991
992
993
994
995
996
997
998
999
Hobson’s Choice – the last resort when nutrients are scarcely available from the soil.
Two new lines of evidence challenge this interpretation, however.
First, two recent studies have shown that the actual energetic costs of
constructing carnivorous traps are significantly lower than the energetic costs of
constructing phyllodia of carnivorous plants (Osunkoya et al., 2007; Karagatzides and
Ellison, 2008) or leaves of non-carnivorous plants (Fig. 8). These data include not only
“passive” traps (flypaper traps of Drosera, pitfall traps of Nepenthes and Sarracenia)
but also the “active” snap-traps of Dionaea. Thus, carnivorous traps are relatively
inexpensive structures that provide substantial nutrient gain for little energetic cost;
thus, it would take very little photosynthetic gain to yield a substantial marginal
benefit13 from a small investment in carnivory.
Not all active traps are equally active, however. The snap-trap of the Venus’ fly-
trap uses a mechanical trigger (the mechanism of which is still poorly understood) to
passively release elastic energy stored in the fully hydrated leaf (Forterre et al., 2005).
This relatively cheap trap is rarely reset; rather after one (rarely 2 or 3) captures, the trap
senesces (Darwin, 1875). In contrast, Utricularia’s suction trap is used multiple times,
and must be reset after it captures prey (Lloyd, 1942). Pumping out water is an
energetically expensive process, and how Utricularia bears this cost has come to light
only recently.
Jobson et al. (2004) found that the coxI gene in Utricularia has a markedly
different structure – with two contiguous cysteines – from that seen in 99.9% of coxI
13 The marginal benefit is the difference between the total photosynthetic increase resulting from
nutrients gained from producing a new trap and the total photosynthetic cost of producing a trap as opposed to a phyllode or other photosynthetically more efficient structure)

47
1000
1001
1002
1003
1004
1005
1006
1007
1008
1009
1010
1011
1012
1013
1014
1015
1016
1017
1018
1019
1020
1021
1022
sequences recorded from Archaea, bacteria, or eukaryotes. This dicysteine motif causes
a conformational change that at least partly decouples this protein’s electron transport
function from its proton pumping function. Laakkonen et al. (2006) estimated that this
conformational change optimizes power output when the bladder trap is reset. Although
there is an associated respiratory cost to this change, this cost ought to be offset by gains
due to carnivory. Laakkonen et al. (2006) modified Givnish et al.'s (1984) original cost-
benefit model to replace photosynthetic costs with respiratory costs. The rapid rate of
gene substitution rates in Utricularia (Müller et al., 2004; see Fig. 2) further suggests
that once this mutation arose in coxI , selective pressures on Utricularia were relaxed
and “runaway” morphological evolution occurred in this genus. Whereas this mutation
in coxI has been completely or partially lost in Genlisea, its rapid rate of evolution has
been attributed to the smaller energetic costs of the passive, albeit morphology complex,
eel traps in that genus (Jobson et al., 2004). Measurements of construction costs of traps
in Pinguicula, Genlisea, and Utricularia would shed additional light on the generality
of this hypothesis.
Conclusions and directions for future research
The integration of three research areas – the tempo and mode of carnivorous plant
evolution as revealed through molecular analysis; the dynamics of prey capture
illuminated with rigorous statistical analysis; and the physiological energetics of
botanical carnivory in the context of cost-benefit models – has dramatically improved
our understanding of many of the questions that Darwin first raised in Insectivorous

48
1023
1024
1025
1026
1027
1028
1029
1030
1031
1032
1033
1034
1035
1036
1037
1038
1039
1040
1041
1042
1043
1044
1045
Plants. This integration also permits the evaluation of existing hypotheses that may
explain the evolution of carnivorous plants and the convergence of trap structures in a
wide range of angiosperm lineages. The well-documented restriction of carnivorous
plants to low-nutrient, high-light, and wet environments was explained
phenomenologically by a cost-benefit model (Givnish et al., 1984). Molecular data have
revealed novel mutations and accelerated mutation rates in carnivorous plants,
suggesting plausible alternative mechanisms underlying this phenomenological model
(Jobson et al., 2004; Müller et al., 2004; Laakkonen et al., 2006). Analysis of
carnivorous plant nutrient physiology, trap and leaf construction costs, and overall
physiological energetics support the hypothesis that mutations in coxI provide an
energetic boost in the Genlisea-Utricularia clade. Statistical analyses support the
hypotheses that carnivorous plants have evolved varying degrees of prey specialization
(Figure 4), although there is no evidence for niche partitioning among co-existing
congeners (Table 1).
This review also raises unanswered questions and highlights research needs in
the areas of carnivorous plant systematics and taxonomy, dynamics of prey capture, and
physiological energetics. Priority areas include:
Systematics and taxonomy
1. By identifying a key configurational change in coxI, Jobson et al. (2004) found a
plausible molecular and physiological pathway to botanical carnivory. Are there
alternative pathways that overcome the energetic costs of carnivory in other
carnivorous plant lineages, including others within unrelated carnivorous groups

49
1046
1047
1048
1049
1050
1051
1052
1053
1054
1055
1056
1057
1058
1059
1060
1061
1062
1063
1064
1065
1066
1067
within the Lamiales?
2. Molecular data have strongly supported infrageneric morphology-based
classification systems for the speciose carnivorous genera of Utricularia and
Genlisea, but do not agree with morphological-based classifications of Drosera,
Pinguicula, or Sarracenia. Better integration of morphological and molecular
data (cf., Williams et al., 1994), along with full genomic sequences of
representative carnivorous plant species could help to resolve phylogenies of
many groups of carnivorous plants
3. Complete genomic data also would allow for less biased estimates of mutation
rates in carnivorous plants relative to non-carnivorous plants, and could provide
an explanation for the remarkably low C-values found in Utricularia and
Genlisea (Greilhuber et al., 2006). C-values are well-known to be correlated
with cell size (Gregory, 2001), which in turn may be correlated with bladder
size. Further analysis of the relationship between trap size (and prey capture
rates; see e.g., Sanabria-Aranda et al., 2006), cell size, and C-values of
Utricularia would be illuminating.
4. The genetic analyses to date have suggested some biogeographical anomalies.
Examples include repeated transoceanic dispersal events in Drosera; repeated
colonizations of the Indonesian islands by Nepenthes; and evidence that
Darlingtonia is sister to a Sarracenia-Heliamphora clade. As better
distributional data and genetic data become available, these should be explicitly
linked (using tools such as GeoPhyloBuilder14) to create formal
14 https://www.nescent.org/wg_EvoViz/GeoPhyloBuilder

50
1068
1069
1070
1071
1072
1073
1074
1075
1076
1077
1078
1079
1080
1081
1082
1083
1084
1085
1086
1087
1088
1089
1090
phylogeographic hypotheses regarding the origin and diversification of
carnivorous plants.
Dynamics of prey capture
1. Prey capture data should be better resolved taxonomically; existing, order-level
data clearly are quite coarse but family (and lower) level data are harder to come
by. Specialization and niche segregation may become more apparent if prey are
sorted to finer taxonomic levels.
2. Measures of specialization, niche overlap, capture rate, and capture efficiency all
are potentially biased without parallel measurements of available prey (cf.
Gotelli and Graves, 1996) and prey size. Future studies of prey capture by
carnivorous plants should also measure the relative abundance of potential prey
in the surrounding habitat.
3. The dichotomy between “passive” and “active” traps needs to be rethought.
Darwin observed movement by the tentacular glands in Drosera and
hypothesized selectivity in size of prey captured by Dionaea. Macbride (1818)
proposed the existence of a frictionless peristome in Sarracenia, and Federle and
his colleagues (Bohn and Federle, 2004; Bauer et al., 2008) found such
frictionless surfaces in Nepenthes. The amount of friction, however, can be
controlled either by environmental conditions (rain, fog) or by the plant itself
(nectar secretion). Because hypotheses regarding the evolution and
diversification of carnivorous plants depend, at least in part, on mechanisms and
rates of prey capture, renewed attention should be focused on the activity of

51
1091
1092
1093
1094
1095
1096
1097
1098
1099
1100
1101
1102
1103
1104
1105
1106
1107
1108
1109
1110
1111
1112
1113
“passive” traps, especially in the pitcher plants and in Genlisea.
4. Similarly, better assessment of the relative importance of environmental control
and direct control by the plant itself of periphyton abundance on Utricularia
traps and its role in prey capture will help to clarify exactly how active these
traps are (Lloyd, 1942, Meyers 1982). Such studies also will expand the focus of
research on prey capture by carnivorous plants beyond simple predator-prey
models (cf. Ulanowicz,1995; Díaz-Olarte et al., 2007).
Carnivorous plant energetics
1. The benefits of botanical carnivory are well-established (Ellison, 2006). More
importantly, an assessment of the relationship (or lack thereof) between changes
in growth rate and underlying ecophysiological processes such as photosynthesis
and respiration or tissue nutrient content and stoichiometry (see Shipley, 2006)
would unify the currently discordant data on responses of carnivorous plants to
experimental prey and nutrient additions.
2. Available data indicate that most responses to prey addition do not occur in the
fed traps, but in traps and leaves that are subsequently produced (Butler and
Ellison, 2007; Farnsworth and Ellison, 2008). Therefore, not only should future
studies assess changes in Amass in leaves produced subsequently to feeding, but
they should also better delineate where nutrients are stored and how they are
subsequently remobilized in current and future growing seasons. Stable isotopes
can be used effectively for such studies (Butler and Ellison, 2007; Butler et al.,
2008).

52
1114
1115
1116
1117
1118
1119
1120
1121
1122
1123
1124
1125
1126
1127
1128
1129
1130
1131
1132
1133
1134
1135
1136
3. Measurements of the costs of carnivorous structures have lagged well behind
measurements of the benefits. Estimates of trap construction costs in the
Lentibulariaceae and other carnivorous Lamiales are needed to complement
existing data on Sarraceniaceae and carnivorous Caryophyllales.
4. Many derived lineages of carnivorous plants have separated traps from
photosynthetic structures: phyllodia of Nepenthes, Cephalotus, and Sarracenia;
leaves of Utricularia and Genlisea; and loss of carnivory in Triphyophyllum as
the plant matures (Green et al., 1979). Detailed analysis of construction costs of
traps and photosynthetic structures in these genera will provide additional
insights into the true costs of botanical carnivory.
5. How is the carbon derived from prey used by carnivorous plants? This last
question is perhaps the most vexing and hearkens back to Darwin:
“Most, however, of the plants belonging to these four classes
[carnivorous plants that directly and indirectly digest prey, those that
derive nutrients only from decaying litter, and parasitic plants] obtain
part of their carbon [emphasis added] like ordinary species, from the
atmosphere. Such are the diversified means, as far as at present known
[emphasis added], by which higher plants gain their subsistence.”
(Insectivorous Plants, p. 367)
Since Darwin's seminal publication, carnivorous plants have continued to
provide general insights into the evolution and biogeography of plant lineages,

53
1137
1138
the physiological ecology of nutrient uptake and use, and the evolution of leaf
form. There is much yet to learn about these most wonderful plants in the world.

54
1139
1140
1141
1142
1143
1144
1145
1146
1147
1148
1149
1150
1151
1152
Acknowledgements
Since 1997, our research on carnivorous plants has been supported by the US National
Science Foundation (awards 98-05722, 98-08504, 00-83617, 02-34710, 02-35128 , 03-
01361, 03-30605, 04-00759, 04-52254, 05-41680, 05-41936 to AME and/or NJG); and
NSF/EPSCOR (award 008297 to NJG). We thank our colleagues Leszek Błędzki,
Jessica Butler, Elizabeth Farnsworth, Clarisse Hart, and Jim Karagatzides for fruitful
discussions and collaborations in the field and lab as these ideas have evolved, and the
dozens of undergraduates who have worked with us on a variety of carnivorous plant
projects. Elizabeth Farnsworth drew the traps shown on Figure 1. Kai Müller provided
us with a detailed explanation of Figure 2 which is reprinted from his 2004 paper with
permission from him and from the publisher of Plant Biology, Georg Thieme Verlag
KG, Stuttgart, Germany. The final version of the manuscript also reflects helpful
comments from Lubomir Adamec, Elizabeth Farnsworth, Matt Fitzpatrick, Clarisse
Hart, Stan Rachootin, and an anonymous referee.

55
1153
1154
1155
1156
1157
1158
1159
1160
1161
1162
1163
1164
1165
1166
1167
1168
1169
1170
1171
1172
1173
1174
1175
References
Adamec L. 1997a. Mineral nutrition of carnivorous plants: a review. Botanical Review
63, 273-299.
Adamec L. 1997b. Photosynthetic characteristics of the aquatic carnivorous plant
Aldrovanda vesiculosa. Aquatic Botany 59, 297-306.
Adamec L. 2006. Respiration and photosynthesis of bladders and leaves of aquatic
Utricularia species. Plant Biology 8, 765-769.
Adamec L. 2008. The influence of prey capture on photosynthetic rate in two aquatic
carnivorous plant species. Aquatic Botany 89, 66-70.
Aerts R, Chapin FS. 2000. The mineral nutrition of wild plants revisited: a re-
evaluation of processes and patterns. Advances in Ecological Research 30, 1-67.
Albert VA, Williams SE, Chase MW. 1992. Carnivorous plants: phylogeny and
structural evolution. Science 257, 1491-1495.
Antor RJ, García MB. 1994. Prey capture by a carnivorous plant with hanging
adhesive traps: Pinguicula longifolia. American Midland Naturalist 131, 128-
135.
Bayer RJ, Hufford L, Soltis DE. 1996. Phylogenetic relationships in Sarraceniaceae
based on rbcL and ITS sequences. Systematic Botany 21, 121-134.
Bauer U, Bohn HF, Federle W. 2008. Harmless nectar source or deadly trap:
Nepenthes pitchers are activated by rain, condensation and nectar. Proceedings
of the Royal Society of London, Series B 275, 259-265.
Benzing DH. 2000. Bromeliaceae: profile of an adaptive radiation. Cambridge, UK:
Cambridge University Press.

56
1176
1177
1178
1179
1180
1181
1182
1183
1184
1185
1186
1187
1188
1189
1190
1191
1192
1193
1194
1195
1196
1197
1198
Benzing DH, Givnish TJ, Bermudes D. 1985. Absorptive trichomes in Brocchinia
reducta (Bromeliaceae) and their evolutionary and systematic significance.
Systematic Botany 10, 81-91.
Bohn HF, Federle W. 2004. Insect aquaplaning: Nepenthes pitcher plants capture prey
with the peristome, a fully wettable water-lubricated anisotropic surface.
Proceedings of the National Academy of Sciences, USA 101, 14138-14143.
Brewer JS. 1999a. Effects of competition, litter, and disturbance on an annual
carnivorous plant (Utricularia juncea). Plant Ecology 140, 159-165.
Brewer JS. 1999b. Effects of fire, competition and soil disturbances on regeneration of
a carnivorous plant (Drosera capillaris). American Midland Naturalist 141, 28-
42.
Brewer JS. 2003. Why don't carnivorous pitcher plants compete with non-carnivorous
plants for nutrients? Ecology 84, 451-462.
Butler JL, Ellison AM. 2007. Nitrogen cycling dynamics in the carnivorous pitcher
plant, Sarracenia purpurea. Functional Ecology 21, 835-843.
Butler JL, Gotelli NJ, Ellison AM. 2008. Linking the brown and the green:
transformation and fate of allochthonous nutrients in the Sarracenia
microecosystem. Ecology 89, 898-904.
Cameron KM, Wurdack KJ, Jobson RW. 2002. Molecular evidence for the common
origin of snap-traps among carnivorous plants. American Journal of Botany 89,
1503-1509.
Case FW, Case RB. 1974. Sarracenia alabamensis, a newly recognized species from
central Alabama. Rhodora 76, 650–665.

57
1199
1200
1201
1202
1203
1204
1205
1206
1207
1208
1209
Case FW, Case RB. 1976. The Sarracenia rubra complex. Rhodora 78, 270-325.
Casper SJ. 1966. Monographie der Gattung Pinguicula L. Bibliotheca Botanica
127/128, 1-209.
Cieslak T, Polepalli JS, White A, Müller K, Borsch T, Barthlott W, Steiger J,
Marchant A, Legendre L. 2005. Phylogenetic analysis of Pinguicula
(Lentibulariaceae): chloroplast DNA sequences and morphology support several
geographically distinct radiations. American Journal of Botany 92, 1723-1736.
Chao A, Chazdon RL, Colwell RK, Shen, TJ. 2005. A new statistical approach for
assessing compositional similarity based on incidence and abundance data.
Ecology Letters 8,148-159.
Colwell RK. 2005. EstimateS: Statistical estimation of species richness and shared
species from samples, version 7.5. http://purl.oclc.org/estimates. 1210
1211
1212
1213
1214
1215
1216
1217
1218
1219
1220
1221
Conran JG, Dowd JM. 1993. The phylogenetic relationships of Byblis and Roridula
(Byblidaceae-Roridulaceae) inferred from partial 18S ribosomal RNA
sequences. Plant Systematics and Evolution 188, 73-86.
Croizat L. 1960. Principia botanica, or beginnings of botany (with sketches by the
author). Caracas, Venezuela: LJon Croizat.
Cuenoud P, Savolainen V, Chatrou LW, Powell M, Grayer RJ, Chase MW. 2002.
Molecular phylogenetics of Caryophyllales based on nuclear 18S rDNA and
plastid rbcL, atpB, and matK DNA sequences. American Journal of Botany 89,
132-144.
Darwin C. 1859. The origin of species by means of natural selection. London: John
Murray (1996 printing of the 2nd edition. Oxford: Oxford University Press).

58
1222
1223
1224
1225
1226
1227
1228
1229
1230
1231
1232
1233
1234
1235
1236
1237
1238
1239
1240
1241
1242
1243
1244
Darwin C. 1875. Insectivorous plants. New York: D. Appleton and Company.
Darwin F (editor). 1903. More letters of Charles Darwin: a record of his work in a
series of hitherto unpublished letters. London: John Murray.
Darwin F (editor). 1911. The life and letters of Charles Darwin, including an
autobiographical chapter. New York: D. Appleton and Company
DeBuhr LE. 1977. Wood anatomy of the Sarraceniaceae: ecological and evolutionary
implications. Plant Systematics and Evolution 128, 159-169.
Degtjareva GV, Casper SJ, Hellwig FH, Schmidt AR, Steiger J, Sokoloff DD. 2006.
Morphology and nrITS phylogeny of the genus Pinguicula L.
(Lentibulariaceae), with special attention to embryo evolution. Plant Biology 8,
778-790.
Díaz-Olarte J, Valoyes-Valois V, Guisande C, Torres NN, González-Bermúdez A,
Sanabria-Aranda L, Manjarrés Hernández AM, Duque SR, Marciales LJ,
Núñez-Avellaneda M. 2007. Periphyton and phytoplankton associated with the
tropical carnivorous plant Utricularia foliosa. Aquatic Botany 87, 285-291.
Dixon KW, Pate JS, Bailey WJ. 1980 Nitrogen nutrition of the tuberous sundew
Drosera erythrorhiza Lindl. with special reference to catch of arthropod fauna
by its glandular leaves. Australian Journal of Botany 28, 283-297.
Dixon PM, Ellison AM, Gotelli NJ. 2005. Improving the precision of estimates of the
frequency of rare events. Ecology 86, 1114-1123.
Eckstein RL, Karlsson PS. 2001. The effect of reproduction on nitrogen use-efficiency
of three species of the carnivorous genus Pinguicula. Journal of Ecology 89,
798-806.

59
1245
1246
1247
1248
1249
1250
1251
1252
1253
1254
1255
1256
1257
1258
1259
1260
1261
1262
1263
1264
1265
Efron B. 1982. The jackknife, the bootstrap, and other resampling plans. Society of
Industrial and Applied Mathematics Monograph 38,1-92.
Ellison AM. 2006. Nutrient limitation and stoichiometry of carnivorous plants. Plant
Biology 8, 740-747.
Ellison AM, Farnsworth EJ. 2005. The cost of carnivory for Darlingtonia californica
(Sarraceniaceae): evidence from relationships among leaf traits. American
Journal of Botany 92, 1085-1093.
Ellison AM, Gotelli NJ. 2001. Evolutionary ecology of carnivorous plants. Trends in
Ecology and Evolution 16, 623-629.
Ellison AM, Gotelli NJ. 2002. Nitrogen availability alters the expression of carnivory
in the northern pitcher plant Sarracenia purpurea. Proceedings of the National
Academy of Sciences, USA 99, 4409-4412.
Ellison AM, Buckley HL, Miller TE, Gotelli NJ. 2004. Morphological variation in
Sarracenia purpurea (Sarraceniaceae): geographic, environmental, and
taxonomic correlates. American Journal of Botany 91, 1930-1935.
Ellison AM, Gotelli NJ, Brewer JS, Cochran-Stafira DL, Kneitel J, Miller TE,
Worley AC, Zamora R. 2003. The evolutionary ecology of carnivorous plants.
Advances in Ecological Research 33, 1-74.
Evans RE, MacRoberts BR, Gibson TC, MacRoberts MH. 2002. Mass capture of
insects by the pitcher plant Sarracenia alata (Sarraceniaceae) in southwest
Louisiana and southeast Texas. Texas Journal of Science 54, 339-346.

60
1266
1267
1268
1269
1270
1271
1272
1273
1274
1275
1276
1277
1278
1279
1280
1281
1282
1283
1284
1285
1286
1287
Fabian-Galan G, Salageanu N. 1968. Considerations on the nutrition of certain
carnivorous plants (Drosera capensis and Aldrovanda vesiculosa). Revue
Roumaine de Biologie, Série de Botanique 13, 275-280.
Farnsworth EJ, Ellison AM. 2008. Prey availability directly affects physiology,
growth, nutrient allocation and scaling relationships among leaf traits in 10
carnivorous plant species. Journal of Ecology 96, 213-221.
Fischer E, Porembski S, Barthlott W. 2000. Revision of the genus Genlisea
(Lentibulariaceae) in Africa and Madagascar with notes on ecology and
phytogeography. Nordic Journal of Botany 20, 291-318.
Folkerts DR. 1992. Interactions of pitcher plants (Sarracenia: Sarraceniaceae) with
their arthropod prey in the southeastern United States. PhD thesis, University of
Georgia, Athens, Georgia.
Forterre Y, Skotheim JM, Dumais J, Mahadevan L. 2005. How the Venus flytrap
snaps. Nature 433, 421-425.
Frank JH, O'Meara GF. 1984, The bromeliad Catopsis berteroniana traps terrestrial
arthropods but harbors Wyeomyia larvae (Diptera: Culicidae). Florida
Entomologist 67, 418-424.
Friday LE. 1992. Measuring investiment in carnivory: seasonal and individual
variation in trap number and biomass in Utricularia vulgaris L. New Phytologist
121, 439-445.
Givnish TJ, Burkhardt EL, Happel RE, Weintraub JD. 1984. Carnivory in the
bromeliad Brocchinia reducta, with a cost/ benefit model for the general

61
1288
1289
1290
1291
1292
1293
1294
1295
1296
1297
1298
1299
1300
1301
1302
restriction of carnivorous plants to sunny, moist nutrient-poor habitats. American
Naturalist 124, 479-497.
Gleason HA, Cronquist A. 1991. Manual of vascular plants of northeastern United
States and adjacent Canada. Bronx, NY: New York Botanical Garden.
Godt MJW, Hamrick JL. 1998. Allozyme diversity in the endangered pitcher plant
Sarracenia rubra ssp. alabamensis (Sarraceniaceae) and its close relative S.
rubra ssp. rubra. American Journal of Botany 85, 802-810.
Godt MJW, Hamrick JL. 1999. Genetic divergence among infraspecific taxa of
Sarracenia purpurea. Systematic Botany 23, 427-438.
Gotelli NJ. 2008. A primer of ecology, 4th edition. Sunderland, Massachusetts: Sinauer
Associates.
Gotelli NJ, Ellison AM. 2004. A primer of ecological statistics. Sunderland,
Massachusetts: Sinauer Associates.
Gotelli NJ, Entsminger GL. 2007. EcoSim: null models software for ecology, version
7. Jericho, Vermont: Acquired Intelligence Inc. & Kesey-Bear.
http://garyentsminger.com/ecosim.htm. 1303
1304
1305
1306
1307
1308
1309
1310
Gotelli NJ, Graves GR. 1996. Null models in ecology. Washington, DC: Smithsonian
Institution Press.
Green S, Green TL, Heslop-Harrison Y. 1979. Seasonal heterophylly and leaf gland
features in Triphyophyllum (Dioncophyllaceae), a new carnivorous plant genus.
Botanical Journal of the Linnean Society 78, 99-116.
Gregory TR. 2001. Coincidence, coevolution or causation? DNA content, cell size, and
the C-value enigma. Biological Reviews 76, 65-101.

62
1311
1312
1313
1314
1315
1316
1317
1318
1319
1320
1321
1322
1323
1324
1325
1326
1327
1328
1329
1330
1331
1332
1333
Greilhuber J, Borsch T, Müller K, Worberg A, Porembski S, Barthlott W. 2006.
Smallest angiosperm genomes found in Lentibulariaceae, with chromosomes of
bacterial size. Plant Biology 8, 770-777.
Guisande C, Granado-Lorencio C, Andrade-Sossa C, Roberto Duque SR. 2007.
Bladderworts. Functional Plant Science and Biotechnology 1, 58-68.
Guisande C, Andrade C, Granado-Lorencio C, Duque SR, Núñez-Avellaneda M.
2000. Effects of zooplankton and conductivity on tropical Utricularia foliosa
investment in carnivory. Aquatic Ecology 34, 137-142.
Guisande C, Aranguren N, Andrade-Sossa C, Prat N, Granado-Lorencio C,
Barrios ML, Bolivar A, Núñez-Avellaneda M, Duque SR. 2004. Relative
balance of the cost and benefit associated with carnivory in the tropical
Utricularia foliosa. Aquatic Botany 80, 271-282.
Harms S. 1999. Prey selection in three species of the carnivorous aquatic plant
Utricularia (bladderwort). Archiv für Hydrobiologie 146, 449-470.
Heubl G, Bringmann G, Meimberg H. 2006. Molecular phylogeny and character
evolution of carnivorous plant families in Carylophyllales - revisited. Plant
Biology 8, 821-830.
Hepburn JS, Saint John EQ, Jones FM. 1919. Biochemical studies of insectivorous
plants. Contributions from the Botanical Laboratory of the University of
Pennsylvania 4, 419-463.
Hepburn JS, Saint John EQ, Jones FM. 1927. The biochemistry of the American
pitcher plants. Transactions of the Wagner Free Institute of Science of
Philadelphia 11, 1-95.

63
1334
1335
1336
1337
1338
1339
1340
1341
1342
1343
1344
1345
1346
1347
1348
1349
1350
1351
1352
1353
1354
1355
1356
Hurlbert SH. 1971. The non-concept of species diversity: a critique and alternative
parameters. Ecology 52, 577-586.
Hutchinson GE. 1965. The ecological theater and the evolutionary play. New Haven,
Connecticut: Yale University Press.
Jaccard P. 1901. Étude comparative de la distribution florale dans une portion des
Alpes et du Jura. Bulletin de la Société Vaudoise des Sciences naturalles 37,
547-579.
Jaffe K, Blum MS, Fales HM, Mason RT, Cabrera A. 1995. On insect attractants
from pitcher plants of the genus Heliamphora (Sarraceniaceae). Journal of
Chemical Ecology 21, 379-384.
Jebb M, Cheek M. 1997 A skeletal revision of Nepenthes (Nepenthaceae). Blumea 42,
1-106.
Jobson RW, Albert VA. 2002. Molecular rates parallel diversification contrasts
between carnivorous plant sister lineages. Cladistics 18, 127-136.
Jobson RW, Playford J, Cameron KM, Albert VA. 2003. Molecular phylogenetics of
Lentibulariaceae inferred from plastic rps16 intron and trnL-F DNA sequences:
implications for character evolution and biogeography. Systematic Botany 28,
157-171.
Jobson RW, Nielsen R, Laakkonen L, Wilkström M, Albert VA. 2004. Adaptive
evolution of cytochrome c oxidase: infrastructure for a carnivorous plant
radiation. Proceedings of the National Academy of Sciences, USA 101, 18064-
18068.
Jones FM. 1923. The most wonderful plant in the world. Natural History 23, 589-596.

64
1357
1358
1359
1360
1361
1362
1363
1364
1365
1366
1367
1368
1369
1370
1371
1372
1373
1374
1375
1376
1377
1378
1379
Judd WW. 1959. Studies of the Byron Bog in southwestern Ontario. X. Inquilines and
victims of the pitcher plant, Sarracenia purpurea L. Canadian Entomologist 91,
171-180.
Judd WW. 1969. Studies of the Byron Bog in southwestern Ontario. XXXIX. Insect
trapped in the leaves of sundew, Drosera intermedia Hayne and Drosera
rotundifolia L. Canadian Field Naturalist 83, 233-237.
Juniper BE, Robins RJ, Joel DM. 1989. The carnivorous plants. New York, New
York, USA: Academic Press.
Karagatzides JD, Ellison AM. 2008. Construction costs, payback times and the leaf
economics of carnivorous plants. American Journal of Botany (in review).
Kato M, Hotta M, Tamin R, Itino T. 1993. Inter- and intra-specific variation in prey
assemblages and inhabitant communities in Nepenthes pitchers in Sumatra.
Tropical Zoology 6, 11-25.
Knight SE. 1992. Costs of carnivory in the common bladderwort, Utricularia
macrorhiza. Oecologia 89, 348-355.
Knight SE, Frost TM. 1991. Bladder control in Utricularia macrorhiza: lake-specific
variation in plant investment in carnivory. Ecology 72, 728-734.
Laakkonen L, Jobson RW, Albert VA. 2006. A new model for the evolution of
carnivory in the bladderwort plant (Utricularia): adaptive changes in
cytochrome c oxidase (COX) provide respiratory power. Plant Biology 8, 758-
764.
Legendre L. 2000. The genus Pinguicula L. (Lentibulariaceae): an overview. Acta
Botanica Gallica 147, 77-95.

65
1380
1381
1382
1383
1384
1385
1386
1387
1388
1389
1390
1391
1392
1393
1394
1395
1396
1397
1398
1399
1400
1401
Li H. 2005. Early Cretaceous sarraceniacean-like pitcher plants from China. Acta
Botanica Gallica 152, 227-234.
Lloyd FE. 1942. The carnivorous plants. New York: Ronald Press.
Macbride J. 1818. On the power of Sarracenia adunca to entrap insects. Transactions
of the Linnean Society, London 12, 48-52.
Macfarlane JM. 1893. Observations on pitchered insectivorous plants II. Histology of
Darlingtonia, Sarracenia and Heliamphora with remarks on adaptations for
insect-catching. Annals of Botany 7, 403–458.
Maguire B. 1978. Botany of the Guyana Highlands: Sarraceniaceae. Memoirs of the
New York Botanic Garden 29, 36-62.
McDaniel S. 1971. The genus Sarracenia (Sarraceniaceae). Bulletin of the Tall Timbers
Research Station 9, 1–36.
Meimberg H, Heubl G. 2006. Introduction of a nuclear marker for phylogenetic
analysis of Nepenthaceae. Plant Biology 8, 831-840.
Meimberg H, Wistuba A, Dittrich P, Heubl G. 2001. Molecular phylogeny of
Nepenthaceae based on cladistic analysis of plastid trnK intron sequence data.
Plant Biology 3, 164-175.
Méndez M, Karlsson PS. 1999. Costs and benefits of carnivory in plants: insights from
the photosynthetic performance of four carnivorous plants in a subarctic
environment. Oikos 86, 105-112.
Merbach MA, Merbach DJ, Maschwitz U, Booth WE, Fiala B, Zizka G. 2002. Mass
march of termites into the deadly trap. Nature 415, 36-37.

66
1402
1403
1404
1405
1406
1407
1408
1409
1410
1411
1412
1413
1414
1415
1416
1417
1418
1419
1420
1421
1422
1423
1424
Meyers DG. 1982. Darwin’s investigations of carnivorous aquatic plants of the genus
Utricularia: misconception, contribution, and controversy. Proceedings of the
Academy of Natural Sciences of Philadelphia 134, 1-11.
Meyers DG, Strickler JR. 1979. Capture enhancement in a carnivorous aquatic plant:
function of antennae and bristles in Utricularia vulgaris. Science 203, 1022-
1025.
Moran JA. 1996. Pitcher dimorphism, prey composition and the mechanisms of prey
attraction in the pitcher plant Nepenthes rafflesiana in Borneo. Journal of
Ecology 84, 515-525.
Moran JA, Moran AJ. 1998. Foliar reflectance and vector analysis reveal nutrient
stress in prey-deprived pitcher plants (Nepenthes rafflesiana). International
Journal of Plant Sciences 159, 996-1001.
Moran JA, Merbach MA, Livingston NJ, Clarke CM, Booth WE. 2001. Termite
prey specialization in the pitcher plant Nepenthes albomarginata - evidence
from stable isotope analysis. Annals of Botany 88, 307-311.
Müller K. 2005. Evolution of Amaranthaceae – a case study integrating molecular
phylogenetic and pollen data. PhD thesis, University of Bonn, Bonn, Germany.
Müller K, Borsch T. 2005. Phylogenetics of Utricularia (Lentibulariaceae) and
molecular evolution of the trnK intron in a lineage with high substitutional rates.
Plant Systematics and Evolution 250, 39-67.
Müller KF, Borsch T, Legendre L, Porembski S, Barthlott W. 2006. Recent progress
in understanding the evolution of carnivorous Lentibulariaceae (Lamiales).
Plant Biology 8, 748-757.

67
1425
1426
1427
1428
1429
1430
1431
1432
1433
1434
1435
1436
1437
1438
1439
1440
1441
1442
1443
1444
1445
1446
Müller K, Borsch T, Legendre L, Porembski S, Theisen I, Barthlott W. 2004.
Evolution of carnivory in Lentibulariaceae and the Lamiales. Plant Biology 6,
477-490.
Naczi RFC, Soper EM, Case FW, Jr., Case RB. 1999. Sarracenia rosea
(Sarraceniaceae), a new species of pitcher plant from the southeastern United
States. Sida 18, 1183-1206.
Ne'eman G, Ne'eman R, Ellison AM. 2006. Limits to reproductive success of
Sarracenia purpurea (Sarraceniaceae). American Journal of Botany 93, 1660-
1666.
Newell SJ, Nastase AJ. 1998. Efficiency of insect capture by Sarracenia purpurea
(Sarraceniaceae), the northern pitcher plant. American Journal of Botany 85, 88-
91.
Neyland R, Merchant M. 2006. Systematic relationships of Sarraceniaceae inferred
from nuclear ribosomal DNA sequences. Madroño 53, 223-232.
Oliver FW. 1944. A mass catch of Cabbage Whites by sundews. Proceedings of the
Royal Entomological Society of London, Series A 19, 5.
Osunkoya OO, Daud SD, Di-Giusto B, Wimmer FL, Holige TM. 2007. Construction
costs and physico-chemical properties of the assimilatory organs of Nepenthes
species in northern Borneo. Annals of Botany 99, 895-906.
Pate JS. 1986. Economy of symbiotic nitrogen fixation. In: Givnish TJ, ed. On the
economy of plant form and function. Cambridge, UK: Cambridge University
Press, 299-325.

68
1447
1448
1449
1450
1451
1452
1453
1454
1455
1456
1457
1458
1459
1460
1461
1462
1463
1464
1465
1466
1467
1468
1469
Pianka ER. 1973. The structure of lizard communities. Annual Review of Ecology and
Systematics 4, 53-74.
P»achno BJ, Swiatek P, Wistuba A. 2007. The giant extra-floral nectaries of
carnivorous Heliamphora folliculata: architecture and ultrastructure. Acta
Biologica Cracoviensia Series Botanica 49, 91-104.
P»achno BJ, Adamec L, Lichtscheidl IK, Peroutka M, Adlassnig W, Vrba J. 2006.
Fluorescence labelling of phosphatase activity in digestive glands of carnivorous
plants. Plant Biology 8, 813-820.
Porch SS. 1989. Prey capture in three species of sundew (Droseraceae: Drosera) on the
Gulf coastal plain. M.Sc. thesis, Auburn University, Auburn, Alabama.
Renner SS. 1989. Floral biological observations on Heliamphora tatei (Sarraceniaceae)
and other plants from Cerro de la Neblina in Venezuela. Plant Systematics and
Evolution 163, 21–29.
Rivadavia F, Kondo K, Kato M, Hasebe M. 2003. Phylogeny of the sundews,
Drosera (Droseraceae), based on chloroplast rbcL and nuclear 18S ribosomal
DNA sequences. American Journal of Botany 90, 123-130.
Robinson-Rechavi M, Huchon D. 2000. RRTree: Relative-rate tests between groups of
sequences on a phylogenetic tree. Bioinformatics 16, 296-297.
Romeo JT, Bacon JD, Mabry TJ. 1977. Ecological considerations of amino acids and
flavonoids in Sarracenia species. Biochemical Systematics and Ecology 5, 117–
120.
Sanabria-Aranada L, González-Bermúdez A, Torres NN, Guisande C, Manjarrés-
Hernández A, Valoyes-Valois V, Díaz-Olarte J, Andrade-Sossa C, Duque SR.
69
1470
1471
1472
1473
1474
1475
1476
1477
1478
1479
1480
1481
1482
1483
1484
1485
1486
1487
1488
1489
1490
1491
1492
2006. Predation by the tropical plant Utricularia foliosa. Freshwater Biology 51,
1999-2008.
Santiago LS, Wright SJ. 2007. Leaf functional traits of tropical forest plants in relation
to growth form. Functional Ecology 21, 19-27.
Schaefer HM, Ruxton GD. 2008. Fatal attraction: carnivorous plants roll out the red
carpet to lure insects. Biology Letters on-line-before-print at:
doi:10.1098/rsbl.2007.0607.
Schnell DE. 1977. Infraspecific variation in Sarracenia rubra Walt.: some observations.
Castanea 42, 149–170.
Schnell DE. 1979a. A critical review of published variants of Sarracenia purpurea L.
Castanea 44, 47-59.
Schnell DE. 1979b. Sarracenia rubra Walter ssp. gulfensis: a new subspecies.
Castanea. 44, 218–219.
Schnell DE. 1993. Sarracenia purpurea L. ssp. venosa (Raf.) Wherry var. burkii
Schnell (Sarraceniacaea) - a new variety of the Gulf coastal plain. Rhodora 95,
6-10.
Schnell DE, Determann RO. 1997. Sarracenia purpurea L. ssp. venosa (Raf.) Wherry
var. montana Schnell & Determann (Sarraceniaceae): a new variety. Castanea
62, 60-62.
Schnell DE. 2002. Carnivorous plants of the United States and Canada. Portland,
Oregon, USA: Timber Press.
Schoener TW. 1974. Resource partitioning in ecological communities. Science 185,
27-39.

70
1493
1494
1495
1496
1497
1498
1499
1500
1501
1502
Seine R, Barthlott W. 1994. Some proposals on the infrageneric classification of
Drosera L. Taxon 43, 583-589.
Shipley B. 2006. Net assimilation rate, specific leaf area and leaf mass ratio: which is
most closely correlated with relative growth rate? A meta-analysis. Functional
Ecology 20, 565-574.
Shipley B, Lechowicz MJ, Wright I, Reich PB. 2006. Fundamental trade-offs
generating the worldwide leaf economics spectrum. Ecology 87, 535-541.
Shreve F. 1906. The development and anatomy of Sarracenia purpurea. Botanical
Gazette (Old Series) 42, 107-126.
Stevens PF. 2007. Angiosperm Phylogeny Website, Version 8, June 2007.
http://www.mobot.org/MOBOT/research/APweb/. Last accessed February 29,
2008.
1503
1504
1505
1506
1507
1508
1509
1510
1511
1512
1513
1514
Stewart CN, Nilsen ET. 1992. Drosera rotundifolia growth and nutrition in a natural
population with special reference to the significance of insectivory. Canadian
Journal of Botany 70, 1409-1416.
Taylor P. 1989. The genus Utricularia: a taxonomic monograph. Kew Bulletin
Additional Series 14.
Thanikaimoni G, Vasanthy G. 1974. Sarraceniaceae: palynology and systematics.
Pollen et Spores 14, 143-155.
Thorén LM, Karlsson PS. 1998. Effects of supplementary feeding on growth and
reproduction of three carnivorous plant species in a subarctic environment.
Journal of Ecology 86, 501-510.

71
1515
1516
1517
1518
1519
1520
1521
1522
1523
1524
1525
1526
1527
1528
1529
1530
1531
1532
1533
1534
1535
1536
1537
Thorén LM, Tuomi J, Kämäräinen T, Laine K. 2003. Resource availability affects
investment in carnivory in Drosera rotundifolia. New Phytologist 159, 507-511.
Thum M. 1986. Segregation of habitat and prey in two sympatric carnivorous plant
species, Drosera rotundifolia and Drosera intermedia. Oecologia 70, 601-605.
Thum M. 1988. The significance of carnivory for the fitness of Drosera in its natural
habitat. 1. The reactions of Drosera intermedia and D. rotundifolia to
supplementary feeding. Oecologia 75, 472-480.
Thum M. 1989. The significance of carnivory for the fitness of Drosera in its natural
habitat. 2. The amount of captured prey and its effect on Drosera intermedia and
Drosera rotundifolia. Oecologia 81, 401-411.
Ulanowicz RE. 1995. Utricularia's secret: the advantage of positive feedback in
oligotrophic environments. Ecological Modelling 79, 49-57.
van Achterberg C. 1973. A study about the arthropoda caught by Drosera species.
Entomologische berichten 33, 137-140.
Verbeek NAM, Boasson R. 1993. Relationship between types of prey captured and
growth form in Drosera in southwestern Australia. Australian Journal of
Ecology 18, 203-207.
Vogel S. 1998. Remarkable nectaries: structure, ecology, organophyletic perspectives -
II. Nectarioles. Flora 193, 1-29.
Wakefield AE, Gotelli NJ, Wittman SE, Ellison AM. 2005. The effect of prey
addition on nutrient stoichiometry, nutrient limitation, and morphology of the
carnivorous plant Sarracenia purpurea (Sarraceniaceae). Ecology 86, 1737-
1743.

72
1538
1539
1540
1541
1542
1543
1544
1545
1546
1547
1548
1549
1550
1551
1552
1553
1554
1555
1556
1557
1558
1559
1560
Watson AP, Matthiessen JN, Springett BP. 1982. Arthropod associates and
macronutrient status of the red-ink sundew (Drosera erythrorhiza Lindl.).
Australian Journal of Ecology 7, 13-22.
Weiss TEJ. 1980. The effects of fire and nutrient availability on the pitcher plant
Sarracenia flava L. PhD thesis, University of Georgia, Athens,
Williams SE, Albert VA, Chase MW. 1994. Relationships of Droseraceae: a cladistic
analysis of rbcL sequence and morphological data. American Journal of Botany
81, 1027-1037.
Winemiller KO, Pianka ER. 1990. Organization in natural assemblages of desert
lizards and tropical fishes. Ecological Monographs 60, 27-55.
Worley AC, Harder LD. 1999. Consequences of preformation for dynamic resource
allocation by a carnivorous herb, Pinguicula vulgaris (Lentibulariaceae).
American Journal of Botany 86, 1136-1145.
Wright IJ, Reich PB, Cornelissen JHC, Falster DS, Garnier E, Hikosaka K,
Lamont BB, Lee W, Oleksyn J, Osada N, Poorter H, Villar R, Warton DI,
Westoby M. 2005. Assessing the generality of global leaf trait relationships.
New Phytologist 166, 485-496.
Wright IJ, Reich PB, Westoby M, Ackerly DD, Baruch Z, Bongers F, Cavender-
Bares J, Chapin T, Cornelissen JHC, Diemer M, Flexas J, Garnier E,
Groom PK, Gulias J, Hikosaka K, Lamont BB, Lee T, Lee W, Lusk C,
Midgley JJ, Navas M-L, Niinemets U, Oleksyn J, Osada N, Poorter H, Poot
P, Prior L, Pyankov V, Roumet C, Thomas SC, Tjoelker MG, Veneklaas EJ,
Villar R. 2004. The worldwide leaf economics spectrum. Nature 428, 821-827.

73
1561
1562
1563
1564
1565
1566
1567
1568
1569
1570
1571
Zamora R. 1990. The feeding ecology of a carnivorous plant (Pinguicula nevadense):
prey analysis and capture constraints. Oecologia 84, 376-379.
Zamora R. 1995. The trapping success of a carnivorous plant, Pinguicula
vallisneriifolia: the cumulative effects of availability, attraction, retention, and
robbery of prey. Oikos 73, 309-322.
Zamora R, Gomez JM, Hódar JA. 1997. Responses of a carnivorous plant to prey and
inorganic nutrients in a Mediterranean environment. Oecologia 111, 443-451.
Zamora R, Gomez JM, Hódar JA. 1998. Fitness responses of a carnivorous plant in
contrasting ecological scenarios. Ecology 79, 1630-1644.
Zuccon A, Zuccon D. 2006. MrEnt version 1.2. Stockholm, Sweden: Swedish Museum
of Natural History, Department of Vertebrate Zoology and Molecular
Systematics Laboratory. http://www.nrm.se/MrEnt. 1572

74
1573
1574
1575
1576
1577
1578
1579
Table 1. Summary of null model analysis of niche overlap in prey utilization by
congeneric carnivorous plants. Each row gives a different study and the number of
coexisting congeneric species . Observed is the observed average pairwise niche
overlap. Expected is the mean value of average pairwise niche overlap in 1000
randomizations of the resource utilization data. The P-value is the upper tail probability
of finding the observed pattern if the data were drawn from the null distribution.
Niche overlap
Genus Site Species Observed Expected P
Sarracenia1 Okaloosa County, Florida, USA 5 0.637 0.197 0.002
Sarracenia2 Santa Rosa County, Florida, USA 2 0.996 0.128 0.038
Sarracenia3 Turner County, Georgia, USA 3 0.634 0.235 0.013
Sarracenia4 Brunswick County, N. Carolina, USA 3 0.975 0.128 0.001
Drosera5 Baldwin County, Alabama, USA 3 0.880 0.241 0.001
Drosera6 Santa Rosa County, Florida, USA 2 0.868 0.256 0.001
Drosera7 Walton County, Florida, USA 2 0.738 0.205 0.031
Drosera8 Chiemsee, S. Bavaria, Germany 2 0.708 0.226 0.045
Drosera9 Eastern Netherlands 3 0.796 0.168 0.001
Drosera10 Fitzgerald River, SW Australia 5 0.534 0.486 0.043
Drosera11 Murdoch University, SW Australia 3 0.801 0.614 0.001

75
1580
1581
1582
1583
1584
1585
1586
1S. flava, S. leucophylla, S. rubra, S. purpurea, S. psittacina; 2S. flava, S. psittacina; 3S.
flava, S. minor, S. psittacina; 4S. flava, S. purpurea, S. rubra; 5D. filiformis Raf. var.
tracyi (Macf. ex Diels) Diels, D. intermedia Hayne, D. capillaris Poir.; 6D. intermedia,
D. capillaris; 7D. filiformis var. tracyi, D. capillaris; 8D. rotundifolia L., D. intermedia;
9D. rotundifolia, D. intermedia, D. anglica Huds.); 10D. menziesii R.Br. ex. DC, D.
drummondii Lehm. [= D. barbigera Planch.], D. glanduligera Lehm., D. paleacea DC,
D. erythrorhiza Lindl.; 11D. pallida Lindl., D. stolonifera Endl., D. menziesii.

76
1587
1588
1589
1590
1591
1592
1593
1594
1595
1596
1597
1598
1599
1600
1601
1602
1603
1604
1605
1606
1607
1608
Figure Legends
Fig. 1. Positions of carnivorous plant families in the current overall angiosperm
phylogeny (Stevens 2007; relationships within the Lamiales from Müller et al., 2006).
Families that are exclusively carnivorous are set in bold-face type and highlighted in
green; families with only one (Dioncophyllaceae) or two (Bromeliaceae) carnivorous
genera are set in italic type and highlighted in yellow; and the family (Martyniaceae)
with the possibly carnivorous Ibicella lutea v.Eselt. is set in italic type and highlighted
in blue. Representative traps of each genus are illustrated (drawings by Elizabeth
Farnsworth), and the number of species in each genus is given in parentheses. The
phylogenetic tree was drawn using the MrEnt software package (Zuccon and Zuccon,
2006); branch lengths are drawn only to emphasize the location of carnivorous families
and otherwise are not meaningful (i.e., do not signify time since divergence or any other
metric of relatedness).
Fig. 2. Relative rates of gene substitution in carnivorous plant genera relative to the
basal angiosperm (Amborella + Nymphaeales). Angiosperm taxa are arrayed on the x-
axis from smallest to largest rates of matK substitution rates. The relative substitution
rate on the y-axis is calculated as the difference between K(Genlisea, outgroup) –
K(other taxon, outgroup), where K(taxon, outgroup) = the maximum likelihood estimate
of substitutions per site between the taxon and the outgroup (Müller, 2005). A rough
estimate of the percentage difference in substitution rates between two carnivorous plant

taxa can be found as 1
211100CP
CPCP −−× , where CPi is the relative substitution rate of
carnivorous plant species i (see text footnote 8 for caveats in using this estimator).
Figure reprinted from Müller (2004) with permission of the author and the publisher,
Georg Thieme Verlag KG.
1609
1610
1611
1612
1613
1614
1615
1616
1617
1618
1619
1620
1621
1622
1623
1624
1625
1626
1627
1628
1629
1630
Fig. 3. Prey spectra of terrestrial carnivorous plant genera. The slices of each “star” plot
are scaled to the average proportion of each prey taxon (order except for ants – family
Formicidae). Only the 12 most common prey orders are shown. Key to the colors is
given in the lower right of the figure.
Fig. 4. Results of the analysis of prey capture by seven carnivorous plant genera. A –
Probability of interspecific encounter (PIE), or the probability that two prey items
drawn at random from a trap are from different taxa. High values of PIE indicate less
specialization on particular prey orders than do low values of PIE. B – proportion of
ants in the prey captured by each genus. C – proportion of flies in the prey captured by
each genus. For each variable, boxes illustrate the median (horizontal line), upper and
lower quartiles (limits of the box), upper and lower deciles (limits of the vertical lines),
and extreme values (individual points). The width of the box is proportional to the
square-root of the sample size. Note that for Brocchinia and Triphyophyllum the sample
size is only equal to 1 each, so there is no distribution from which to draw a box. The
values for those two species are indicated by a single horizontal line.
77

78
1631
1632
1633
1634
1635
1636
1637
1638
1639
1640
1641
1642
1643
1644
1645
1646
1647
1648
1649
1650
1651
1652
Fig. 5. Results of the similarity analysis for four studies in which prey abundances were
measured in carnivorous plants and in artificial traps in, or grab samples from, the same
habitat. Prey taxon categories used were the same as in the original study, and
microhabitat differences were retained in separate analyses. The value plotted is the
Chao-Jaccard abundance-based similarity index JChao adjusted for unobserved taxa
(Chao et al., 2005); 95% parametric confidence intervals are derived from 1000
bootstrap samples. If the interval includes 1.0 (gray vertical dotted line), then the JChao
value does not differ from that expected given the null hypothesis that the distribution
of prey captures by the plants is not different from that in the traps.
Fig. 6. Simulated frequency distributions of sizes of prey captured by the Venus’ fly-
trap, Dionaea muscipula, described by Darwin (1875; black bars) and Jones (1923; gray
bars). The arrow indicates the average size of the Dionaea traps studied by Darwin
(Jones did not report trap size).
Fig. 7. Photosynthetic nitrogen and phosphorus use efficiency by carnivorous plants and
non-carnivorous plants. Data for carnivorous plants from Weiss (1980), Knight (1992),
Adamec (1997), Méndez and Karlsson (1999), Wakefield et al. (2005), Ellison and
Farnsworth (2005), Farnsworth and Ellison (2008), and Karagtzides and Ellison (2008).
Data for non-carnivorous plants from Wright et al. (2004) and Santiago and Wright
(2007).

79
1653
1654
1655
1656
1657
1658
1659
1660
Fig. 8. Box-plots illustrating leaf construction costs for traps of 23 carnivorous plants
(data from Osunkoya et al., 2007; Karagatzides and Ellison, 2008) and 269 non-
carnivorous plants (data summarized in Karagatzides and Ellison, 2008)15. The scatter-
plot illustrates the difference between construction costs of traps and laminae of
Nepenthes (solid symbols); or phyllodia and pitchers of three species of Sarracenia
(open symbols) (data from Osunkoya et al., 2007; Karagatzides and Ellison, 2008); the
dotted line indicates the location where the construction costs of traps and laminae
would be equal.
15 Data available from the Harvard Forest Data Archive, dataset HF-112:
http://harvardforest.fas.harvard.edu/data/p11/hfX112/hf112.html

Brocchinia (3),Catopsis (1)
Drosera (~160)
Dionaea (1),Aldrovanda (1)
Nepenthes (~90)
Drosophyllum (1)
Triphyophyllum (1)
Cephalotus (1)
Sarracenia (11), Heliamphora (6), Darlingtonia (1)
Roridula (2)
Pinguicula (~80)
Genlisea (21)
Utricularia (~250)
Ibicella (1)
Byblis (5)


Dionaea Drosera
Nepenthes Pinguicula
Sarracenia Triphyophyllum
Brocchinia

BrocchiniaDrosera
Dionaea
Nepenthes
Pinguicula
Utricularia
Sarracenia
Triphyophyllum
Prop
ortio
n fli
es c
aptu
red
0.0
0.2
0.4
0.6
0.8
1.0
Prob
abili
ty o
f In
ters
peci
fic E
ncou
nter
( PIE
)
0.0
0.2
0.4
0.6
0.8
1.0
Prop
ortio
n an
ts c
aptu
red
0.0
0.2
0.4
0.6
0.8
1.0
A
B
C

Chao-Jaccard Similarity Index (with bootstrapped 95% CIs)
0.6 0.8 1.0 1.2 1.4
Pinguicula longifolia (1990)
Pinguicula longifolia (1991)
Pinguicula nevadense (Dry site)
Pinguicula nevadense (Shade site)
Pinguicula vallisneriifolia (Sun site)
Pinguicula vallisneriifolia (Wall site)
Pinguicula vallisneriifolia (Shade site)
Drosera erythrorhiza (Burned)
Drosera erythrorhiza (Unburned)
Utricularia minor
Utricularia vulgaris
Utricularia intermedia
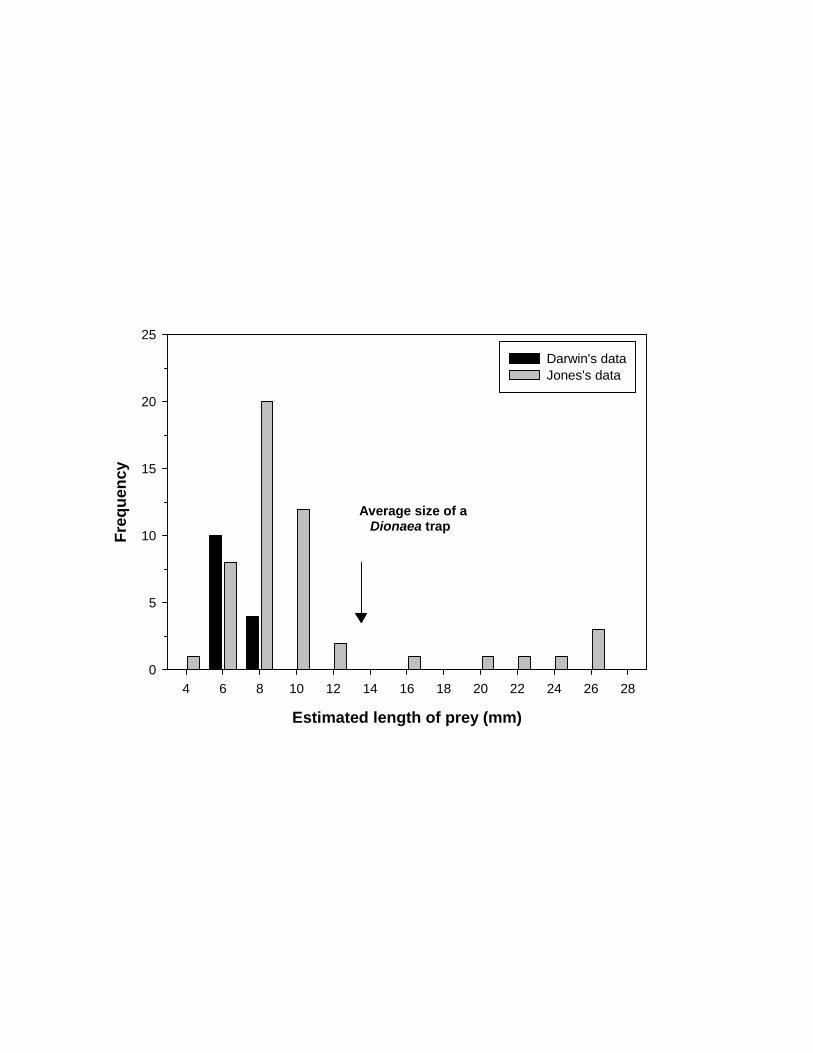
Estimated length of prey (mm)
4 6 8 10 12 14 16 18 20 22 24 26 28
Freq
uenc
y
0
5
10
15
20
25
Darwin's dataJones's data
Average size of a Dionaea trap

PNUEN: μmol CO2 mol-1 N s-1
1 10 100
Non-carnivorous plants (N = 754)
Carnivorous plants (N = 44)
PNUEP: μmol CO2 mol-1 N s-1
100 1000 10000
Non-carnivorous plants (N = 255)
Carnivorous plants (N = 15)

Construction cost (g glucose g-1 ash-free dry mass)
0.8 1.0 1.2 1.4 1.6 1.8 2.0 2.2
Non-carnivorous plants (N = 269)
Carnivorous plants (N = 23)
Trap construction cost(g glucose g-1 ash-free dry mass)
1.0 1.1 1.2 1.3 1.4 1.5 1.6 1.7
Lam
ina/
Phyl
lodi
a co
nstr
uctio
n co
st(g
glu
cose
g-1 a
sh-fr
ee d
ry m
ass)
1.0
1.1
1.2
1.3
1.4
1.5
1.6
1.7