enercom dallas, february 2018 tigana field tua field chachalaca sur 1 tigui 1 buco-1 chachalaca...
TRANSCRIPT

Unlocking Latin America
Enercom Dallas, February 2018

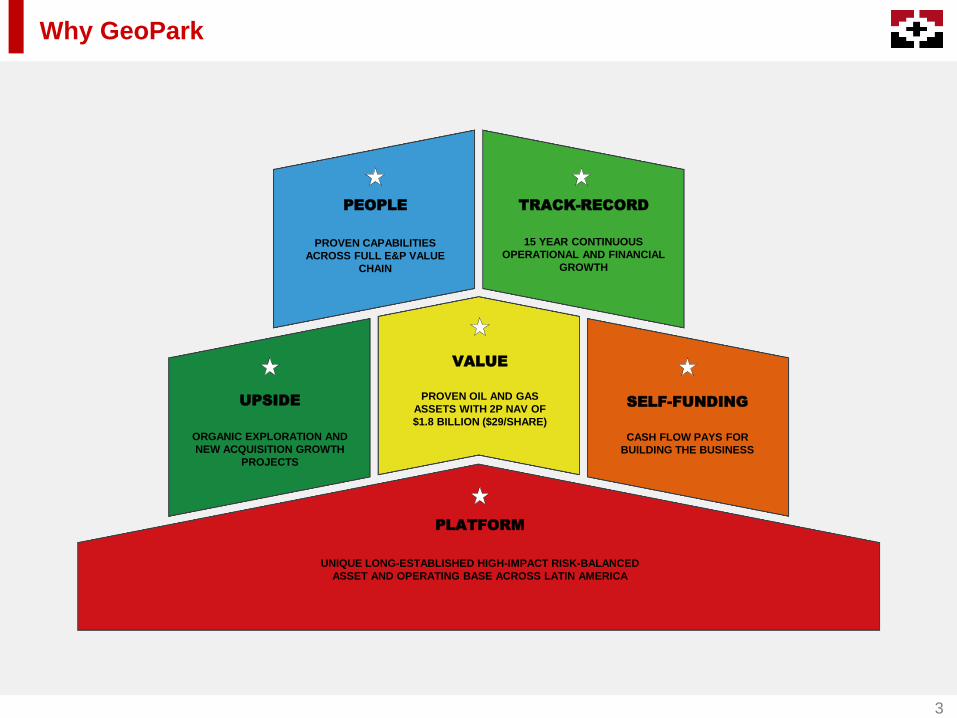
Why GeoPark
3
PLATFORM
PEOPLE
VALUE
UPSIDE SELF-FUNDING
PROVEN CAPABILITIES
ACROSS FULL E&P VALUE
CHAIN
PROVEN OIL AND GAS
ASSETS WITH 2P NAV OF
$1.8 BILLION ($29/SHARE)
ORGANIC EXPLORATION AND
NEW ACQUISITION GROWTH
PROJECTS
UNIQUE LONG-ESTABLISHED HIGH-IMPACT RISK-BALANCED
ASSET AND OPERATING BASE ACROSS LATIN AMERICA
CASH FLOW PAYS FOR
BUILDING THE BUSINESS
TRACK-RECORD
15 YEAR CONTINUOUS
OPERATIONAL AND FINANCIAL
GROWTH
0
10,000
20,000
30,000
40,000
50,000
60,000
70,000
80,000
90,000
100,000
2006 2007 2008 2009 2010 2011 2012 2013 2014 2015 2016 2017 2018 2019 2020 2021 2022
ARGENTINA
BRAZILPERU
COLOMBIA
MEXICO
ECUADOR
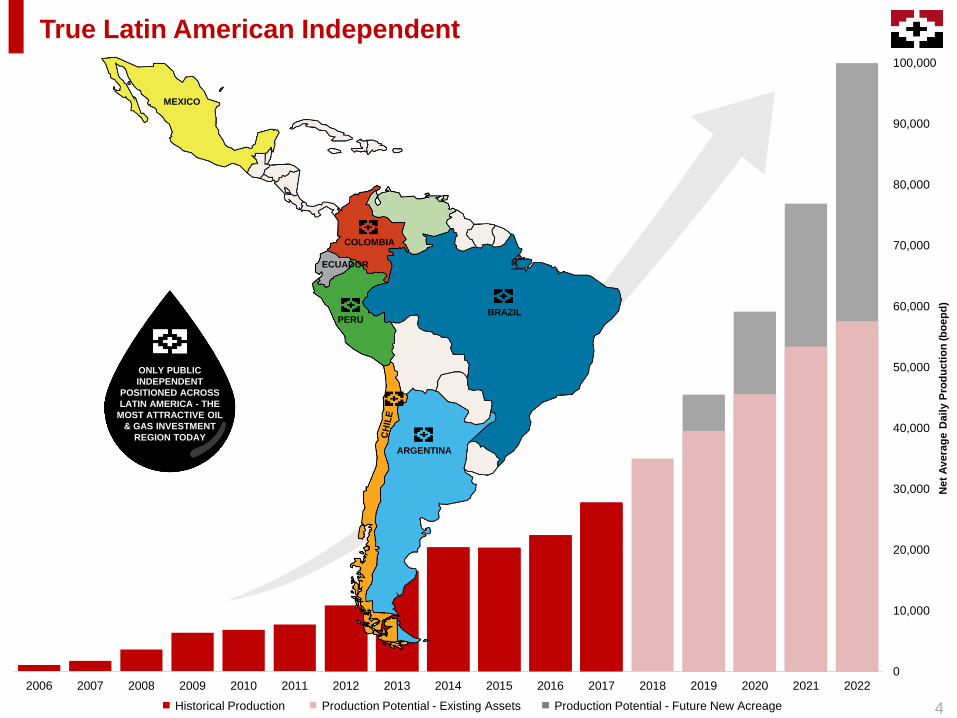
True Latin American Independent
ONLY PUBLIC
INDEPENDENT
POSITIONED ACROSS
LATIN AMERICA - THE
MOST ATTRACTIVE OIL
& GAS INVESTMENT
REGION TODAY
4
Net
Av
era
ge
Dail
y P
rod
uc
tio
n (b
oe
pd
)
Historical Production Production Potential - Existing Assets Production Potential - Future New Acreage

Proof is in the Pudding 15 Year Successful Track-Record
v
DRILLING SUCCESS RATE
200+ wells
Llanos 34
70+%
95+%
FINDING & DEVELOPMENT COSTS1
Consolidated
Llanos 34
/boe
$2.8 /boe
5
DRILL, COMPLETE & PUT-ON-
PRODUCTION WELL COST
Llanos 34
OPEX3
Consolidated
Llanos 34
OPERATED PRODUCTION
Gross
$7 /boe
$4 /boe
OIL & GAS DISCOVERED
2P Gross
2P 2017 RRI2
<$3.5 mm/well
61,000+ boepd
5
COUNTRIES
9
HYDROCARBON
BASINSBLOCKS
32 5.0
ACRESEXPLORATION
RESOURCES
450-700mmboe mm
261%
$4.0
300+ mmboe
1 Estimated by dividing Future Development Capital (FDC) by 2P Reserves (based on D&M 2017) 2 Reserve Replacement Index 3 9M2017

Partner of Choice
12015-2018 6
ZEROROAD BLOCKS1
AND STRIKES1
STOCK PRICE
INCREASE IN 2017
130%VEHICLE ACCIDENTS
IN 6 MM KM
ZERO
100%EMPLOYEES ARE
SHAREHOLDERS
ZEROSANCTIONS

118 122
225+
300+
49 39
106 110
2015 2016 2017E 2018E
Operating Netback ($mm) Capital Expenditures ($mm)
Paying Our Way
Pro
du
cti
on
(b
oe
pd
)
100%
85%
20%
Oil ($40-50 /bbl)
Oil ($25-30 /bbl)
Gas
(Unaffected by oil price)
32,000
10,000
0
COST EFFICIENCY: 85% OF PRODUCTION IS CASH
FLOW POSITIVE AT $25-$30 BRENT
Self-Funding Real Business
MORE CASH FROM
OPERATIONS
180+
100+
80+65+
Capex ($mm) Cash Surplus ($mm) (Operating
Netback Minus Capex)
• Cash of $135 million
• 1P NPV of $1.5 billion
• 2P NPV of $2.3 billion
ASSETS
LIABILITIES
• Recent $425 million 144-A/Reg-S bond
• 2024 bullet maturity
• 6.5% coupon
• $1.8 billion oversubscribed
• Top tier investors
7
CASH GENERATION 2-3X CAPITAL INVESTMENT
STRONG BALANCE SHEET
2017E1 2018E1
1E Brent $60-$65
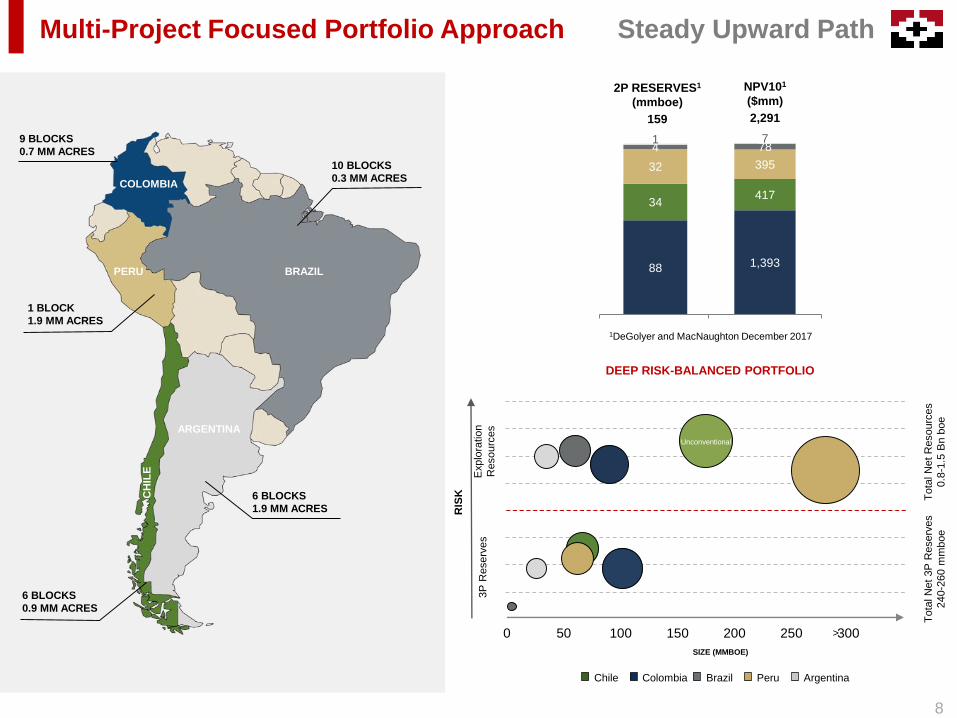
Multi-Project Focused Portfolio Approach
8
Steady Upward Path
10 BLOCKS
0.3 MM ACRES
ARGENTINA
CH
ILE
BRAZILPERU
6 BLOCKS
1.9 MM ACRES
6 BLOCKS
0.9 MM ACRES
1 BLOCK
1.9 MM ACRES
9 BLOCKS
0.7 MM ACRES
COLOMBIA
To
tal N
et
Resourc
es
0.8
-1.5
Bn
boe
To
tal N
et
3P
Reserv
es
240-2
60 m
mb
oe
Exp
lora
tio
n
Reso
urc
es
3P
Rese
rve
s
RIS
K
SIZE (MMBOE)
Chile Colombia Brazil Peru Argentina
>0 50 100 150 200 250 300
Unconventional
DEEP RISK-BALANCED PORTFOLIO
88
34
32
41
1,393
417
395
787
159 2,291
2P RESERVES1
(mmboe)
NPV101
($mm)
1DeGolyer and MacNaughton December 2017

Putting Capital Where it Does Most Good
9
25-30BRENT $60-65
OPERATING
NETBACK
($/boe)
31,500-32,500+15-20% (vs. 2017)
2018 PRODUCTION
(boepd)
30+
GROSS
WELLS
60,000+
PRODUCTION
GROSS OPERATED
(boepd)
34,000+
2018 EXIT
PRODUCTION
(boepd)
14-15
GROSS
EXPLORATION
WELLS
Oil Price Environment ($/bbl)
$40/bbl $60/bbl$50/bbl
Flexible Work Program- +
+-
Project
Portfolio
$50-90 MM $100-110 MM $120-150 MM
+ 5-10% + 15-20% + 20-25%Production
Growth
CAPEX
CAPITAL ALLOCATION:
Projects Compete Against
Each Other on Technical,
Economic and Strategic
Criteria
CAPEX
$85-90 MMCAPEX
$3-4 MM
CAPEX
$6-9 MM
CAPEX
$5-8 MM
CAPEX
$1-2 MM
Colombia Brazil
Chile
Peru
Argentina
2018

11.516.5
38.646.50
67.4
88.2
2012 2013 2014 2015 2016 2017
3,440
6,491
10,807
13,189
15,590
21,788
2012 2013 2014 2015 2016 2017
Colombia
OUR ASSETS
• Key asset: Llanos 34
• 9 blocks - 6 operated
• 0.7 mm acres
• D&M 2P and 3P net reserves: 88.2 mmbbl and 101.7 mmbbl
respectively
• Acquired new exploration acreage on Llanos 34 trend: Tiple
and Zamuro, to be drilled in 2Q2018
TRACK RECORD & VALUE
• D&M 2P and 3P NPV: $1,393 million and $1,588 million
respectively
• Grew from 0 to 55,000+ boepd gross in five years
• Third largest operator in Colombia
• 75-85 identified drilling locations
NET RESERVES AND PRODUCTION GROWTH
2P RESERVES (MMBBL) PRODUCTION (BBL/D)
Pacific
Ocean
PANAMA
VENEZUELA
COLOMBIA
200km
VIM-3
LLANOS BASIN
LA CUERVA
LLANOS 34
10
Leading Oil Story in Latin America
CAGR 45%CAGR 50%

GEOPARK OPERATED, 45% WI
Oil Fields (3P D&M 2017)
Exploration Prospects and Resources Wells expected to be drilled in 2018
Max Field
1 Km
Jacana Field
Tilo Field
Chiricoca Field
Jacamar Field
Curucucú Field
Aruco Field
Tarotaro Field
Tigana Field
Tua Field
Chachalaca Sur 1
Tigui 1
Buco-1
Chachalaca Field
Colombia
11
Llanos 34: 200+ mmbbl and Growing
GeoPark brought new geological
play type to the Llanos basin
Guaco- 1

0
5,000
10,000
15,000
20,000
25,000
30,000
35,000
40,000
45,000
50,000
55,000
0
5,000,000
10,000,000
15,000,000
20,000,000
25,000,000
30,000,000
35,000,000
40,000,000
45,000,000
50,000,000
Jun-12 Dec-12 Jun-13 Dec-13 Jun-14 Dec-14 Jun-15 Dec-15 Jun-16 Dec-16 Jun-17 Dec-17
Daily P
rod
ucti
on
(b
op
d)
Cu
mm
ula
tiv
e P
rod
ucti
on
(b
bl)
Colombia
LLANOS 34 VALUE
GROWTH2012 2017
2P net reserves 0 83 mmbbl
Purchase price $30 mm 0
2P NPV 0 $1.3+ Bn
12PRODUCTION HISTORY LLANOS 34 BLOCK
MULTIPLYING VALUE 40X IN 5 YEARS
Oil Production
Cumulative Production
When Everything Works
WELL ECONOMICS
EUR/well 2-3 mmbbl
IP Rate 1,500-2,000 bopd
Payback 4-6 months
IRRs 500%+
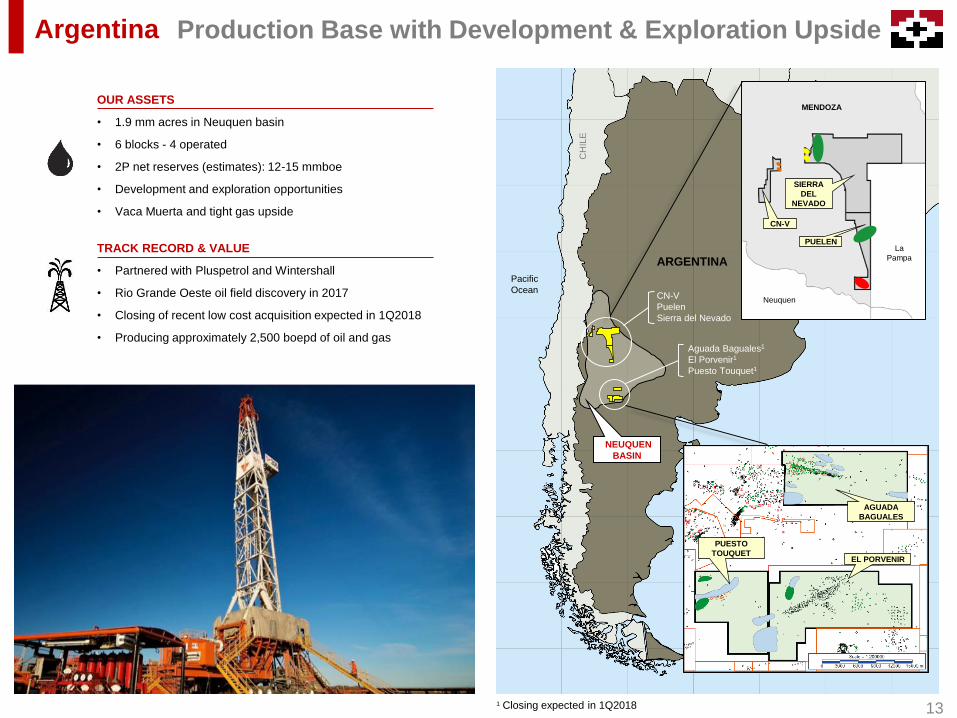
Argentina
OUR ASSETS
• 1.9 mm acres in Neuquen basin
• 6 blocks - 4 operated
• 2P net reserves (estimates): 12-15 mmboe
• Development and exploration opportunities
• Vaca Muerta and tight gas upside
TRACK RECORD & VALUE
• Partnered with Pluspetrol and Wintershall
• Rio Grande Oeste oil field discovery in 2017
• Closing of recent low cost acquisition expected in 1Q2018
• Producing approximately 2,500 boepd of oil and gas
Atlantic
Ocean
Pacific
Ocean
ARGENTINAURUGUAY
CH
ILE
BRAZIL
PARAGUAY
1 Closing expected in 1Q2018
CN-V
Puelen
Sierra del Nevado
Aguada Baguales1
El Porvenir1
Puesto Touquet1
NEUQUEN
BASIN
MENDOZA
La
Pampa
Neuquen
CN-V
PUELEN
SIERRA
DEL
NEVADO
Production Base with Development & Exploration Upside
13
AGUADA
BAGUALES
EL PORVENIR
PUESTO
TOUQUET
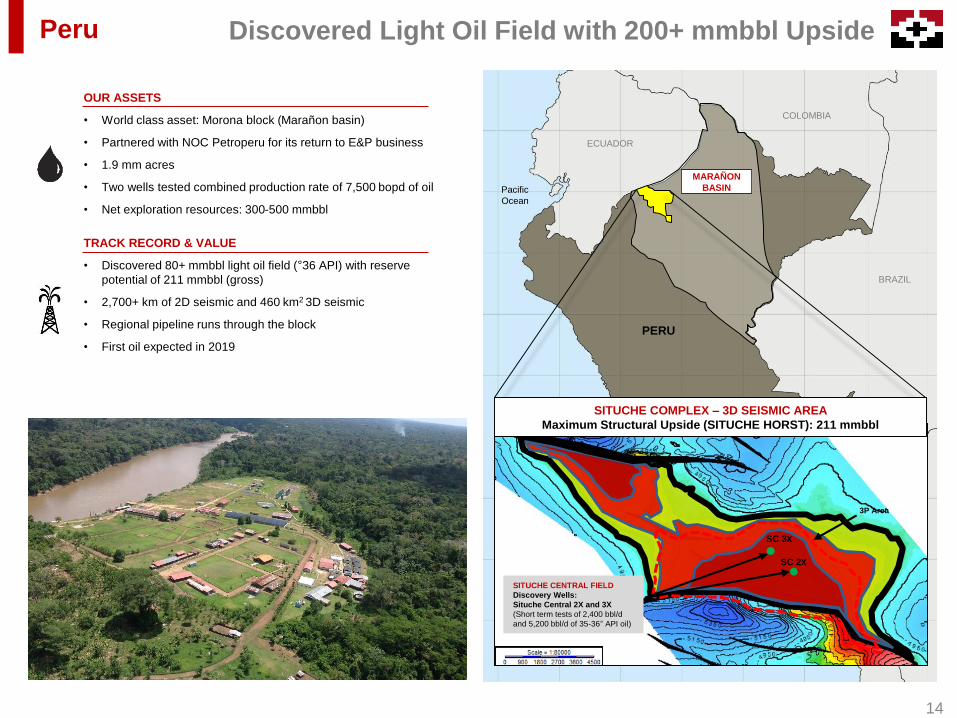
Peru
OUR ASSETS
• World class asset: Morona block (Marañon basin)
• Partnered with NOC Petroperu for its return to E&P business
• 1.9 mm acres
• Two wells tested combined production rate of 7,500 bopd of oil
• Net exploration resources: 300-500 mmbbl
TRACK RECORD & VALUE
• Discovered 80+ mmbbl light oil field (°36 API) with reserve
potential of 211 mmbbl (gross)
• 2,700+ km of 2D seismic and 460 km2 3D seismic
• Regional pipeline runs through the block
• First oil expected in 2019
MARAÑON
BASINPacific
Ocean
BRAZIL
COLOMBIA
ECUADOR
PERU
14
Discovered Light Oil Field with 200+ mmbbl Upside
BOLIVIA
2P Area
SITUCHE CENTRAL FIELD
Discovery Wells:
Situche Central 2X and 3X
(Short term tests of 2,400 bbl/d
and 5,200 bbl/d of 35-36° API oil)
3P Area
SC 2X
SC 3X
SITUCHE COMPLEX – 3D SEISMIC AREA
Maximum Structural Upside (SITUCHE HORST): 211 mmbbl
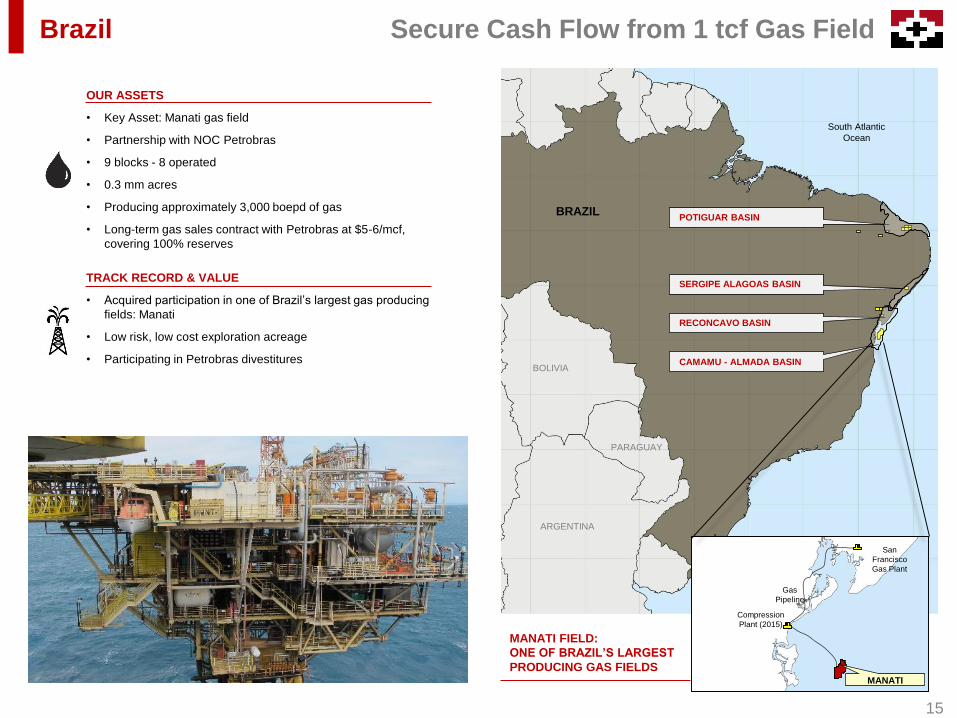
Brazil
OUR ASSETS
• Key Asset: Manati gas field
• Partnership with NOC Petrobras
• 9 blocks - 8 operated
• 0.3 mm acres
• Producing approximately 3,000 boepd of gas
• Long-term gas sales contract with Petrobras at $5-6/mcf,
covering 100% reserves
TRACK RECORD & VALUE
• Acquired participation in one of Brazil’s largest gas producing
fields: Manati
• Low risk, low cost exploration acreage
• Participating in Petrobras divestitures
RECONCAVO BASIN
POTIGUAR BASIN
CAMAMU - ALMADA BASIN
SERGIPE ALAGOAS BASIN
South Atlantic
Ocean
BRAZIL
San
Francisco
Gas Plant
Gas
Pipeline
Compression
Plant (2015)
MANATI
ARGENTINA
BOLIVIA
PARAGUAY
MANATI FIELD:
ONE OF BRAZIL’S LARGEST
PRODUCING GAS FIELDS
15
Secure Cash Flow from 1 tcf Gas Field

Chile
OUR ASSETS
• Key asset: Fell block
• 6 operated blocks
• 0.9 MM acres
• D&M 2P net reserves: 34.0 mmboe
• Long-term gas contract at attractive prices ($4-5/mcf)
TRACK RECORD & VALUE
• First private E&P operator
• Stable self-funded production base
• Net exploration resources: 98-172 mmboe
• Unconventional upside: shale oil and tight gas 220-600 mmboe
CH
ILE
FELL
MAGALLANES
BASIN
Pacific
Ocean
Atlantic
Ocean
BRAZIL
PARAGUAY
ARGENTINA
BOLIVIA
ISLA NORTE
CAMPANARIOFLAMENCO
16
Low Risk Production Base with Big Unconventional Upside
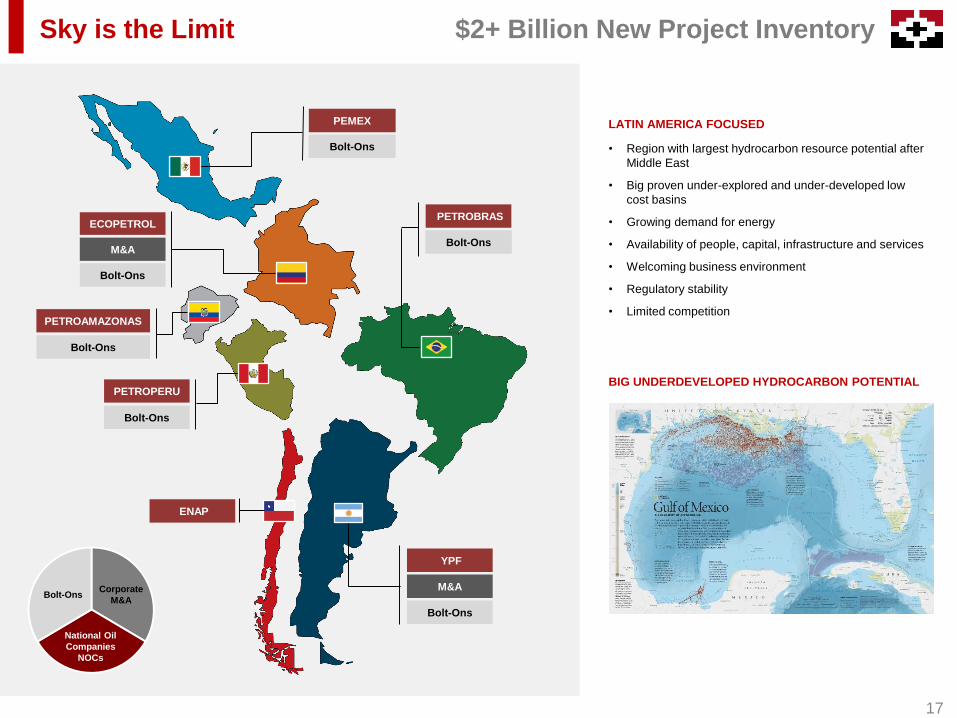
LATIN AMERICA FOCUSED
Sky is the Limit
• Region with largest hydrocarbon resource potential after
Middle East
• Big proven under-explored and under-developed low
cost basins
• Growing demand for energy
• Availability of people, capital, infrastructure and services
• Welcoming business environment
• Regulatory stability
• Limited competition
PETROBRASECOPETROL
M&A
Bolt-Ons
Bolt-Ons
Bolt-Ons
PEMEX
Bolt-Ons
PETROPERU
PETROAMAZONAS
Bolt-Ons
ENAP
17
$2+ Billion New Project Inventory
National Oil
Companies
NOCs
Bolt-OnsCorporate
M&A
BIG UNDERDEVELOPED HYDROCARBON POTENTIAL
M&A
YPF
Bolt-Ons

Still Dirt Cheap
18
GEOPARK BEST PERFORMING E&P STOCK (NYSE 2017)
-40%
-15%
10%
35%
60%
85%
110%
135%
S&P O&G GPRK Brent
Jan 2017 Dec 2017
UNDERVALUED ON EVERY METRIC VS PEERS
SHARE VALUES AT 1P, 2P AND 3P NET ASSET VALUES (NAV)
BASED ON D&M 20171
Current share price
Proved Developed
Reserves
Proved Undeveloped
Reserves
Net Debt 1P NAV Probable
Reserves
2P NAV Possible
Reserves
3P NAV
$1.8 Bn
$1.1 Bn
$18/share
$29/share
$44/share
$2.6 Bn
$0.6 Bn
GPRK UP 130%
GeoPark
1 Net of minority interests
4
10 36
6
16
60
EV/Adj.Ebitda(x)
EV/1P($boe)
EV/Prod.(m$/boepd)
GeoPark US/CAN group average*2
EV1/Adj.Ebitda
(x)
EV1/1P
($boe)
EV1/Prod.
(m$/boepd)
Enterprise Value
/Adj.Ebitda
(x)
Enterprise Value
/1P Reserves
($boe)
Enterprise Value
/Flowing Barrel
(m$/boepd)
US/CAN peer group average

19
Come on Board
PEOPLE
+
+
+
+
+
TRACK-RECORD
UPSIDE
VALUE
SELF-FUNDING
PLATFORM
ARGENTINA
BRAZILPERU
COLOMBIA
MEXICO
ECUADOR
Short, Medium & Long Term Investment Opportunity

20
Disclaimer
The material that follows comprises information about GeoPark Limited (“GeoPark” or the “Company”) and its
subsidiaries, as of the date of the presentation. It has been prepared solely for informational purposes and should
not be treated as giving legal, tax, investment or other advice to potential investors. The information presented or
contained herein is in summary form and does not purport to be complete.
No representations or warranties, express or implied, are made as to, and no reliance should be placed on, the
accuracy, fairness, or completeness of this information. Neither GeoPark nor any of its affiliates, advisers or
representatives accepts any responsibility whatsoever for any loss or damage arising from any information
presented or contained in this presentation. The information presented or contained in this presentation is current
as of the date hereof and is subject to change without notice, and its accuracy is not guaranteed. Neither GeoPark
nor any of its affiliates, advisers or representatives makes any undertaking to update any such information
subsequent to the date hereof.
This presentation contains forward-looking statements, which are based upon GeoPark and/or its management’s
current expectations and projections about future events. When used in this presentation, the words “believe,”
“anticipate,” “intend,” “estimate,” “expect,” “should,” “may” and similar expressions, or the negative of such words
and expressions, are intended to identify forward-looking statements, although not all forward-looking statements
contain such words or expressions. Additionally, all information, other than historical facts included in this
presentation, regarding strategy, future operations, drilling plans, estimated reserves, estimated resources, future
production, estimated capital expenditures, projected costs, the potential of drilling prospects and other plans and
objectives of management is forward-looking information. Such statements and information are subject to a
number of risks, uncertainties and assumptions. Forward-looking statements are not guarantees of future
performance and actual results may differ materially from those anticipated due to many factors, including oil and
natural gas prices, industry conditions, drilling results, uncertainties in estimating reserves and resources,
availability and cost of drilling rigs, production equipment, supplies, personnel and oil field services, availability of
capital resources and other factors. As for forward-looking statements that relate to future financial results and
other projections, actual results may be different due to the inherent uncertainty of estimates, forecasts and
projections. Because of these uncertainties, potential investors should not rely on these forward-looking
statements. Neither GeoPark nor any of its affiliates, directors, officers, agents or employees, nor any of the
shareholders or under shall be liable, in any event, before any third party (including investors) for any investment
or business decision made or action taken in reliance on the information and statements contained in this
presentation or for any consequential, special or similar damages.
Statements related to resources are deemed forward-looking statements as they involve the implied assessment,
based on certain estimates and assumptions, that the resources will be discovered and can be profitably
produced in the future. Specifically, forward-looking information contained herein regarding "resources" may
include: estimated volumes and value of the Company's oil and gas resources and the ability to finance future
development; and, the conversion of a portion of resources into reserves.
The information included in this presentation regarding estimated quantities of proved reserves in Chile,
Colombia, Brazil, and Peru as of December 31, 2017; are derived, in part, from the reports prepared by DeGolyer
and MacNaughton, or D&M, independent reserves engineers. Certified reserves refers to net reserves
independently evaluated by the petroleum consulting firm, D&M. Certain reserves data, such as those based on
the D&M report, were prepared under SEC standards, and certain other data were prepared under Petroleum
Resources Management System (PRMS) standards.
The information included in this presentation regarding estimated exploration resources in Chile, Brazil, and Peru
as of December 31, 2015, and in Colombia as of December 31, 2016; are derived, in part, from the reports
prepared by Gaffney, Cline & Associates, or GCA. The accuracy of any resource estimate is a function of the
quality of the available data and of engineering and geological interpretation. Results of drilling, testing and
production that postdate the preparation of the estimates may justify revisions, some or all of which may be
material. Accordingly, resource estimates are often different from the quantities of oil and gas that are ultimately
recovered, and the timing and cost of those volumes that are recovered may vary from that assumed.
Prospective Resources are those quantities of petroleum that are estimated, as of a given date, to be potentially
recoverable from undiscovered accumulations by application of future development projects. Prospective
Resources have both an associated “chance of discovery” and a “chance of development” (per PRMS).
Prospective Resources are further subdivided in accordance with the level of certainty associated with
recoverable estimates, assuming their discovery and development, and may be sub-classified based on project
maturity. There is no certainty that any portion of the Prospective Resources will be discovered. If discovered,
there is no certainty that it will be commercially viable to produce any portion of the resources. Prospective
Resource volumes are presented as unrisked. The risk or chance of finding a minimum hydrocarbon volume that
can flow to surface is presented as Geological Chance of Success (GCoS).
Certain data in this presentation was obtained from various external sources, and neither GeoPark nor its
affiliates, advisers or representatives has verified such data with independent sources. Accordingly, neither
GeoPark nor any of its affiliates, advisers or representatives makes any representations as to the accuracy or
completeness of that data, and such data involves risks and uncertainties and is subject to change based on
various factors.
This presentation contains a discussion of Adjusted EBITDA, which is not an IFRS measure. We define Adjusted
EBITDA as profit for the period before net finance cost, income tax, depreciation, amortization and certain non-
cash items such as impairments and write-offs of unsuccessful exploration and evaluation assets, accrual of stock
options and stock awards and bargain purchase gain on acquisition of subsidiaries. Adjusted EBITDA is included
in this presentation because it is a measure of our operating performance and our management believes that
Adjusted EBITDA is useful to investors because it is frequently used by securities analysts, investors and other
interested parties in their evaluation of the operating performance of companies in industries similar to ours.
Adjusted EBITDA should not be considered a substitute for financial information presented or prepared in
accordance with IFRS. Adjusted EBITDA, as determined and measured by us, should also not be compared to
similarly titled measures reported by other companies.
Rounding amounts and percentages: Certain amounts and percentages included in this document have been
rounded for ease of presentation. Percentage figures included in this document have not in all cases been
calculated on the basis of such rounded figures but on the basis of such amounts prior to rounding. For this
reason, certain percentage amounts in this document may vary from those obtained by performing the same
calculations using the figures in the financial statements. In addition, certain other amounts that appear in this
document may not sum due to rounding.
21

Santiago, Chile
Nuestra Señora de los Ángeles 179,
Las Condes, Santiago, Chile
Phone: +(56 2) 2242 9600
Email: [email protected]
James F. Park
Chief Executive Officer
Andrés Ocampo
Chief Financial Officer
Stacy Steimel
Shareholder Value Director
Company Directory
CONTACTS
