endogenous market formation: theory and evidence...
TRANSCRIPT
Endogenous Market Formation: Theory and Evidence
from Chilean College Admissions
Ricardo Espinoza∗ Soohyung Lee† Hector Lopez‡
March 20, 2017
Abstract
Policy makers around the world have adopted market-design-inspired centralized match-
ing systems for assigning students to public schools. However, the question of whether policy
intervention is necessary for such adoptions has been little studied. Examining a setting with
application costs and heterogeneity in college quality, we show that sizable application costs
and small heterogeneity in college quality may lead to voluntary transition to a centralized
matching system. Using the 2012 system change in Chile, we demonstrate the plausibility of
our theoretical setting and show that the enlarged pool of colleges in the centralized admission
is welfare-improving, particularly for those students facing high application costs.
Keywords: College Admissions, Market Design, Coordinated assignment, Centralized
Matching, Two-sided matching
JEL Codes: D47, I23, I30
∗Department of Economics University of Maryland, College Park. Email: [email protected]†Corresponding author: Department of Economics, Sogang University, MPRC, University of Maryland, Col-
lege Park, and IZA. Email: [email protected]‡Department of Economics, University of Maryland, College Park. Email: [email protected]
1 Introduction
Over the past two decades, lessons from market design have been actively adopted in organizing
real-world markets, including goods auctions, labor markets, and organ allocation. Student-
school matching markets have shown perhaps the most dramatic changes due to market design.
Starting with New York City’s public school assignment, numerous cities across America and
around the world have adopted market-design inspired centralized assignment schemes in assign-
ing children to public schools.1 The benefits of adopting such centralized assignment schemes
are well recognized among researchers and practitioners: these schemes produce efficient and
fair assignment of students, a feature enjoyed by school officials, families and schools alike.
However, such transitions to centralized assignment schemes have been the product of policy
intervention by local authorities and not the initiative of market participants. Furthermore, a
sizable number of schools, such as charter or private schools in the US, have decided not to
participate in these centralized assignment schemes.
The necessity of policy intervention is well grounded in theory, as formation of a central-
ized market faces two challenges. First, some participants might prefer an inefficient market
institution in which they can exploit a market failure. Second, others might be better off ex-
ploiting their market power after the centralized market has been formed. These two problems
are accentuated in markets in which the gains from moving to an efficient market structure
cannot be freely distributed among participants.2
Despite the challenges, there is evidence that some centralized markets are organized and
maintained by market participants.3 Thus, studying the conditions under which such formation
is possible is of major importance. This paper makes progress in this direction by presenting1More than 15 cities across America use (or are in the process of adopting) a version of the deferred acceptance
algorithm. The theoretical challenges of these implementations are well documented in several papers, forexample: Abdulkadiroğlu and Sonmez (2003); Abdulkadiroğlu et al. (2005a,b, 2015); Abdulkadiroglu et al.(2011).
2Starting with Roth’s contributions (Roth, 1982, 1984a; Roth and Xing, 1994), it has been recognized thatforming and staying in a centralized stable clearing house might or might not be a Nash equilibrium. In particular,agents with multiunit demand might find it profitable not to participate and to transact earlier or later (seeEkmekci and Yenmez, 2003) than the centralized market.
3The most famous examples are markets for new physicians in the United States and the United Kingdom,as documented by Roth and Xing (1994); Roth (1984b, 1991); Roth and Eranson (1999)
1

a theoretical setting in which agents voluntary adopt a transition to a centralized market and
supporting empirical evidence.
In our setting, the key mechanism facilitating the transition is the close competition
among agents and moderate level of costs in the process of matching. This mechanism can
explain the voluntary adoption and maintenance of a centralized market and its expansion when
new participants enter into the market. The intuition is straightforward. Consider a simple case
of student-school matching in which there are only two schools. When two market participants
are similar, the inefficiencies created by decentralization are equally distributed between the
two; thus, the two participants equally enjoy the gains of centralization by expanding the pool
of applicants and reducing the number of vacant seats. We investigate this market force and
its consequences in the context of college admissions in Chile.
The Chilean college admission process has experienced a transition to a (more) central-
ized system twice since 1960. The first episode of centralization occurred when all non-technical
colleges, a total of 8 at that time, adopted a centralized admission system based on the Gale-
Shapley mechanism. These colleges branched out into 25 colleges, often referred to as CRUCH,
and ran a centralized admission system until 2012, when they decided to invite other colleges to
join the centralized system. In 1960, the share of admissions processed in the centralized assign-
ment scheme was 100 percent; however, by 2010, this share dropped to 50 as new colleges and
(bigger cohorts of) students entered the market. In 2012, the original CRUCH colleges decided
to invite other colleges to join the centralized admission system. Eight of the non-CRUCH
universities accepted the invitation, leading to an increase in coordinated college admissions
from 50 to 70 percent in 2012. The colleges that accepted the invitation are roughly equivalent,
in terms of quality and prestige, to the original CRUCH colleges.
The purpose of this paper is threefold. First, we provide a theoretical model that ac-
counts for the adoption, maintenance, and expansion of a centralized admission system. The
model shows that close competition by colleges, when application costs exist, is crucial for the
adoption of a centralized system by market participants. Second, we empirically demonstrate
the relevance of this market force using micro-level administration data from Chile. We show
2

that those colleges that accepted the invitation were in fact those that had closely competed
with the original CRUCH colleges. Third, we study how centralization affected students’ wel-
fare and show that low-income students benefited the most from the change. That is, in Chile,
the centralization simplified application procedures and also reduced the monetary costs associ-
ated with applications, which may be particularly useful to students from a low socioeconomic
background.
In our model, there is a continuum of students and two colleges (C1 and C2). Students
are assumed heterogeneous in terms of preference over the colleges, test scores, and resources
to cover application costs. Preferences regarding the two colleges are stochastic. Based on
the proportion of students that find C1 better than C2, we measure the college quality of C1
relative to C2. For example, if that proportion is one half, the two colleges are considered of
equal quality. Regarding resources, there are two types of students; when the two colleges run
decentralized admission processes, one type of student can afford to pay the applications costs
of the two colleges, while the other type can afford only one college application. When the two
colleges adopt a centralized admission, both types of students can apply to the two colleges
with only one application cost.
Colleges admit students based only on their test scores, and their utility is captured by
the sum of the number of enrollees weighted by their test scores. Participating in the cen-
tralized assignment system enlarges a college’s pool of applicants because a student’s marginal
application cost is zero conditional on applying to at least one college in the centralized system.
When admissions are decentralized, students face a portfolio problem, and many find it
in their best interest to apply to more than one college. If admitted, this strategy ensures that
they can enroll in their favorite college. This strategy is costly and not all students can afford
it. While some students are admitted to none, others are admitted to multiple colleges, creating
inefficiency.
Under a centralized admission that produces optimal, stable matching, students are
admitted to at most one college and no seats are left empty, provided that someone applied
for them. Colleges might find it optimal to join or not to join a centralized admission system.
3

When colleges run a centralized system, the applicant pool is the largest. This enlarged pool
may benefit a college by increasing the number of enrollees and/or enrollees with higher test
scores. However, this benefit might be offset if the college loses applicants to competing colleges
of higher quality. This loss especially affects colleges that are able to enroll high-scoring students
who cannot afford to apply to many colleges in the decentralized system.
In our model, when colleges are of equal quality, the benefit of participation outweighs
the cost, while the opposite takes is true if the heterogeneity is sufficiently large. From students’
point of view, the wider coverage of the centralized admission may improve some students’ wel-
fare by enabling them to gain admissions to a higher quality college and pay a lower application
cost. This result implies that the benefit from the centralized admission may be especially im-
portant for students of low-income backgrounds who cannot afford multiple application fees and
students who are crowded out of admissions by high-ranking students who can afford multiple
applications.
The empirical analysis in this paper shows the relevance of our model assumptions and
tests the model predictions using Chilean administrative data. Our primary data sources are
application and enrollment data provided by Chile’s Ministry of Education and other national
agencies. From 2010 to 2013, we obtain detailed information on college applicants such as their
test score, the list of colleges and majors they applied to, socioeconomic background, and actual
enrollment. Our sample includes two years of college admissions prior to the 2012 change and
two years after the change. Therefore, comparing the pre- and post- period outcomes allows us
to examine the changes in student and college’s outcomes. Consistent with our model, the 8
colleges that decided to join the centralized admission are very similar to CRUCH universities
in terms of average test scores and student enrollment, relative to the universities that rejected
the offer. After the 2012 change, both CRUCH and the 8 non-CRUCH universities showed
an increase in the sum of enrollees’ test scores, with comparable magnitude. Note that we
find no systematic changes in tuition imposed by colleges coinciding with the 2012 change.
As for students, we find that, compared to the 2012 change, students, particularly those of
low economic status, are more likely to enroll in the 8 non-CRUCH universities relative to
4

CRUCH. As for student welfare analysis, we measure the quality of a student’s major within
the college (namely option) with the ranking based on the average test scores among enrollees
from 2007 to 2009. We find that, after the 2012 change, students are on average able to choose
a more prestigious major option and such a benefit is particularly large for students of low
socioeconomic status.
Our findings suggest that [[add more here]]
The remainder of our paper proceeds as follows: Section 2 presents the set of literature
closely related to this paper and our contribution to it. In Section 3, we describe the institu-
tional background, explaining changes in the Chilean college admission setting. In Section 4,
we present a theoretical model accounting for the Chilean setting and changes. Section 5 dis-
cusses our data, sample and empirical approach, and in Section 6, we present empirical results
testing model assumptions and implications, including the impact of widened coverage of the
coordinated assignment on student-college sorting. Section 7 discusses the sensitivity of our
analyses and implications, and Section 8 concludes.
2 Related Literature
This study contributes to the market design literature on student school assignment by ex-
amining the voluntary adoption of coordinated assignment depending on market conditions.
While this literature mainly focuses on the adoption of coordinated assignment driven by the
state, we present the conditions under which market participants may voluntarily participate
in coordinated assignment. Among the studies in this literature, our paper is closely related to
the following papers. One is the study by Ekmekci and Yenmez (2003), who examine a school’s
incentive to participate in coordinated assignment, similar to our setting. However, they study
one school’s incentive to join a coordinated assignment system formed by the rest of schools in
the market. They conclude that the “last” school to join the system has no incentive to do so
and hence there is no equilibrium in which all schools join the centralized system. In contrast,
we present a model in which all schools join the centralized system in an equilibrium. The dif-
5
ference in our conclusions is consistent with our different settings. Ekmekci and Yenmez study
a setting in which a school can postpone its admission process until all the rest have finished
admitting students and then go after students who have already been admitted by other schools.
In our setting, admission processes run at the same time, even when schools are not part of a
centralized system. The other closely related paper is Abdulkadiroğlu et al. (2015), in that they
empirically measure the impact of the adoption of coordinated assignment on student-school
sorting in the US. Like their paper, our study presents empirical evidence reporting the changes
in student-school sorting due to the expansion of the coordinated assignment, but in the context
of the Chilean college admission setting. Our welfare metric is substantially different. Abdulka-
diroğlu et al. (2015) use distance from schools as a welfare metric. We use the weighted sum of
the score of enrolled students as the metric for colleges, and the probability of being admitted
by a better school as the metric for students.
[[add haifir’s paper, and Che/Koh here]]
Among the market design literature, our paper is also connected to the studies examining
unraveling.
Besides the market design literature, our paper is related to a growing number of applied
microeconomics studies using the Chilean college admission setting. Examples include Beyer et
al. (2015); Bordon and Fu (2015); Hastings et al. (2013); Espinoza and Urzúa (2015); Lafortune
et al. (2016); Kaufmann et al. (2013); Rau et al. (2013); Rodríguez et al. (2016); Turner et al.
(2014). Most of these studies exploit the Chilean coordinated assignment setting to construct
counterfactuals of student outcomes by comparing those whose test scores were just above the
cutoff point for admissions with those whose test scores were just below the cutoff. To the
best of our knowledge, this paper is the first to examine both coordinated and uncoordinated
assignment in the Chilean college admission setting and to empirically examine the impact of
the 2012 expansion of the coordinated assignment on both college and students’ outcomes.
[[add: paper on the Chilien college admissions: I. Rios, T. Larroucau, G. Parra and R.
Cominetti. College Admissions Problem with Ties and Flexible Quotas. Working paper, 2014.]]
6
3 Institutional Background
3.1 Universities
Chilean universities are classified into two groups: CRUCH (Consejo de Rectores de las Univer-
sidades Chilenas) and the rest (herein, non-CRUCH).4 The CRUCH universities, a total of 25,
have a long history and prestige in Chile similar to Ivy League colleges in the US. They coordi-
nate student selection, which will be described in detail in Section 2.2. In contrast, non-CRUCH
universities, a total of 34 as of 2013, are relatively new, mostly established in between 1988 and
1990. This difference in the year of establishment is due to the fact that the Chilean government
had strictly restricted the establishment of new universities but relaxed the restriction in 1988.5
3.2 College Admission System: General
Each academic year, universities publicly announce the number of vacancies for every major
program they offer and how they evaluate applicants. The Chilean universities in our study
evaluate students based almost entirely on a student’s academic performance on a nationwide
test called the Prueba de Selección Universitaria (PSU), which is typically conducted at the
beginning of December. The PSU consists of 4 subjects: math, language, science, and social
sciences, and the weight that each program puts on each subject varies program by program.
The test score for each subject is standardized to have a mean of 500 and a standard deviation
of 110. The PSU score is released in mid to late December and, with their PSU score, students
apply to colleges.4In Chile, three types of institutions provide tertiary education: universities (Universidades), Professional
Institutes (PI, Institutos Profesionales), and Technical Training Centers (TTC, Centros de Formación Técnica).We study student-college matching only for the case of universities because PIs and TSCs are designed fortechnical or vocational training, and they accept virtually all applicants regardless of their academic performance.Throughout this document, we use “university” to refer only to Universidades, not to PI or TTC.
5Prior to 1981, the Chilean government strictly restricted the establishment of universities. Although thelegal change in 1981 relaxed this restriction, establishing a university was still difficult until 1988. This is becausethe Chilean government had substantial discretion regarding whom it would allow to establish a university. Forthis reason, only 5 universities were established between 1981 and 1987. However, from 1988, the Chileangovernment allowed an entity to establish a university as long as it satisfied pre-determined requirements. Thisrelaxation sparked new universities. For example, between 1988 and 1990, 35 universities were established. Someuniversities have been established or have closed since 1990. As of 2013, there were 34 non-CRUCH universities;all except one were established by 1990. The only non-CRUCH university was established in 2012, and weexclude it from our analysis.
7
The coalition of CRUCH universities accepts college applications by early January and
announces the results within 2 or 3 weeks. The admission procedure is based on a centralized
matching system as follows: until 2011, a student needed to submit his/her preference by
ranking up to 8 options, that is, 8 unique combinations of university and college major; since
2012, it has been 10 options. Once the student’s rank orders are collected, the board runs
the student-proposed deferred and acceptance (DA) algorithm and notifies the student of the
results approximately 2 to 3 weeks later.
In contrast, the admission process of the non-CRUCH universities is such that a student’s
chance of being admitted depends not only on his/her PSU score but also on when he/she
applies. Specifically, a non-CRUCH university announces the number of vacancies and the
minimum PSU score in each major it offers before the application process takes place. It starts
to accept applications the day after the PSU score is released. To apply, except for a few
universities, students and their representatives (e.g., parents, siblings) need to physically visit
a university’s admissions office. When a student meets with a college admissions officer, the
officer informs the student whether he/she can get an admission for a particular major on the
spot. If the student is not accepted for that major, he/she can apply for another major right
away.
An applicant to such a college will be accepted as long as the following three conditions
are satisfied. First, the applicant’s PSU must be above the minimum score the university
specified for the applicant’s chosen major. Second, the number of accepted applicants for that
specific major must be fewer than the number of vacancies in that program, as set by the
university. Third, the applicant must show financial proof that he/she can afford tuition and
must pay a deposit to secure a space, amounting to about 28% of the average household income
in Chile as of 2013.6 Because the second condition constitutes a type of first-come, first-served
rule, it creates an incentive for applicants to enroll as soon as possible once the PSU scores are
announced. The photos in Appendix 1 and 2 illustrate how chaotic the decentralized application6The amount of the deposit can vary not only by university but also by major. For example, the deposit for
Medicine at Universidad del Desarrollo was 125% of the average household income in 2013.
8

process can be. Numerous individuals line up in front of a university the night before the day the
university accepts applications (this is typically the same day that the PSU score is released),
and they submit their applications in a first-come, first-served fashion.7
If the applicant decides not to enroll in the major, he/she must notify the university
within 10 days of the date that the CRUCH admission results are publicly announced. Article
3 in the Consumer Protection Act, grants universities the right to retain an amount equivalent
to 1% of total annual tuition fees. The amount of the deposit varies across universities and
majors but is generally 10% of total annual tuition fees. That is, if an applicant decides not to
enroll, the university keeps roughly 10% of the deposit and reimburses the rest within 10 days
from when the student notified the university of his/her decision.
3.3 College Admission System: The change in 2012
Prior to the 2012 college admission cycle, the centralized matching system was only for CRUCH
universities because centralized matching was the result of voluntary coordination among the
CRUCH universities. On April 29, 2011, the association of the CRUCH universities announced
that they would invite all non-CRUCH universities to join the centralized matching system.
The deadline for responding to the invitation was May 25, 2011. Eight non-CRUCH universities
accepted the invitation and became a part of the centralized matching system starting with the
2012 college admission cycle.8 The rest of the non-CRUCH universities remained outside the
centralized matching system.7Typically, PSU scores are announced on a Sunday at midnight and students start enrolling in non-CRUCH
universities at 6:00 or 7:00 am the following Monday in order to secure a slot. In the most highly demandeduniversities, the situation is chaotic. Crowds of people congregate at the admissions office at dawn and othersspend the night waiting for the office to open.
8Universidad Adolfo Ibañez, Universidad de los Andes, Universidad del Desarrollo, Universidad Andrés Bello,Universidad Alberto Hurtado, Universidad Diego Portales, Universidad Finnis Terrae, Universidad Mayor.
9

4 Theoretical Analysis
4.1 Setting
We consider an environment in which there are two groups of colleges. The centralized colleges
jointly admit students using the student-proposing Gale-Shapley algorithm from a common
pool of applications. The decentralized colleges admit students independently. We assume that
students face uncertainty in the application process. In particular, after submitting their pref-
erences to the centralized group, students do not know if the assigned college in the centralized
system will be better or worse than their best achievable option in the decentralized group. This
uncertainty provides incentives for some students to apply to both groups. A student admitted
to one college in each group can select his favorite one. This strategy, however, has two social
costs. First, some students will not be admitted to a college that otherwise would admit them.
Second, some colleges will be left with vacant seats. This section shows that these two effects
can incentivize both groups of colleges to form a unique centralized admission system.
We model this environment with only two colleges, C1 and C2. In this model, C1 repre-
sents the centralized group of colleges and C2 represents the decentralized group. Although C1
and C2 are single colleges in the model, the students uncertainty model is used to ensure that
C1 represents a group of colleges using the student-proposing Gale-Shapley algorithm and C2
represents a group of colleges running independent admission processes. We compare the out-
comes of C1 and C2 running independent admission systems and a joint admission system. We
study the conditions under which both C1 and C2 have incentives to use the student-proposing
Gale-Shapley algorithm from a common pool of applications.
In the general situation, when the centralized colleges and the decentralized colleges run
their admission systems independently, students applying to the centralized group use their
(weakly) dominant strategy and submit their true preferences. At the same time, they can use
their expected assigned college to determine if it is profitable to apply to a specific college in the
decentralized group. Before enrollment, the assignment in the centralized group is revealed and
the student can choose between the assigned college in the centralized group and the chosen
10

college in the decentralized group. When C1 and C2 are modeled as a single college, these
features are introduced by assuming that students’ preferences are drawn after applying but
before enrolling.
In the case of a joint admission system that uses the student-proposing Gale-Shapley
algorithm, students use their (weakly) dominant strategy and submit their true preferences for
all colleges. When C1 and C2 are modeled as a single college, this feature is introduced by
assuming that the students’ preferences are drawn before applying.
There is a unit-mass continuum of students. Students take a national exam before the
admission process and each student knows his score s before applying. Scores follow a contin-
uously differentiable and strictly increasing cumulative distribution function F with density f
with full support over the interval [s, s], F (s) is the mass of students with score less than or
equal to s. We identify students by their score, so student s has a score of s. Students pref-
erences are stochastic. Independent of test scores or other students’ preferences, each student
prefers college C1 to C2 with probability p 2 [0, 1/2]. For all students, their most preferred
college provides a utility of u1, strictly greater than the utility of their second choice u2. That
is, p portion of students have utilities u1 for C1 and u2 for C2, and the rest u2 for C1 and u1
for C2. Being unassigned has a value of zero.
Colleges admit the best ranked students who applied, up to their quota. Thus, students
with sufficiently high test cores can enroll in their most preferred colleges with certainty. Without
loss of generality, we omit such students from our analysis and define a quota in each college as
the remaining number of seats after netting out those students. We assume that Ci can enroll
up to qi students and the sum of the two is less than the student mess (i.e., q1 + q2 < 1). Thus,
there is always a mass of students who cannot get enrolled in any college. Applying to C1 is free
and accessible to everyone, but applying to C2 has an application cost of k and not everyone can
apply due to the cost. The proportion of students who can cover this cost, the wealthy students,
is n. Since applying to C1 has no cost, we assume that every student applies to C1. Colleges
value the quality and quantity of the students they admit. In particular, colleges derive utility
of u(E) = sE xf(x)dx from enrolling the set of students E.
11
Colleges C1 and C2 decide simultaneously whether or not to form a centralized admission
system that uses the student-proposing Gale-Shapley algorithm. The cost of organizing the
centralized admission system is M � 0 for each college.
In our setting, the Gale-Shapley algorithm generates student optimal matching - that is,
based on their test scores, students choose their most favorite college among those with available
seats. Let si be the admission cutoff score for college Ci. Based on the Chilean setting, we focus
on equilibrium outcomes satisfying s2 � s1. This order obtains if the proportion of wealthy
students is sufficiently big relative to the ratio of college quotas. Hence we assume that there
are enough wealthy students i.e., q2q1
n.
An enrollment outcome is a triple of pair-wise disjoint sets E = (E0, E1, E2), where Ei
for i = 1, 2 is the set of students enrolled at college Ci and E0 is the set of students who
were not admitted to any college. The enrollment of student s is denoted by Es 2 {;, C1, C2}.
The enrollment outcome (E0, E1, E2) is efficient if there is no enrollment outcome E0 such that
us(Es) us(E0s) for all s and u(Ei) u(E0
i) for i = 1, 2 with strict inequality for at least one
college or a positive mass of students. Hector, my friend asked “Does it have to be a positive
mass? A more tight condition, any student, seems to work in the same way." I do not follow
his comment. Do you?
4.2 Market Structure
4.2.1 Descentralized enrollment outcomes
This section analyses enrollment outcomes when C1 and C2 run independent admission systems.
Let s2 � s1 be the cutoff scores of each college. Given these cutoff scores, students decide to
apply to colleges. Application decisions are as follows. All students with score s � s1 apply to
college C1. Applying to both C1 and C2 gives students the possibility of choosing their most
preferred colleges among those that admitted them, but has a cost of k. A student with score
s � s2 applies to both C1 and C2 if u1 � up+k, where up = u1p+(1�p)u2. It is assumed that
k satisfies the inequality. Applying only to C2 is dominated by applying to both. A student
12

who gets admitted to both C1 and C2 gets a utility of u1�k; a student who gets admitted only
to C1 gets an expected utility of up.
The equilibrium cutoff scores sD1 , sD2 are defined by the following two equations:
1� F (sD1 ) = q1 (1)
n(1� F (sD2 )) = q2 (2)
Preference uncertainty is resolved after applying but before enrollment. Students who got
admitted to more than one college have the option to enroll in their most preferred college,
leaving a seat vacant at the least preferred college. Total enrollment in C1 is given by three
groups of students: i) the students who could have been admitted to C2 but did not have the
resources to apply, ii) those who applied and were admitted to both C1 and C2 but preferred
C1, and iii) those who got admitted only to C1. Enrollment in C2 is given by the students who
have the resources, applied, got admitted to C2, and prefer C2 over C1. We use EDi to denote
the mass of students enrolled in college i when they use a decentralized admission system.
Enrollment masses are as follows:
ED1 = (1� n)(1� F (sD2 )) + np(1� F (sD2 )) + F (sD2 )� F (sD1 ) (3)
ED2 = n(1� p)(1� F (sD2 )) (4)
The basic consequences of the decentralized admission system on enrollment are sum-
marized in the following proposition.
Proposition 1. In the decentralized admission system, total enrollment is q1 and there are q2
students that would like to be enrolled in either college and that would be admitted, but did not
get a seat in the admission process.
Proof. Direct addition of equations (3) and (4) reveal that total enrollment is equal to q1. Since
being unassigned has a value of zero, every student would like to being admitted to a college.
13

At the moment of enrollment, college C1 finds out that (1 � p)q2 admitted students did not
enroll. Similarly, C2 discovers that pq2 admitted students did not enroll. Hence, there are q2
students that would be admitted after enrollment decisions have been made.
We call inefficient assignments those admissions given to students that later do not enroll,
(1 � p)q2 for C1 and pq2 for C2. Colleges’ and students’ (ex-post) welfare follow directly from
the enrollment equations. We measure colleges’ utility by the number of admitted students,
weighted by their score. This metric takes into account both the quantity and quality of enrolled
students. Students’ welfare is measure by the utility they obtain from enrolling in a particular
college. uD1 , uD2 represent C1 and C2 payoffs, respectively. uDn , uD1�n represent aggregate students
welfare for the wealthy and non-wealthy students, respectively.
uD1 = (1� n+ np)
Z 1
sD2
xf(x)dx+
Z sD2
sD1
xf(x)dx (5)
uD2 = n(1� p)
Z 1
sD2
xf(x)dx (6)
uDn = n(1� F (sD2 ))u1 + n(F (sD2 )� F (sD1 ))up (7)
uD1�n = (1� n)(1� F (sD2 ))up + (1� n)(F (sD2 )� F (sD1 ))up (8)
4.2.2 Centralized enrollment outcomes
This section analyses the outcomes of a centralized admission system, the student-proposing
Gale-Shapley algorithm. Let s2 � s1 be the cutoff scores of each college. Applying to the
centralized system is denoted as applying to C and has no cost. In the centralized admission
process, students can send their college preferences and apply to both C1 and C2 in order of
preference. In this section, it is assumed that the preference uncertainty is resolved before
applying; thus, the preferences list reflects true ex-post preferences. Application behavior is as
follows.
All students with score s � s1 apply to college C by sending their preference ranking
14

over C1 and C2. In the centralized system, admission and enrollment coincide; thus the mass of
students enrolled in each college and the cutoff scores are defined by the same equations. The
equilibrium cutoff scores sC1 , sC2 and enrollment masses EC
1 , EC2 are defined by:
EC1 = p(1� F (sC2 )) + F (sC2 )� F (sC1 ) = q1 (9)
EC2 = (1� p)(1� F (sC2 )) = q2 (10)
The left hand side of these equations describes enrollment. Total enrollment in C1 is
given by the students who i) could have been admitted to C2 but preferred C1 and ii) those who
got admitted only to C1. Enrollment in C2 is given by the students who got admitted to C2.
The allocation of students to colleges is efficient. Colleges’ and students’ aggregated payoffs are
as follows:
uC1 = p
Z 1
sC2
xf(x)dx+
Z sC2
sC1
xf(x)dx (11)
uC2 = (1� p)
Z 1
sC2
xf(x)dx (12)
uCn = n(1� F (sC2 ))u1 + n(F (sC2 )� F (sC1 ))up (13)
uC1�n = (1� n)(1� F (sC2 ))u1 + (1� n)(F (sC2 )� F (sC1 ))up (14)
Proposition 2. The centralized admission system produces an efficient enrollment outcome.
Proof. Let E be the outcome of the centralized admission system and suppose E0 is another
enrollment outcome that Pareto dominates E. Hence there is a mass of students that have a
different enrollment in E than in E0. Consider this to be the case for E01 \ E1; other cases are
analogous. This group of students strictly prefer C1 over their assignment in E. Hence they
were rejected by C1 during the admission process. It follows that all of these students have
strictly lower scores than students E01 \ E1. In addition, E0
1 \ E1 mass is at most the mass of
E01 \ E1. (Hector, is there any typo here? However, u(E0
1) � u(E01), a contradiction.
15
4.3 Equilibrium analysis
The existence of efficiency gains with the adoption of a centralized admission system seems to
suggest that colleges, in general, will have a natural tendency to be centralized. However, this is
not the case. In fact, just the opposite is true. A lot of admission systems are run independently
and sometimes centralization occurs after there is intervention by a policy maker. In this section
we study when colleges have incentives to join a centralized admission system.
Motivated by the Chilean setting, we introduce the two additional assumptions into our
equilibrium analysis. In Chile, there are CRUCH colleges that are very desirable for their
quality; hence, there are wealthy students that prefer to apply to and enroll in those colleges.
In this model, CRUCH colleges are represented by C1. Thus we assume that C1 is of sufficient
quality to attract wealthy students, i.e., 1� n p. Another feature of the Chilean setting that
we include in our analysis is shown in Panel A of Figure 3.The cutoff scores of Type 2 colleges
decreased after they joined the centralized system, but not to the level of CRUCH cutoffs before
centralization. Hence we assume that C2 is also of sufficient quality i.e., q2q1
1� p.
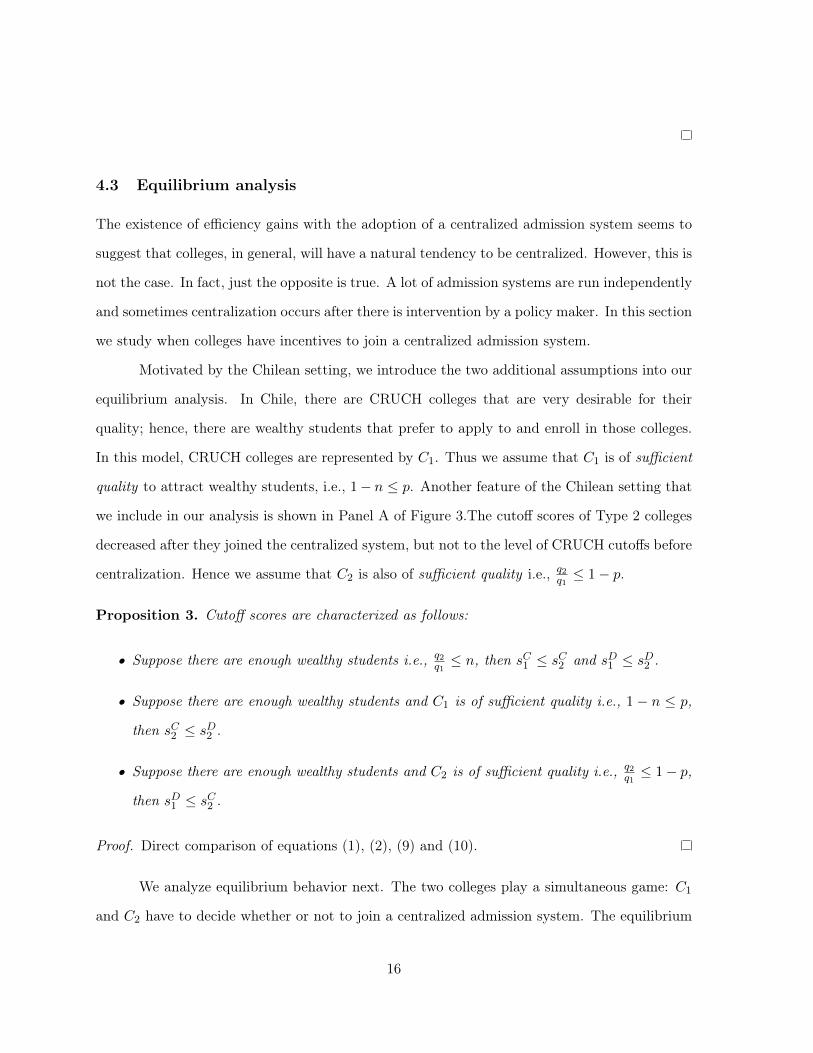
Proposition 3. Cutoff scores are characterized as follows:
• Suppose there are enough wealthy students i.e., q2q1
n, then sC1 sC2 and sD1 sD2 .
• Suppose there are enough wealthy students and C1 is of sufficient quality i.e., 1� n p,
then sC2 sD2 .
• Suppose there are enough wealthy students and C2 is of sufficient quality i.e., q2q1
1� p,
then sD1 sC2 .
Proof. Direct comparison of equations (1), (2), (9) and (10).
We analyze equilibrium behavior next. The two colleges play a simultaneous game: C1
and C2 have to decide whether or not to join a centralized admission system. The equilibrium
16
of this game depends on p, the proportion of students that prefer C1. When p is large (close to
1/2), it is common knowledge that students regard C1 and C2 as having the same quality (we
assume that preferences are derived from quality) since half of the population prefers one to the
other. In this case, inefficient assignments are equally distributed and efficiency gains equally
captured; hence, both C1 and C2 have an incentive to join a centralized admission system.
When p is small (close to 0), C2 suffers little inefficiency (the inefficiencies suffered by C1 are
the greatest), and joining a centralized matching does not allows C2 to capture any efficiency
gain; hence, C2 would not join the centralized system.
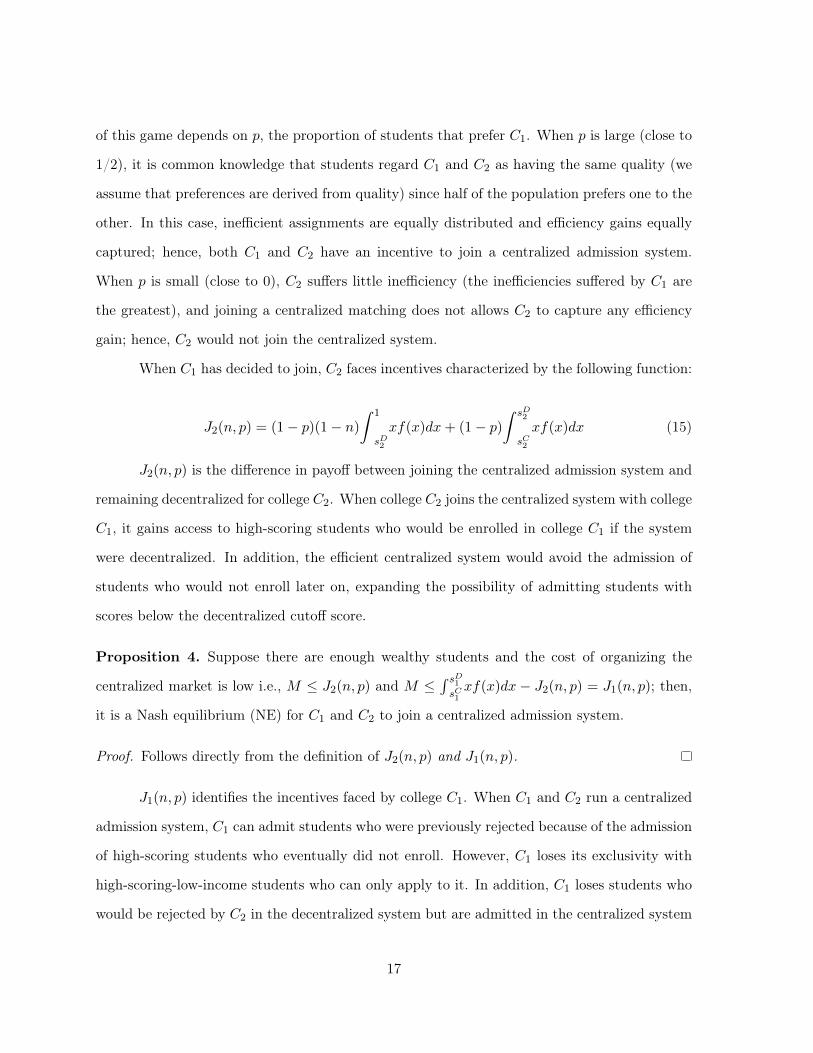
When C1 has decided to join, C2 faces incentives characterized by the following function:
J2(n, p) = (1� p)(1� n)
Z 1
sD2
xf(x)dx+ (1� p)
Z sD2
sC2
xf(x)dx (15)
J2(n, p) is the difference in payoff between joining the centralized admission system and
remaining decentralized for college C2. When college C2 joins the centralized system with college
C1, it gains access to high-scoring students who would be enrolled in college C1 if the system
were decentralized. In addition, the efficient centralized system would avoid the admission of
students who would not enroll later on, expanding the possibility of admitting students with
scores below the decentralized cutoff score.
Proposition 4. Suppose there are enough wealthy students and the cost of organizing the
centralized market is low i.e., M J2(n, p) and M R sD1sC1
xf(x)dx � J2(n, p) = J1(n, p); then,
it is a Nash equilibrium (NE) for C1 and C2 to join a centralized admission system.
Proof. Follows directly from the definition of J2(n, p) and J1(n, p).
J1(n, p) identifies the incentives faced by college C1. When C1 and C2 run a centralized
admission system, C1 can admit students who were previously rejected because of the admission
of high-scoring students who eventually did not enroll. However, C1 loses its exclusivity with
high-scoring-low-income students who can only apply to it. In addition, C1 loses students who
would be rejected by C2 in the decentralized system but are admitted in the centralized system
17

due to the more efficient process. We begin our equilibrium analysis with the symmetric case:
C1 and C2 are identical in all respects with the exception of p. In all cases, the cost of organizing
the centralized system needs to be below certain threshold i.e., a high cost of organizing the
market could prevent the centralization even if, absent the cost, both colleges would like to join
the centralized admission system. In this case, the threshold is half the total college utility to
be gained i.e., 12
R 1�q1�2q F
�1(t)dt.
Proposition 5. Suppose both colleges C1 and C2 are identical in all respects but their prob-
ability of being preferred, i.e., every student can afford both types of colleges n = 1 and both
have the same quotas q1 = q2 = q. Suppose the cost of organizing a centralized admission
system is less than 12
R 1�q1�2q F
�1(t)dt. Then there are two types of equilibria:
• If M < min{J1(1, p) : p 2 [0, 12 ]}, then there is p⇤ such that for all p 2 [p⇤, 12 ] C1 and C2
organizing a centralized admission system is a Nash equilibrium (type 1).
• If M � min{J1(1, p) : p 2 [0, 12 ]}, then there are p1, p2 and p3 such that for all p 2
[p1, p2][ [p3, 12 ] C1 and C2 organizing a centralized admission system is a Nash equilibrium
(type 2).
Proof. The first and second derivatives of J2 with respect to p are as follows, respectively:@J2(1,p)
@p = F�1(1 � q1�p)
q1�p �
R 1�q1� q
1�pF�1(t)dt and @2J2(1,p)
@p2 = �q(1�p)3f(F�1(1� q
1�p ))< 0. Direct
evaluation reveals that J2(1,12) = J1(1,0)
2 and @J2(1,0)@p > 0. If M < min{J1(1, p) : p 2 [0, 12 ]},
then C1 would like to join a centralized admission system with C2 for all p. If @J2(1,12 )
@p � 0; then
J2(1, p) is a continuous and strictly increasing function in the interval [0, 12 ]; thus, there is p⇤ such
that M = J2(1, p⇤) and J2(1, p) � M for all p � p⇤. If @J2(1,12 )
@p < 0, then there is p⇤⇤ 2 (0, 12) such
that @J2(1,p⇤⇤)@p = 0. J2(1, p) is a strictly increasing function in the interval [0, p⇤⇤]; thus, there is
p1 such that M = J2(1, p1) and J2(1, p) � M for all p � p1. If M � min{J1(1, p) : p 2 [0, 12 ]},
then necessarily J1(1, p) is a strictly decreasing function in the interval [0, p⇤⇤] and strictly
increasing in the interval [p⇤⇤, 12 ]; thus, there are p2 and p3 such that M = J1(1, p2) = J1(1, p3)
such that J1(1, p) � M for all p p2 and for all p � p3.
18

Both equilibria confirm the basic intuition. When colleges are of equal quality, half
the population likes one better than the other; then inefficient matches are evenly distributed
in the decentralized system, and the efficiency gains created by the adoption of a centralized
admission system are equally captured. Equilibrium type 1 confirms the converse intuition:
when p is small, then C1 would benefit a lot from running a centralized admission system; C2,
however, gains little since it suffers little inefficiency as most admitted students actually enroll.
Equilibrium type 2 also confirms the basic intuition: when p is close to 12 but it also displays
centralization for an interior region. In this region, C1 faces similar incentives as in equilibrium
type 1, but now C2 also benefits from joining because the students who are enrolled in the
centralized admission system have a high score.
When not all students are wealthy, n < 1, a new kind of equilibrium arises. If the cost
of centralization is low enough, equilibrium type 1 prevails. However, if the cost of running a
centralized system is high, then C1 might find it in its best interest not to invite C2 to join
because that would imply losing good students who are accessible only to C1.
Proposition 6. Suppose that there are enough wealthy students, n < 1, M < 12
R 1�q11�q1�q2
F�1(t)dt
and n > n’ such thatR 1�q11�q1�q2
F�1(t)dt = 2[R 11�q2
F�1(t)dt� n0R 11� q2
n0F�1(t)dt]; then the equi-
libria are as follows:
• If M < min{J1(1, p) : p 2 [0, 12 ]}, then there is p⇤ such that for all p 2 [p⇤, 12 ] C1 and C2
organizing a centralized admission system is a Nash equilibrium (type 1).
• If J1(1,12) � M � min{J1(1, p) : p 2 [0, 12 ]}, then there are p1, p2, p3 such that for
all p 2 [p1, p2] [ [p3, 12 ] C1 and C2 organizing a centralized admission system is a Nash
equilibrium (type 2).
• If M � J1(1,12), then there are p4, p5 such that for all p 2 [p4, p5] C1 and C2 organizing a
centralized admission system is a Nash equilibrium (type 3).
Proof. The assumption about n guarantees that J2(n, 0) < 12
R 1�q11�q1�q2
F�1(t)dt < J1(n, 0).
Direct computation shows that J1(n, 12) <12
R 1�q11�q1�q2
F�1(t)dt < J2(n,12). Since J2 is a concave
19

function (derivative given in proposition 4), there is p⇤ 2 (0, 1/2] such that J2 is a continuous
and strictly increasing function. Thus, there is p⇤⇤ 2 (0, p⇤) such that J2(n, p⇤⇤) = J1(n, p⇤⇤). If
M < min{J1(1, p) : p 2 [0, 12 ]}, then there is p⇤ such that for all p 2 [p⇤, 12 ] both J2(n, p) � M
and I(n, p) � M . If J1(1,12) � M � min{J1(1, p) : p 2 [0, 12 ]}, then there are p1, p2 and p3
defined by M = J2(n, p1)=J1(n, p2) = I(n, p3) such that p1 < p2 < p⇤ < p3. If M � J1(n, 1/2),
then there are p4, p5 such that for all p 2 [p4, p5] such that M = J2(n, p4) = J1(n, p5) and
p1 < p2 < p⇤.
We next analyze matches between students and colleges. High-income students will be
denoted as H students and low-income students as L students. Based on their test scores, we
classify students into 4 groups. Group 1 consists of students whose test score is higher than the
cutoff of type 2 colleges before type 2 colleges joined the centralized system (i.e., sD2 ). Group 2
consists of students whose test score is between sC2 and sD2 . Group 3 consists of students whose
test score is between sD1 and sC2 . Group 4 includes students whose test score is between sC1
and sD1 . We denote by Ig, students in income group I 2 H,L belonging to test score group
g 2 1, 2, 3, 4. The centralization of the college admission affects each group as follows:
• H1 – There is no change in matching quality for these students. Before type 2 joined
the centralized system, these students were able to enroll in their most favorite college by
using multiple applications. In the centralized system, their score is all they need to get
into their most favorite college.
• L1 – These students are matched to better colleges after type 2 colleges join the centralized
system. Only the fraction for whom a type 2 college is better obtains this benefit. Their
benefit comes directly from the lower application costs.
• H2 – These students are matched to better colleges after type 2 colleges join the centralized
system. Only the fraction for whom a type 2 college is better obtains this benefit. These
students benefit from the more efficient centralized system.
• L2 - These students are matched to better colleges after type 2 colleges join the centralized
20
system. Only the fraction for whom a type 2 college is better obtains this benefit. These
students benefit from the more efficient centralized system.
• H3 - There is no change in matching quality for these students. Their score is not high
enough to be admitted to type 2 colleges; hence, there are matches to CRUCH colleges
in both systems.
• L3 - There is no change in matching quality for these students. Their score is not high
enough to be admitted to type 2 colleges; hence, there are matches to CRUCH colleges
in both systems.
• H4 – These students get into a better college under the centralized system. Before cen-
tralization, these students were admitted by type 3 colleges and by CRUCH colleges after
the change.
• L4 – These students also get into a better college after the change, but the increase is
bigger than for H4 students, since they go from no-college to CRUCH colleges.
3.4 Application to the Chilean Setting and Testable Implications
We analyze the equilibrium characterization in the context of the Chilean setting. First,
we consider what may account for the fact that CRUCH universities formed a centralized
admission system in the first place. In our model, p, the share of students who prefer college
1 the most, is sufficiently close to ½; then C1 will invite the rest of schools and may form a
coalition. In the context of real college admission, we can view this condition as the one under
which college quality is sufficiently homogeneous across CRUCH universities. We will examine
this condition by comparing college quality in 1967, when the centralized admission system was
established. Second, we consider what may account for the fact that the CRUCH invited the
rest of the universities in 2012, more than a decade after the non-CRUCH universities were
established. In the context of the model, we can consider C1 as CRUCH as a whole, C2 as
the 8 non-CRUCH that joined the coordination, and the rest of the non-CRUCH as outside
options that are dominated by C1 and C2. When enough students prefer CRUCH universities
21

to other universities (i.e., sufficiently high p), there is little incentive to invite them since
there are only a small mass of students who would have been admitted to CRUCH but were
not. If the 8 non-CRUCH colleges increased in quality over time, students started to prefer
those over CRUCH colleges, implying p’s decrease. Therefore, eventually p reached a level at
which joining a centralized admission system was the best for both types of colleges. With
data, we will examine the extent to which college qualities are comparable between CRUCH
and non-CRUCH. The data will show that on average both CRUCH and the 8 non-CRUCH
should be better off after the 2012 change. Third, all else being equal, the 2012 change will
improve student welfare, much more so for the students of low socioeconomic status. In our
model, the centralized admission improves efficiency relative to the decentralized admission
because it eliminates offers that are not accepted by applicants and thus are not filled. This
prediction implies, in the Chilean context, that on average applicants can get admission to
a more prestigious option (i.e., a specific combination of college and major) due to the 2012
change. In our model, this positive effect on applicants is larger for those who could not
afford application costs of C2 because under the centralized admission, they can no longer pay
application costs. Relatedly, removing the application costs will increase the enrollment of those
students in C2.
4.3.1 Discussions
5 Data, Sample, and Empirical Strategy
In testing our model predictions, we use both qualitative and quantitative analyses depending
on data availability. Specifically, examining Prediction 1 requires historical information from
the 1960s, and we rely on existing studies for this analysis because there is no data source we
can access. In contrast, the rest of the predictions require recent information, which we can
directly test using the data below.
22

5.1 Data Source
We compile our sample for the 2007-2013 college admission cycles, based on administrative
datasets from three different sources: CNED (Consejo Nacional de Educacion), SIES (Servicio
de Información de Educación Superior), and DEMRE (Departamento de Evaluación, Medición
y Registro Educacional).9 The CNED provides major level information such as number of
faculty members, amenities a college offers, tuition, and expected duration of study. The SIES
provides university enrollee information. Specifically, we obtain information on students who
were freshmen at a university between 2007 and 2013. For each college enrollee, we observe
his/her PSU score, major and university, high school GPA, age, residential location, and type
of high school (private, private with voucher, or public).10 Finally, the DEMRE provides
information on the students’ application behaviors in terms of the universities participating in
the centralized matching. This information includes each applicant’s PSU score, socio-economic
characteristics, and, more importantly, the rank order of options.
5.2 Sample and Outcome Variables
We construct a dataset covering 55 universities, 25 CRUCH and 30 non-CRUCH, and all stu-
dents who enrolled at one of the universities between 2007 and 2013. The 4 non-CRUCH uni-
versities operating as of 2013 are omitted from our data.11 The reason is that one non-CRUCH
was established in 2012 and thus lacks information prior to the admission system change. As
for the remaining 3 non-CRUCH universities, one of which joined the centralized matching, the
SIES does not include the information on their enrollees.
Our outcomes of interest are quality of enrollees, for university-level analyses, and pres-9The SIES is compiled by the Chilean Ministry of Education. The DEMRE is an administrative body
within the Universidad de Chile that develops and administers the PSU and runs the centralized matchingsystem. CNED is an independent and autonomous public organization that licenses new universities and providesassistance to the Ministry of Education when implementing new educational policies.
10School types are highly correlated with students’ socioeconomic background. Wealthier students typicallyattend private schools without vouchers, and poorer students typically attend public schools (see Elacqua andSantos, 2013)
11The three non-CRUCH universities that lack enrollee information are Universidad Mayor (which joined thecentralized system), Universidad Gabriela Mistral, and Universidad los Leones. The university established in2012 is Universidad la Araucana.
23

tige of an option for which a student was able to enroll, for student-level analyses. For the
former, we characterize an enrollee’s quality as his/her PSU score, defined as the simple aver-
age between the scores in the math and language subjects. We use this measure do student
quality for two reasons. First, since the math and language subjects are mandatory the simple
average is a statistic that can be computed for all students. Second, since the weight that
each program puts on each of the four subject varies program by program, students can easily
be compared to each by looking at their math and language scores. Finally, this statistics is
widely used for official purposes. For example, the government grants a subsidy, called AFI, to
all institutions enrolling the top 27.500 PSU scores, and uses the average between math and
language to rank students.
A college’s utility is defined as the sum of enrollees’PSU scores. For the prestige of an
option, we construct a relative ranking of an option across all available options as follows. Across
the three-year period (2007 to 2009), we take the average of an option’s minimum PSU scores
(i.e., cutoffs) with which an applicant could get admission to the option in a given year. We
then sort options in ascending order and use the percentile into which an option falls (among
the distribution of the average cutoffs) as our measure of “prestige”. In our sample, we have on
average 1,467 unique options in a given academic year. The option whose prestige is 1 in our
prestige index ranked the lowest, while the option whose prestige is 100 ranked the highest. We
decide to use this statistic for student outcomes for two reasons. One reason is practicality. That
is, if we knew applicants’ preferences across options from CRUCH and non-CRUCH universities,
we could construct an alternative statistic based on the preference ranking. However, we can
infer students’ preferences only from applications through centralized matching (CRUCH and
some of non-CRUCH after the change). Therefore, for about 31.2% percent of options as of 2012
(i.e., share of type 3 options out of all options in 2012) we do not have relevant information,
making it difficult to analyze student outcomes. In Section 6.2, we will present our measure of
prestige and students’ preference rankings reported in the centralized matching. In sum, the
two are highly correlated, supporting the relevance of our prestige variable. The other reason
concerns labor market opportunities. Although our measure of prestige does not incorporate an
24

individual-specific preference over options, it may reflect average monetary returns from college
education either because students on average apply more to the well-paying options, pushing
the PSU scores of admitted students higher, and/or because, as the ranking is well correlated
with the average cognitive skills of admitted students, students may use it as signaling device
to get better labor market outcomes after college graduate.
Table 1 reports summary statistics for Chilean universities. In our sample period, 2010
to 2013, our dataset includes 25 CRUCH universities and 30 non-CRUCH universities (Panels
A and B, respectively). In general, the two groups of universities are comparable in terms
of the number of newly enrolled students and average PSU scores among enrollees. Although
CRUCH universities on average impose smaller tuition fees and offer more majors than non-
CRUCH, there exist sizable variations within each group, resulting from sufficient overlaps
in distribution of each characteristic. However, we observe noticeable differences in terms of
the share of students residing in metropolitan areas and the types of high schools enrollees
graduated from. Specifically, on average, 42 percent of enrollees in CRUCH universities resided
in the three most heavily populated regions (Metropolitan Region, V Region and VIII Region),
which are where the three largest metropolitan areas are located: Santiago, Valparaíso-Viña
del Mar and Concepción, respectively. This is roughly 30 percentage points lower compared to
average non-CRUCH universities. This difference may be driven by two factors: one is that
the most non-CRUCH universities are located in the metropolitan areas. The other is that to
apply to a non-CRUCH university, an applicant has to be physically present at the university,
implying that students residing in the metropolitan areas may find it easier to apply to one
compared to their counterparts who have to travel.
Regarding high schools, we classify high schools into three groups – private, voucher,
and public. The share of enrollees who graduated from a private high school is much higher in
non-CRUCH universities compared to CRUCH universities. It is important to highlight that
the type of high school a student attends is well correlated with his/her parental background
and also that school quality may substantially vary across types.12
12Our empirical analysis uses the ownership of each high school as a proxy for the socio-economic status
25

Private high schools are the most expensive, followed by voucher schools (similar to
charter schools in the US), and then public high schools. Naturally, parents who send their
children to private schools are mostly well off compared to those who send their children to
voucher or public schools (see Gallego and Hernando, 2009; Bravo et al., 2010; Elacqua, 2012).
Table 2 reports summary statistics of college enrollees between 2010 and 2013. Panel A reports
the average characteristics of college enrollees depending on the types of high schools they
graduated from (columns 1 to 3). Our dataset includes over 0.4 million enrollees. Twenty
percent of the enrollees graduated from private high schools, and voucher high school graduates
account for 54 percent. To get a sense of the selection into college, we report the ratio of college
enrollees over the total number of high school seniors in a given type of high schools. Note that
the ratio may exceed 100 percent because high school graduates may take some time off before
applying to college. The reported ratio in the second row shows that the share of high school
graduates enrolling in a university is much larger at private high schools, followed by voucher
schools and then public high schools. We use both raw PSU scores and standardized scores, i.e.,
standardized PSU scores among new enrollees in each year. There is a noticeable difference in
average test scores of enrollees between private high schools and the rest. However, the variation
of their students. High schools can be private with no subsidies (high socioeconomic status (SES)), privatewith voucher (Medium SES) and public (low SES). This SES measure has been largely used in the Chileancontext to characterize SES. To show the relevance of our approach to the Chilean context, we obtain theadditional data from the Ministry of Education of Chile (MOE). For each high school, the MOE collects thefollowing student information: mother’s years of schooling, father’s years of schooling, family income and studentvulnerability. A student is classified as vulnerable if she lives in extreme poverty according to the government’sstandard. Following Agencia de Calidad de Educación (2012), each variable is averaged at the school level andthen schools are clustered into the five SES categories : High, Medium High, Medium, Medium-Low, and Low.Therefore, a high school’s category does not depend directly on the high school ownership type, but rather on thecharacteristics of its students. The table below shows the distribution of high school types given an SES categoryusing the 2012 MOE data. For example, among the lowest SES high schools, public high schools account for79%, while the remaining 21% are voucher high schools. The table shows that on average students from privatehigh schools come from higher SES families while students from public high schools have on average the lowestSES.
High school Types SES Categories by MOELow Medium-Low Medium Medium-High High
Public 79.30% 53.10% 29.10% 10.80% 0.00%Voucher 20.70% 46.90% 70.90% 84.80% 7.10%Private 0.00% 0.00% 0.10% 4.50% 92.90%
26
within a type is so large that the distributions of enrollees’ scores overlap. Panel B reports the
average characteristics of the options enrollees signed up for in the period 2010-2013. Students
from private high schools enrolled in relatively better-ranked programs (higher prestige) and
were much more likely to enroll a non-CRUCH college. On the other hand, students coming
from voucher and public schools were substantially less likely to enroll a college that joined the
centralized system in 2012.
5.3 Empirical Strategy
We use two strategies to examine model predictions. One is based on simple statistics com-
paring the outcomes before and after the 2011 admission system change. Specifically, we split
our data into two periods: 2010-2011 and 2012-2013. The period between 2012 and 2013 is
under the new college admission regime, in which the 8 non-CRUCH universities joined the
centralized matching (i.e., post-period). We select the same number of years right before the
change, i.e., 2010 and 2011, to study the decisions and outcomes of universities and students
under the old admission system (i.e., pre-period). Comparing the pre- and post- periods can
help us understand the impact of the change in the college admission system on students and
universities. In our analysis, we present two sets of results – one based on summary statistics
and the other based on regression analysis. Although the results are consistent across the two
sets, the former is straightforward, informing us about the overall trends, while the latter can
control for various differences in characteristics among universities and college applicants. For
the sake of conciseness, we present our main results in the main paper and report the additional
results and robustness checks in the Online Appendix.
We acknowledge that our empirical strategies do not guarantee causal inference of the
policy impacts. That is, factors other than the 2012 policy change may account for some of the
differences between the pre- and post- period. We employ two methods to examine the severity
of this concern. The first is to show that there is no time trend before the 2012 change. For
this purpose, we use the rest of sample period (i.e., 2007 to 2009) and show that between the
2007-2009 and 2010 and 2011 periods, there is no systematic change in outcomes (conditional
27
on some controls). The second method is to document that there is no other policy change that
may account for our findings. We present results in the Online Appendix demonstrating that
our findings are robust to this concern.
6 Empirical Findings
6.1 CRUCH’s incentives for adoption and expansion of the centralized ad-
mission
First, we examine what motivated CRUCH to form a centralized admission system in the first
place. At the time CRUCH universities decided to institute centralized matching, they were
highly concentrated. Specifically, in 1967, there were only 8 CRUCH universities that later
were split into 25 universities13. Among these 8 universities, 2 public universities comprised 60
percent of the student enrollees; the remaining 6 universities, which were private, were controlled
by the Catholic Church in Chile14. The higher education sector was relatively small and mostly
elites had access to it. There was a high degree of homogeneity in terms of student socio-
economic and cultural background, and overall universities were comparable to one another
in most respects (see Bernasconi and Rojas, 2003). Therefore, it is reasonable to assume two
groups of universities, comparable to each other in terms of student share, to compete against
each other.
Next, we consider the CRUCH’s incentives and the timing of inviting non-CRUCH to
join the centralized admission system. As most non-CRUCH universities were established by
1990, the CRUCH universities could have invited them to join their centralized matching much
earlier. However, they did not do so until 2012. In our theoretical framework, we show that
the net benefit of inviting non-CRUCH increases if the non-CRUCH play a bigger role when13The year 1967 coincides with the time when the Chilean government introduced a standardized college
entrance test called “Prueba de Aptitud Académica (PAA).” The PAA is a predecessor of PSU: both weremultiple choice exams.
14The two public universities are Universidad de Chile and Universidad Técnica del Estado. The six privateuniversities are Pontifica Universidad Católica de Chile, Universidad Católica del Norte, Universidad Católicade Valparaíso Universidad Austral, Universidad Técnica Federico Santa María, Universidad de Concepción.
28

CRUCH compete for a similar student body against non-CRUCH. In this section, we present
evidence supporting that this is indeed the case15. Figure 2 shows the market share of the non-
CRUCH universities relative to the CRUCH. The dashed line represents the average size of non-
CRUCH universities measured by the number of enrollees, while the dotted line represents that
of CRUCH universities. Overall, the number of enrollees has been increasing in both CRUCH
and non-CRUCH universities because the college enrollment rate in Chile has been steadily
growing16. However, the non-CRUCH universities show faster growth compared to CRUCH
universities (i.e., steeper slope), leading to the rise in their share among college enrollees, from
15.2% percent in 1990 to 54.1% percent in 2013 (solid line in Figure 1). Figure 3 shows the
quality of enrollees that CRUCH and non-CRUCH universities attracted over time. Specifically,
we calculate the average PSU scores among enrollees in a given year and university and take the
weighted average across universities among CRUCH or non-CRUCH groups, with the weights
based on the number of enrollees. We also plot the 5th to 95th percentile of the average
PSU scores with the line graph. Figure 3 shows that the CRUCH’s distribution of the PSU
scores overlap with those of the non-CRUCH schools, particularly with those who joined the
centralized admission in 2012.
6.2 Non-CRUCH’s incentive to participate in the centralized admission
As our theoretical model illustrates, the benefit for a non-CRUCH to join the centralized system
arises when the non-CRUCH competes against CRUCH to attract students. Therefore, among
non-CRUCH universities, those that are comparable to CRUCH are more likely to join the15We obtained the minutes of meetings among CRUCH universities that took place on January 11, 2011 and
April 5, 2011 (Sessions 521 and 523). The minutes of the January meeting state that the CRUCH has the missionof guaranteeing that students and their families have access to accurate information in terms of the number ofvacancies and minimum scores among enrollees. They also state that college admission outcomes should be basedonly on merit. In Spanish, the sentences read as below: "...los Rectores consideran que el Consejo de Rectorestiene la misión de proponer políticas al sistema universitario en su conjunto. Al mismo tiempo, que les cabe laresponsabilidad de garantizar information y calidad a los estudiantes y sus familias", and "..al mismo tiempose vota la decisión de invitar a las universidades privadas a integrarse al sistema de admisión del CRUCH, conexplicitación de vacantes, puntajes de corte y admisión única según los méritos de los estudiantes."
16For example, the gross college enrollment rate, defined as "total enrollment in tertiary education (ISCED 5to 8), regardless of age, expressed as a percentage of the total population of the five-year age group following onfrom secondary school leaving," was 20.9 % in 1991, 37,2% in 2000, and 78.6 percent in 2013. (The World BankDatabank)
29

centralized matching system. Our data shows that indeed that is the case. Specifically, we
compare average characteristics of universities among CRUCH, the 7 non-CRUCH that joined
the centralized matching, and the remaining non-CRUCH that did not join17. Herein, we refer to
them as Types 1 to 3, respectively. Columns 1 to 3 of Table 3 report the average characteristics
of universities across types. The first two groups are on average comparable to each other,
while the CRUCH and the non-CRUCH that decided not to join the matching are much more
different from each other. The differences between the first two groups are often statistically
insignificant at conventional levels, while the differences between the first and the last groups
are significant at the 1 percent level, except for a few cases.
6.3 Payoffs of Universities
This section examines the outcomes of the CRUCH and the 7 non-CRUCH universities when
they joined the centralized matching. Given that these universities voluntarily adopted the sys-
tem change, the change would benefit them. First consider CRUCH universities. We calculate
the prevalence of applicants who got admitted but did not enroll, implying that, from a col-
lege’s point of view, those seats were wasted, lowering its payoffs. Using the application data, we
calculate the list of applicants who got an admission from CRUCH using the Gale-Shapley al-
gorithm. Figure 4 shows the PSU distribution of students who applied to and got the admission
from a CRUCH university (labeled “application”) and that of students who actually accepted
the offer (labeled “enrollment”). The difference between the two distributions is the number of
seats that could have been filled by other students but were wasted, implying the costs from
a college’s point of view. Panel A presents graphs for 2010 and 2011, before the change, and
Panel B shows the graphs for 2012 and 2013, after the centralization expanded. These graphs
illustrate that the number of unfilled seats dramatically decreased after the 2012 change. For
example, in 2011, 14.8% of offers were rejected by applications (i.e., the share of white areas
relative to the outer distribution in 2011). In contrast, in 2012, that share decreased by half17One university that joined the system, "Universidad Mayor", did not report the information to the Ministry
of Education. This is why our empirical analysis only includes 7 out of 8 non-CRUCH universities that joinedthe system.
30

(7.7%). Next, we use regression analyses to measure payoffs of CRUCH as well as non-CRUCH
universities. Again, consistent with our theoretical model, we measure a university’s payoff by
the simple sum of the enrollees’ PSU scores. From 2010 to 2013, we regress the sum of the
PSU scores of a college’s enrollees on a college-specific dummy (i.e., college fixed effects), year
dummy, and the interaction terms between whether a college admission took place after the
2012 change and the types of colleges. Specifically, we estimate the following regression model:
Yc,t = ↵+ �i ⇥ Postt ⇥ 1(Typec = i) + ✓c + µt + "c,t (16)
where Yc,t is the payoff of college c whose type is i in year t , and Postt is a dummy equal
to 1 if t � 2012 (post-change period). Typec is a categorical variable that specifies college c’s
type, that is, 1 if college c is CRUCH, 2 if one of the 8 non-CRUCH, and 3 for the rest of non-
CRUCH and 1() is the indicator funtion. Parameter ✓c captures a college-specific effect (i.e., a
college fixed effect), and µt is year fixed effect. The parameter of interest is �i. If our theoretical
prediction holds, then �1 and �2 will be positive. Parameter �3 measures the change of payoffs
among non-CRUCH that did not join the centralized admission. The difference between �i with
i = 1, 2 and �3 captures the relative change in payoffs for CRUCH and the 8 non-CRUCH.
Table 4 presents three panels depending on the range of samples. Panel A uses the entire
universities, while Panels B and C use half of them depending on the initial quality of schools.
Column (1) of Panel A shows that, after the 2012 change, the average CRUCH payoff slightly
increased (i.e., 5.06) but the increase is not statistically significant at conventional level, while
the non-CRUCH universities that joined the centralized admission (labeled “non-CRUCH: join”)
on average increased their payoffs (i.e., 110.48), significant at the 10 percent level. In contrast,
the non-CRUCH universities that did not join the centralized admission substantially suffer by
a reduction in their average payoffs that is substantially different from zero at the 1 percent
level. As this analysis does not account for the fact that there is a substantial difference in
initial quality among CRUCH schools, we divide the sample into two groups and repeat the
regression analysis. Panel B includes the top half of the universities based on the average PSU
31

scores among enrollees prior to our sample period (i.e., 2007 to 2009), while Panel C includes
the remaining bottom 50% of schools. The top 50% group includes only some CRUCH and the
non-CRUCH that joined the centralized admission (Type 2), while the bottom 50% includes
only the rest of CRUCH and the non-CRUCH that did not join the centralized admission (Type
3). Once we condition on the initial quality of schools, we can clearly see that the subset of
CRUCH universities that directly compete against the Type 2 non-CRUCH increased their
payoffs (column (1) of Panel B). The rest of CRUCH schools that compete againts the Type 3
non-CRUCH show a reduction in their payoffs but insignificantly.
Both sets of analyses suggest that, consistent with our theoretical model, CRUCH and the
non-CRUCH that joined the centralized admission benefit from the expansion of the centralized
admission.
5.4 Student Outcomes
Our theoretical model predicts that, conditional on test scores, students facing high
application costs are disadvantageous relative to their counterparts with low costs. Specifically,
they are less likely to apply to colleges with separate applications, and due to the difference
in application behaviors, they will be more likely to enroll in a university and major that is
less prestigious than those of their counterparts. However, when the set of universities covered
by the centralized matching expands, this premium decreases. In the Chilean setting, it is
reasonable to assume that students whose parents are well enough off to cover the deposit
fees and those who live in metropolitan areas face smaller opportunity costs. To proxy for
parental background, we use high school type, expecting that private school graduates would
be better off than the rest. Figure 5 shows the existence of the premiums. Specifically, we
classify students based on their PSU scores (by decile) and high school type (private, public,
and voucher). Conditional on a decile, the average PSU scores are comparable across the three
high school types. Figure 5 shows that even if students have the same PSU scores, students from
private schools were able to enroll in better-ranked options compared to those from voucher or
public schools. However, the gap is reduced in 2012-13 compared to 2010-11, especially for
middle-ranged students ranging from the third decile (D3) to the 8th decile (D8). Tables 5 and
32

6 present the empirical analysis of students’ outcomes before and after the change. Specifically,
we regress the prestige of the option a student enrolled in as student’s PSU score, high school
type, and other controls as follows:
Yi,t = ↵+ � ⇥ Scorei,t + � ⇥HighSchooli,t + � ⇥ Postt ⇥HighSchooli,t + ✓ ⇥Xi,t + "i,t (17)
where Yi,t is either the prestige of the program student i enrolls in year t (columns 1-3)
or the probability that student i enrolls at a Type 2 college in year i. Scorei,t is the PSU score
of student i enrolls in year t, HighSchooli is a categorical variable defining her high school type
(private, voucher or public), Xi,t is a vector of student’s characteristic, including gender, age,
location, and finally Postt is a dummy equal to 1 if t � 2012 (post-reform period), which is
interacted with the high school variable.
Table 5 (column (1)) shows that, after the change, students from public and voucher high
schools enroll in programs with a higher prestige (4.99 and 4.81 points, respectively), roughly
2.5 points higher than students from private schools. Recall that our measure of prestige is
based on relative ranking of an option, ranging from 0 to 100. Therefore, the estimated results
can be interpreted as follows. After the 2012 change, a student from public high school is able to
enroll in a college and major that ranked 5 percentiles higher. Note that students from private
schools still benefit from the 2012 change in that the ranking of their enrolled options increases
by 2.6 percentiles. This increase is due to the fact that fewer offers are wasted after the 2012
change (see Section 5.3). We conduct the same analysis by splitting the samples depending on
whether a student resides in one of the three metropolitan areas (MA) where at least one of the
8 non-CRUCH universities are located. Columns (2) and (3) show the results. In both groups,
we find comparable improvement in outcomes.
Columns (4) to (6) show the likelihood of enrolling in a non-CRUCH university that
joined the centralized admission. As we showed in Section 5.3, those non-CRUCH schools
increased the size of their enrollment. The purpose of these analyses is to examine whether these
33
seats are filled by students from a certain type of high school more often or not. The estimated
coefficients show that students from voucher high schools are more likely to enroll in a Type 2
non-CRUCH school relative to those from private or public schools. However, the difference is
not statistically significant at conventional levels. When we study students residing in one of
the three metropolitan areas (MA, column (6)), the effect becomes statistically significant at
the 1 percent level but the estimate is not statistically from the effect on students from public
schools (i.e., 0.009 vs. 0.007).
7 Discussion
In this section, we examine the sensitivity of our analysis with respect to our choice of student
outcomes, namely “prestige.” First, we construct our prestige ranking not based on average PSU
scores among enrollees, but based on two alternative statistics: the minimum and maximum
PSU scores among enrollees in a given option. Table 6 presents the results, consistent with
the baseline results reported in columns 1 to 3 of Table 5. Specifically, after the 2012 change,
on average all students are able to enroll in a better-ranked options and this positive impact
is larger for students who graduated from voucher or public high schools as compared to their
counterparts who graduated from private high schools. Second, we examine the extent to which
our measure of prestige may reflect students’ preferences. Suppose that a student’s preference
over options is determined by the common and idiosyncratic components of an option. We con-
sider the average PSU scores as a proxy for the former, the value of an option that is commonly
shared by college applicants. Therefore, we view our empirical results regarding student out-
comes as average impacts because students’ idiosyncratic values of an option may be cancelled
out across individuals. However, our argument will be valid if the average PSU scores indeed
well reflect the relative ranking of the value of common components. Specifically, due to appli-
cation costs for non-CRUCH universities, it is possible that an option may be well-demanded
by students but have a lower average PSU score than another option that is less preferred. That
is, our measure of prestige will be valid if search frictions do not alter the relative ranking of
34

an option with respect to the average PSU score. We examine this possibility using the appli-
cation data as follows. Specifically, we use the 2012 application information on CRUCH and
the 8 non-CRUCH universities under the centralized matching to compare students’ preference
ranking with our measure of prestige. Recall that the Chilean matching employs the student-
proposed Deferred-Acceptance algorithm (or Gale-Shapley algorithm), under which truth-telling
is a dominant strategy for participants. Therefore, if our measure of prestige well reflects stu-
dents’ preferences, then it will be positively correlated with students’ preference ranking. To
test this possibility, for each option, we calculate the fraction of applicants who rank it as their
best or second-best option (i.e., rank number 1 or 2); the fraction of applicants who rank it as
number 3 or 4; and 5 or above. By construction, the sum of these three variables is one within
option. We then regress our measure of prestige on the former two variables. If our hypothesis
is true, then the estimated coefficient of % Ranking 1-2 will be larger than that of % Ranking
3-4; and % Ranking 5-10 will be the smallest (which is out omitted category). The regression
results are reported in Table 7. In column (1), we regress our prestige on the two regressors;
we add field-fixed effects in column (2); we add university-fixed effects in column (3); and we
use both field- and university- fixed effects in column (4). In all specifications, we find positive
correlation of the ranking of an option in the application data with our measure of prestige. For
example, in column (1), the result shows that a one percentage point increase in the share of
applicants who select an option as rank number 1 or 2, while decreasing the share of those who
rank it as number 5 or higher, is associated with a 0.984 increase in our measure of prestige
(2.0 percent). Similarly, a one percentage point increase in the share of applicants who select
an option as rank number 3 or 4, while decreasing the share of those who rank it as number 5
or higher, is associated with a 0.977 increase in our measure of prestige (1.9 percent).
8 Conclusion
This paper examines schools’ incentives to voluntarily form a centralized admission system
and to expand the number of participants when application costs exist and a student’s abil-
35

ity to afford these costs varies. Our theoretical analysis shows that when application costs
are sufficiently large and colleges are comparable enough in terms of their qualities, colleges
may voluntarily adopt a centralized admission, and also that the group of colleges using the
centralized admission may expand the group by including new market participants. Using ad-
ministrative datasets from Chile, we show the relevance of the theoretical model in explaining
the evolution of college admission procedures. Furthermore, we empirically examine the conse-
quences of an expansion of the centralized admission in 2012. The expansion is beneficial not
only to colleges that participate in the centralized admission but also to applicants, particu-
larly those of low socioeconomic status (SES), who are able to enroll in higher quality schools.
The impact on applicants is accounted for by the efficiency improvement due to coordination
among colleges, and also by the fact that applicants of low SES are less likely to be able to
afford application costs in Chile. Our findings suggest that consideration of application costs,
or generally speaking search costs, may be important in examining potential benefits from a
market design intervention. When search costs are negligible, as in secondary school assignment
problems in the US, incentives for schools to adopt a centralized admission system can be small
because doing so only increases competition against other schools. In such a case, government
intervention and associated compensation is necessary. In contrast, our study suggests that a
centralized system can be more adoptable in a market with high search costs, such as devel-
oping countries or countries with high inequality. This paper also shows that a market design
policy can play an important role in reducing inefficiency and inequality. Chile’s expansion
of its centralized admission system in 2012 increased the fraction of seats allocated through
the centralized admission from 47 percent to 63 percent. This suggests that a student can
apply to a much wider set of colleges without paying any application costs. This reduction
in application costs is beneficial to students in general, but much more so to students from a
low socioeconomic background. Our findings suggest that search costs affect agents’ outcomes
depending on the extent to which their resources cover the costs, even if two agents are of equal
quality. Reducing search costs using the centralized admission diminishes the role of irrelevant
characteristics, namely parental background, in determining the agents’ outcomes, which could
36

be useful to economies attempting to improve intergenerational mobility or representation of
minorities in higher education.
37

References
Abdulkadiroglu, Atila, Yeon koo Che, and Yosuke Yasuda, “Resolving Conflicting
Preferences in School Choice : The “Boston Mechanism” Reconsidered,” American Economic
Review, 2011, 101 (February), 399–410.
Abdulkadiroğlu, Atila and Tayfun Sonmez, “School Choice : A Mechanism Design Ap-
proach,” American Economic Review, 2003, 93 (3).
, Nikhil Agarwal, and Parag A Pathak, “The Welfare Effects of Coordinated Assignment:
Evidence from the NYC HS Match,” Working Paper, National Bureau of Economic Research
mar 2015.
, P Arag Athak, and Alvin E. Roth, “The Boston Public School Match,” American
Economic Review, 2005, 95 (2).
, , and , “The New York City High School Match,” American Economic Review, 2005,
95 (2), 364–367.
Agencia de Calidad de Educación, “Metodología de construcción de Grupos Socioe-
con]omicos Pruebas Simce 2012,” Technical Report, Agencia de Calidad de Educación 2012.
Bernasconi, Andrés and Fernando Rojas, Informe sobre la Educación Superior en Chile:
1980-2003 number August, primera ed ed., Santiago: Editorial Universitaria, 2003.
Beyer, Harald, Justine Hastings, Christopher Neilson, and Seth Zimmerman, “Con-
necting Student Loans to Labor Market Outcomes : Policy Lessons from Chile,” American
Economic Review: Paper and Procedings, 2015, 105 (5), 508–513.
Bordon, Paola and Chao Fu, “College-Major Choice to College-then-Major Choice,” The
Review of Economic Studies, 2015.
38

Bravo, David, Sankar Mukhopadhyay, and Petra E. Todd, “Effects of school reform on
education and labor market performance: Evidence from Chile’s universal voucher system,”
Quantitative Economics, 2010, 1 (1), 47–95.
Ekmekci, Mehmet and M Bumin Yenmez, “Integrating Schools for Centralized Admis-
sions,” 2003.
Elacqua, Gregory, “International Journal of Educational Development The impact of school
choice and public policy on segregation : Evidence from Chile,” International Journal of
Educational Development, 2012, 32, 444–453.
and Humberto Santos, “Preferencias reveladas de los proveedores de educación privada
en Chile. El caso de la Ley de Subvención Escolar Preferencial,” Gestión y Política Pública,
2013, 22 (1), 85–129.
Espinoza, Ricardo and Sergio Urzúa, “The Economic Consequences of Implementing Tu-
ition Free Higher Educacation in Chile,” Revista de Educación, 2015, 295 (1), 10–44.
Gallego, Francisco and Andrés Hernando, “School Choice in Chile: Looking at the De-
mand Side,” 2009.
Hastings, Justine S, Christopher A Neilson, and Seth D Zimmerman, “Are Some
Degrees Worth More than Others? Evidence from college admission cutoffs in Chile,” Working
Paper, National Bureau of Economic Research jul 2013.
Kaufmann, Katja Maria, Matthias Messner, and Alex Solis, “Returns to Elite Higher
Education in the Marriage Market : Evidence from Chile,” 2013.
Lafortune, Jeanne, Nicolás Figueroa, and Alejandro Saenz, “Do you like me enough?
The impact of restricting preferences ranking in a university matching process,” 2016.
Rau, Tomas, Eugenio Rojas, and Sergio Urzúa, “Loans for Higher Education: Does the
Dream Come True?,” NBER Working Paper Series, 2013, No. 19138.
39
Rodríguez, Jorge, Loreto Reyes, and Sergio Urzúa, “Heterogeneous Economic Returns
to Post-Secondary Degrees Evidence from Chile,” Journal of Human Resources, 2016, 51 (2),
416–460.
Roth, Alvin E., “The Economics of Matching: Stability and Incentives,” Mathematics of
Operations Research, nov 1982, 7 (4), 617–628.
, “Misrepresentation and stability in the marriage problem,” Journal of Economic Theory,
dec 1984, 34 (2), 383–387.
, “The Evolution of the Labor Market for Medical Interns and Residents: A Case Study in
Game Theory,” Journal of Political Economy, dec 1984, 92 (6), 991–1016.
, “A Natural Experiment in the Organization of Entry-Level Labor Markets: Regional Markets
for New Physicians and Surgeons in the United Kingdom,” The American Economic Review,
jun 1991, 81 (3), 415–440.
and Elliott Eranson, “The Redesign of the Matching Market for American Physicians :
Some Engineering Aspects of Economic Design,” American Economic Review, 1999, 89 (4).
and Xiaolin Xing, “Jumping the Gun: Imperfections and Institutions Related to the
Timing of Market Transactions,” The American Economic Review, sep 1994, 84 (4), 992–
1044.
Turner, Lesley J, Sergio Urzúa, Stephanie Rennane, and Patricia Navarro-Palau,
“Smarts versus Skills: The Effect of College Entrance Exams on Labor Market Outcomes and
Inequality,” 2014.
40

1
Figure 1 Timeline of the Admission Process
Note: This figure illustrates the timeline of college admission processes in Chile. The top panel illustrates the process of the universities that use the centralized matching system (namely, CRUCH until 2011 and CRUCH and 8 non-CRUCH universities from 2012). The bottom panel illustrates the admission process of the universities that join the centralized matching system.
Figure 2 Share of Non-CRUCH Universities
Note: The solid line shows the share of non-CRUCH universities out of new university enrollees in each college admission cycle (left y-axis). The line marked with triangles (Δ) shows the average university size (total enrollees) across CRUCH universities, while the line marked with circles (O) shows the average university size across non-CRUCH universities (right y-axis). Source: SIES, Ministry of Education.

2
Figure 3. Comparison: CRUCH vs. Non-CRUCH Panel A: Average PSU scores among New Enrollees
Note: The unit of observation is university by year. For each observation the average PSU (raw score) is calculated. This figure shows the simple average of those averages among the 25 CRUCH (O), 7 non-CRUCH that joined the system in 2012 ( ) and 23 non-CRUCH that did not join the system (Δ) for different years. The 25th and 75th percentile are showed in bars.
Panel B: Average Number of New Enrollees
Note: The unit of observation is university by year. For each observation the number of new enrollees is calculated (size). This figure shows the simple average of the size among the 25 CRUCH (O), 7 non-CRUCH that joined the system in 2012 ( ) and 23 non-CRUCH that did not join the system (Δ) for different years. The 25th and 75th percentile are showed in bars.
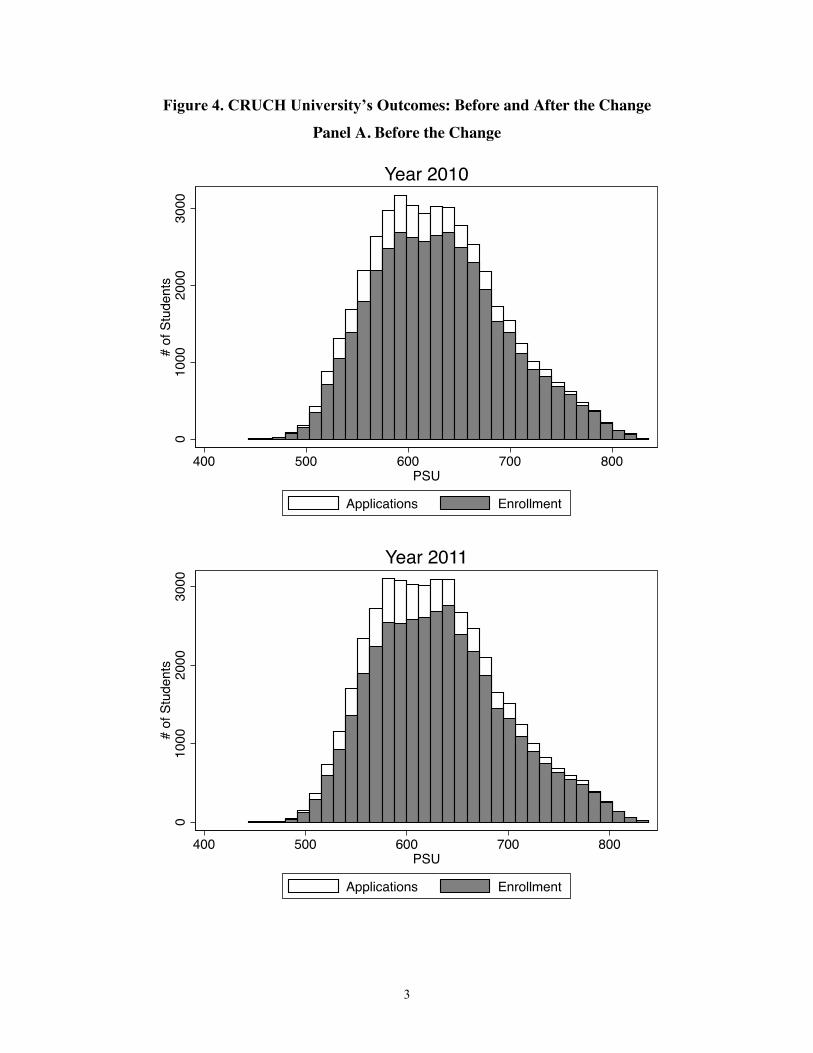
3
Figure 4. CRUCH University’s Outcomes: Before and After the Change Panel A. Before the Change

4
Panel B. After the Change
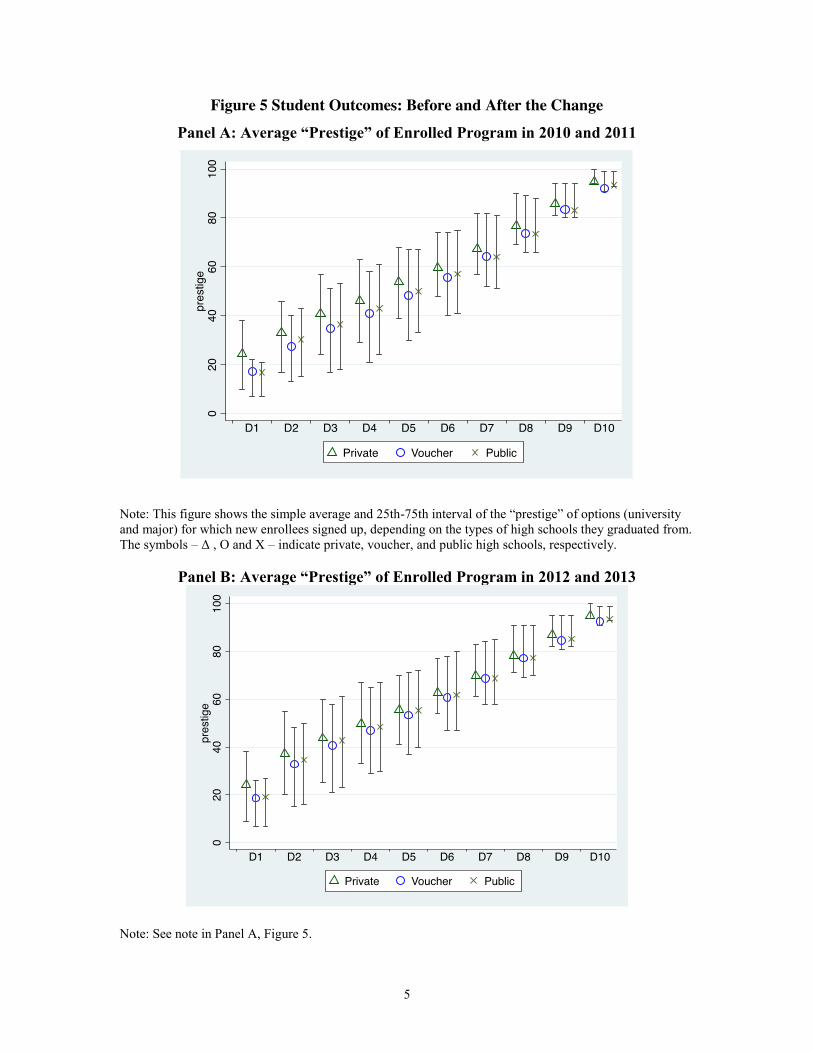
5
Figure 5 Student Outcomes: Before and After the Change Panel A: Average “Prestige” of Enrolled Program in 2010 and 2011
Note: This figure shows the simple average and 25th-75th interval of the “prestige” of options (university and major) for which new enrollees signed up, depending on the types of high schools they graduated from. The symbols – Δ , O and X – indicate private, voucher, and public high schools, respectively.
Panel B: Average “Prestige” of Enrolled Program in 2012 and 2013
Note: See note in Panel A, Figure 5.

6
Table 1. Universities: Summary Statistics (2010-2013)
Average S.D. Min Max (1) (2) (3) (4) Panel A. CRUCH Tuition 4,205.93 899.56 2586.66 7027.80
Number of majors offered 33.38 12.06 14.00 67.00
No of newly enrolled students 2,208.36 1400.52 448.00 6404.00
Average PSU among enrollees 583.50 43.88 517.53 697.11
Sum of enrollee’s PSUs 1,256.89 882.01 208.42 3826.13
Student composition (%)
- age over 20 24.49% 6.66% 10.08% 41.80%
- from 3 metropolitan areas 41.96% 38.19% 2.56% 90.81%
- from private schools 11.26% 13.28% 0.52% 62.58%
- from voucher schools 54.29% 10.26% 22.00% 73.53%
Panel B. Non-CRUCH Tuition 6,656.17 1067.75 4550.33 8203.91
Number of majors offered 26.04 15.40 5.00 63.00
No of newly enrolled students 2,779.46 2620.42 776.00 9665.00
Average PSU among enrollees 609.08 32.53 556.14 659.24
Sum of enrollee’s PSUs 1,485.93 1273.86 382.16 4843.41
Student composition (%)
- age over 20 41.52% 18.02% 10.32% 92.38%
- from 3 metropolitan areas 70.11% 18.41% 20.15% 91.21%
- from private schools 19.57% 23.99% 0.00% 85.51%
- from voucher schools 49.53% 17.54% 6.62% 78.57%
Note: The unit of observation is university by year (2010 to 2013), total of 220. The sample include all 25 CRUCH universities and 30 non-CRUCH universities. Unweighted averages are reported. Tuition is reported in 2009 USD. The 3 metropolitan areas are XIII (Metropolitan), VIII Region (Concepción), and V Region (Valparaíso-Viña del Mar). “Students from private schools” and “Students from subsidized schools” refer to the share of enrollees who graduated from a private high school without any government subsidy, and from a voucher school, that is, a private school whose tuition is subsidized by the Chilean government. The omitted category is a public high school.

7
Table 2. College Enrollees: Summary Statistics (2010-2013)
HS type Private Voucher Public (1) (2) (3) Panel A. Enrollees characteristics Number of enrollees 84,091 240,139 117,656
(% of high school seniors) 119.82% 71.00% 35.62% PSU scores
- Raw 633.71 560.02 553.53
(std.) (79.66) (73.62) (79.09)
- Standardized 0.76 -0.14 -0.22
(std.) (0.97) (0.90) (0.96)
% in metropolitan areas (MA) 78.80% 63.96% 54.49%
Panel B. Enrollment outcomes Prestige: mean 75.20 52.56 50.92 (std.) (25.41) (29.15) (29.63)
University type (%)
- CRUCH 44.71% 47.69% 52.76%
- NC: join 40.82% 13.10% 7.93%
- NC: not join 14.47% 39.20% 39.31%
Location of university: college in MA (%) 99.09% 97.78% 97.15%
- students from the MA 66.26% 28.22% 22.65%
- students outside of the MA 75.20 52.56 50.92
Source: Authors calculations using data from SIES. Note: Unit of observations is student who enrolled in a university between 2010 and 2013. Metropolitan areas include students and universities located in regions V, VIII and XIII. “NC: join” includes 7 (out of 8) non-CRUCH colleges that eventually join the coordinated assignment in 2012, while “NC: not join” includes the rest of the non-CRUCH colleges (n=23).
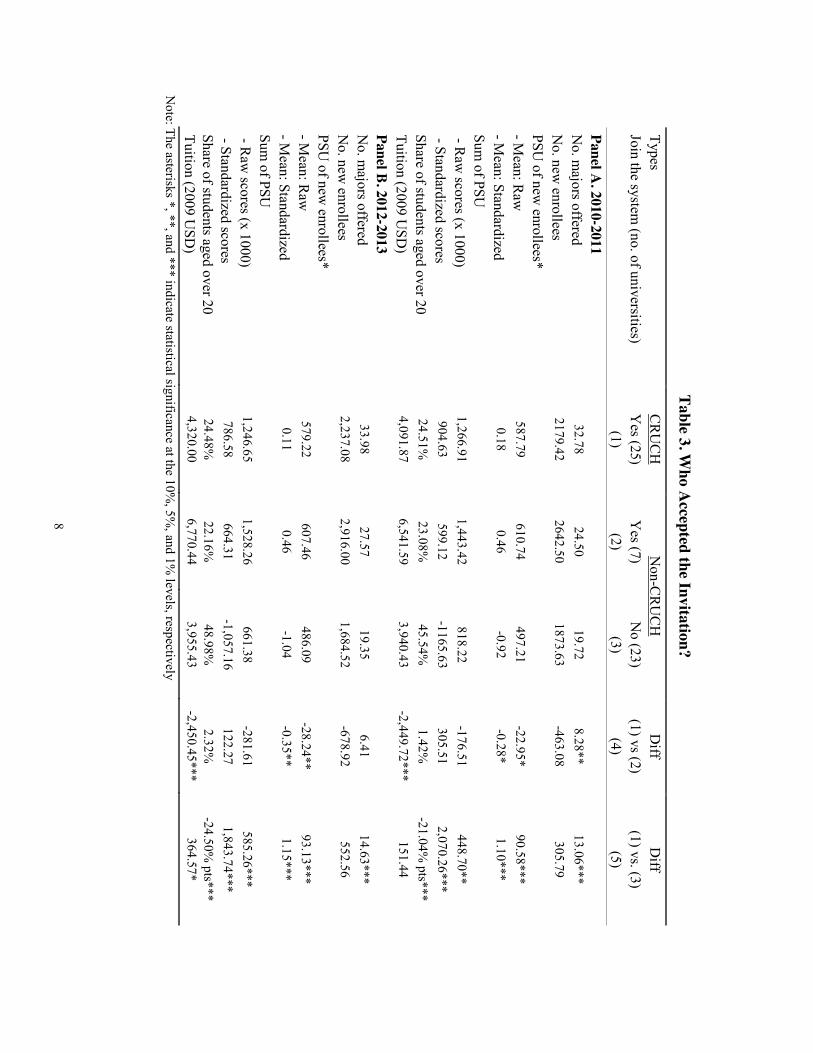
8
Table 3. Who A
ccepted the Invitation?
Types C
RU
CH
N
on-CR
UC
H
Diff
Diff
Join the system (no. of universities)
Yes (25)
Yes (7)
No (23)
(1) vs (2) (1) vs. (3)
(1)
(2) (3)
(4) (5)
Panel A. 2010-2011
N
o. majors offered
32.78 24.50
19.72 8.28**
13.06***
No. new
enrollees 2179.42
2642.50 1873.63
-463.08 305.79
PSU of new
enrollees*
- Mean: R
aw
587.79 610.74
497.21 -22.95*
90.58***
- Mean: Standardized
0.18 0.46
-0.92 -0.28*
1.10***
Sum of PSU
- Raw
scores (x 1000) 1,266.91
1,443.42 818.22
-176.51 448.70**
- Standardized scores 904.63
599.12 -1165.63
305.51 2,070.26***
Share of students aged over 20 24.51%
23.08%
45.54%
1.42%
-21.04%
pts***
Tuition (2009 USD
) 4,091.87
6,541.59 3,940.43
-2,449.72*** 151.44
Panel B. 2012-2013
No. m
ajors offered 33.98
27.57 19.35
6.41 14.63***
No. new
enrollees 2,237.08
2,916.00 1,684.52
-678.92 552.56
PSU of new
enrollees*
- Mean: R
aw
579.22 607.46
486.09 -28.24**
93.13***
- Mean: Standardized
0.11 0.46
-1.04 -0.35**
1.15***
Sum of PSU
- Raw
scores (x 1000) 1,246.65
1,528.26 661.38
-281.61 585.26***
- Standardized scores 786.58
664.31 -1,057.16
122.27 1,843.74***
Share of students aged over 20 24.48%
22.16%
48.98%
2.32%
-24.50%
pts*** Tuition (2009 U
SD)
4,320.00 6,770.44
3,955.43 -2,450.45***
364.57* N
ote: The asterisks *, **, and *** indicate statistical significance at the 10%, 5%
, and 1% levels, respectively
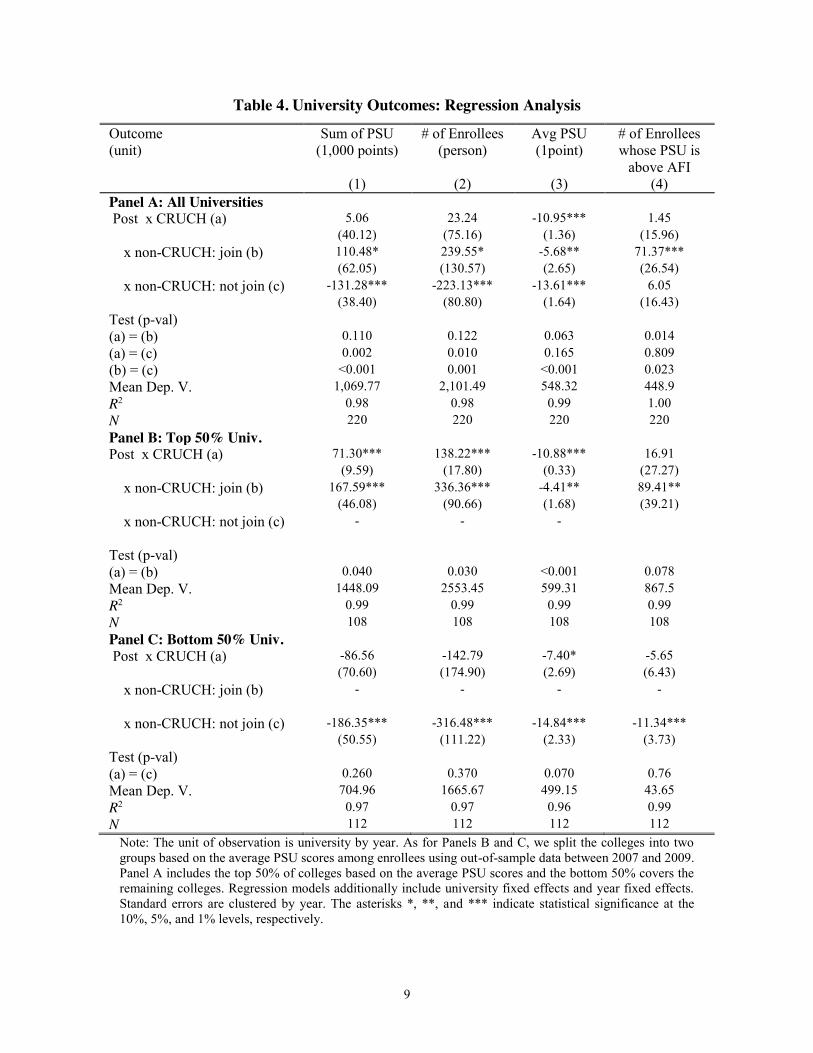
9
Table 4. University Outcomes: Regression Analysis
Outcome (unit)
Sum of PSU (1,000 points)
# of Enrollees (person)
Avg PSU (1point)
# of Enrollees whose PSU is
above AFI (1) (2) (3) (4) Panel A: All Universities Post x CRUCH (a) 5.06 23.24 -10.95*** 1.45 (40.12) (75.16) (1.36) (15.96) x non-CRUCH: join (b) 110.48* 239.55* -5.68** 71.37*** (62.05) (130.57) (2.65) (26.54) x non-CRUCH: not join (c) -131.28*** -223.13*** -13.61*** 6.05 (38.40) (80.80) (1.64) (16.43) Test (p-val) (a) = (b) 0.110 0.122 0.063 0.014 (a) = (c) 0.002 0.010 0.165 0.809 (b) = (c) <0.001 0.001 <0.001 0.023 Mean Dep. V. 1,069.77 2,101.49 548.32 448.9 R2 0.98 0.98 0.99 1.00 N 220 220 220 220 Panel B: Top 50% Univ. Post x CRUCH (a) 71.30*** 138.22*** -10.88*** 16.91 (9.59) (17.80) (0.33) (27.27) x non-CRUCH: join (b) 167.59*** 336.36*** -4.41** 89.41** (46.08) (90.66) (1.68) (39.21) x non-CRUCH: not join (c) - - - Test (p-val) (a) = (b) 0.040 0.030 <0.001 0.078 Mean Dep. V. 1448.09 2553.45 599.31 867.5 R2 0.99 0.99 0.99 0.99 N 108 108 108 108 Panel C: Bottom 50% Univ. Post x CRUCH (a) -86.56 -142.79 -7.40* -5.65 (70.60) (174.90) (2.69) (6.43) x non-CRUCH: join (b) - - - - x non-CRUCH: not join (c) -186.35*** -316.48*** -14.84*** -11.34*** (50.55) (111.22) (2.33) (3.73) Test (p-val) (a) = (c) 0.260 0.370 0.070 0.76 Mean Dep. V. 704.96 1665.67 499.15 43.65 R2 0.97 0.97 0.96 0.99 N 112 112 112 112
Note: The unit of observation is university by year. As for Panels B and C, we split the colleges into two groups based on the average PSU scores among enrollees using out-of-sample data between 2007 and 2009. Panel A includes the top 50% of colleges based on the average PSU scores and the bottom 50% covers the remaining colleges. Regression models additionally include university fixed effects and year fixed effects. Standard errors are clustered by year. The asterisks *, **, and *** indicate statistical significance at the 10%, 5%, and 1% levels, respectively.
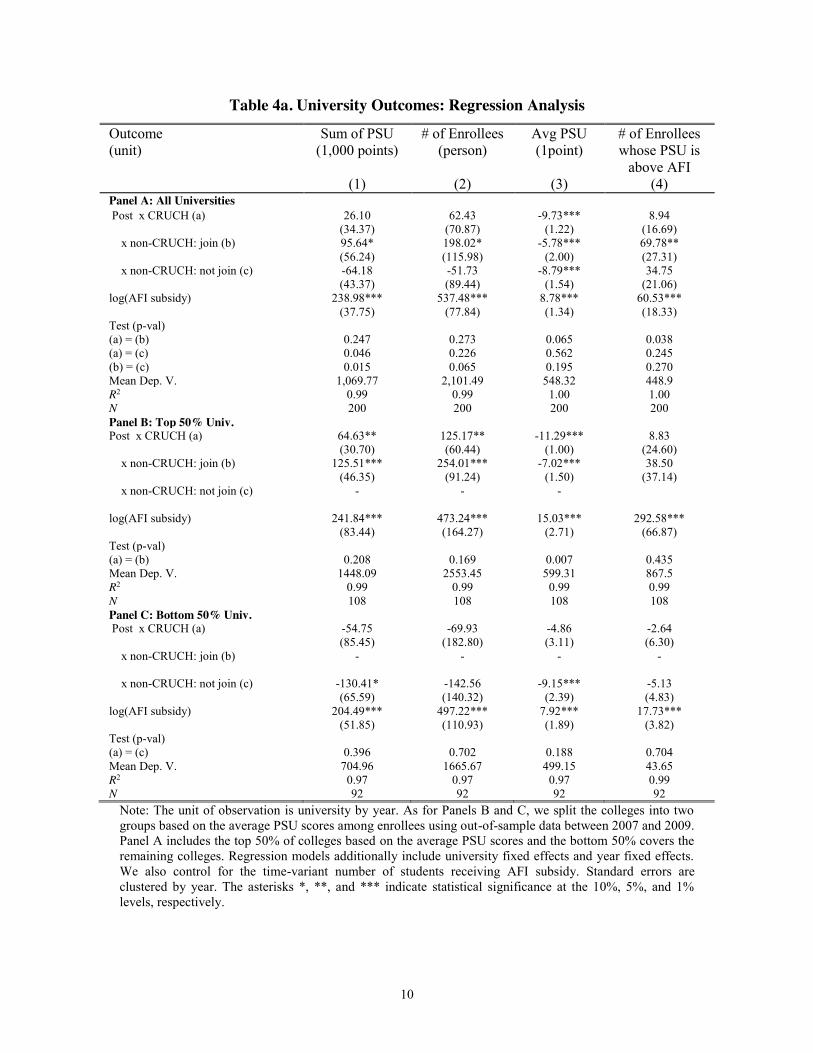
10
Table 4a. University Outcomes: Regression Analysis
Outcome (unit)
Sum of PSU (1,000 points)
# of Enrollees (person)
Avg PSU (1point)
# of Enrollees whose PSU is
above AFI (1) (2) (3) (4) Panel A: All Universities Post x CRUCH (a) 26.10 62.43 -9.73*** 8.94 (34.37) (70.87) (1.22) (16.69) x non-CRUCH: join (b) 95.64* 198.02* -5.78*** 69.78** (56.24) (115.98) (2.00) (27.31) x non-CRUCH: not join (c) -64.18 -51.73 -8.79*** 34.75 (43.37) (89.44) (1.54) (21.06) log(AFI subsidy) 238.98*** 537.48*** 8.78*** 60.53*** (37.75) (77.84) (1.34) (18.33) Test (p-val) (a) = (b) 0.247 0.273 0.065 0.038 (a) = (c) 0.046 0.226 0.562 0.245 (b) = (c) 0.015 0.065 0.195 0.270 Mean Dep. V. 1,069.77 2,101.49 548.32 448.9 R2 0.99 0.99 1.00 1.00 N 200 200 200 200 Panel B: Top 50% Univ. Post x CRUCH (a) 64.63** 125.17** -11.29*** 8.83 (30.70) (60.44) (1.00) (24.60) x non-CRUCH: join (b) 125.51*** 254.01*** -7.02*** 38.50 (46.35) (91.24) (1.50) (37.14) x non-CRUCH: not join (c) - - - log(AFI subsidy) 241.84*** 473.24*** 15.03*** 292.58*** (83.44) (164.27) (2.71) (66.87) Test (p-val) (a) = (b) 0.208 0.169 0.007 0.435 Mean Dep. V. 1448.09 2553.45 599.31 867.5 R2 0.99 0.99 0.99 0.99 N 108 108 108 108 Panel C: Bottom 50% Univ. Post x CRUCH (a) -54.75 -69.93 -4.86 -2.64 (85.45) (182.80) (3.11) (6.30) x non-CRUCH: join (b) - - - - x non-CRUCH: not join (c) -130.41* -142.56 -9.15*** -5.13 (65.59) (140.32) (2.39) (4.83) log(AFI subsidy) 204.49*** 497.22*** 7.92*** 17.73*** (51.85) (110.93) (1.89) (3.82) Test (p-val) (a) = (c) 0.396 0.702 0.188 0.704 Mean Dep. V. 704.96 1665.67 499.15 43.65 R2 0.97 0.97 0.97 0.99 N 92 92 92 92
Note: The unit of observation is university by year. As for Panels B and C, we split the colleges into two groups based on the average PSU scores among enrollees using out-of-sample data between 2007 and 2009. Panel A includes the top 50% of colleges based on the average PSU scores and the bottom 50% covers the remaining colleges. Regression models additionally include university fixed effects and year fixed effects. We also control for the time-variant number of students receiving AFI subsidy. Standard errors are clustered by year. The asterisks *, **, and *** indicate statistical significance at the 10%, 5%, and 1% levels, respectively.
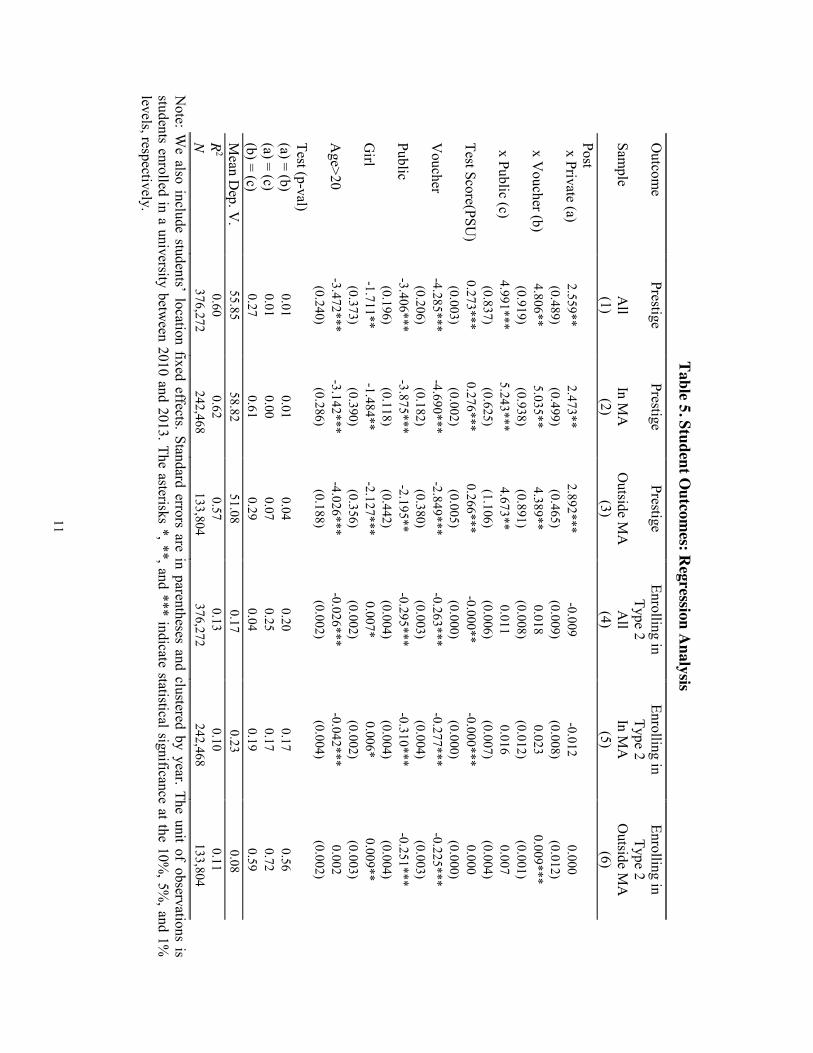
11
Table 5. Student Outcom
es: Regression A
nalysis
Outcom
e Prestige
Prestige Prestige
Enrolling in Type 2
Enrolling in Type 2
Enrolling in Type 2
Sample
All
In MA
O
utside MA
A
ll In M
A
Outside M
A
(1)
(2) (3)
(4) (5)
(6) Post
x Private (a) 2.559**
2.473** 2.892***
-0.009 -0.012
0.000
(0.489) (0.499)
(0.465) (0.009)
(0.008) (0.012)
x Voucher (b)
4.806** 5.035**
4.389** 0.018
0.023 0.009***
(0.919)
(0.938) (0.891)
(0.008) (0.012)
(0.001) x Public (c)
4.991*** 5.243***
4.673** 0.011
0.016 0.007
(0.837)
(0.625) (1.106)
(0.006) (0.007)
(0.004) Test Score(PSU
) 0.273***
0.276*** 0.266***
-0.000** -0.000***
0.000
(0.003) (0.002)
(0.005) (0.000)
(0.000) (0.000)
Voucher
-4.285*** -4.690***
-2.849*** -0.263***
-0.277*** -0.225***
(0.206)
(0.182) (0.380)
(0.003) (0.004)
(0.003) Public
-3.406*** -3.875***
-2.195** -0.295***
-0.310*** -0.251***
(0.196)
(0.118) (0.442)
(0.004) (0.004)
(0.004) G
irl -1.711**
-1.484** -2.127***
0.007* 0.006*
0.009**
(0.373) (0.390)
(0.356) (0.002)
(0.002) (0.003)
Age>20
-3.472*** -3.142***
-4.026*** -0.026***
-0.042*** 0.002
(0.240)
(0.286) (0.188)
(0.002) (0.004)
(0.002) Test (p-val)
(a) = (b) 0.01
0.01 0.04
0.20 0.17
0.56 (a) = (c)
0.01 0.00
0.07 0.25
0.17 0.72
(b) = (c) 0.27
0.61 0.29
0.04 0.19
0.59 M
ean Dep. V
. 55.85
58.82 51.08
0.17 0.23
0.08 R
2 0.60
0.62 0.57
0.13 0.10
0.11 N
376,272
242,468 133,804
376,272 242,468
133,804 N
ote: We also include students’ location fixed effects. Standard errors are in parentheses and clustered by year. The unit of observations is
students enrolled in a university between 2010 and 2013. The asterisks *, **, and *** indicate statistical significance at the 10%
, 5%, and 1%
levels, respectively.
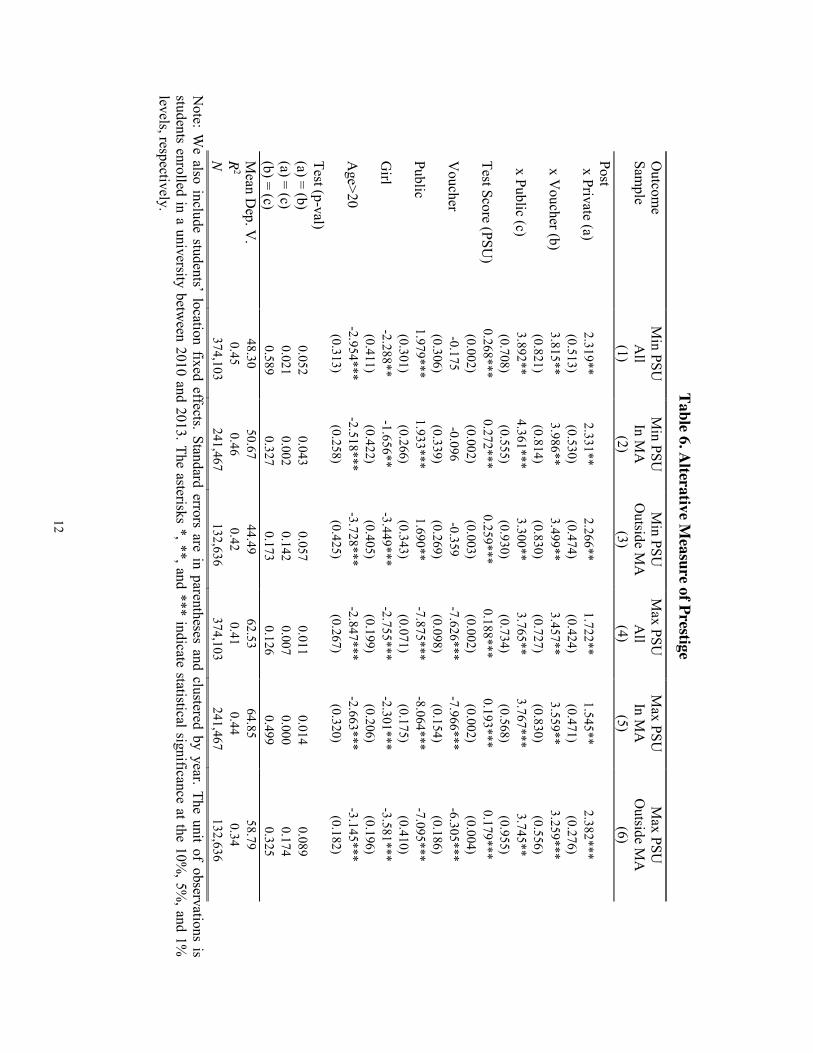
12
Table 6. Alterative M
easure of Prestige
Outcom
e M
in PSU
Min PSU
M
in PSU
Max PSU
M
ax PSU
Max PSU
Sam
ple A
ll In M
A
Outside M
A
All
In MA
O
utside MA
(1) (2)
(3) (4)
(5) (6)
Post
x Private (a)
2.319** 2.331**
2.266** 1.722**
1.545** 2.382***
(0.513)
(0.530) (0.474)
(0.424) (0.471)
(0.276) x V
oucher (b) 3.815**
3.986** 3.499**
3.457** 3.559**
3.259***
(0.821) (0.814)
(0.830) (0.727)
(0.830) (0.556)
x Public (c) 3.892**
4.361*** 3.300**
3.765** 3.767***
3.745**
(0.708) (0.555)
(0.930) (0.734)
(0.568) (0.955)
Test Score (PSU)
0.268*** 0.272***
0.259*** 0.188***
0.193*** 0.179***
(0.002)
(0.002) (0.003)
(0.002) (0.002)
(0.004) V
oucher -0.175
-0.096 -0.359
-7.626*** -7.966***
-6.305***
(0.306) (0.339)
(0.269) (0.098)
(0.154) (0.186)
Public 1.979***
1.933*** 1.690**
-7.875*** -8.064***
-7.095***
(0.301) (0.266)
(0.343) (0.071)
(0.175) (0.410)
Girl
-2.288** -1.656**
-3.449*** -2.755***
-2.301*** -3.581***
(0.411)
(0.422) (0.405)
(0.199) (0.206)
(0.196) A
ge>20 -2.954***
-2.518*** -3.728***
-2.847*** -2.663***
-3.145***
(0.313) (0.258)
(0.425) (0.267)
(0.320) (0.182)
Test (p-val)
(a) = (b)
0.052 0.043
0.057 0.011
0.014 0.089
(a) = (c) 0.021
0.002 0.142
0.007 0.000
0.174 (b) = (c)
0.589 0.327
0.173 0.126
0.499 0.325
Mean D
ep. V.
48.30 50.67
44.49 62.53
64.85 58.79
R2
0.45 0.46
0.42 0.41
0.44 0.34
N
374,103 241,467
132,636 374,103
241,467 132,636
Note: W
e also include students’ location fixed effects. Standard errors are in parentheses and clustered by year. The unit of observations is students enrolled in a university betw
een 2010 and 2013. The asterisks *, **, and *** indicate statistical significance at the 10%, 5%
, and 1%
levels, respectively.

13
Table 7. Prestige and Preference Ranking in Application
(1) (2) (3) (4) % Ranking 1-2 (a) 0.984*** 0.994*** 0.704*** 0.666*** (0.067) (0.064) (0.0725) (0.067) % Ranking 3-4 (b) 0.977*** 0.973*** 0.367*** 0.372*** (0.127) (0.119) (0.118) (0.106) % Ranking 5-10 (omitted) Field Fixed-Effect NO YES NO YES University Fixed-Effect NO NO YES YES Test (p-val) (a) = (b) 0.959 0.859 0.012 0.017 Mean Dep. V. 50.46 50.46 50.46 50.46 R2 0.15 0.26 0.26 0.63 N 1,327 1,327 1,327 1,327
Note: The unit of observation is option. The asterisks *, **, and *** indicate statistical significance at the 10%, 5%, and 1% levels, respectively.