ending extreme poverty and sharing prosperity: progress and
TRANSCRIPT
Ending Extreme Poverty and Sharing Prosperity: Progress and Policies
Marcio Cruz, James Foster, Bryce Quillin and Philip Schellekens1
Approved for distribution by Kaushik Basu Chief Economist and Senior Vice President, World Bank
DISCLAIMER: Policy Research Notes represent the views of the authors and do not necessarily represent WBG views or policy. The views expressed herein should be attributed to the authors and not to the WBG, its Board of Executive Directors, or its management. This note reflects data available as of mid-September 2015.
Authors’ Email Addresses: [email protected]
1 The main authors of this note are: Marcio Cruz (Economist, Development Prospects Group), James Foster (Professor of Economics and International Affairs, George Washington University; Research Associate, Oxford Poverty and Human Development Initiative, Oxford University; World Bank consultant), Bryce Quillin (Senior Economist, Development Prospects Group), and Philip Schellekens (Lead Economist, Development Prospects Group). This note is based on Chapter 1 of the Global Monitoring Report 2015/2016: Development in an Era of Demographic Change and is produced under the guidance of Kaushik Basu, Indermit Gill and Ayhan Kose, with inputs from Carter J. Brandon, Vandana Chandra, Emanuela Galasso, Dean M. Jolliffe, Jin Ho Kim, Eugenia Moran-Suarez, Rinku Murgai, Israel Osorio-Rodarte, Espen B. Prydz, and Kenneth Simler. Research assistance was provided by Pinyi Chen, Huade Huo, Fabian Mendez Ramos, and Kevin Kamto Sonke. Editorial support was provided by Mark Felsenthal, Graeme Littler, Bruce Ross-Larson, and Dana Vorisek. Rosalie Singson Dinglasan provided administrative support. The Global Poverty Working Group provided data and analytical input on extreme poverty and shared prosperity, with special thanks to: Raul Andres Castaneda Aguilar, Aziz Atamanov, Shaohua Chen, Minh Cong Nguyen, Andrew Dabalen, Reno Dewina, Carolina Diaz-Bonilla, Francisco H. G. Ferreira, Roy Katayama, Nandini Krishnan, Leonardo Ramiro Lucchetti, Jose Montes, Rose Mungai, David Locke Newhouse, Monica Yanez Pagans, Ana L. Revenga, Prem Sangraula, Liliana D. Sousa, Hiroki Uematsu, João Pedro Wagner De Azevedo, Christina Wieser, and Nobuo Yoshida. Updated data from the OECD on the multidimensional living standards index is gratefully acknowledged. Comments are gratefully acknowledged from: Jorge A. de Thompson R. Araujo, Luc Christiaensen, Fionna Douglas, Frederico Gil Sander, Aart C. Kraay, Audrey Liounis, Luis-Felipe Lopez-Calva, Ambar Narayan, Mario Negre, Sonia Plaza, Martin Rama, Dilip Ratha, and other colleagues in the World Bank.
Policy Research Notes (PRNs) are prepared under the direction of the World Bank Chief
Economist and Senior Vice President for Development Economics. PRNs combine and distill
existing and new research to inform discussion on topical policy issues. They are aimed at a
broad audience interested in economic policy.
Table of Contents
Executive Summary ........................................................................................................................ 1
Ending Extreme Poverty and Sharing Prosperity: A Snapshot ....................................................... 2
I. Introduction ............................................................................................................................ 3
II. Extreme Poverty: Updated Numbers and Remaining Challenges ......................................... 5
A. Assessing the incidence of poverty ............................................................................... 5
Global poverty continued its decades-long descent ................................................... 5
Global poverty remains high and concentrated ......................................................... 7
B. Accounting for poverty’s depth and breadth .............................................................. 13
Controlling for depth offers new perspectives ......................................................... 13
Multidimensional assessments are complementary ................................................. 18
C. Aspiring to end poverty by 2030 ................................................................................ 23
While attainable, the 2030 target is aspirational ...................................................... 23
Poverty reduction will meet new challenges ........................................................... 24
Deep pockets of dimensionally broad poverty will likely remain ........................... 26
III. Shared Prosperity: Conceptual Issues and Recent Trends ................................................... 27
A. Revisiting the concept of shared prosperity ................................................................ 27
Shared prosperity means multidimensional development ....................................... 28
Equality of opportunity underpins shared prosperity............................................... 29
Consistent, sustainable effort may reduce inequality of outcome ........................... 32
B. Assessing trends in shared prosperity ......................................................................... 33
Growth has become more pro-poor over the past decade ........................................ 33
Recent progress reflects changing drivers of shared prosperity .............................. 37
Significant disparities remain in non-income dimensions ....................................... 40
Past trends may not be sustainable ........................................................................... 43
IV. Ending Extreme Poverty and Sharing Prosperity: Policy Agenda....................................... 48
A. Delineating policy approaches .................................................................................... 48
Growth with equity is essential for meeting the two goals ...................................... 48
The poverty and shared prosperity goals are mutually reinforcing ......................... 49
“More equitable” need not mean “less efficient” .................................................... 50
More sustainable development does not imply lower growth ................................. 51
B. Identifying key policy ingredients .............................................................................. 54
Broad-based growth must be sustained over time ................................................... 55
Investment in human development is key ................................................................ 60
The poor and vulnerable need robust insurance ...................................................... 66
V. Conclusion ........................................................................................................................... 68
References ..................................................................................................................................... 70
Boxes
Box 1. Global poverty estimates based on 2011 PPP data: Methods and challenges………….......10
Box 2. Why poverty in India could be even lower…………………………..................................12
Box 3. Person-equivalent poverty: An intuitive headcount measure that controls for depth……..16
Box 4. Poverty in Latin America: Income-versus consumption-based estimates………………...17
Box 5. Multidimensional poverty measurement: E pluribus unum?..............................................21
Box 6. The Multidimensional Poverty Index: An example ……………………………………22
Box 7. Back to “Basics”: McNamara’s prescient 1972 speech on shared prosperity……………29
Box 8. Who is in the B40?..............................................................................................................52
Box 9. Chile’s growth-with-equity approach ……………………………………………………64
1
Executive Summary
With 2015 marking the transition from the Millennium to the Sustainable Development
Goals, the international community can celebrate many development successes since 2000.
Despite the global financial crisis, economic growth was generally strong and robust. About 1
billion people rose out of extreme poverty. Most developing countries saw solid income growth
for the bottom 40 percent of their income distributions. Millions of children who were unlikely to
survive their fifth birthday passed beyond these critical years and went on to school in ever greater
numbers. The incidence of preventable diseases such as AIDS, malaria, and tuberculosis is falling.
The share of those with access to clean water and better sanitation has risen. Overall, the
Millennium Development Goals played an important role in galvanizing the global development
community, and that experience will help drive the progress toward the achievement of the
Sustainable Development Goals by 2030.
Despite solid development gains, progress has been uneven and significant work remains.
With an estimated 900 million people in 2012 on less than $1.90 a day—the updated international
poverty line—and a projected 700 million in 2015, extreme poverty still remains unacceptably
high. It has also become more concentrated in Sub-Saharan Africa and South Asia. Addressing
moderate poverty and mitigating the vulnerability of falling back into poverty have become more
pressing issues in many countries, especially in those where the bottom 40 percent saw their
incomes decline. Even in a world of single-digit extreme poverty, non-income disparities, like
limited access to quality education and health services, pose a bottleneck to poverty reduction and
shared prosperity. Wider environmental sustainability concerns are a major challenge in much of
the world, both in terms of climate change and the impact on the natural resources upon which
many of the poorest depend, such as water. In sum, while development progress was impressive,
it has been uneven and a large unfinished agenda remains.
Three key challenges stand out: the depth of remaining poverty, the unevenness in shared
prosperity, and the persistent disparities in non-income dimensions of development. First, the
policy discourse needs to focus more directly on the poorest among the poor. While pockets of
ultra-poverty exist around the world, Sub-Saharan Africa is home to most of the deeply poor. To
make depth a more central element in policy formulation, easy-to-communicate measures are
needed—and this note attempts a step in this direction with person-equivalent measures of poverty.
Second, the eradication of poverty in all of its forms requires steady growth of the incomes of the
bottom 40 percent. Yet, economic growth—a key driver of shared prosperity—may not be as
buoyant as before the global financial crisis. Third, unequal progress in non-income dimensions
of development requires addressing widespread inequality of opportunity, which transmits poverty
across generations and erodes the pace and sustainability of progress for the bottom 40. To meet
these challenges, three ingredients are core to the policy agenda: sustaining broad-based growth,
investing in human development, and insuring the poor and vulnerable against emerging risks.
Ending Extreme Poverty and Sharing Prosperity: A Snapshot
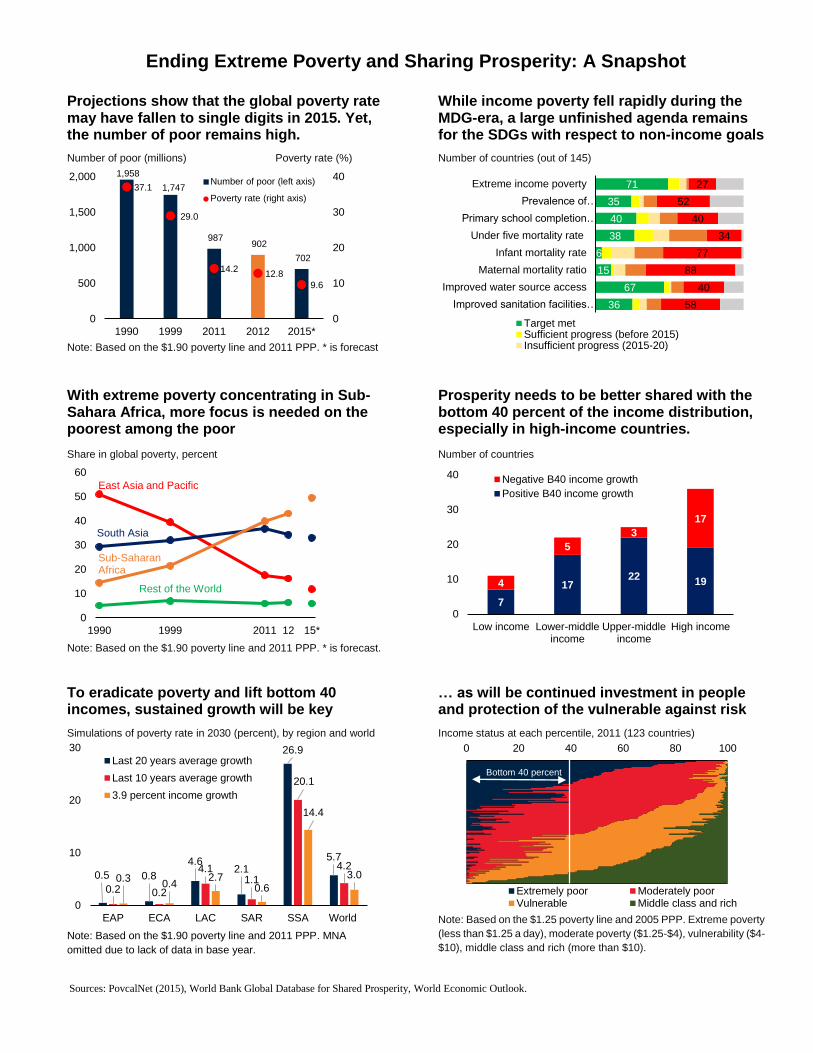
Projections show that the global poverty rate may have fallen to single digits in 2015. Yet, the number of poor remains high.
While income poverty fell rapidly during the MDG-era, a large unfinished agenda remains for the SDGs with respect to non-income goals
Number of poor (millions) Poverty rate (%) Number of countries (out of 145)
Note: Based on the $1.90 poverty line and 2011 PPP. * is forecast
With extreme poverty concentrating in Sub-Sahara Africa, more focus is needed on the poorest among the poor
Prosperity needs to be better shared with the bottom 40 percent of the income distribution, especially in high-income countries.
Share in global poverty, percent Number of countries
Note: Based on the $1.90 poverty line and 2011 PPP. * is forecast.
To eradicate poverty and lift bottom 40 incomes, sustained growth will be key
… as will be continued investment in people and protection of the vulnerable against risk
Simulations of poverty rate in 2030 (percent), by region and world
Note: Based on the $1.90 poverty line and 2011 PPP. MNA
omitted due to lack of data in base year.
Income status at each percentile, 2011 (123 countries)
Note: Based on the $1.25 poverty line and 2005 PPP. Extreme poverty
(less than $1.25 a day), moderate poverty ($1.25-$4), vulnerability ($4-
$10), middle class and rich (more than $10).
Sources: PovcalNet (2015), World Bank Global Database for Shared Prosperity, World Economic Outlook.
1,958
1,747
987 902
702
37.1
29.0
14.212.8
9.6
0
10
20
30
40
0
500
1,000
1,500
2,000
1990 1999 2011 2012 2015*
World
World
Number of poor (left axis)
Poverty rate (right axis)
36
67
15
6
38
40
35
71
58
40
88
77
34
40
52
27
Improved sanitation facilities…
Improved water source access
Maternal mortality ratio
Infant mortality rate
Under five mortality rate
Primary school completion…
Prevalence of…
Extreme income poverty
Target metSufficient progress (before 2015)Insufficient progress (2015-20)
0
10
20
30
40
50
60
1990 1999 2011 12 15*
East Asia and Pacific
South Asia
Sub-Saharan Africa
Rest of the World
7
1722
194
5
3
17
0
10
20
30
40
Low income Lower-middleincome
Upper-middleincome
High income
Negative B40 income growth
Positive B40 income growth
0.5 0.8
4.62.1
26.9
5.7
0.2 0.2
4.11.1
20.1
4.20.3
0.42.7
0.6
14.4
3.0
0
10
20
30
EAP ECA LAC SAR SSA World
Last 20 years average growth
Last 10 years average growth
3.9 percent income growth
0 20 40 60 80 100
Extremely poor Moderately poorVulnerable Middle class and rich
Bottom 40 percent
3
I. Introduction
To guide its work toward a “world free of poverty,” the World Bank Group in 2013
established two clear goals: end extreme poverty by 2030 and promote shared prosperity.
Along with the requirement to pursue these goals sustainably—economically, environmentally,
and socially—the two goals are comprehensive in nature. They are fully aligned to support the
Sustainable Development Goals (SDGs) set by the United Nations to replace the Millennium
Development Goals (MDGs). To evaluate progress, the two goals are measured by two overall
indicators: a reduction in the global headcount ratio of extreme poverty (the population share of
those whose income is below the international poverty line) to 3 percent by 2030, and the
promotion of income growth in the bottom 40 (B40) percent of the population in each country.1
This Policy Research Note updates the assessment of progress toward these two goals in a
sustainable manner. The poverty goal is examined through three lenses: the evolution of income
poverty based on the new international poverty line that has been re-estimated at $1.90 a day; an
assessment of person-equivalent income poverty, a new intuitive indicator that combines the
incidence with the depth of poverty; and a review of the breadth of poverty, recognizing that
income shortfalls often coexist with multiple non-income deprivations. The shared prosperity goal
is examined on the basis of the latest comparison of (comparable) household data on B40 income
growth. As part of its analysis of the two goals, this note also comments on the status of defining
and monitoring sustainability in its economic, environmental and social aspects.2
When measured in all of its dimensions, progress in poverty reduction and shared prosperity
has been significant but uneven. The latest data suggests that global poverty continued its three-
decade descent, but it remains unacceptably high and geographically concentrated. Pockets of very
deep and multidimensional poverty continue to persist, leading to conflicting views about the
extent and pace of progress. As for shared prosperity, solid income growth was observed among
the B40 in many countries—at least until recently and subject to data caveats—but, again,
experiences differed. A large share of countries—including half of high-income countries and a
third of low-income countries in the sample—saw B40 incomes fall. Beyond income, the B40 lags
persistently behind the national top 60 percent (T60) in various non-income indicators.
1 Monetary poverty measures are based on household surveys that measure deprivation on the basis of either income
or consumption data. To simplify, this report refers to “income” poverty for both cases. In a similar vein, most
references to poverty, unless explicitly stated otherwise, are with respect to “extreme” poverty. 2 The availability and the quality of data remain a concern in the assessment of both goals, and the robustness of
underlying methodologies will require continued scrutiny. Increasing the availability and quality of data is a key
priority to strengthen analysis, policy formulation and policy implementation (World Bank 2015e).
4
Contextual factors and uncertainties pose a challenge to the economic and social
sustainability of recent trends. The structural characteristics of the poorest countries make it
harder to reach the remaining poor. Moreover, average income growth, which has been a key driver
of shared prosperity, may not be as buoyant as it was before the global financial crisis, in part
owing to demographics—see World Bank (2015f). In addition, factors that underpinned the recent
rise in B40 income shares may turn out to be transitory or unsustainable. Continued high levels of
inequality in both outcomes and opportunity in both income and non-income dimensions pose
additional sustainability risks.
Less progress has been made in improving the long-term environmental sustainability of
development. Even though some countries have successfully “delinked” trends in environmental
degradation from growth, most have not. The annual cost of environmental degradation—resulting
from externalities due to outdoor and indoor air pollution, water pollution, deforestation, carbon
emissions, and other environmental hazards—has gone up 50 percent from 1990 to 2010, in
constant dollars. Only about 25 percent of the countries in the world, primarily high income
countries, have managed to grow economically while simultaneously decreasing their
environmental externalities.3 Even fewer have managed to delink carbon emissions from growth,
challenging the world’s ability to contain the impacts of future climate change to agreed-upon
levels of acceptability. Therefore, while the experience exists to show that sustainable economic
development is possible, the goal remains difficult to achieve.
This Policy Research Note also examines the policy actions and institutional interventions
needed to accelerate progress on reducing poverty and sharing prosperity. While the two
goals hold general relevance in promoting “growth-with-equity,” their immediate focus is on
populations who are extremely poor and those who constitute the B40—two groups who may in
some countries overlap significantly and in others be distinct. Interventions required to spur
sustainable progress toward both goals interact in multiple ways. Although details and emphasis
will vary across countries, three common ingredients are key to an integrated strategy: sustaining
broad-based growth, investing in human development, and insuring the poor and vulnerable
against evolving risks. As part of the above, natural capital, environmental health, and ecosystem
sustainability need to be fully incorporated into economic decision-making.
3 Forthcoming update of World Bank 2011b. Furthermore, 7.0 million deaths in developing countries in 2010, or 18
percent of total deaths, were due to pollution (IHME 2010).
5
II. Extreme Poverty: Updated Numbers and Remaining Challenges
Ending extreme poverty by 2030 is the first of the World Bank Group’s goals. Ending extreme
poverty is defined as reducing the share of the global population living below the international
poverty line to below 3 percent, with an interim target of 9 percent by 2020. The goal requires a
reduction of almost 10 percentage points from the 2012 level of 12.8 percent. Despite significant
progress toward this goal, the updated global poverty statistics show that poverty levels remain
high and that “business as usual” policies are unlikely to be sufficient to reach the goal.
This section provides a textured understanding of extreme poverty, the progress that is being
made in reducing it, and the remaining challenges that lie ahead. First, it analyzes the
incidence of poverty—the share of the poor in the total population—and provides data based on
updated 2011 purchasing-power-parity (PPP) prices and the re-estimated international poverty
line. Second, it offers complementary perspectives by analyzing the depth and breadth of poverty,
taking into consideration how far a population is from the poverty threshold and in what aspects a
population is disadvantaged other than in ways indicated by income. Third, in light of the above,
it assesses the challenges ahead in reaching the ambitious poverty target by 2030.
A. Assessing the incidence of poverty
Global poverty estimates have been updated to reflect the re-estimated international poverty
line at $1.90 a day, new 2011-based PPP prices and revisions to complementary data.
Reflecting updated purchasing-power-parity prices for 2011, the international poverty line is re-
estimated at $1.90 a day (Ferreira et al. 2015). Ensuring maximum comparability, the new poverty
line is based on the 15 national poverty lines of the same countries that previously defined the
$1.25 line. As currency exchange rates fail to provide for a conversion that maintains equivalent
costs of living across countries, PPP prices provide a unifying standard. Poverty updates also
reflect revisions to complementary data, including population, inflation and national income
accounts. Box 1 discusses the methodology and challenges relating to the transition from 2005 to
2011 PPPs.
Global poverty continued its decades-long descent
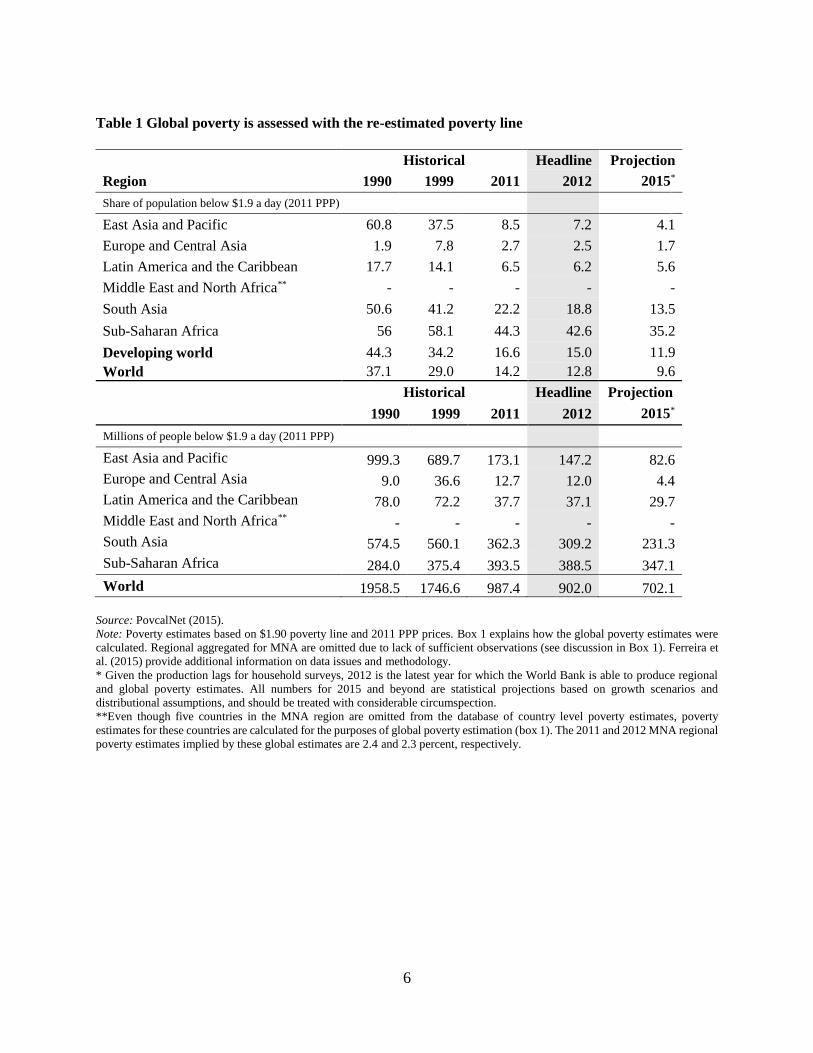
The latest headline estimate for 2012 based on the new data suggests that close to 900 million
people (12.8 percent of global population) lived in extreme poverty (table 1, figures 1a and 1b).
Compared with 2011—the year when PPPs were updated—this number represents continued
poverty reduction, as the headcount estimate then, using 2011 PPP data, was 987 million people
(14.2 percent of global population). While broadly similar to the old estimate for 2011 based on
2005 PPP data, this estimate is some 24 million people lower. Comparison of the 2011 and 2012
data reveals a (modest) decline in the number of poor in Sub-Saharan Africa, heralding hopefully
an era of continued reduction in not just the share of the poor but also their absolute number.
6
Table 1 Global poverty is assessed with the re-estimated poverty line
Historical Headline Projection
Region 1990 1999 2011 2012 2015*
Share of population below $1.9 a day (2011 PPP)
East Asia and Pacific 60.8 37.5 8.5 7.2 4.1
Europe and Central Asia 1.9 7.8 2.7 2.5 1.7
Latin America and the Caribbean 17.7 14.1 6.5 6.2 5.6
Middle East and North Africa** - - - - -
South Asia 50.6 41.2 22.2 18.8 13.5
Sub-Saharan Africa 56 58.1 44.3 42.6 35.2
Developing world 44.3 34.2 16.6 15.0 11.9
World 37.1 29.0 14.2 12.8 9.6
Source: PovcalNet (2015).
Note: Poverty estimates based on $1.90 poverty line and 2011 PPP prices. Box 1 explains how the global poverty estimates were
calculated. Regional aggregated for MNA are omitted due to lack of sufficient observations (see discussion in Box 1). Ferreira et
al. (2015) provide additional information on data issues and methodology.
* Given the production lags for household surveys, 2012 is the latest year for which the World Bank is able to produce regional
and global poverty estimates. All numbers for 2015 and beyond are statistical projections based on growth scenarios and
distributional assumptions, and should be treated with considerable circumspection.
**Even though five countries in the MNA region are omitted from the database of country level poverty estimates, poverty
estimates for these countries are calculated for the purposes of global poverty estimation (box 1). The 2011 and 2012 MNA regional
poverty estimates implied by these global estimates are 2.4 and 2.3 percent, respectively.
Historical Headline Projection
1990 1999 2011 2012 2015*
Millions of people below $1.9 a day (2011 PPP)
East Asia and Pacific 999.3 689.7 173.1 147.2 82.6
Europe and Central Asia 9.0 36.6 12.7 12.0 4.4
Latin America and the Caribbean 78.0 72.2 37.7 37.1 29.7
Middle East and North Africa** - - - - -
South Asia 574.5 560.1 362.3 309.2 231.3
Sub-Saharan Africa 284.0 375.4 393.5 388.5 347.1
World 1958.5 1746.6 987.4 902.0 702.1
7
The recent decline of global poverty occurs against a backdrop of a decades-long descent.
Comparisons with the data available for 1990 and 1999 confirm that the world has made rapid
strides forward in poverty reduction since 1990 (table 1). The proportion of global population
living on less than $ 1.90 a day in 2012 was about a third of what it was in 1990.4 This confirms
that the first Millennium Development Goal (MDG) target—cutting the extreme poverty rate to
half of its 1990 level—was met well before its 2015 target date. From a broader historical
perspective, the global poverty rate has fallen by approximately 1 percentage point a year since
1990, with rapid poverty reduction in China and India playing a central role in this outcome.
Tentative projections for global poverty in 2015 suggest that the global headcount may have
reached 700 million, leading to a poverty rate of 9.6 percent. Compared with the headline
estimate of 2012, poverty may thus have declined by a further 200 million people (some 80 million
of whom were in South Asia, about 65 million in East Asia and the Pacific, and close to 40 million
in Sub-Saharan Africa). The projections extrapolate poverty estimates based on growth scenarios
and distributional assumptions. Given that the data collection and process for a nationally
representative household survey, on which poverty estimates are based, usually takes 2-3 years,
the 2012 number remains the most reliable recent headline poverty estimate.
Global poverty remains high and concentrated
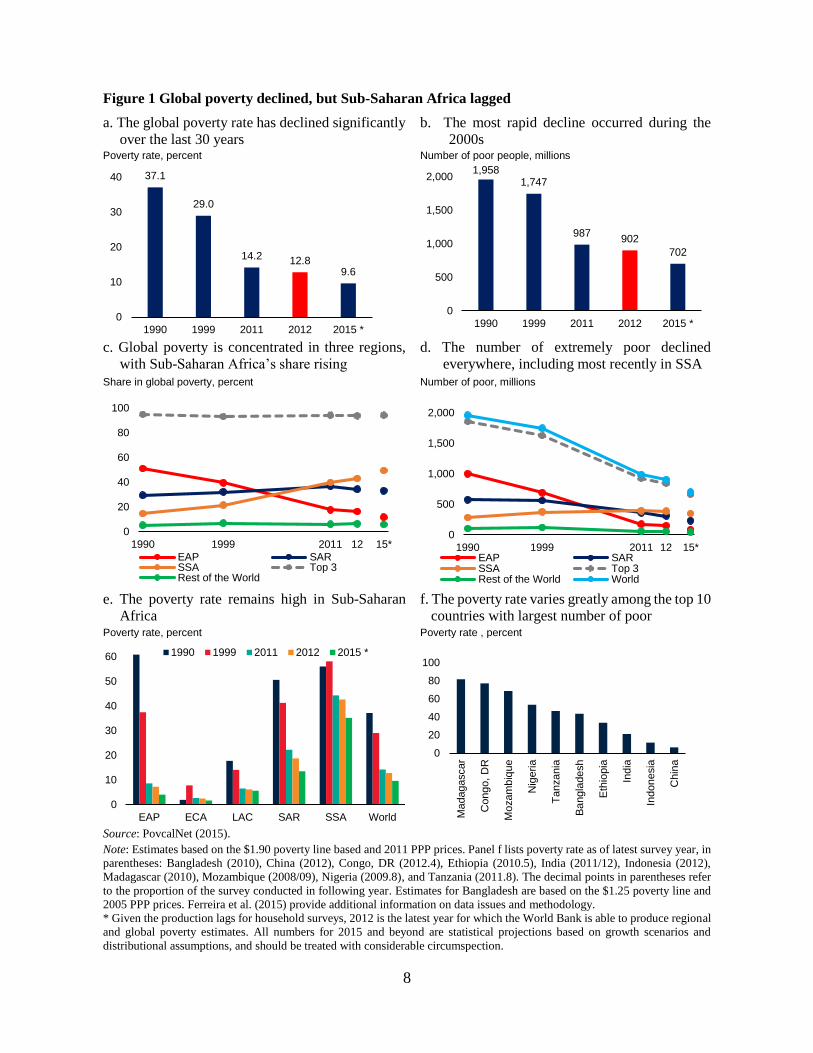
Poverty levels remain unacceptably high and are particularly concentrated in Sub-Saharan
Africa and South Asia. For several decades, the same three regions account for some 95 percent
of global poverty: East Asia and Pacific, South Asia, and Sub-Saharan Africa. The latest 2012
estimates confirm this high degree of concentration (figure 1c and d). Yet, the composition of
global poverty across these three regions has shifted over the years. The share of Sub-Saharan
Africa in global poverty has risen to 43 percent alongside a slower pace of poverty reduction in
this region amidst rapid population growth. The poverty rate fell only from 56 to 42.6 percent
between 1990 and 2012 (figure 1e). South Asia achieved more rapid poverty reduction over the
past 30 years, even though it is still home to about a third of the world’s poor.
Despite significant geographic concentration, the poverty rate varies widely across the 10
countries with the greatest number of poor people. The estimates for 2012 indicate that the 10
countries with the highest number of the extremely poor account for almost 70 percent of global
poverty. Yet, their poverty rates (as of the latest household survey, i.e. not necessarily 2012) vary
substantially (figure 1f). India was home to the largest number of poor in 2012, but its poverty rate
is one of the lowest among those countries with the largest number of poor. A new methodology
applied to household surveys in India suggests that its poverty rate could be even lower (box 2).
4 Based on the international poverty line of $ 1.90 a day (2011 PPP). A similar trend is observed when comparing
1990 with 2011 using a poverty line of $ 1.25 a day (2005 PPP).
8
Figure 1 Global poverty declined, but Sub-Saharan Africa lagged
a. The global poverty rate has declined significantly
over the last 30 years
b. The most rapid decline occurred during the
2000s Poverty rate, percent Number of poor people, millions
c. Global poverty is concentrated in three regions,
with Sub-Saharan Africa’s share rising
d. The number of extremely poor declined
everywhere, including most recently in SSA
Share in global poverty, percent Number of poor, millions
e. The poverty rate remains high in Sub-Saharan
Africa
f. The poverty rate varies greatly among the top 10
countries with largest number of poor Poverty rate, percent Poverty rate , percent
Source: PovcalNet (2015).
Note: Estimates based on the $1.90 poverty line based and 2011 PPP prices. Panel f lists poverty rate as of latest survey year, in
parentheses: Bangladesh (2010), China (2012), Congo, DR (2012.4), Ethiopia (2010.5), India (2011/12), Indonesia (2012),
Madagascar (2010), Mozambique (2008/09), Nigeria (2009.8), and Tanzania (2011.8). The decimal points in parentheses refer
to the proportion of the survey conducted in following year. Estimates for Bangladesh are based on the $1.25 poverty line and
2005 PPP prices. Ferreira et al. (2015) provide additional information on data issues and methodology.
* Given the production lags for household surveys, 2012 is the latest year for which the World Bank is able to produce regional
and global poverty estimates. All numbers for 2015 and beyond are statistical projections based on growth scenarios and
distributional assumptions, and should be treated with considerable circumspection.
37.1
29.0
14.2 12.89.6
0
10
20
30
40
1990 1999 2011 2012 2015 *
1,9581,747
987902
702
0
500
1,000
1,500
2,000
1990 1999 2011 2012 2015 *
0
20
40
60
80
100
1990 1999 2011 12 15*
EAP SARSSA Top 3Rest of the World
0
500
1,000
1,500
2,000
1990 1999 2011 12 15*EAP SARSSA Top 3Rest of the World World
0
10
20
30
40
50
60
EAP ECA LAC SAR SSA World
1990 1999 2011 2012 2015 *
0
20
40
60
80
100C
hin
a
Indonesia
India
Eth
iopia
Ba
ngla
desh
Ta
nzania
Nig
eria
Mo
zam
biq
ue
Con
go
, D
R
Ma
dagascar
9
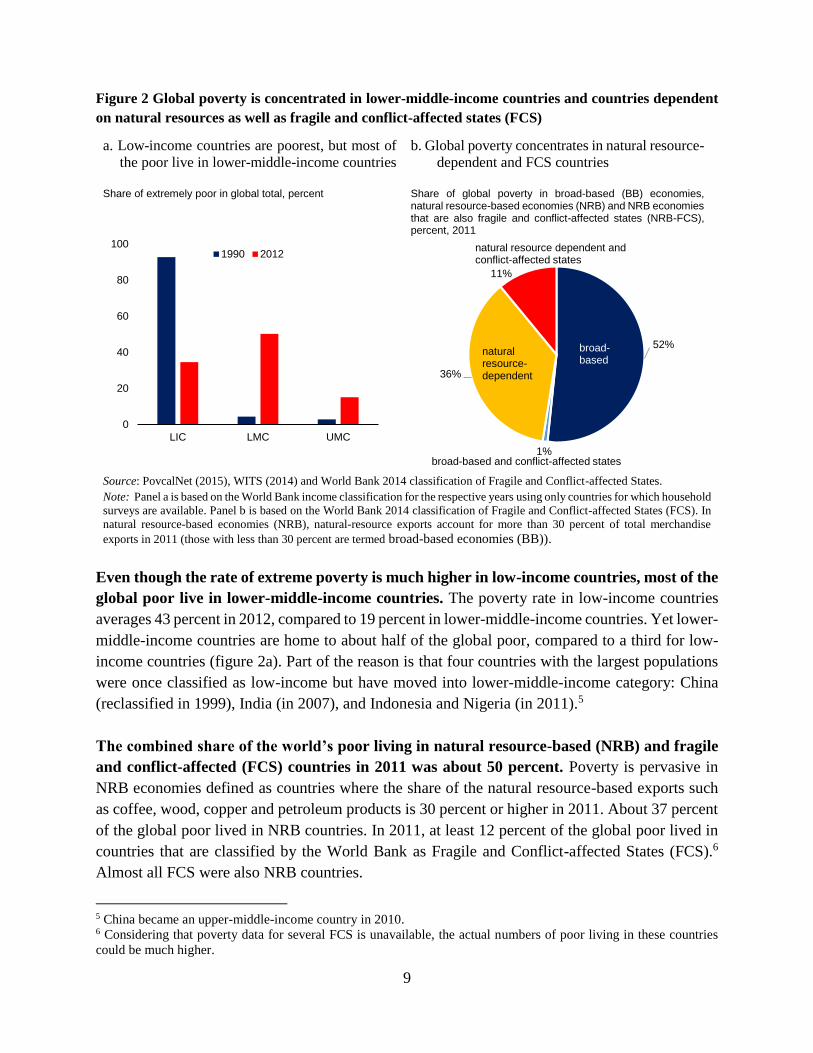
Figure 2 Global poverty is concentrated in lower-middle-income countries and countries dependent
on natural resources as well as fragile and conflict-affected states (FCS)
a. Low-income countries are poorest, but most of
the poor live in lower-middle-income countries
b. Global poverty concentrates in natural resource-
dependent and FCS countries
Share of extremely poor in global total, percent Share of global poverty in broad-based (BB) economies, natural resource-based economies (NRB) and NRB economies that are also fragile and conflict-affected states (NRB-FCS), percent, 2011
Source: PovcalNet (2015), WITS (2014) and World Bank 2014 classification of Fragile and Conflict-affected States.
Note: Panel a is based on the World Bank income classification for the respective years using only countries for which household
surveys are available. Panel b is based on the World Bank 2014 classification of Fragile and Conflict-affected States (FCS). In
natural resource-based economies (NRB), natural-resource exports account for more than 30 percent of total merchandise
exports in 2011 (those with less than 30 percent are termed broad-based economies (BB)).
Even though the rate of extreme poverty is much higher in low-income countries, most of the
global poor live in lower-middle-income countries. The poverty rate in low-income countries
averages 43 percent in 2012, compared to 19 percent in lower-middle-income countries. Yet lower-
middle-income countries are home to about half of the global poor, compared to a third for low-
income countries (figure 2a). Part of the reason is that four countries with the largest populations
were once classified as low-income but have moved into lower-middle-income category: China
(reclassified in 1999), India (in 2007), and Indonesia and Nigeria (in 2011).5
The combined share of the world’s poor living in natural resource-based (NRB) and fragile
and conflict-affected (FCS) countries in 2011 was about 50 percent. Poverty is pervasive in
NRB economies defined as countries where the share of the natural resource-based exports such
as coffee, wood, copper and petroleum products is 30 percent or higher in 2011. About 37 percent
of the global poor lived in NRB countries. In 2011, at least 12 percent of the global poor lived in
countries that are classified by the World Bank as Fragile and Conflict-affected States (FCS).6
Almost all FCS were also NRB countries.
5 China became an upper-middle-income country in 2010. 6 Considering that poverty data for several FCS is unavailable, the actual numbers of poor living in these countries
could be much higher.
0
20
40
60
80
100
LIC LMC UMC
1990 2012
52%
1%
36%
11%
natural resource-dependent
broad-based
natural resource dependent and conflict-affected states
broad-based and conflict-affected states
10
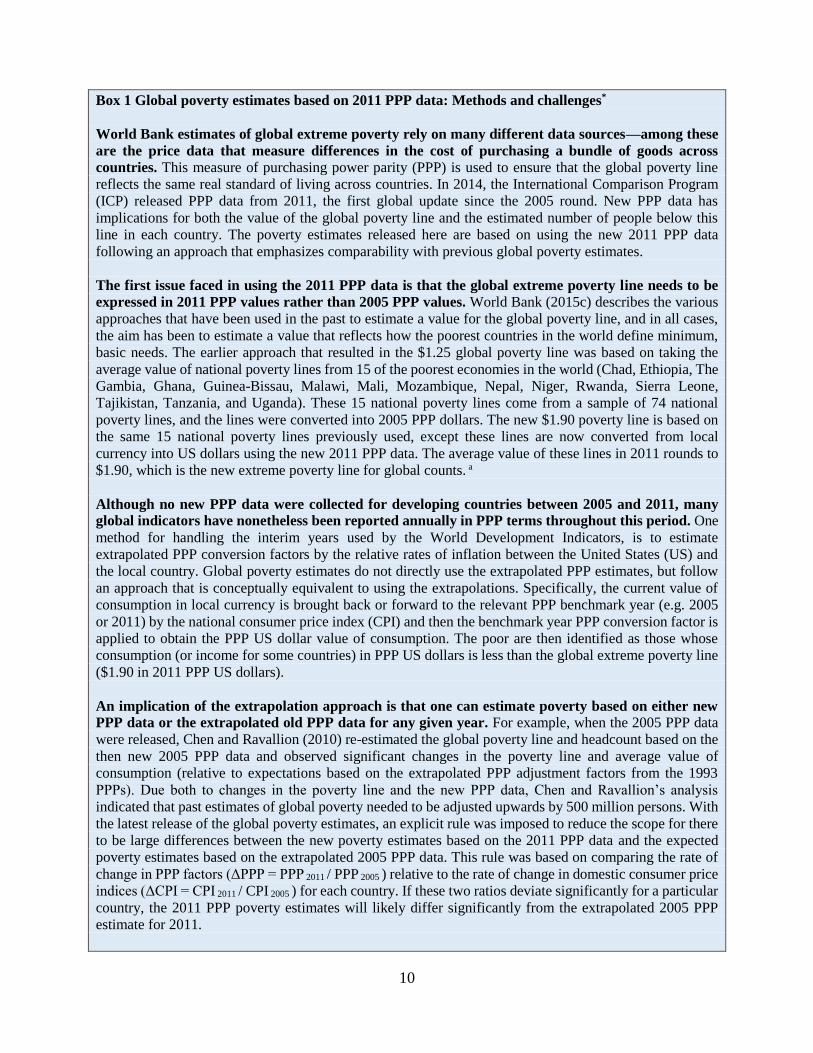
Box 1 Global poverty estimates based on 2011 PPP data: Methods and challenges*
World Bank estimates of global extreme poverty rely on many different data sources—among these
are the price data that measure differences in the cost of purchasing a bundle of goods across
countries. This measure of purchasing power parity (PPP) is used to ensure that the global poverty line
reflects the same real standard of living across countries. In 2014, the International Comparison Program
(ICP) released PPP data from 2011, the first global update since the 2005 round. New PPP data has
implications for both the value of the global poverty line and the estimated number of people below this
line in each country. The poverty estimates released here are based on using the new 2011 PPP data
following an approach that emphasizes comparability with previous global poverty estimates.
The first issue faced in using the 2011 PPP data is that the global extreme poverty line needs to be
expressed in 2011 PPP values rather than 2005 PPP values. World Bank (2015c) describes the various
approaches that have been used in the past to estimate a value for the global poverty line, and in all cases,
the aim has been to estimate a value that reflects how the poorest countries in the world define minimum,
basic needs. The earlier approach that resulted in the $1.25 global poverty line was based on taking the
average value of national poverty lines from 15 of the poorest economies in the world (Chad, Ethiopia, The
Gambia, Ghana, Guinea-Bissau, Malawi, Mali, Mozambique, Nepal, Niger, Rwanda, Sierra Leone,
Tajikistan, Tanzania, and Uganda). These 15 national poverty lines come from a sample of 74 national
poverty lines, and the lines were converted into 2005 PPP dollars. The new $1.90 poverty line is based on
the same 15 national poverty lines previously used, except these lines are now converted from local
currency into US dollars using the new 2011 PPP data. The average value of these lines in 2011 rounds to
$1.90, which is the new extreme poverty line for global counts. a
Although no new PPP data were collected for developing countries between 2005 and 2011, many
global indicators have nonetheless been reported annually in PPP terms throughout this period. One
method for handling the interim years used by the World Development Indicators, is to estimate
extrapolated PPP conversion factors by the relative rates of inflation between the United States (US) and
the local country. Global poverty estimates do not directly use the extrapolated PPP estimates, but follow
an approach that is conceptually equivalent to using the extrapolations. Specifically, the current value of
consumption in local currency is brought back or forward to the relevant PPP benchmark year (e.g. 2005
or 2011) by the national consumer price index (CPI) and then the benchmark year PPP conversion factor is
applied to obtain the PPP US dollar value of consumption. The poor are then identified as those whose
consumption (or income for some countries) in PPP US dollars is less than the global extreme poverty line
($1.90 in 2011 PPP US dollars).
An implication of the extrapolation approach is that one can estimate poverty based on either new
PPP data or the extrapolated old PPP data for any given year. For example, when the 2005 PPP data
were released, Chen and Ravallion (2010) re-estimated the global poverty line and headcount based on the
then new 2005 PPP data and observed significant changes in the poverty line and average value of
consumption (relative to expectations based on the extrapolated PPP adjustment factors from the 1993
PPPs). Due both to changes in the poverty line and the new PPP data, Chen and Ravallion’s analysis
indicated that past estimates of global poverty needed to be adjusted upwards by 500 million persons. With
the latest release of the global poverty estimates, an explicit rule was imposed to reduce the scope for there
to be large differences between the new poverty estimates based on the 2011 PPP data and the expected
poverty estimates based on the extrapolated 2005 PPP data. This rule was based on comparing the rate of
change in PPP factors (ΔPPP = PPP 2011 / PPP 2005 ) relative to the rate of change in domestic consumer price
indices (ΔCPI = CPI 2011 / CPI 2005 ) for each country. If these two ratios deviate significantly for a particular
country, the 2011 PPP poverty estimates will likely differ significantly from the extrapolated 2005 PPP
estimate for 2011.
11
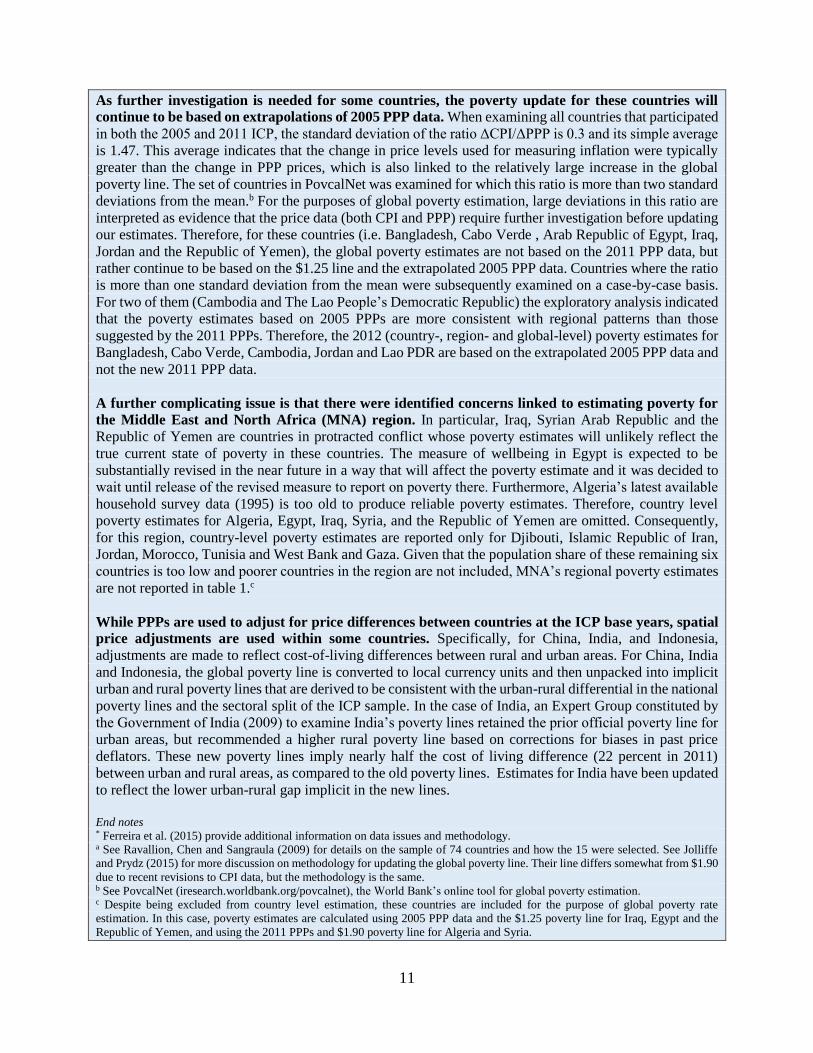
As further investigation is needed for some countries, the poverty update for these countries will
continue to be based on extrapolations of 2005 PPP data. When examining all countries that participated
in both the 2005 and 2011 ICP, the standard deviation of the ratio ΔCPI/ΔPPP is 0.3 and its simple average
is 1.47. This average indicates that the change in price levels used for measuring inflation were typically
greater than the change in PPP prices, which is also linked to the relatively large increase in the global
poverty line. The set of countries in PovcalNet was examined for which this ratio is more than two standard
deviations from the mean.b For the purposes of global poverty estimation, large deviations in this ratio are
interpreted as evidence that the price data (both CPI and PPP) require further investigation before updating
our estimates. Therefore, for these countries (i.e. Bangladesh, Cabo Verde , Arab Republic of Egypt, Iraq,
Jordan and the Republic of Yemen), the global poverty estimates are not based on the 2011 PPP data, but
rather continue to be based on the $1.25 line and the extrapolated 2005 PPP data. Countries where the ratio
is more than one standard deviation from the mean were subsequently examined on a case-by-case basis.
For two of them (Cambodia and The Lao People’s Democratic Republic) the exploratory analysis indicated
that the poverty estimates based on 2005 PPPs are more consistent with regional patterns than those
suggested by the 2011 PPPs. Therefore, the 2012 (country-, region- and global-level) poverty estimates for
Bangladesh, Cabo Verde, Cambodia, Jordan and Lao PDR are based on the extrapolated 2005 PPP data and
not the new 2011 PPP data.
A further complicating issue is that there were identified concerns linked to estimating poverty for
the Middle East and North Africa (MNA) region. In particular, Iraq, Syrian Arab Republic and the
Republic of Yemen are countries in protracted conflict whose poverty estimates will unlikely reflect the
true current state of poverty in these countries. The measure of wellbeing in Egypt is expected to be
substantially revised in the near future in a way that will affect the poverty estimate and it was decided to
wait until release of the revised measure to report on poverty there. Furthermore, Algeria’s latest available
household survey data (1995) is too old to produce reliable poverty estimates. Therefore, country level
poverty estimates for Algeria, Egypt, Iraq, Syria, and the Republic of Yemen are omitted. Consequently,
for this region, country-level poverty estimates are reported only for Djibouti, Islamic Republic of Iran,
Jordan, Morocco, Tunisia and West Bank and Gaza. Given that the population share of these remaining six
countries is too low and poorer countries in the region are not included, MNA’s regional poverty estimates
are not reported in table 1.c
While PPPs are used to adjust for price differences between countries at the ICP base years, spatial
price adjustments are used within some countries. Specifically, for China, India, and Indonesia,
adjustments are made to reflect cost-of-living differences between rural and urban areas. For China, India
and Indonesia, the global poverty line is converted to local currency units and then unpacked into implicit
urban and rural poverty lines that are derived to be consistent with the urban-rural differential in the national
poverty lines and the sectoral split of the ICP sample. In the case of India, an Expert Group constituted by
the Government of India (2009) to examine India’s poverty lines retained the prior official poverty line for
urban areas, but recommended a higher rural poverty line based on corrections for biases in past price
deflators. These new poverty lines imply nearly half the cost of living difference (22 percent in 2011)
between urban and rural areas, as compared to the old poverty lines. Estimates for India have been updated
to reflect the lower urban-rural gap implicit in the new lines.
End notes * Ferreira et al. (2015) provide additional information on data issues and methodology. a See Ravallion, Chen and Sangraula (2009) for details on the sample of 74 countries and how the 15 were selected. See Jolliffe
and Prydz (2015) for more discussion on methodology for updating the global poverty line. Their line differs somewhat from $1.90
due to recent revisions to CPI data, but the methodology is the same. b See PovcalNet (iresearch.worldbank.org/povcalnet), the World Bank’s online tool for global poverty estimation. c Despite being excluded from country level estimation, these countries are included for the purpose of global poverty rate
estimation. In this case, poverty estimates are calculated using 2005 PPP data and the $1.25 poverty line for Iraq, Egypt and the
Republic of Yemen, and using the 2011 PPPs and $1.90 poverty line for Algeria and Syria.
12
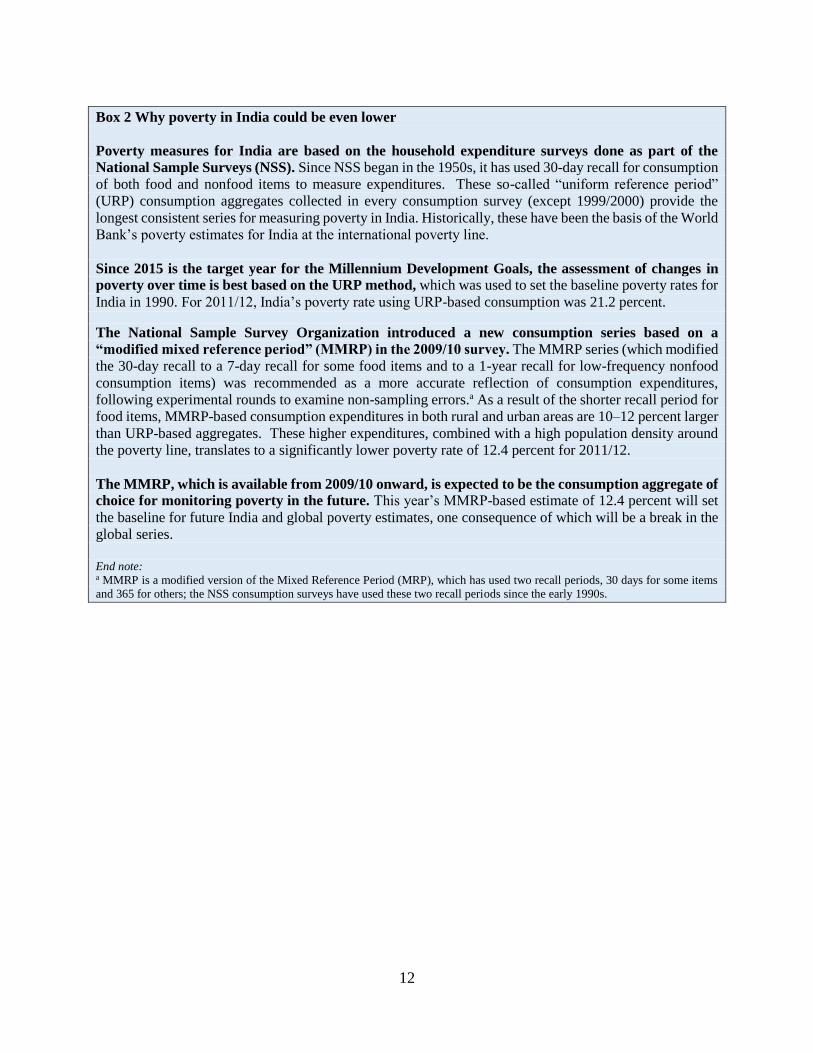
Box 2 Why poverty in India could be even lower
Poverty measures for India are based on the household expenditure surveys done as part of the
National Sample Surveys (NSS). Since NSS began in the 1950s, it has used 30-day recall for consumption
of both food and nonfood items to measure expenditures. These so-called “uniform reference period”
(URP) consumption aggregates collected in every consumption survey (except 1999/2000) provide the
longest consistent series for measuring poverty in India. Historically, these have been the basis of the World
Bank’s poverty estimates for India at the international poverty line.
Since 2015 is the target year for the Millennium Development Goals, the assessment of changes in
poverty over time is best based on the URP method, which was used to set the baseline poverty rates for
India in 1990. For 2011/12, India’s poverty rate using URP-based consumption was 21.2 percent. The National Sample Survey Organization introduced a new consumption series based on a
“modified mixed reference period” (MMRP) in the 2009/10 survey. The MMRP series (which modified
the 30-day recall to a 7-day recall for some food items and to a 1-year recall for low-frequency nonfood
consumption items) was recommended as a more accurate reflection of consumption expenditures,
following experimental rounds to examine non-sampling errors.a As a result of the shorter recall period for
food items, MMRP-based consumption expenditures in both rural and urban areas are 10–12 percent larger
than URP-based aggregates. These higher expenditures, combined with a high population density around
the poverty line, translates to a significantly lower poverty rate of 12.4 percent for 2011/12.
The MMRP, which is available from 2009/10 onward, is expected to be the consumption aggregate of
choice for monitoring poverty in the future. This year’s MMRP-based estimate of 12.4 percent will set
the baseline for future India and global poverty estimates, one consequence of which will be a break in the
global series.
End note: a MMRP is a modified version of the Mixed Reference Period (MRP), which has used two recall periods, 30 days for some items
and 365 for others; the NSS consumption surveys have used these two recall periods since the early 1990s.
13
B. Accounting for poverty’s depth and breadth
Are all extremely poor populations the same? No, conditions can vary significantly across
extremely poor populations. The poor do not experience poverty as an “either-or” concept but as
a continuum of intensities ranging from bad to far worse. This section captures these different
intensities of poverty by looking into its depth and breadth.
Controlling for depth offers new perspectives
A new variety of poverty measures—person-equivalent headcounts—is presented that count
the poor while controlling for depth (box 3). The new measures are closely related to poverty
gap measures, but their numerical values have intuitive meanings as headcounts that control for
the condition of the poor. Traditional headcounts can mislead when conditions of the poor change
significantly. Person-equivalent headcounts benchmark the initial conditions of the poor; this
benchmark is then used as a measuring rod to count the number of standardized poor or person-
equivalents (Castleman, Foster and Smith, 2015). A person who is twice as deeply poor as the
standardized poor person is counted as two person-equivalents. Conversely, a person who is half
as deeply poor would be counted as half a person-equivalent. The poverty headcount is then simply
the sum of all person-equivalents.
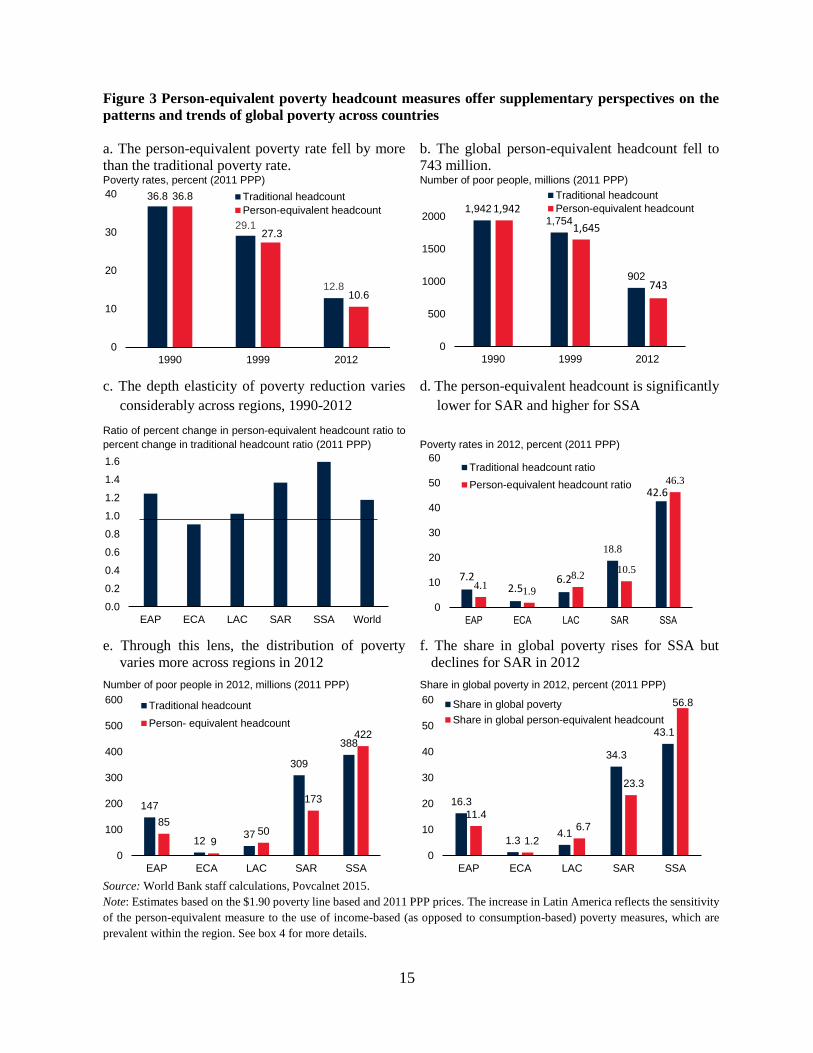
As did the traditional poverty rate, the person-equivalent poverty rate fell significantly
between 1990 and 2012, and much of this decline occurred during the 2000s (figure 3a).
Benchmarked against the global average depth of poverty in 1990, the person-equivalent
headcount declined by more than the traditional poverty headcount as the average depth of poverty
also fell over this period (figure 3b). While the global numbers are by design the same in the
benchmark year, by 2012 there were 743.4 million person-equivalent headcounts, some 17.6
percent less than the traditional headcount of 901.9 million. The same pattern holds for the poverty
rate—the headcount as a ratio of total population. By 2012, the global person-equivalent poverty
rate was 10.6 percent, some 2.2 percentage points lower than the traditional poverty rate.
As indicated by the “depth elasticity”, the world registered different degrees of progress in
translating traditional poverty reduction into person-equivalent poverty reduction (figure
3c).7 The depth elasticity measures the percentage-point reduction in the person-equivalent
headcount ratio as the result of a 1 percentage-point reduction in the traditional headcount ratio.
Globally, the depth elasticity between 1990 and 2012 was 1.18, suggesting that the reductions in
traditional poverty rates were accompanied by even-larger reductions in person-equivalent terms.
The regional depth elasticities confirm that poverty reduction in especially SSA, SAR and EAP
7 To evaluate the inclusiveness of growth, it is useful to examine how the rate of average income growth transmits
into changes in poverty alleviation. The depth elasticity compares the growth elasticities of the person-equivalent and
traditional headcount ratios. It also indicates how well changes in the traditional headcount predict changes in the
person-equivalent measure (Castleman, Foster, and Smith 2015).

14
was accompanied by a much-larger reduction in person-equivalent terms over this period. This
reflects the good progress made over this longer period of time not only in reducing the number of
poor but also the depth of poverty.
The person-equivalent lens sheds a different light on the geographical distribution of poverty
as of 2012 (figures 3d, 3e, and 3f). First, it suggests that, when accounting for depth, the person-
equivalent poverty rate is much higher in Sub-Saharan Africa than the traditional poverty rate
because the depth of poverty is larger compared with other regions. South Asia’s person-equivalent
poverty rate is lower than its traditional poverty rate, suggesting that the depth of poverty is smaller
relative to other parts of the world. The person-equivalent poverty rate in Latin American and the
Caribbean is larger than the traditional headcount poverty rate, which is partially due to the
prevalence of income-based household survey data in that region (box 4). Second, expressed as a
share of global poverty, the geographical concentration of global poverty shifts further to Sub-
Saharan Africa under the person-equivalent measure, with the region accounting for some 56.7
percent of global poverty, whereas the relative importance of both South Asia and East Asia and
Pacific declines.
While these results provide insightful perspectives, they need to be interpreted with caution
and complemented with additional analysis of observed patterns and trends. For example,
greater poverty depth—and lower depth elasticity—may be linked to whether poverty is measured
using income or consumption data (again, see box 4). The estimates shown above for Latin
America and the Caribbean, for example, are generally based on income data. Yet in the countries
of the region where both income and consumption data are available, the incidence, depth, and
severity of poverty are greater for income than for consumption expenditure. Income data are more
susceptible to measurement error and temporary fluctuation. Moreover, poor households have an
incentive to employ some form of saving mechanism to smooth income shocks.
15
Figure 3 Person-equivalent poverty headcount measures offer supplementary perspectives on the
patterns and trends of global poverty across countries
a. The person-equivalent poverty rate fell by more
than the traditional poverty rate.
b. The global person-equivalent headcount fell to
743 million. Poverty rates, percent (2011 PPP) Number of poor people, millions (2011 PPP)
c. The depth elasticity of poverty reduction varies
considerably across regions, 1990-2012
d. The person-equivalent headcount is significantly
lower for SAR and higher for SSA
Ratio of percent change in person-equivalent headcount ratio to
percent change in traditional headcount ratio (2011 PPP)
Poverty rates in 2012, percent (2011 PPP)
e. Through this lens, the distribution of poverty
varies more across regions in 2012
f. The share in global poverty rises for SSA but
declines for SAR in 2012
Number of poor people in 2012, millions (2011 PPP) Share in global poverty in 2012, percent (2011 PPP)
Source: World Bank staff calculations, Povcalnet 2015.
Note: Estimates based on the $1.90 poverty line based and 2011 PPP prices. The increase in Latin America reflects the sensitivity
of the person-equivalent measure to the use of income-based (as opposed to consumption-based) poverty measures, which are
prevalent within the region. See box 4 for more details.
36.8
29.1
12.8
36.8
27.3
10.6
0
10
20
30
40
1990 1999 2012
Traditional headcount
Person-equivalent headcount 1,9421,754
902
1,942
1,645
743
0
500
1000
1500
2000
1990 1999 2012
Traditional headcount
Person-equivalent headcount
0.0
0.2
0.4
0.6
0.8
1.0
1.2
1.4
1.6
EAP ECA LAC SAR SSA World
7.22.5
6.2
18.8
42.6
4.11.9
8.210.5
46.3
0
10
20
30
40
50
60
EAP ECA LAC SAR SSA
Traditional headcount ratio
Person-equivalent headcount ratio
147
1237
309
388
85
950
173
422
0
100
200
300
400
500
600
EAP ECA LAC SAR SSA
Traditional headcount
Person- equivalent headcount
16.3
1.34.1
34.3
43.1
11.4
1.2
6.7
23.3
56.8
0
10
20
30
40
50
60
EAP ECA LAC SAR SSA
Share in global poverty
Share in global person-equivalent headcount
16
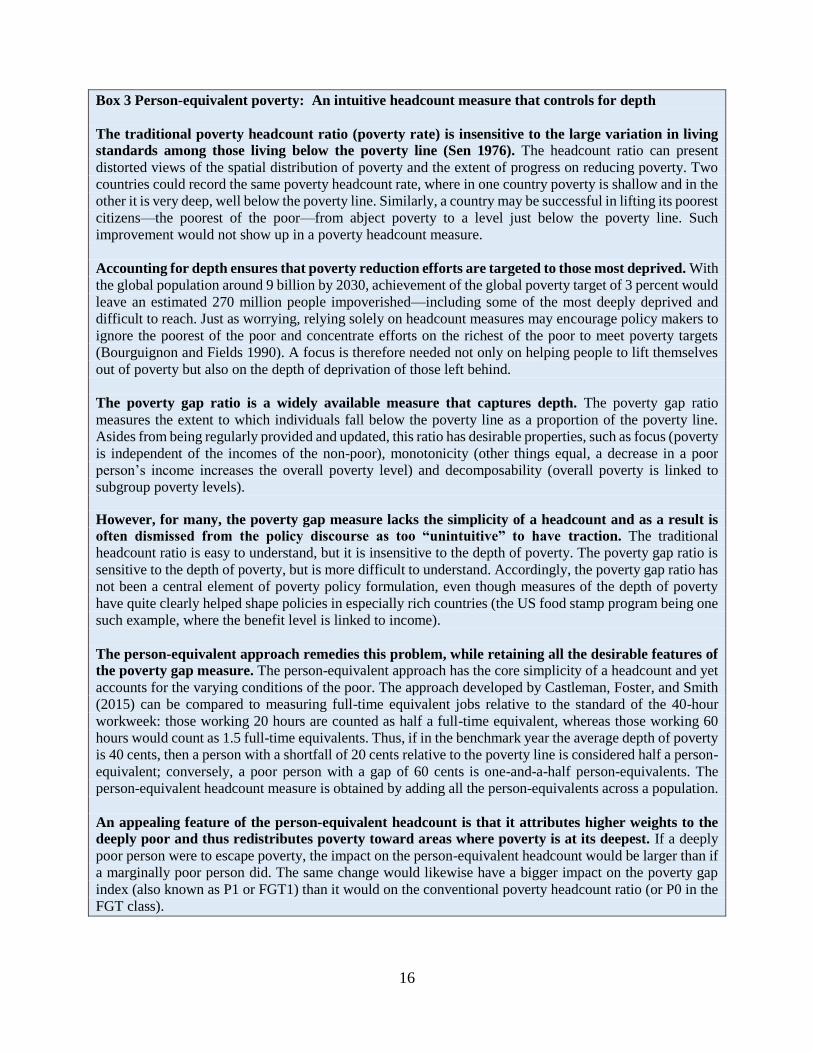
Box 3 Person-equivalent poverty: An intuitive headcount measure that controls for depth
The traditional poverty headcount ratio (poverty rate) is insensitive to the large variation in living
standards among those living below the poverty line (Sen 1976). The headcount ratio can present
distorted views of the spatial distribution of poverty and the extent of progress on reducing poverty. Two
countries could record the same poverty headcount rate, where in one country poverty is shallow and in the
other it is very deep, well below the poverty line. Similarly, a country may be successful in lifting its poorest
citizens—the poorest of the poor—from abject poverty to a level just below the poverty line. Such
improvement would not show up in a poverty headcount measure.
Accounting for depth ensures that poverty reduction efforts are targeted to those most deprived. With
the global population around 9 billion by 2030, achievement of the global poverty target of 3 percent would
leave an estimated 270 million people impoverished—including some of the most deeply deprived and
difficult to reach. Just as worrying, relying solely on headcount measures may encourage policy makers to
ignore the poorest of the poor and concentrate efforts on the richest of the poor to meet poverty targets
(Bourguignon and Fields 1990). A focus is therefore needed not only on helping people to lift themselves
out of poverty but also on the depth of deprivation of those left behind.
The poverty gap ratio is a widely available measure that captures depth. The poverty gap ratio
measures the extent to which individuals fall below the poverty line as a proportion of the poverty line.
Asides from being regularly provided and updated, this ratio has desirable properties, such as focus (poverty
is independent of the incomes of the non-poor), monotonicity (other things equal, a decrease in a poor
person’s income increases the overall poverty level) and decomposability (overall poverty is linked to
subgroup poverty levels).
However, for many, the poverty gap measure lacks the simplicity of a headcount and as a result is
often dismissed from the policy discourse as too “unintuitive” to have traction. The traditional
headcount ratio is easy to understand, but it is insensitive to the depth of poverty. The poverty gap ratio is
sensitive to the depth of poverty, but is more difficult to understand. Accordingly, the poverty gap ratio has
not been a central element of poverty policy formulation, even though measures of the depth of poverty
have quite clearly helped shape policies in especially rich countries (the US food stamp program being one
such example, where the benefit level is linked to income).
The person-equivalent approach remedies this problem, while retaining all the desirable features of
the poverty gap measure. The person-equivalent approach has the core simplicity of a headcount and yet
accounts for the varying conditions of the poor. The approach developed by Castleman, Foster, and Smith
(2015) can be compared to measuring full-time equivalent jobs relative to the standard of the 40-hour
workweek: those working 20 hours are counted as half a full-time equivalent, whereas those working 60
hours would count as 1.5 full-time equivalents. Thus, if in the benchmark year the average depth of poverty
is 40 cents, then a person with a shortfall of 20 cents relative to the poverty line is considered half a person-
equivalent; conversely, a poor person with a gap of 60 cents is one-and-a-half person-equivalents. The
person-equivalent headcount measure is obtained by adding all the person-equivalents across a population.
An appealing feature of the person-equivalent headcount is that it attributes higher weights to the
deeply poor and thus redistributes poverty toward areas where poverty is at its deepest. If a deeply
poor person were to escape poverty, the impact on the person-equivalent headcount would be larger than if
a marginally poor person did. The same change would likewise have a bigger impact on the poverty gap
index (also known as P1 or FGT1) than it would on the conventional poverty headcount ratio (or P0 in the
FGT class).
17
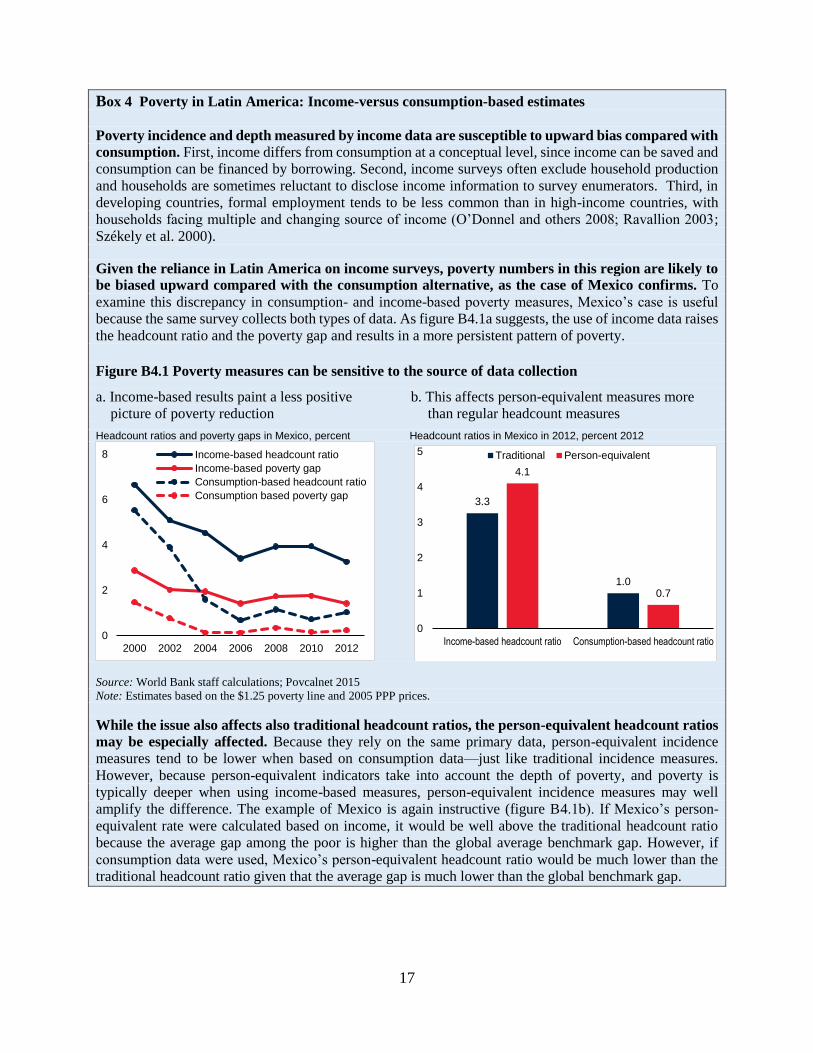
Box 4 Poverty in Latin America: Income-versus consumption-based estimates
Poverty incidence and depth measured by income data are susceptible to upward bias compared with
consumption. First, income differs from consumption at a conceptual level, since income can be saved and
consumption can be financed by borrowing. Second, income surveys often exclude household production
and households are sometimes reluctant to disclose income information to survey enumerators. Third, in
developing countries, formal employment tends to be less common than in high-income countries, with
households facing multiple and changing source of income (O’Donnel and others 2008; Ravallion 2003;
Székely et al. 2000).
Given the reliance in Latin America on income surveys, poverty numbers in this region are likely to
be biased upward compared with the consumption alternative, as the case of Mexico confirms. To
examine this discrepancy in consumption- and income-based poverty measures, Mexico’s case is useful
because the same survey collects both types of data. As figure B4.1a suggests, the use of income data raises
the headcount ratio and the poverty gap and results in a more persistent pattern of poverty.
Figure B4.1 Poverty measures can be sensitive to the source of data collection
a. Income-based results paint a less positive b. This affects person-equivalent measures more
picture of poverty reduction than regular headcount measures
Headcount ratios and poverty gaps in Mexico, percent Headcount ratios in Mexico in 2012, percent 2012
Source: World Bank staff calculations; Povcalnet 2015
Note: Estimates based on the $1.25 poverty line and 2005 PPP prices.
While the issue also affects also traditional headcount ratios, the person-equivalent headcount ratios
may be especially affected. Because they rely on the same primary data, person-equivalent incidence
measures tend to be lower when based on consumption data—just like traditional incidence measures.
However, because person-equivalent indicators take into account the depth of poverty, and poverty is
typically deeper when using income-based measures, person-equivalent incidence measures may well
amplify the difference. The example of Mexico is again instructive (figure B4.1b). If Mexico’s person-
equivalent rate were calculated based on income, it would be well above the traditional headcount ratio
because the average gap among the poor is higher than the global average benchmark gap. However, if
consumption data were used, Mexico’s person-equivalent headcount ratio would be much lower than the
traditional headcount ratio given that the average gap is much lower than the global benchmark gap.
0
2
4
6
8
2000 2002 2004 2006 2008 2010 2012
Income-based headcount ratio
Income-based poverty gap
Consumption-based headcount ratio
Consumption based poverty gap3.3
1.0
4.1
0.7
0
1
2
3
4
5
Income-based headcount ratio Consumption-based headcount ratio
Traditional Person-equivalent
18
Multidimensional assessments are complementary
Poverty is a multifaceted phenomenon. Central to this phenomenon are income deprivations that
restrict an individual’s ability to consume certain basic goods. Yet, poverty goes beyond income
and is often accompanied lack of access to education, health, housing, employment, personal
security, and more (UNDP 1997; World Bank 2001). The association between the components of
poverty when measured in all of its dimensions are generally strong given that the poor tend to be
simultaneously deprived in multiple dimensions (Ferreira and Lugo 2013). However, the strength
of association varies across space and time. As a result, a person may be considered to be non-
poor according to the traditional income-based measure despite being subject to multiple
deprivations in other dimensions. If this person does not have access to the basic services or
personal security that are an integral part of living without deprivations in basic human needs, can
this person be considered to be free of poverty (Bourguignon and others 2010)?
The goal of “ending poverty in all of its forms everywhere” is likely to lead to growing interest
in the multidimensional measurement of global poverty. SDG1.2 incorporates an explicitly
multidimensional focus: “By 2030, reduce at least by half the proportion of men, women and
children of all ages living in poverty in all its dimensions according to national definitions". The
universal nature of the SDGs entails that as the post-2015 process unfolds, demand for harmonized
multidimensional poverty assessment at the country and global levels is likely to rise. Several
countries have already implemented variants of multidimensional poverty measures, including
Bhutan, Chile, Colombia, Mexico and the Philippines.
The Multidimensional Poverty Index (MPI) is one possible implementation of this approach
(boxes 5 and 6).8 MPI decompositions identify the subnational regions, and the dimensions, that
contribute most to multidimensional poverty. The global MPI is available for 101 countries, but is
also calculated for 884 subnational regions, mostly in SSA and SAR. The decomposition analysis
reveals pockets of poverty that national numbers might conceal. Country and subnational MPI
levels can be broken down further into dimensional indicators whose profiles vary by region. For
example, the profile of multidimensional poverty in Salamat—the poorest region in the word in
Southeast Chad—is different to that Moyen Chari, a neighboring region; in particular, educational
deprivations are much larger in Salamat than Moyen Chari. Other regions that have lower MPIs
than Salamat have higher individual components in their profile. Breaking down poverty by
dimension provides policymakers with localized information for reducing multidimensional
poverty.
8 The MPI is calculated and reported yearly by the Oxford Poverty and Human Development Initiative and the United
Nations Development Programme (Alkire and Foster 2011; Alkire and Santos 2013).

19
Figure 4 The Multidimensional Poverty Index (MPI) provides a complementary perspective to
the poverty headcount
a. Sub-Saharan Africa and South Asia have the
highest MPI levels
b. … reflecting high incidence and intensity
Multidimensional poverty index, regional aggregates (2015) Components of multidimensional poverty index components
(2015)
c. The multidimensionally poor reside mostly in
lower-middle-income countries
d. Multidimensional poverty is significant in
fragile and failed states
Number of MPI poor, 2015 (millions) Composition of MPI poor in Failed States, percent (2015)
Source: Alkire, Jindra, et al. 2015.
Note: Panel d is based on the Failed States Index (FSI) provided by the Fund for Peace. The index uses several social economic
and political indicators to classify countries from “Very High Alert” (most-fragile states) to “sustainable” (less-fragile states). The
less-fragile countries in this figure are classified as “high warning.”
The 2015 MPI counts 1.6 billion people as multi-dimensionally poor, with the largest global
share in South Asia and the highest intensity in Sub-Saharan Africa (figures 4a-d). Some 54
percent live of all the MPI poor live in South Asia and 31 percent in Sub-Saharan Africa. Most
multidimensionally poor—70 percent—live in lower-middle and low-income countries (Alkire
and others 2015b). As for monetary poverty, MPI poverty incidence is the highest in Sub-Saharan
Africa. It is also the most intense as measured by the multiplicity of deprivations. South Asia
follows second. While the MPI headcount is much lower in other regions, the breadth of
deprivation among the multidimensionally poor is only slightly lower than that found in those two
regions. Multidimensional poverty is significant among those living in fragile states. Just as in the
case of income poverty, multidimensional poverty is most intense in fragile and conflict-affected
states, with the extent of poverty varying with the intensity of fragility and conflict. The vast
majority of these countries are located in Sub-Saharan Africa and South Asia.
0.34
0.28
0.11
0.03 0.020.01
0.00
0.05
0.10
0.15
0.20
0.25
0.30
0.35
SSA SAR Arab States EAP LAC ECA
61
53
21
7 52
5652 53
42 4338
0
10
20
30
40
50
60
70
SSA SAR ArabStates
EAP LAC ECA
Incidence Intensity
983
474
105
0
200
400
600
800
1000
Lower-middle incomecountries
Low incomecountries
Upper-middle incomecountries
High warning,
52
Very high warning, 9
High alert, 10
Alert, 22
Very high alert, 6
20
At the individual country level, the country with the highest rate of multidimensional poverty
is Niger. This is also a country with very high fertility levels—see World Bank (2015f). The
country-level patterns of monetary and multidimensional poverty may deviate significantly from
each other. For example, in Zambia, the multidimensional poverty rate as measured by the MPI
was 57 percent in 2013–14 while the income-based poverty rate was 74 percent in 2010. For
Pakistan the opposite was true, with the multidimensional poverty rate in 2013–14 of 44 percent
while the income-based poverty rate in 2010 was 13 percent. Both comparisons indicate significant
differences in the poor populations identified by the two methods. Turning from international
measures to national measures, Chile has two official poverty measures: an income-based measure
and a multidimensional measure. The poverty rates associated with the two in 2013 were 14.4
percent (income) and 20.4 percent (multidimensional); however, the share of the entire population
that is poor under both definitions is just 5.5 percent.
Decomposition of the MPI into the subnational level and its component indicators may shed
light on patterns of intense deprivation. Intense multidimensional poverty may be experienced
at the subnational level. The poorest among the subnational regions in the world is Salamat in
southeast Chad, a landlocked area just south of the Sahel, bordering the Central African Republic.
Nearly 98 percent of its 354,000 inhabitants are MPI poor, and on average, they are deprived in
nearly 75 percent of the MPI dimensions, ensuring that it also is the region with the greatest breadth
of poverty. Three of the five poorest regions are in Chad while two are in Burkina Faso. The profile
of multidimensional poverty may also reveal intense poverty in certain dimensions. Across
dimensions, of the 884 regions, the regions with the highest dimensional indicator for nutrition is
Affar in Ethiopia; for child mortality is Nord-Ouest in Cote d’Ivoire; and for sanitation, electricity,
and assets is Warap in South Sudan. Yet Salamat in Chad, which has high rates of deprivation in
many at the same time, is the poorest by the MPI.
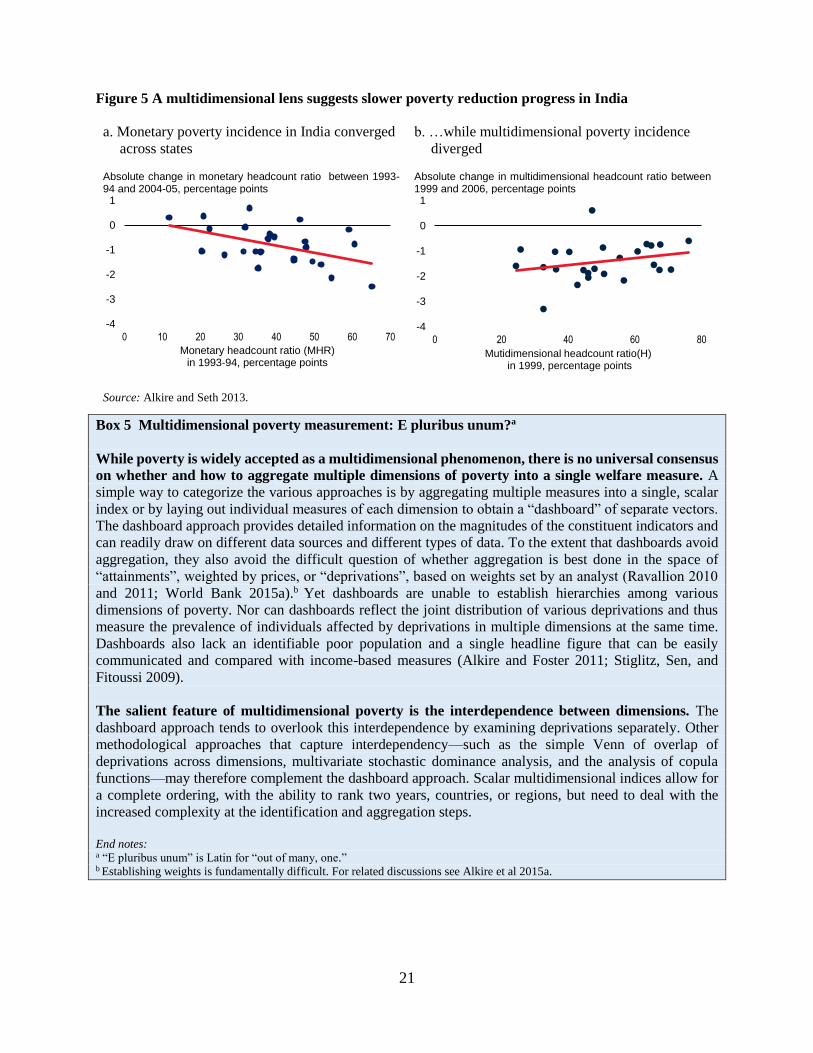
Multidimensional poverty measures may provide useful complementary perspectives on the
dynamics of poverty over time. India, for example, exhibits a marked difference across its various
states between the behaviors of the income-based and multidimensional poverty rates through
time. Figures 5a and b plot the annualized absolute change in the poverty rate over a period of time
against the initial value, for a multidimensional poverty measure and an income-based approach.
The line in each graph is the linear regression of the annualized absolute change on the starting
level. Clearly, the income poverty rates across states in India exhibit a classical converging pattern,
where the reduction in the income-based poverty rate is higher in the states with the higher initial
poverty values. For multidimensional poverty, the opposite is true: the states with low
multidimensional poverty are making greater progress, whereas those with the highest poverty
rates are lagging behind. These examples suggest a need to monitor multidimensional poverty
directly.
21
Figure 5 A multidimensional lens suggests slower poverty reduction progress in India
a. Monetary poverty incidence in India converged
across states
b. …while multidimensional poverty incidence
diverged
Absolute change in monetary headcount ratio between 1993-94 and 2004-05, percentage points
Absolute change in multidimensional headcount ratio between 1999 and 2006, percentage points
Source: Alkire and Seth 2013.
Box 5 Multidimensional poverty measurement: E pluribus unum?a
While poverty is widely accepted as a multidimensional phenomenon, there is no universal consensus
on whether and how to aggregate multiple dimensions of poverty into a single welfare measure. A
simple way to categorize the various approaches is by aggregating multiple measures into a single, scalar
index or by laying out individual measures of each dimension to obtain a “dashboard” of separate vectors.
The dashboard approach provides detailed information on the magnitudes of the constituent indicators and
can readily draw on different data sources and different types of data. To the extent that dashboards avoid
aggregation, they also avoid the difficult question of whether aggregation is best done in the space of
“attainments”, weighted by prices, or “deprivations”, based on weights set by an analyst (Ravallion 2010
and 2011; World Bank 2015a).b Yet dashboards are unable to establish hierarchies among various
dimensions of poverty. Nor can dashboards reflect the joint distribution of various deprivations and thus
measure the prevalence of individuals affected by deprivations in multiple dimensions at the same time.
Dashboards also lack an identifiable poor population and a single headline figure that can be easily
communicated and compared with income-based measures (Alkire and Foster 2011; Stiglitz, Sen, and
Fitoussi 2009).
The salient feature of multidimensional poverty is the interdependence between dimensions. The
dashboard approach tends to overlook this interdependence by examining deprivations separately. Other
methodological approaches that capture interdependency—such as the simple Venn of overlap of
deprivations across dimensions, multivariate stochastic dominance analysis, and the analysis of copula
functions—may therefore complement the dashboard approach. Scalar multidimensional indices allow for
a complete ordering, with the ability to rank two years, countries, or regions, but need to deal with the
increased complexity at the identification and aggregation steps.
End notes: a “E pluribus unum” is Latin for “out of many, one.” b Establishing weights is fundamentally difficult. For related discussions see Alkire et al 2015a.
-4
-3
-2
-1
0
1
0 10 20 30 40 50 60 70
Monetary headcount ratio (MHR) in 1993-94, percentage points
-4
-3
-2
-1
0
1
0 20 40 60 80
Mutidimensional headcount ratio(H)in 1999, percentage points
22
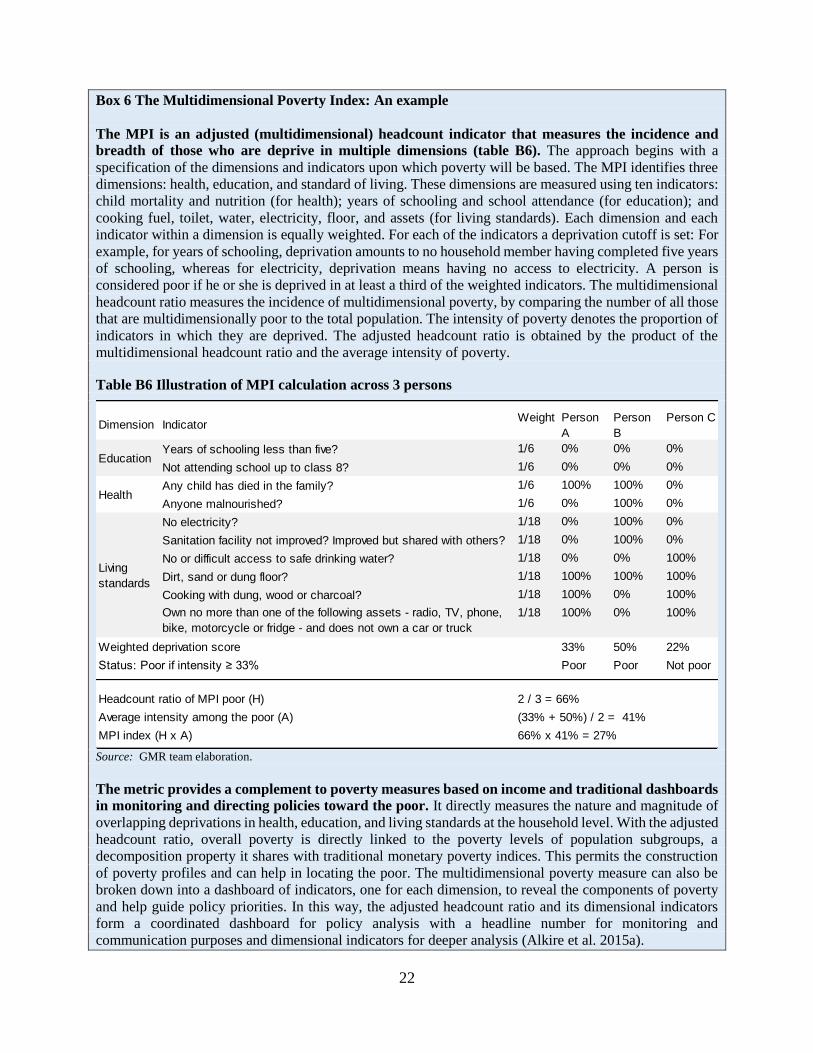
Box 6 The Multidimensional Poverty Index: An example
The MPI is an adjusted (multidimensional) headcount indicator that measures the incidence and
breadth of those who are deprive in multiple dimensions (table B6). The approach begins with a
specification of the dimensions and indicators upon which poverty will be based. The MPI identifies three
dimensions: health, education, and standard of living. These dimensions are measured using ten indicators:
child mortality and nutrition (for health); years of schooling and school attendance (for education); and
cooking fuel, toilet, water, electricity, floor, and assets (for living standards). Each dimension and each
indicator within a dimension is equally weighted. For each of the indicators a deprivation cutoff is set: For
example, for years of schooling, deprivation amounts to no household member having completed five years
of schooling, whereas for electricity, deprivation means having no access to electricity. A person is
considered poor if he or she is deprived in at least a third of the weighted indicators. The multidimensional
headcount ratio measures the incidence of multidimensional poverty, by comparing the number of all those
that are multidimensionally poor to the total population. The intensity of poverty denotes the proportion of
indicators in which they are deprived. The adjusted headcount ratio is obtained by the product of the
multidimensional headcount ratio and the average intensity of poverty.
Table B6 Illustration of MPI calculation across 3 persons
Source: GMR team elaboration.
The metric provides a complement to poverty measures based on income and traditional dashboards
in monitoring and directing policies toward the poor. It directly measures the nature and magnitude of
overlapping deprivations in health, education, and living standards at the household level. With the adjusted
headcount ratio, overall poverty is directly linked to the poverty levels of population subgroups, a
decomposition property it shares with traditional monetary poverty indices. This permits the construction
of poverty profiles and can help in locating the poor. The multidimensional poverty measure can also be
broken down into a dashboard of indicators, one for each dimension, to reveal the components of poverty
and help guide policy priorities. In this way, the adjusted headcount ratio and its dimensional indicators
form a coordinated dashboard for policy analysis with a headline number for monitoring and
communication purposes and dimensional indicators for deeper analysis (Alkire et al. 2015a).
Dimension IndicatorWeight Person
A
Person
B
Person C
Years of schooling less than five? 1/6 0% 0% 0%
Not attending school up to class 8? 1/6 0% 0% 0%
Any child has died in the family? 1/6 100% 100% 0%
Anyone malnourished? 1/6 0% 100% 0%
No electricity? 1/18 0% 100% 0%
Sanitation facility not improved? Improved but shared with others? 1/18 0% 100% 0%
No or difficult access to safe drinking water? 1/18 0% 0% 100%
Dirt, sand or dung floor? 1/18 100% 100% 100%
Cooking with dung, wood or charcoal? 1/18 100% 0% 100%
Own no more than one of the following assets - radio, TV, phone,
bike, motorcycle or fridge - and does not own a car or truck
1/18 100% 0% 100%
33% 50% 22%
Poor Poor Not poor
Headcount ratio of MPI poor (H) 2 / 3 = 66%
Average intensity among the poor (A) (33% + 50%) / 2 = 41%
MPI index (H x A) 66% x 41% = 27%
Weighted deprivation score
Status: Poor if intensity ≥ 33%
Living
standards
Education
Health
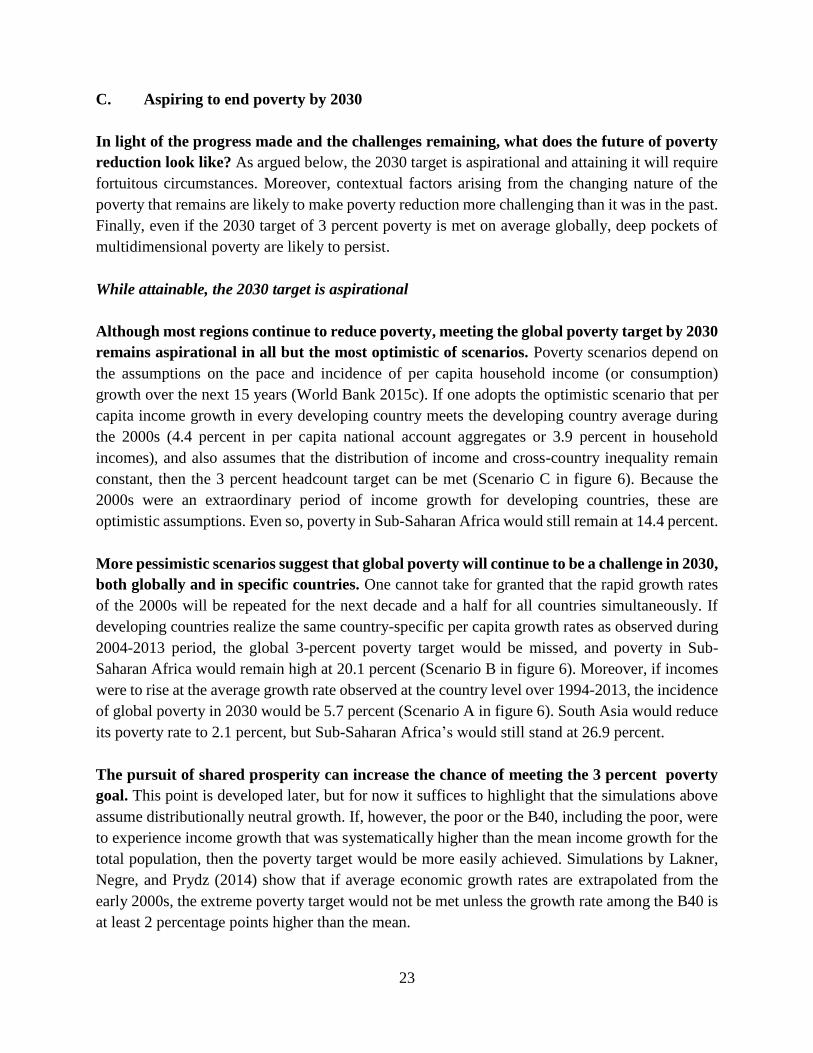
23
C. Aspiring to end poverty by 2030
In light of the progress made and the challenges remaining, what does the future of poverty
reduction look like? As argued below, the 2030 target is aspirational and attaining it will require
fortuitous circumstances. Moreover, contextual factors arising from the changing nature of the
poverty that remains are likely to make poverty reduction more challenging than it was in the past.
Finally, even if the 2030 target of 3 percent poverty is met on average globally, deep pockets of
multidimensional poverty are likely to persist.
While attainable, the 2030 target is aspirational
Although most regions continue to reduce poverty, meeting the global poverty target by 2030
remains aspirational in all but the most optimistic of scenarios. Poverty scenarios depend on
the assumptions on the pace and incidence of per capita household income (or consumption)
growth over the next 15 years (World Bank 2015c). If one adopts the optimistic scenario that per
capita income growth in every developing country meets the developing country average during
the 2000s (4.4 percent in per capita national account aggregates or 3.9 percent in household
incomes), and also assumes that the distribution of income and cross-country inequality remain
constant, then the 3 percent headcount target can be met (Scenario C in figure 6). Because the
2000s were an extraordinary period of income growth for developing countries, these are
optimistic assumptions. Even so, poverty in Sub-Saharan Africa would still remain at 14.4 percent.
More pessimistic scenarios suggest that global poverty will continue to be a challenge in 2030,
both globally and in specific countries. One cannot take for granted that the rapid growth rates
of the 2000s will be repeated for the next decade and a half for all countries simultaneously. If
developing countries realize the same country-specific per capita growth rates as observed during
2004-2013 period, the global 3-percent poverty target would be missed, and poverty in Sub-
Saharan Africa would remain high at 20.1 percent (Scenario B in figure 6). Moreover, if incomes
were to rise at the average growth rate observed at the country level over 1994-2013, the incidence
of global poverty in 2030 would be 5.7 percent (Scenario A in figure 6). South Asia would reduce
its poverty rate to 2.1 percent, but Sub-Saharan Africa’s would still stand at 26.9 percent.
The pursuit of shared prosperity can increase the chance of meeting the 3 percent poverty
goal. This point is developed later, but for now it suffices to highlight that the simulations above
assume distributionally neutral growth. If, however, the poor or the B40, including the poor, were
to experience income growth that was systematically higher than the mean income growth for the
total population, then the poverty target would be more easily achieved. Simulations by Lakner,
Negre, and Prydz (2014) show that if average economic growth rates are extrapolated from the
early 2000s, the extreme poverty target would not be met unless the growth rate among the B40 is
at least 2 percentage points higher than the mean.
24
Figure 6. World poverty scenarios suggest that the poverty target is aspirational but attainable
Poverty rate in 2030, percent
Source: Staff estimations.
Note: Based on $1.9 poverty line (2011 PPP prices). The first scenario assumes that each country grows at the country-specific average
growth rate observed over 1994-2013. The second scenario assumes that each country grows at the country-specific average growth
rate observed over 2004-2013. Since per capita private consumption is missing for many countries, especially in Africa, per capita GDP
growth rates are used for all countries instead. The third scenario assumes that each country grows at 4.4 percent per year (national
accounts) or 3.9 percent (household incomes). That is a scenario under which the 3% target for the Bank’s poverty reduction goal would
be reached by 2030. As in all previous cases, the within-country distribution neutrality assumption is used.
Poverty reduction will meet new challenges
A further challenge is the possibility that future growth may not reach the poor as readily as
in the past. As noted, global poverty fell by about 1 percentage point a year in response to the
average annual GDP growth rate of 4 percent. However, even if the growth rate still averaged 4
percent from now to 2030, would poverty continue to fall by 1 percentage point a year? The
distributional pattern of household income and consumption puts a relatively high proportion of
the population near the median income or consumption value with small proportions at extremely
high or low values (Battistin, Blundell, and Lewbel 2009). Thus, when the global poverty rate was
36 percent in 2000, at the start of the Millennium Development Goals, many poor people were just
below the poverty line, leading to a large percentage point reduction in poverty for a given
distribution-neutral increase in GDP with global poverty incidence at 12.8 percent in 2012, the
same distribution-neutral increase in GDP will lead to less poverty reduction. Poverty’s
responsiveness to distribution-neutral growth will continue to decline as the 3 percent target is
approached (World Bank 2015c). This suggests that, as the 3 percent target gets nearer, higher
rates of income growth will be needed and the distribution of that growth will need to be more
favorable to those with the lowest incomes.
0.5 0.8
4.6
2.1
26.9
5.7
0.20.2
4.1
1.1
20.1
4.2
0.3 0.42.7
0.6
14.4
3.0
0
5
10
15
20
25
30
East Asia andPacific
Europe andCentral Asia
Latin Americaand the
Caribbean
South Asia Sub-SaharanAfrica
World
Last 20 years average growth (scenario 1)
Last 10 years average growth (scenario 2)
3.9 percent income growth (scenario 3)
25
Ending poverty is also complicated by the structural characteristics of the most
impoverished nations, particularly those in Sub-Saharan Africa. Taking into account their
demographic dynamics, by 2030 a larger share of the world’s impoverished will reside in natural
resource–based economies and fragile and conflict-affected states (FCS), primarily in Sub-Saharan
Africa. Poverty is less responsive to growth in such economies because the availability of jobs—
the main channel through which growth uplifts the poor—is limited (Inchauste and Saavedra-
Chanduvi 2014; Inchauste and others 2014; Loayza and Raddatz 2010; World Bank 1990; IMF
2014b). Capital-intensive, natural-resource sectors may generate growth but are likely to have
weak backward and forward links with the rest of the economy, even during commodity boom
periods. In the fragile and conflict-affected states (which include several natural resource-based
countries), the poverty problem is even more complex. Conflicts, whether they arise because of
contested natural resource wealth or are politically motivated, inevitably disrupt or even reverse
growth. The impact of conflict is often felt long after peace is restored.
Continued poverty reduction will require incorporating natural resources and natural
capital in economic decision-making. Land degradation and poverty are often deeply intertwined
as an estimated 42 percent of the world’s poorest live on land that is classified as degraded
(Nachtergaele et al. 2010). About 1.3 billion people are reliant on forests, and the majority of these
are extremely poor. Their level of dependence is surprisingly large and often equal in magnitude
to income obtained from agriculture (Shepherd 2012, Angelsen et al 2014). In addition, 1 billion
people in developing countries depend upon fish as the primary source of affordable protein. The
rural poor often endure a litany of environmental health risks too. Illness, disability and early
death from environmental risks, such as household air pollution from wood burning in primitive
stoves, remains a major cause of child mortality in the developing world, followed by inadequate
sanitation.
Climate change may become another important drag on poverty reduction in many countries
(Field 2014; Hertel and Rosch 2010; Leichenko and Silva (2014); Skoufias, Rabassa, and Olivieri
2012]. Global estimates suggest that climate change could account for 10.1 million additional poor
by mid-century in the absence of comprehensive and successful greenhouse gas emissions
abatement. The size and incidence of the impact of climate change on a given country depends on
country-specific factors related to its exposure to climate shocks and the country’s ability to adapt
(Füssel and Klein 2006; Yohe and Tol 2009). Generally, the poor in developing countries are
disproportionally affected. One reason is that the poor have lower access to resources and savings
to absorb the impact of shocks, whether they come from climate change or political, economic, or
financial instability. Climate change may have a greater impact on the poor relative to other types
of shocks because the poor tend to be more dependent on agriculture and have more perilous access
to water (World Bank 2012).
26
Deep pockets of dimensionally broad poverty will likely remain
Even if the aggregate 3 percent poverty target is reached, the distribution of poverty
reduction within countries will be uneven, and deep pockets of impoverishment will remain.
Just as poverty reduction occurs at vastly different rates across countries and global regions,
poverty reduction within countries is normally a spatially uneven process. Deep pockets of poverty
can persist even in countries that, at the aggregate level, are experiencing rapid poverty reduction.
Country-level poverty assessments regularly identify specific areas or groups of people with
particular characteristics experiencing higher-than-average probabilities of being poor. They may
be locked in poverty traps or other low-level equilibriums in which aggregate economic growth
does not translate into employment income or transfers for them. These groups may be defined by
education, ethnicity, or region of residence. In particular, there is evidence that pockets of poverty
cluster geographically in rural areas that are poorly connected to urban centers of growth, where
the poor may become trapped in low-productivity jobs (Kraay and McKenzie 2014). For example,
although China’s rate of poverty reduction has been rapid, poverty is higher in rural areas where
the productivity of farmers’ investments is lower (Jalan and Ravallion 2001).
27
III. Shared Prosperity: Conceptual Issues and Recent Trends
The second of the World Bank Group goals articulates the commitment to promote “shared
prosperity,” defined as seeking to sustainably raise the well-being of the poorer segments of
society. The goal reflects a practical compromise between the single-minded pursuit of prosperity
in the aggregate and an equity concern about the ability of the less well-off in society to improve
their well-being by participating in a country’s prosperity. The goal thus gives more explicit
attention to inclusive development and growth than has been the case in the past and paves the
way for a focus on inequality. The goal is measured by the pace of real income or consumption
growth at the household level, on average and over time, for the B40 percent of the income
distribution in each country.9
This section sheds further light on the concept of shared prosperity and examines its recent
trends. It explores in some depth conceptual questions relating to the goal and indicator of shared
prosperity. Specifically, it examines the connections between shared prosperity and non-income
dimensions of well-being, links with equity (“justness”), and connections to equality (“the state of
being equal”). Second, it analyzes recent trends in shared prosperity, underlying drivers, and
continuing disparities, and assesses whether recent trends can be sustained.
A. Revisiting the concept of shared prosperity
What is shared prosperity? While the shared prosperity concept is not new, the effort to promote
it through the B40 indicator has raised interest in how the goal of shared prosperity should be
interpreted.10 The concept of shared prosperity, with its focus on the B40, has been around at least
as long as the early use of the term by the economist Simon Kuznets in discussions on growth and
inequality (Kuznets 1955) and its invocation by World Bank president Robert S. McNamara in
1972 (box 7).11 However, the approach of seeking to raise the average income growth of the B40
in absolute terms has raised interest in the role of non-income dimensions and the connections of
the concept with equity and equality.
9 While household surveys may track consumption or income, reference is made just to income, for convenience. 10 The second of the World Bank Group’s goals has been extensively discussed in World Bank (2013b, 2015c). The
discussion in this report builds on these publications, focusing selectively on only two aspects: links to equity and
inequality and the non-income dimension. 11 See also the influential book on redistribution with growth (Chenery and others 1974) and the broad-based growth
discussion in World Bank (1990).
28
Shared prosperity means multidimensional development
The shared prosperity goal recognizes that the pursuit of well-being among the most
vulnerable in a society is a key development objective. Thus, while the average income growth
among the B40 has become the agreed-upon indicator of shared prosperity, the goal itself is much
broader in that it aspires to sustainably elevate the well-being of the poorer segments of society.
Embedded in the goal, therefore, are both intertemporal and multidimensional objectives: shared
prosperity requires well-being to be shared across individuals over time. This multidimensional
aspect of the goal points to the need for a focus on non-income dimensions of prosperity such as
education, health, nutrition, and access to essential infrastructure, as well as on enhancing the voice
and participation of all segments of society in the economic, social and, political spheres (World
Bank 2013b).
The broad focus of the shared prosperity goal is in keeping with the call for development
goals that go beyond access to or ownership of material goods. Amartya Sen (1983, 1985,
1999)—a key proponent—has called for income to be viewed not as the sole end to development
but rather as a gauge of what a person is able to do (capability) and manages to do (functioning).
This broader perspective of development has been influential in the literature on broad-based
growth and has led first to efforts to measure the non-income dimensions of development and then
to work on inclusive growth that examines how growth trickles down to the poor. That work, in
turn, has led, through the introduction of multidimensionality, to the notion of “inclusive
development.”12
While the chosen indicator of shared prosperity is a money metric, the non-income
dimensions of the shared prosperity goal are important (Narayan, Saavedra-Chanduvi, and
Tiwari 2013). The use of a relatively simple indicator—the B40 growth in the real value of income
or consumption (depending on the methodology of the household surveys on which the concept is
based)—does not mean that non-income aspects of well-being should be disregarded.13 The B40
income-based indicator is a first step toward making a critical point: growth in an economy should
not be assumed to mean that development progress is automatically occurring. It is also necessary
for this growth to reach the less well-off in society. Beyond that, however, development progress
should be assessed in all of its dimensions. The second step, therefore, is to consider explicitly
how, given their synergies, the income and non-income aspects of shared prosperity feed into each
other and together can produce greater well-being for the poorer segments of society.14
12 Rauniyar and Kanbur (2010) provide an example of the latter, which closely connects to examining how shared
prosperity, when measured in all of its dimensions, benefits the less well-off. 13 In some respects, the indicator is itself a multidimensional amalgamation because it summarizes the ability to obtain
goods and services critical for welfare through market transactions. 14 Basu (2001, 2006) notes that income indicators focusing on the poorer income deciles may correlate more strongly
than average incomes with non-income indicators of well-being, such as greater life expectancy and higher literacy.
29
Box 7 Back to “Basics”: McNamara’s prescient 1972 speech on shared prosperity
At the Annual Meetings in Nairobi in September 1972, World Bank President Robert S. McNamara
addressed the Board of Governors with a speech that linked the growth imperative to social justice.
The speech demarcated the so-called “basic needs” approach. It contains various references—some of them
little-known at this time—to the concept of “shared prosperity” that the World Bank Group would institute
as one of its corporate objectives some four decades later. The interpretations that he offered remain
pertinent today and offer apt perspectives on how shared prosperity relates to social equity, social
sustainability, inequality, and multi-dimensionality.
Social equity and social sustainability. “We know, in effect, that there is no rational alternative
to moving toward policies of greater social equity. When the highly privileged are few and the
desperately poor are many-and when the gap between them is worsening rather than improving-it
is only a question of time before a decisive choice must be made between the political costs of
reform and the political risks of rebellion. That is why policies specifically designed to reduce the
deprivation among the poorest 40 percent in developing countries are prescriptions not only of
principle but of prudence. Social justice is not merely a moral imperative. It is a political imperative
as well.”
Income inequality. “The first step should be to establish specific targets, within the development
plans of individual countries, for income growth among the poorest 40 percent of the population. I
suggest that our goal should be to increase the income of the poorest sections of society in the short
run—in five years—at least as fast as the national average. In the longer run—ten years—the goal
should be to increase this growth significantly faster than the national average.”
Multi-dimensionality. “The task, then, for the governments of the developing countries is to
reorient their development policies in order to attack directly the personal poverty of the most
deprived 40 percent of their populations. This the governments can do without abandoning their
goals of vigorous overall economic growth. But they must be prepared to give greater priority to
establishing growth targets in terms of essential human needs: in terms of nutrition, housing, health,
literacy, and employment – even if it be at the cost of some reduction in the pace of advance in
certain narrow and highly privileged sectors whose benefits accrue to the few.”
Equality of opportunity underpins shared prosperity
Equity is a fundamental building block of shared prosperity. As Mahatma Gandhi famously
noted, “A nation’s greatness is measured by how it treats its weakest members.” Yet, as societal
preferences evolve and moral philosophies change, concerns about the less well-off have varied
over time. For example, Bentham’s utilitarian preference for the “greatest happiness for the
greatest number,” first published in the 1780s, is devoid of any distributional concern, while
Rawls’s principle of maximizing opportunity for the “least privileged,” published nearly 200 years
later) takes a radically opposite view (Bentham [1789] 2000; Rawls 1971). The World Bank
Group’s institutional objective of promoting shared prosperity targets the B40 as an anonymous
30
group irrespective of the identity of its members.15 This strong focus on the less privileged places
equity at the very heart of the goal and the indicator of shared prosperity.16
Underpinned by equity, the shared prosperity concept is intricately related to the inequality
of opportunity. World Bank (2013b) highlights that even though the shared prosperity indicator
is focused on outcomes, the requirement to pursue shared prosperity in a socially sustainable
fashion ties the concept to the promotion of equality of opportunity. This focus is also present in
modern theories of social equity, which, like Rawls’s, build on Harsanyi’s (1955) “veil of
ignorance argument”: an equitable resource allocation should reflect what all prospective members
of society would agree on before they knew which position they would occupy in that society.
Accordingly, while modern theories of equity remain concerned that individuals be spared from
extreme deprivation in outcomes, they emphasize the importance of ensuring equal opportunities
for individuals to pursue a life of their choosing. 17 The outcome of a person’s life, in its many
dimensions, should reflect efforts and talents, and not predetermined circumstances—such as
family origins, race, gender or place of birth—or the social groups a person is born into.
In and of itself, however, the shared prosperity goal is not aimed at reducing the inequality
of outcome. Considerable heterogeneity exists in the opinions of individuals about whether
inequality is good or bad and should be reduced or not. The most recent wave of the World Value
Survey illustrates the degree of polarization in views around the world and also how the preference
for inequality gradually rises across the income distribution, with large differences across regions
(figure 7). Reflecting these differences of views, the shared prosperity concept does not directly
link to outcome inequality. Positive B40 income growth may indeed be associated with rising
inequality, both within the B40 and between groups. First, inequality may rise within the B40 by
virtue of the mean indicator, in which positive growth may occur at the expense of the poorest.18
Second, absolute income growth of the B40 is neither necessary not sufficient for lower inequality
between the B40 and other income groups. Negative B40 income growth could lower inequality if
T60 growth does even worse, but positive B40 income growth might not prevent a rise in
inequality if T60 growth does even better.
15 If the shared prosperity objective were illustrated by a social welfare function, it would attach positive weights
through the 40th percentile but zero weight thereafter. Note, however, that a singular focus on the B40 would conflict
with the poverty goal (given that in many countries extreme poverty incidence is well above 40 percent); it would also
be inconsistent with the requirement of social sustainability (which requires that the interest of the B40 cannot be
considered with total disregard to or independently of the rest of the income distribution). 16 Derived from “prosperitas” or doing well in Latin, prosperity can be defined as a state, the optimal distribution of
which over a given population inevitably involves normative questions about social equity. Therefore, shared
prosperity—or “prosperitas vulgaris” (that is, prosperity shared by all)—intrinsically reflects a societal value judgment
about the equitable distribution of resources as articulated through a process of social choice. 17 World Bank (2005) refers to the theories by John Rawls (1971), Amartya Sen (1985), Ronald Dworkin (1981a,
1981b), and John Roemer (1998). 18 Indicators based on mean income growth tend to penalize the less well-off. Since average income weights the
incomes of everyone equally, it assigns a greater weight to those in richer percentiles of the income distribution, since
richer percentiles have higher incomes (World Bank (2015b).
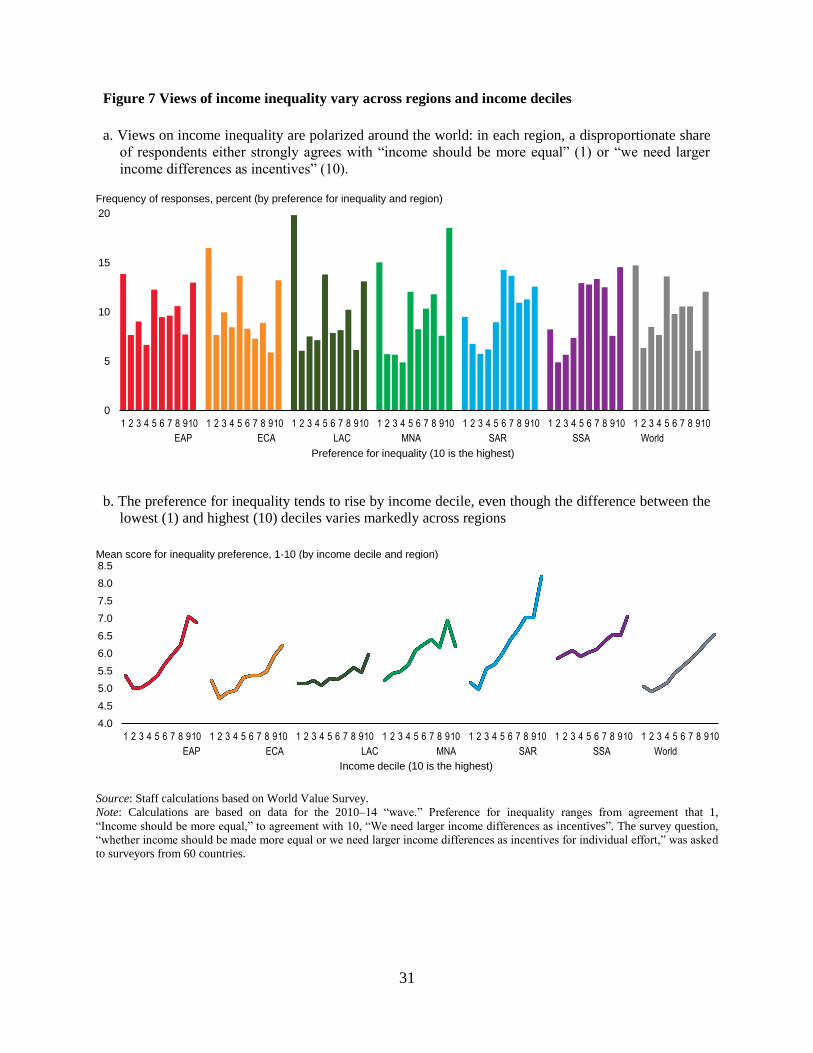
31
Figure 7 Views of income inequality vary across regions and income deciles
a. Views on income inequality are polarized around the world: in each region, a disproportionate share
of respondents either strongly agrees with “income should be more equal” (1) or “we need larger
income differences as incentives” (10).
Frequency of responses, percent (by preference for inequality and region)
b. The preference for inequality tends to rise by income decile, even though the difference between the
lowest (1) and highest (10) deciles varies markedly across regions
Mean score for inequality preference, 1-10 (by income decile and region)
Source: Staff calculations based on World Value Survey.
Note: Calculations are based on data for the 2010–14 “wave.” Preference for inequality ranges from agreement that 1,
“Income should be more equal,” to agreement with 10, “We need larger income differences as incentives”. The survey question,
“whether income should be made more equal or we need larger income differences as incentives for individual effort,” was asked
to surveyors from 60 countries.
0
5
10
15
20
1 2 3 4 5 6 7 8 910 1 2 3 4 5 6 7 8 910 1 2 3 4 5 6 7 8 910 1 2 3 4 5 6 7 8 910 1 2 3 4 5 6 7 8 910 1 2 3 4 5 6 7 8 910 1 2 3 4 5 6 7 8 910
Preference for inequality (10 is the highest)
EAP ECA LAC MNA SAR SSA World
4.0
4.5
5.0
5.5
6.0
6.5
7.0
7.5
8.0
8.5
1 2 3 4 5 6 7 8 910 1 2 3 4 5 6 7 8 910 1 2 3 4 5 6 7 8 910 1 2 3 4 5 6 7 8 910 1 2 3 4 5 6 7 8 910 1 2 3 4 5 6 7 8 910 1 2 3 4 5 6 7 8 910
Income decile (10 is the highest)
EAP ECA LAC MNA SAR SSA World
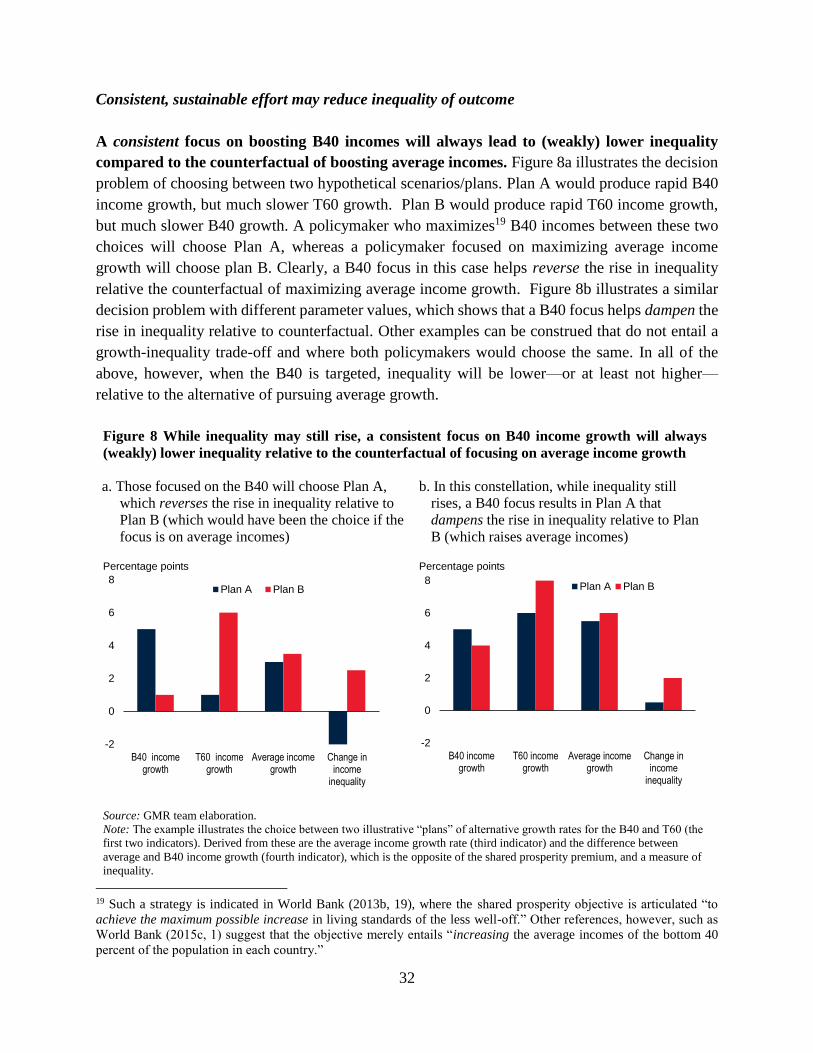
32
Consistent, sustainable effort may reduce inequality of outcome
A consistent focus on boosting B40 incomes will always lead to (weakly) lower inequality
compared to the counterfactual of boosting average incomes. Figure 8a illustrates the decision
problem of choosing between two hypothetical scenarios/plans. Plan A would produce rapid B40
income growth, but much slower T60 growth. Plan B would produce rapid T60 income growth,
but much slower B40 growth. A policymaker who maximizes19 B40 incomes between these two
choices will choose Plan A, whereas a policymaker focused on maximizing average income
growth will choose plan B. Clearly, a B40 focus in this case helps reverse the rise in inequality
relative the counterfactual of maximizing average income growth. Figure 8b illustrates a similar
decision problem with different parameter values, which shows that a B40 focus helps dampen the
rise in inequality relative to counterfactual. Other examples can be construed that do not entail a
growth-inequality trade-off and where both policymakers would choose the same. In all of the
above, however, when the B40 is targeted, inequality will be lower—or at least not higher—
relative to the alternative of pursuing average growth.
Figure 8 While inequality may still rise, a consistent focus on B40 income growth will always
(weakly) lower inequality relative to the counterfactual of focusing on average income growth
a. Those focused on the B40 will choose Plan A,
which reverses the rise in inequality relative to
Plan B (which would have been the choice if the
focus is on average incomes)
Percentage points
b. In this constellation, while inequality still
rises, a B40 focus results in Plan A that
dampens the rise in inequality relative to Plan
B (which raises average incomes)
Percentage points
Source: GMR team elaboration.
Note: The example illustrates the choice between two illustrative “plans” of alternative growth rates for the B40 and T60 (the
first two indicators). Derived from these are the average income growth rate (third indicator) and the difference between
average and B40 income growth (fourth indicator), which is the opposite of the shared prosperity premium, and a measure of
inequality.
19 Such a strategy is indicated in World Bank (2013b, 19), where the shared prosperity objective is articulated “to
achieve the maximum possible increase in living standards of the less well-off.” Other references, however, such as
World Bank (2015c, 1) suggest that the objective merely entails “increasing the average incomes of the bottom 40
percent of the population in each country.”
-2
0
2
4
6
8
B40 incomegrowth
T60 incomegrowth
Average incomegrowth
Change inincome
inequality
Plan A Plan B
-2
0
2
4
6
8
B40 incomegrowth
T60 incomegrowth
Average incomegrowth
Change inincome
inequality
Plan A Plan B
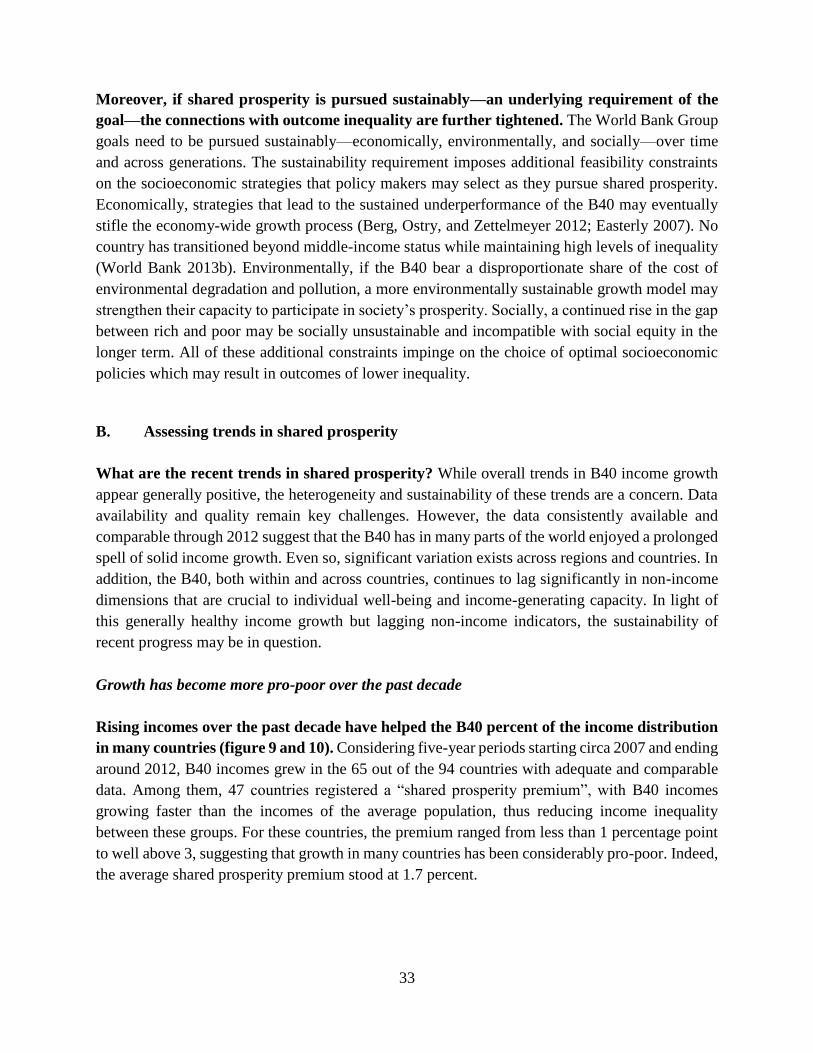
33
Moreover, if shared prosperity is pursued sustainably—an underlying requirement of the
goal—the connections with outcome inequality are further tightened. The World Bank Group
goals need to be pursued sustainably—economically, environmentally, and socially—over time
and across generations. The sustainability requirement imposes additional feasibility constraints
on the socioeconomic strategies that policy makers may select as they pursue shared prosperity.
Economically, strategies that lead to the sustained underperformance of the B40 may eventually
stifle the economy-wide growth process (Berg, Ostry, and Zettelmeyer 2012; Easterly 2007). No
country has transitioned beyond middle-income status while maintaining high levels of inequality
(World Bank 2013b). Environmentally, if the B40 bear a disproportionate share of the cost of
environmental degradation and pollution, a more environmentally sustainable growth model may
strengthen their capacity to participate in society’s prosperity. Socially, a continued rise in the gap
between rich and poor may be socially unsustainable and incompatible with social equity in the
longer term. All of these additional constraints impinge on the choice of optimal socioeconomic
policies which may result in outcomes of lower inequality.
B. Assessing trends in shared prosperity
What are the recent trends in shared prosperity? While overall trends in B40 income growth
appear generally positive, the heterogeneity and sustainability of these trends are a concern. Data
availability and quality remain key challenges. However, the data consistently available and
comparable through 2012 suggest that the B40 has in many parts of the world enjoyed a prolonged
spell of solid income growth. Even so, significant variation exists across regions and countries. In
addition, the B40, both within and across countries, continues to lag significantly in non-income
dimensions that are crucial to individual well-being and income-generating capacity. In light of
this generally healthy income growth but lagging non-income indicators, the sustainability of
recent progress may be in question.
Growth has become more pro-poor over the past decade
Rising incomes over the past decade have helped the B40 percent of the income distribution
in many countries (figure 9 and 10). Considering five-year periods starting circa 2007 and ending
around 2012, B40 incomes grew in the 65 out of the 94 countries with adequate and comparable
data. Among them, 47 countries registered a “shared prosperity premium”, with B40 incomes
growing faster than the incomes of the average population, thus reducing income inequality
between these groups. For these countries, the premium ranged from less than 1 percentage point
to well above 3, suggesting that growth in many countries has been considerably pro-poor. Indeed,
the average shared prosperity premium stood at 1.7 percent.
34
Figure 9 Experiences on shared prosperity differed: While the majority of countries saw solid growth
in B40 incomes, many countries did not
Annualized B40 income growth (solid bars) and average population income growth (transparent bars with black contours) for a five-year period, percent (circa 2007-12)
Source: World Bank Global Database for Shared Prosperity, circa 2007-12.
Note: Data availability varies across countries. Shared prosperity estimates are only provided for comparable survey years. In
SSA, only 16 out of the 48 countries have shared prosperity numbers even though more survey years exist. Starting points are
circa 2007 and end points circa 2012.
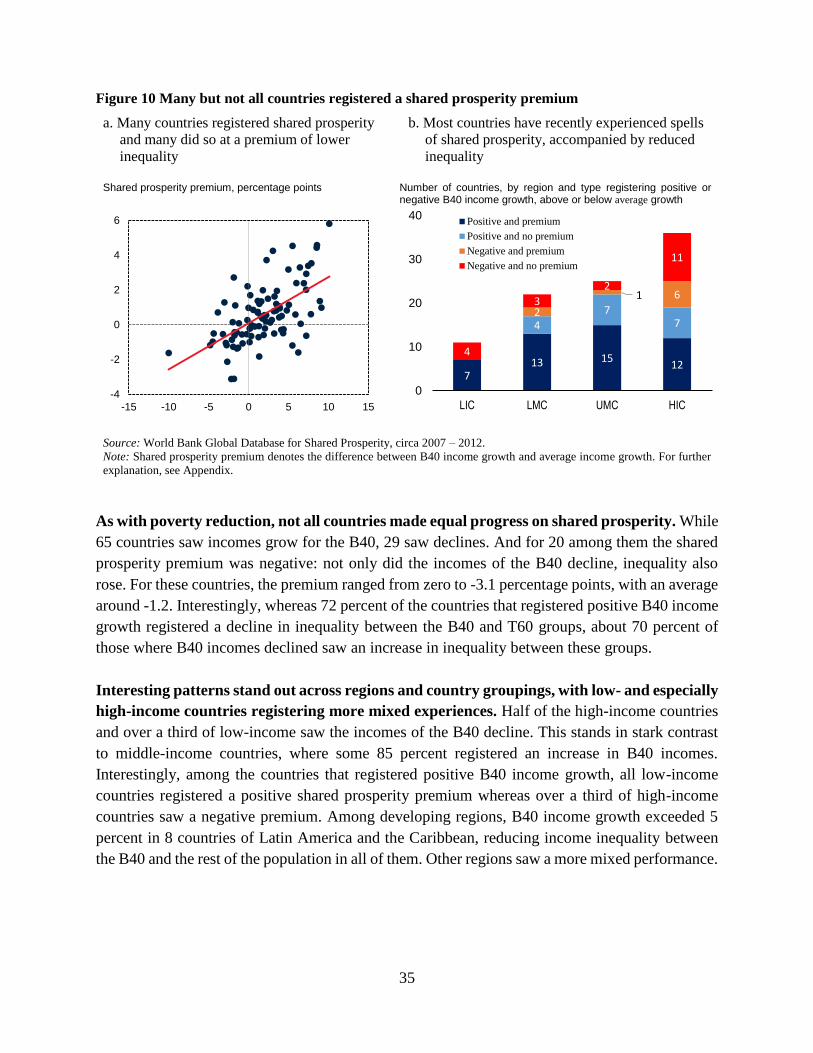
35
Figure 10 Many but not all countries registered a shared prosperity premium
a. Many countries registered shared prosperity
and many did so at a premium of lower
inequality
b. Most countries have recently experienced spells
of shared prosperity, accompanied by reduced
inequality
Shared prosperity premium, percentage points Number of countries, by region and type registering positive or
negative B40 income growth, above or below average growth
Source: World Bank Global Database for Shared Prosperity, circa 2007 – 2012.
Note: Shared prosperity premium denotes the difference between B40 income growth and average income growth. For further
explanation, see Appendix.
As with poverty reduction, not all countries made equal progress on shared prosperity. While
65 countries saw incomes grow for the B40, 29 saw declines. And for 20 among them the shared
prosperity premium was negative: not only did the incomes of the B40 decline, inequality also
rose. For these countries, the premium ranged from zero to -3.1 percentage points, with an average
around -1.2. Interestingly, whereas 72 percent of the countries that registered positive B40 income
growth registered a decline in inequality between the B40 and T60 groups, about 70 percent of
those where B40 incomes declined saw an increase in inequality between these groups.
Interesting patterns stand out across regions and country groupings, with low- and especially
high-income countries registering more mixed experiences. Half of the high-income countries
and over a third of low-income saw the incomes of the B40 decline. This stands in stark contrast
to middle-income countries, where some 85 percent registered an increase in B40 incomes.
Interestingly, among the countries that registered positive B40 income growth, all low-income
countries registered a positive shared prosperity premium whereas over a third of high-income
countries saw a negative premium. Among developing regions, B40 income growth exceeded 5
percent in 8 countries of Latin America and the Caribbean, reducing income inequality between
the B40 and the rest of the population in all of them. Other regions saw a more mixed performance.
-4
-2
0
2
4
6
-15 -10 -5 0 5 10 15
713 15
12
4
77
2
1 6
4
3
2
11
0
10
20
30
40
LIC LMC UMC HIC
Positive and premium
Positive and no premium
Negative and premium
Negative and no premium
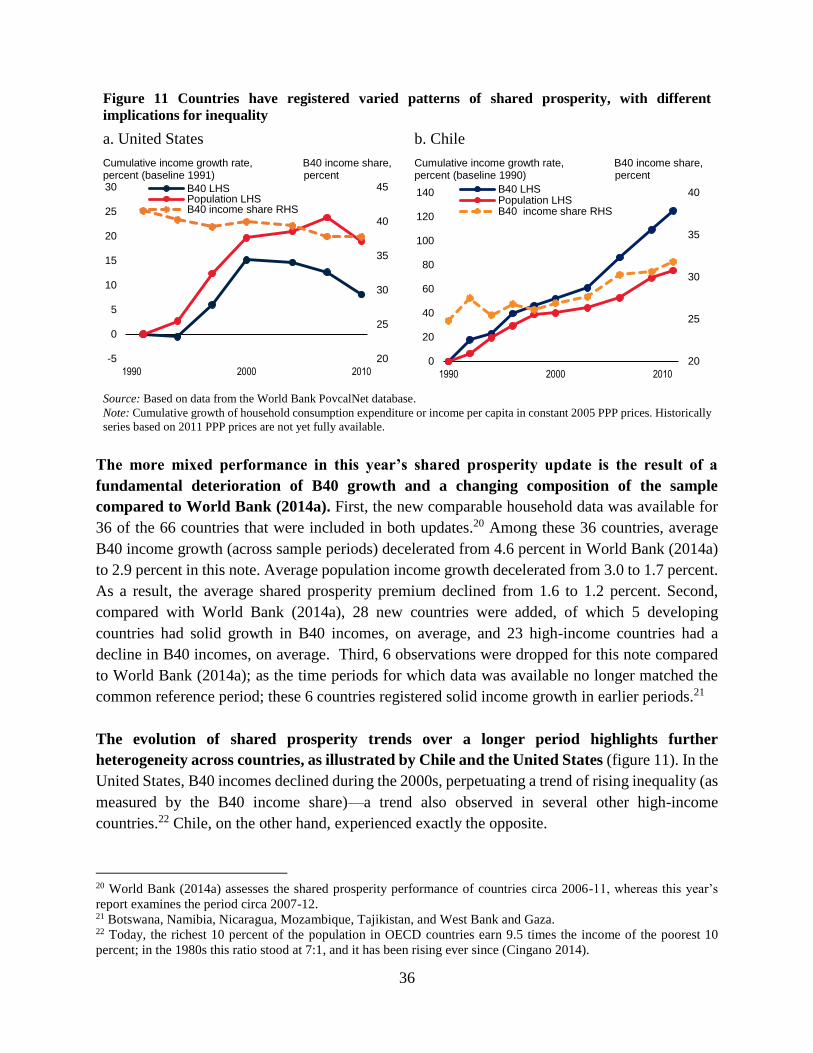
36
Figure 11 Countries have registered varied patterns of shared prosperity, with different
implications for inequality
a. United States
Cumulative income growth rate, B40 income share, percent (baseline 1991) percent
b. Chile
Cumulative income growth rate, B40 income share, percent (baseline 1990) percent
Source: Based on data from the World Bank PovcalNet database.
Note: Cumulative growth of household consumption expenditure or income per capita in constant 2005 PPP prices. Historically
series based on 2011 PPP prices are not yet fully available.
The more mixed performance in this year’s shared prosperity update is the result of a
fundamental deterioration of B40 growth and a changing composition of the sample
compared to World Bank (2014a). First, the new comparable household data was available for
36 of the 66 countries that were included in both updates.20 Among these 36 countries, average
B40 income growth (across sample periods) decelerated from 4.6 percent in World Bank (2014a)
to 2.9 percent in this note. Average population income growth decelerated from 3.0 to 1.7 percent.
As a result, the average shared prosperity premium declined from 1.6 to 1.2 percent. Second,
compared with World Bank (2014a), 28 new countries were added, of which 5 developing
countries had solid growth in B40 incomes, on average, and 23 high-income countries had a
decline in B40 incomes, on average. Third, 6 observations were dropped for this note compared
to World Bank (2014a); as the time periods for which data was available no longer matched the
common reference period; these 6 countries registered solid income growth in earlier periods.21
The evolution of shared prosperity trends over a longer period highlights further
heterogeneity across countries, as illustrated by Chile and the United States (figure 11). In the
United States, B40 incomes declined during the 2000s, perpetuating a trend of rising inequality (as
measured by the B40 income share)—a trend also observed in several other high-income
countries.22 Chile, on the other hand, experienced exactly the opposite.
20 World Bank (2014a) assesses the shared prosperity performance of countries circa 2006-11, whereas this year’s
report examines the period circa 2007-12. 21 Botswana, Namibia, Nicaragua, Mozambique, Tajikistan, and West Bank and Gaza. 22 Today, the richest 10 percent of the population in OECD countries earn 9.5 times the income of the poorest 10
percent; in the 1980s this ratio stood at 7:1, and it has been rising ever since (Cingano 2014).
20
25
30
35
40
45
-5
0
5
10
15
20
25
30
1990 2000 2010
B40 LHSPopulation LHSB40 income share RHS
20
25
30
35
40
0
20
40
60
80
100
120
140
1990 2000 2010
B40 LHSPopulation LHSB40 income share RHS
37
Recent progress reflects changing drivers of shared prosperity
What explains the variation in shared prosperity across countries and over time: average
income growth or changes in the income share of the B40?23 Shared prosperity, or growth in
average incomes of the B40, consists of growth in average incomes plus growth in the income
share of the B40. The variation of growth in average incomes of the B40 across countries and over
time can be decomposed into the variation due to growth in average incomes, and the variation
due to growth in the income share of the B40. Empirical analysis of the relative contribution of
mean incomes and B40 shares provides a simple way to distinguish the underlying drivers of B40
income growth.
The evidence suggests that most of the variation in B40 growth is due to variation in growth
in average incomes. Over the recent period of 2007-12, average income growth tracked B40
income growth rather closely (figure 12a). Dollar, Kleineberg, and Kraay (2013 and 2015) confirm
that this finding also holds over the past four decades.24 Figure 12b shows that average income
growth over this long period of time was, in the average country and over the average five-year
sample period, positive and larger than the change in the B40 income share, which was close to
zero. It also shows that the variation of changes in B40 income shares across the sample of growth
spells was much lower than that in average growth rates. These findings, taken together, show that
average income growth clearly dominates in the explanation of B40 income growth.25
Yet, average income growth is not the only driver of B40 income growth, as illustrated by
subsamples of low-income countries and the most recent decade. A good illustration is the
relationship in figure 12a, which shows significant variation from the trend for 2005–12 that can
be explained by changes in the B40 income share. Interestingly, the statistical properties of
changes in the B40 income share (figure 12b) differ markedly when the four-decade sample is split
into subsamples according to income level or decennial period. For example, B40 changes are on
average more positive and more variable across the sample of growth spells in low-income
countries than in higher-income countries (figure 12c). This pattern is also observed when
comparing the 2000s with the 1980s (figure 12d).
23 The previous section examined B40 income growth and its implications for the B40 income share, a measure of
inequality of independent interest, with a view to illustrate different patterns across countries. In this section, B40
income growth is explained by the constituent components that are thought to drive the explanatory variable: average
income growth and its elasticity with respect to the B40 (the change in the B40 income share), where the latter measure
of inequality is treated as an instrument rather than an end in itself. 24 The authors examine the relationship through the lens of the social welfare function that corresponds to the shared
prosperity concept, which coincides with the average income of the B40 group. 25 The observation also appears to hold within countries. Skoufias, Tiwari, and Shidiq (2014) find a strong positive
correlation between overall consumption growth and B40 growth across provinces in Thailand.
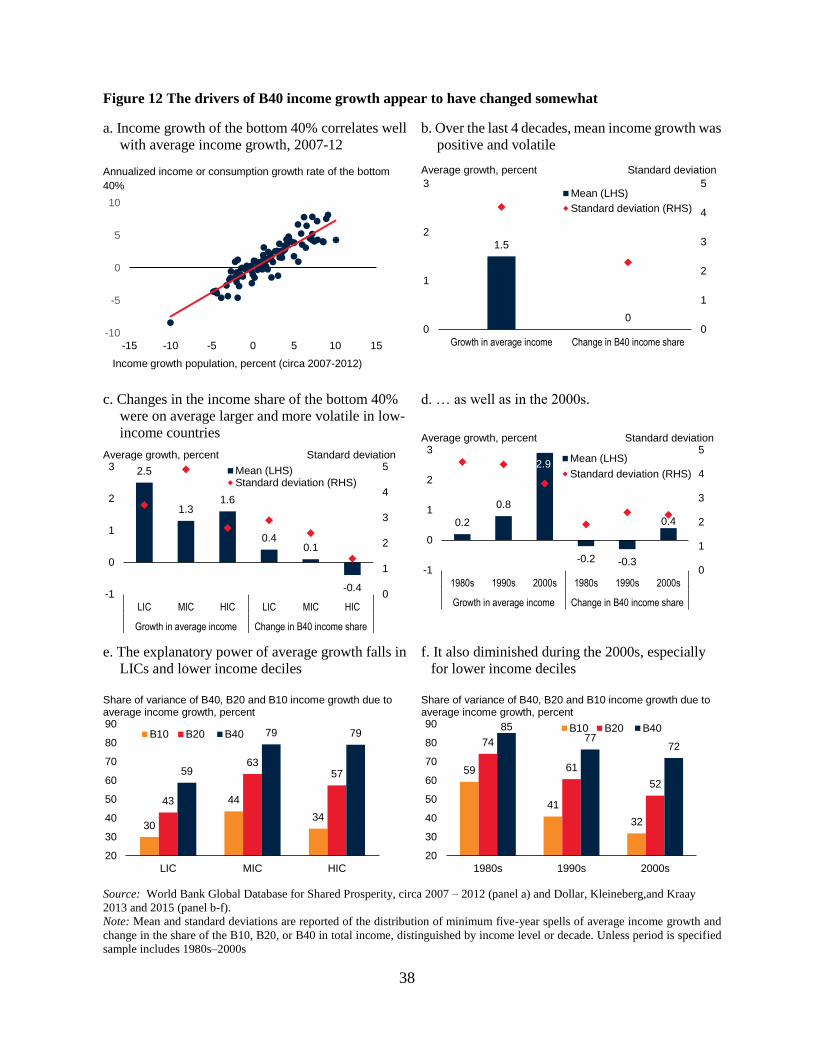
38
Figure 12 The drivers of B40 income growth appear to have changed somewhat
a. Income growth of the bottom 40% correlates well
with average income growth, 2007-12
Annualized income or consumption growth rate of the bottom
40%
b. Over the last 4 decades, mean income growth was
positive and volatile
Average growth, percent Standard deviation
c. Changes in the income share of the bottom 40%
were on average larger and more volatile in low-
income countries Average growth, percent Standard deviation
d. … as well as in the 2000s.
Average growth, percent Standard deviation
e. The explanatory power of average growth falls in
LICs and lower income deciles Share of variance of B40, B20 and B10 income growth due to average income growth, percent
f. It also diminished during the 2000s, especially
for lower income deciles Share of variance of B40, B20 and B10 income growth due to average income growth, percent
Source: World Bank Global Database for Shared Prosperity, circa 2007 – 2012 (panel a) and Dollar, Kleineberg,and Kraay
2013 and 2015 (panel b-f). Note: Mean and standard deviations are reported of the distribution of minimum five-year spells of average income growth and
change in the share of the B10, B20, or B40 in total income, distinguished by income level or decade. Unless period is specified
sample includes 1980s–2000s
-10
-5
0
5
10
-15 -10 -5 0 5 10 15
Income growth population, percent (circa 2007-2012)
1.5
00
1
2
3
4
5
0
1
2
3
Growth in average income Change in B40 income share
Mean (LHS)
Standard deviation (RHS)
2.5
1.31.6
0.40.1
-0.40
1
2
3
4
5
-1
0
1
2
3
LIC MIC HIC LIC MIC HIC
Growth in average income Change in B40 income share
Mean (LHS)Standard deviation (RHS)
0.2
0.8
2.9
-0.2 -0.3
0.4
0
1
2
3
4
5
-1
0
1
2
3
1980s 1990s 2000s 1980s 1990s 2000s
Growth in average income Change in B40 income share
Mean (LHS)
Standard deviation (RHS)
30
44
34
43
635759
79 79
20
30
40
50
60
70
80
90
LIC MIC HIC
B10 B20 B40
59
41
32
74
61
52
8577
72
20
30
40
50
60
70
80
90
1980s 1990s 2000s
B10 B20 B40
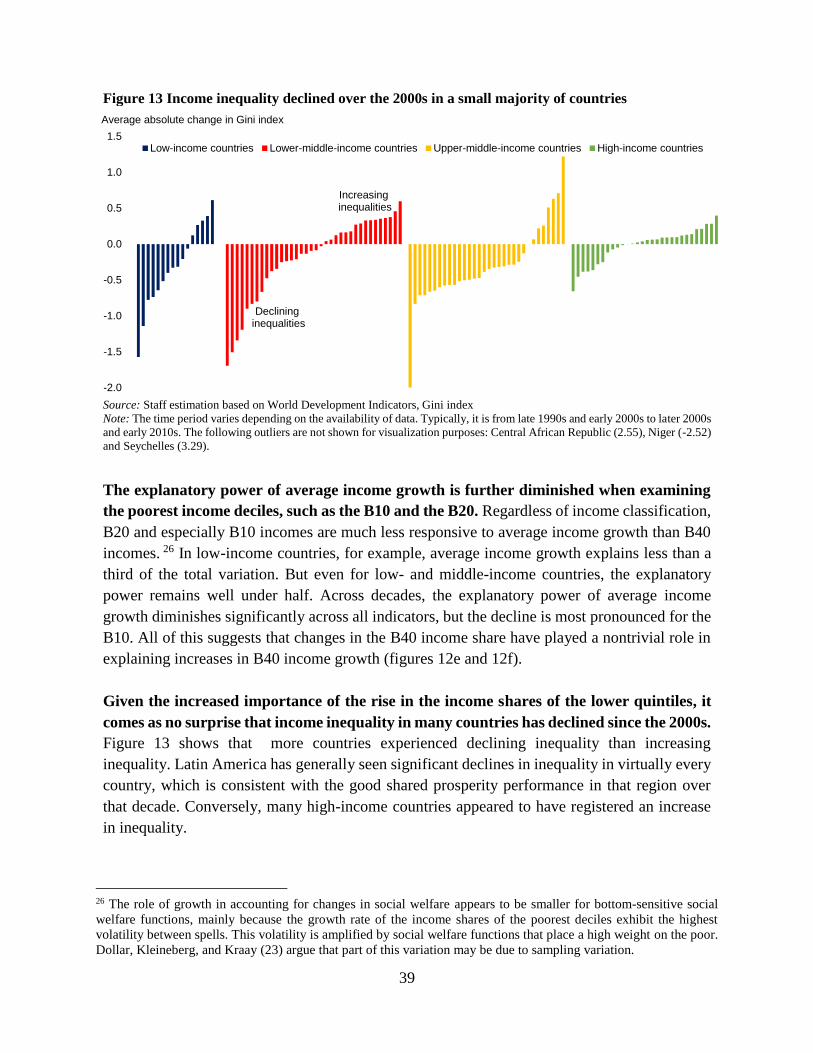
39
Figure 13 Income inequality declined over the 2000s in a small majority of countries
Average absolute change in Gini index
Source: Staff estimation based on World Development Indicators, Gini index
Note: The time period varies depending on the availability of data. Typically, it is from late 1990s and early 2000s to later 2000s
and early 2010s. The following outliers are not shown for visualization purposes: Central African Republic (2.55), Niger (-2.52)
and Seychelles (3.29).
The explanatory power of average income growth is further diminished when examining
the poorest income deciles, such as the B10 and the B20. Regardless of income classification,
B20 and especially B10 incomes are much less responsive to average income growth than B40
incomes. 26 In low-income countries, for example, average income growth explains less than a
third of the total variation. But even for low- and middle-income countries, the explanatory
power remains well under half. Across decades, the explanatory power of average income
growth diminishes significantly across all indicators, but the decline is most pronounced for the
B10. All of this suggests that changes in the B40 income share have played a nontrivial role in
explaining increases in B40 income growth (figures 12e and 12f).
Given the increased importance of the rise in the income shares of the lower quintiles, it
comes as no surprise that income inequality in many countries has declined since the 2000s.
Figure 13 shows that more countries experienced declining inequality than increasing
inequality. Latin America has generally seen significant declines in inequality in virtually every
country, which is consistent with the good shared prosperity performance in that region over
that decade. Conversely, many high-income countries appeared to have registered an increase
in inequality.
26 The role of growth in accounting for changes in social welfare appears to be smaller for bottom-sensitive social
welfare functions, mainly because the growth rate of the income shares of the poorest deciles exhibit the highest
volatility between spells. This volatility is amplified by social welfare functions that place a high weight on the poor.
Dollar, Kleineberg, and Kraay (23) argue that part of this variation may be due to sampling variation.
-2.0
-1.5
-1.0
-0.5
0.0
0.5
1.0
1.5Low-income countries Lower-middle-income countries Upper-middle-income countries High-income countries
Declining inequalities
Increasing inequalities
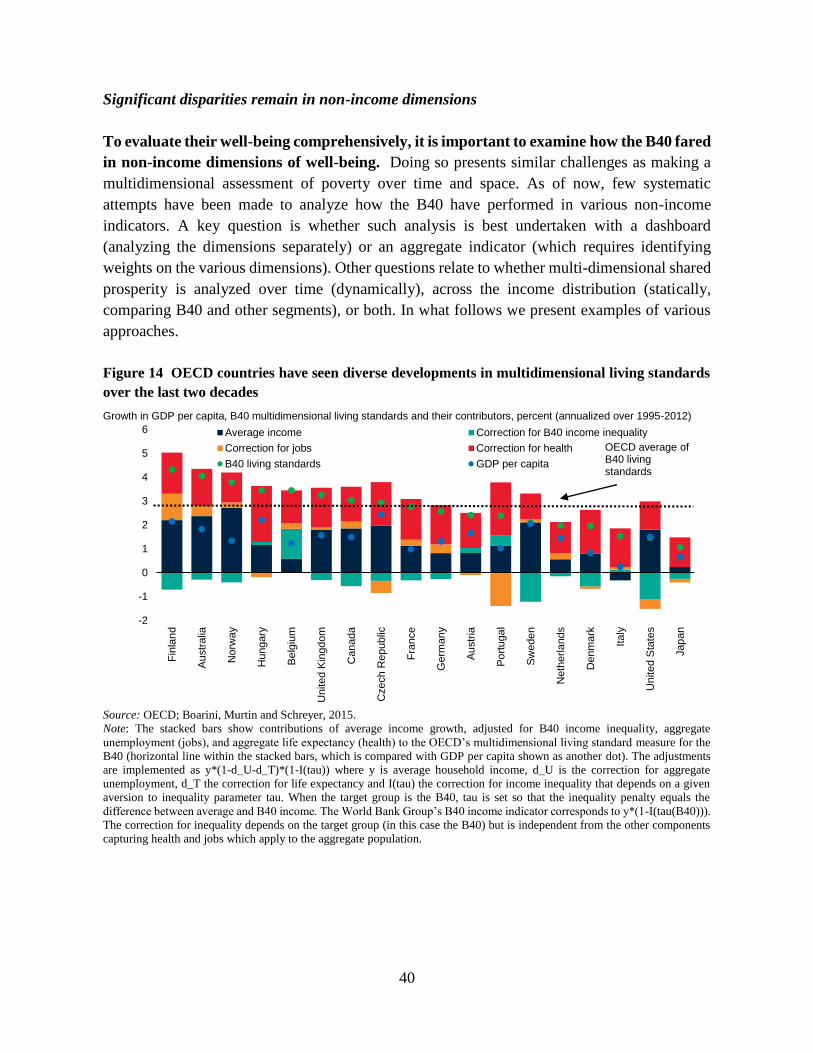
40
Significant disparities remain in non-income dimensions
To evaluate their well-being comprehensively, it is important to examine how the B40 fared
in non-income dimensions of well-being. Doing so presents similar challenges as making a
multidimensional assessment of poverty over time and space. As of now, few systematic
attempts have been made to analyze how the B40 have performed in various non-income
indicators. A key question is whether such analysis is best undertaken with a dashboard
(analyzing the dimensions separately) or an aggregate indicator (which requires identifying
weights on the various dimensions). Other questions relate to whether multi-dimensional shared
prosperity is analyzed over time (dynamically), across the income distribution (statically,
comparing B40 and other segments), or both. In what follows we present examples of various
approaches.
Figure 14 OECD countries have seen diverse developments in multidimensional living standards
over the last two decades
Growth in GDP per capita, B40 multidimensional living standards and their contributors, percent (annualized over 1995-2012)
Source: OECD; Boarini, Murtin and Schreyer, 2015.
Note: The stacked bars show contributions of average income growth, adjusted for B40 income inequality, aggregate
unemployment (jobs), and aggregate life expectancy (health) to the OECD’s multidimensional living standard measure for the
B40 (horizontal line within the stacked bars, which is compared with GDP per capita shown as another dot). The adjustments
are implemented as y*(1-d_U-d_T)*(1-I(tau)) where y is average household income, d_U is the correction for aggregate
unemployment, d_T the correction for life expectancy and I(tau) the correction for income inequality that depends on a given
aversion to inequality parameter tau. When the target group is the B40, tau is set so that the inequality penalty equals the
difference between average and B40 income. The World Bank Group’s B40 income indicator corresponds to y*(1-I(tau(B40))).
The correction for inequality depends on the target group (in this case the B40) but is independent from the other components
capturing health and jobs which apply to the aggregate population.
-2
-1
0
1
2
3
4
5
6
Fin
lan
d
Au
str
alia
Norw
ay
Hungary
Be
lgiu
m
United K
ingdom
Canada
Cze
ch R
epublic
Fra
nce
Germ
any
Au
str
ia
Po
rtuga
l
Sw
eden
Neth
erla
nds
Denm
ark
Ita
ly
United S
tate
s
Jap
an
Average income Correction for B40 income inequality
Correction for jobs Correction for health
B40 living standards GDP per capita
OECD average of B40 living standards
41
The evolution of living standards in OECD countries has seen marked cross-country
differences over the last two decades. The OECD multidimensional living standards metric is
one example of an aggregate measure that can be compared over time and across the income
distribution. Figure 14 shows the implementation of the measure for the B40 target group, where
average household income growth and B40 inequality are considered together with aggregate
measures for jobs (unemployment) and health (life expectancy).27 The measure suggests positive
developments in many of the 18 countries: reduced B40 inequality (14 countries), supportive
employment conditions (11 countries) and rising life expectancy (all countries). At the same time,
significant diversity is observed when the various dimensions are considered jointly, with Finland
and Australia registering living standard improvements at an annualized rate over the last two
decades of 4.3 and 4.1 percent, respectively, and the United States and Japan registering much-
smaller improvements at 1.5 and 1.1 percent, respectively.
Despite robust income growth in developing countries, large disparities linger in the access
of the B40 to education, health, and other non-income dimensions. Among developing
countries, women in the B40 group face more difficult access to health care compared with the
T60 and their children are more likely to die before age 5 (figures 15a and b). Many people around
the world, especially those in the B40, report that they do not always have enough money to feed
themselves or their families (figure 15c). Unsurprisingly, their children are more likely to be
underweight (figure 15d). Primary enrollment may have increased in many developing countries,
but access to primary education remains unequal (World Bank 2014a, 2015c).28 Among lower-
income countries, a larger share of children in B40 families are out of school (figure 13e). These
inequalities transmit to outcomes, as international test scores in math suggest (figure 15f, with the
same results for science). The B40 appear to be disadvantaged in areas other than health and
education. Examples from Latin America suggest unequal access to the Internet and to basic
services such as piped water (figures 15g and 15h).
Intergenerational transmission of inequality of opportunity explains part of the persistence
of these disparities among the B40. Although the definition of “opportunities” is still being
debated, most societies define them as a set of basic goods and services in the early life of an
individual, which improve the probability of success in life, and in most cases are considered basic
economic and social rights (Barros and others 2009). The “accident of birth” into a B40 household
that does not enjoy equal opportunity in these important basic goods and services is likely to be
transmitted to the next generation. Indeed, the higher the inequality of opportunity, the greater the
persistence in income inequality from one generation to the next (Brunori, Ferreira, and Peragine
2013).29
27 Efforts are under way to incorporate inequality in longevity and unemployment across educational groups. 28 Primary completion rates in low-income countries are 20–30 percent for the B40 (70–100 percent for the T20).
Even in middle-income countries, such as Albania, Lesotho, Nicaragua, and Nigeria, the gaps are significant. 29 For example, among 41 countries, the index of the inequality of opportunity is 2 percent in Norway compared with
34 percent in Guatemala.
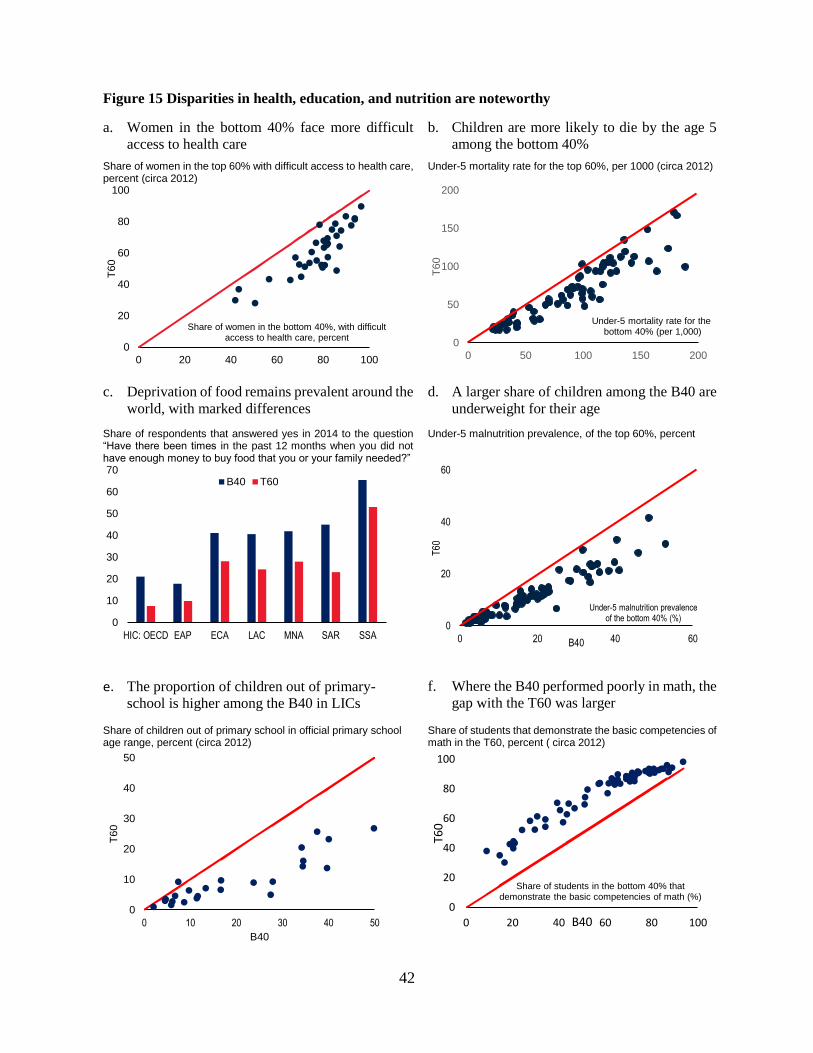
42
Figure 15 Disparities in health, education, and nutrition are noteworthy
a. Women in the bottom 40% face more difficult
access to health care
b. Children are more likely to die by the age 5
among the bottom 40%
Share of women in the top 60% with difficult access to health care, percent (circa 2012)
Under-5 mortality rate for the top 60%, per 1000 (circa 2012)
c. Deprivation of food remains prevalent around the
world, with marked differences d. A larger share of children among the B40 are
underweight for their age
Share of respondents that answered yes in 2014 to the question “Have there been times in the past 12 months when you did not have enough money to buy food that you or your family needed?”
Under-5 malnutrition prevalence, of the top 60%, percent
e. The proportion of children out of primary-
school is higher among the B40 in LICs f. Where the B40 performed poorly in math, the
gap with the T60 was larger
Share of children out of primary school in official primary school age range, percent (circa 2012)
Share of students that demonstrate the basic competencies of math in the T60, percent ( circa 2012)
0
20
40
60
80
100
0 20 40 60 80 100
T6
0
Share of women in the bottom 40%, with difficult access to health care, percent
0
50
100
150
200
0 50 100 150 200
T6
0
Under-5 mortality rate for thebottom 40% (per 1,000)
0
10
20
30
40
50
60
70
HIC: OECD EAP ECA LAC MNA SAR SSA
B40 T60
0
20
40
60
0 20 40 60
T60
B40
Under-5 malnutrition prevalenceof the bottom 40% (%)
0
10
20
30
40
50
0 10 20 30 40 50
T6
0
B40
0
20
40
60
80
100
0 20 40 60 80 100
T60
B40
Share of students in the bottom 40% thatdemonstrate the basic competencies of math (%)
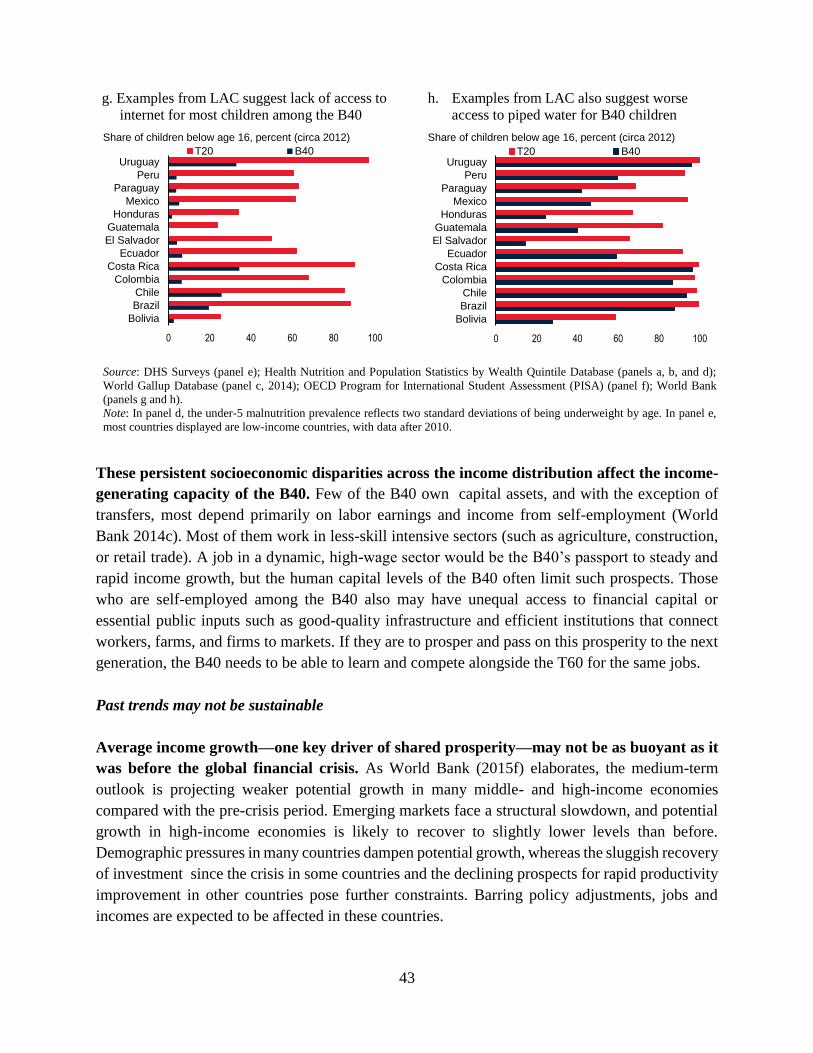
43
g. Examples from LAC suggest lack of access to
internet for most children among the B40
h. Examples from LAC also suggest worse
access to piped water for B40 children
Share of children below age 16, percent (circa 2012) Share of children below age 16, percent (circa 2012)
Source: DHS Surveys (panel e); Health Nutrition and Population Statistics by Wealth Quintile Database (panels a, b, and d);
World Gallup Database (panel c, 2014); OECD Program for International Student Assessment (PISA) (panel f); World Bank
(panels g and h).
Note: In panel d, the under-5 malnutrition prevalence reflects two standard deviations of being underweight by age. In panel e,
most countries displayed are low-income countries, with data after 2010.
These persistent socioeconomic disparities across the income distribution affect the income-
generating capacity of the B40. Few of the B40 own capital assets, and with the exception of
transfers, most depend primarily on labor earnings and income from self-employment (World
Bank 2014c). Most of them work in less-skill intensive sectors (such as agriculture, construction,
or retail trade). A job in a dynamic, high-wage sector would be the B40’s passport to steady and
rapid income growth, but the human capital levels of the B40 often limit such prospects. Those
who are self-employed among the B40 also may have unequal access to financial capital or
essential public inputs such as good-quality infrastructure and efficient institutions that connect
workers, farms, and firms to markets. If they are to prosper and pass on this prosperity to the next
generation, the B40 needs to be able to learn and compete alongside the T60 for the same jobs.
Past trends may not be sustainable
Average income growth—one key driver of shared prosperity—may not be as buoyant as it
was before the global financial crisis. As World Bank (2015f) elaborates, the medium-term
outlook is projecting weaker potential growth in many middle- and high-income economies
compared with the pre-crisis period. Emerging markets face a structural slowdown, and potential
growth in high-income economies is likely to recover to slightly lower levels than before.
Demographic pressures in many countries dampen potential growth, whereas the sluggish recovery
of investment since the crisis in some countries and the declining prospects for rapid productivity
improvement in other countries pose further constraints. Barring policy adjustments, jobs and
incomes are expected to be affected in these countries.
0 20 40 60 80 100
Bolivia
Brazil
Chile
Colombia
Costa Rica
Ecuador
El Salvador
Guatemala
Honduras
Mexico
Paraguay
Peru
UruguayT20 B40
0 20 40 60 80 100
Bolivia
Brazil
Chile
Colombia
Costa Rica
Ecuador
El Salvador
Guatemala
Honduras
Mexico
Paraguay
Peru
UruguayT20 B40
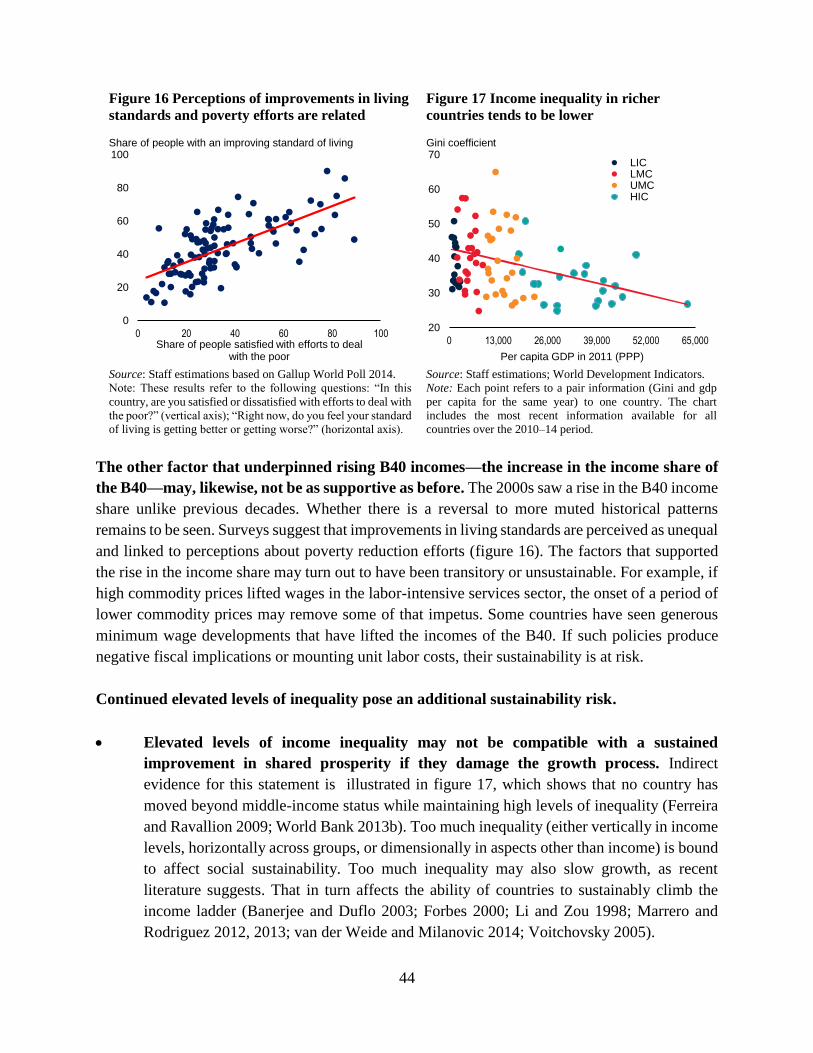
44
Figure 16 Perceptions of improvements in living
standards and poverty efforts are related
Figure 17 Income inequality in richer
countries tends to be lower
Share of people with an improving standard of living Gini coefficient
Source: Staff estimations based on Gallup World Poll 2014.
Note: These results refer to the following questions: “In this
country, are you satisfied or dissatisfied with efforts to deal with
the poor?” (vertical axis); “Right now, do you feel your standard
of living is getting better or getting worse?” (horizontal axis).
Source: Staff estimations; World Development Indicators.
Note: Each point refers to a pair information (Gini and gdp
per capita for the same year) to one country. The chart
includes the most recent information available for all
countries over the 2010–14 period.
The other factor that underpinned rising B40 incomes—the increase in the income share of
the B40—may, likewise, not be as supportive as before. The 2000s saw a rise in the B40 income
share unlike previous decades. Whether there is a reversal to more muted historical patterns
remains to be seen. Surveys suggest that improvements in living standards are perceived as unequal
and linked to perceptions about poverty reduction efforts (figure 16). The factors that supported
the rise in the income share may turn out to have been transitory or unsustainable. For example, if
high commodity prices lifted wages in the labor-intensive services sector, the onset of a period of
lower commodity prices may remove some of that impetus. Some countries have seen generous
minimum wage developments that have lifted the incomes of the B40. If such policies produce
negative fiscal implications or mounting unit labor costs, their sustainability is at risk.
Continued elevated levels of inequality pose an additional sustainability risk.
Elevated levels of income inequality may not be compatible with a sustained
improvement in shared prosperity if they damage the growth process. Indirect
evidence for this statement is illustrated in figure 17, which shows that no country has
moved beyond middle-income status while maintaining high levels of inequality (Ferreira
and Ravallion 2009; World Bank 2013b). Too much inequality (either vertically in income
levels, horizontally across groups, or dimensionally in aspects other than income) is bound
to affect social sustainability. Too much inequality may also slow growth, as recent
literature suggests. That in turn affects the ability of countries to sustainably climb the
income ladder (Banerjee and Duflo 2003; Forbes 2000; Li and Zou 1998; Marrero and
Rodriguez 2012, 2013; van der Weide and Milanovic 2014; Voitchovsky 2005).
0
20
40
60
80
100
0 20 40 60 80 100Share of people satisfied with efforts to deal
with the poor
20
30
40
50
60
70
0 13,000 26,000 39,000 52,000 65,000
Per capita GDP in 2011 (PPP)
LICLMCUMCHIC
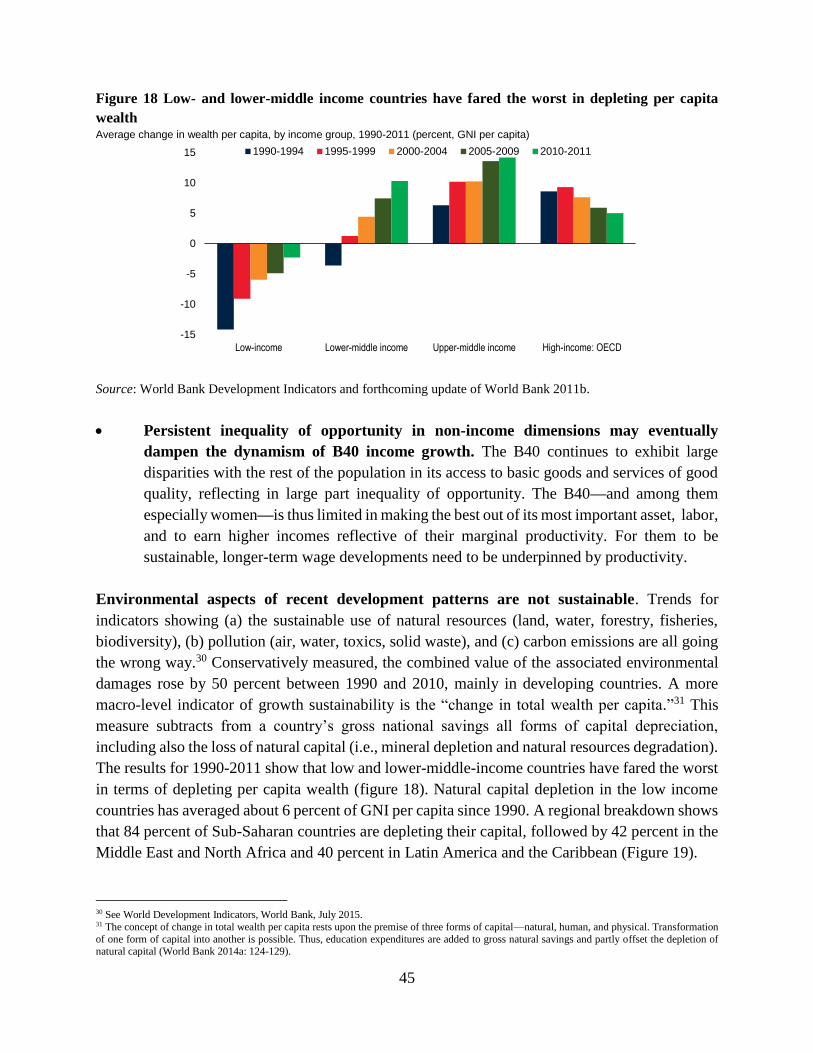
45
Figure 18 Low- and lower-middle income countries have fared the worst in depleting per capita
wealth Average change in wealth per capita, by income group, 1990-2011 (percent, GNI per capita)
Source: World Bank Development Indicators and forthcoming update of World Bank 2011b.
Persistent inequality of opportunity in non-income dimensions may eventually
dampen the dynamism of B40 income growth. The B40 continues to exhibit large
disparities with the rest of the population in its access to basic goods and services of good
quality, reflecting in large part inequality of opportunity. The B40—and among them
especially women—is thus limited in making the best out of its most important asset, labor,
and to earn higher incomes reflective of their marginal productivity. For them to be
sustainable, longer-term wage developments need to be underpinned by productivity.
Environmental aspects of recent development patterns are not sustainable. Trends for
indicators showing (a) the sustainable use of natural resources (land, water, forestry, fisheries,
biodiversity), (b) pollution (air, water, toxics, solid waste), and (c) carbon emissions are all going
the wrong way.30 Conservatively measured, the combined value of the associated environmental
damages rose by 50 percent between 1990 and 2010, mainly in developing countries. A more
macro-level indicator of growth sustainability is the “change in total wealth per capita.”31 This
measure subtracts from a country’s gross national savings all forms of capital depreciation,
including also the loss of natural capital (i.e., mineral depletion and natural resources degradation).
The results for 1990-2011 show that low and lower-middle-income countries have fared the worst
in terms of depleting per capita wealth (figure 18). Natural capital depletion in the low income
countries has averaged about 6 percent of GNI per capita since 1990. A regional breakdown shows
that 84 percent of Sub-Saharan countries are depleting their capital, followed by 42 percent in the
Middle East and North Africa and 40 percent in Latin America and the Caribbean (Figure 19).
30 See World Development Indicators, World Bank, July 2015. 31 The concept of change in total wealth per capita rests upon the premise of three forms of capital—natural, human, and physical. Transformation
of one form of capital into another is possible. Thus, education expenditures are added to gross natural savings and partly offset the depletion of natural capital (World Bank 2014a: 124-129).
-15
-10
-5
0
5
10
15
Low-income Lower-middle income Upper-middle income High-income: OECD
1990-1994 1995-1999 2000-2004 2005-2009 2010-2011
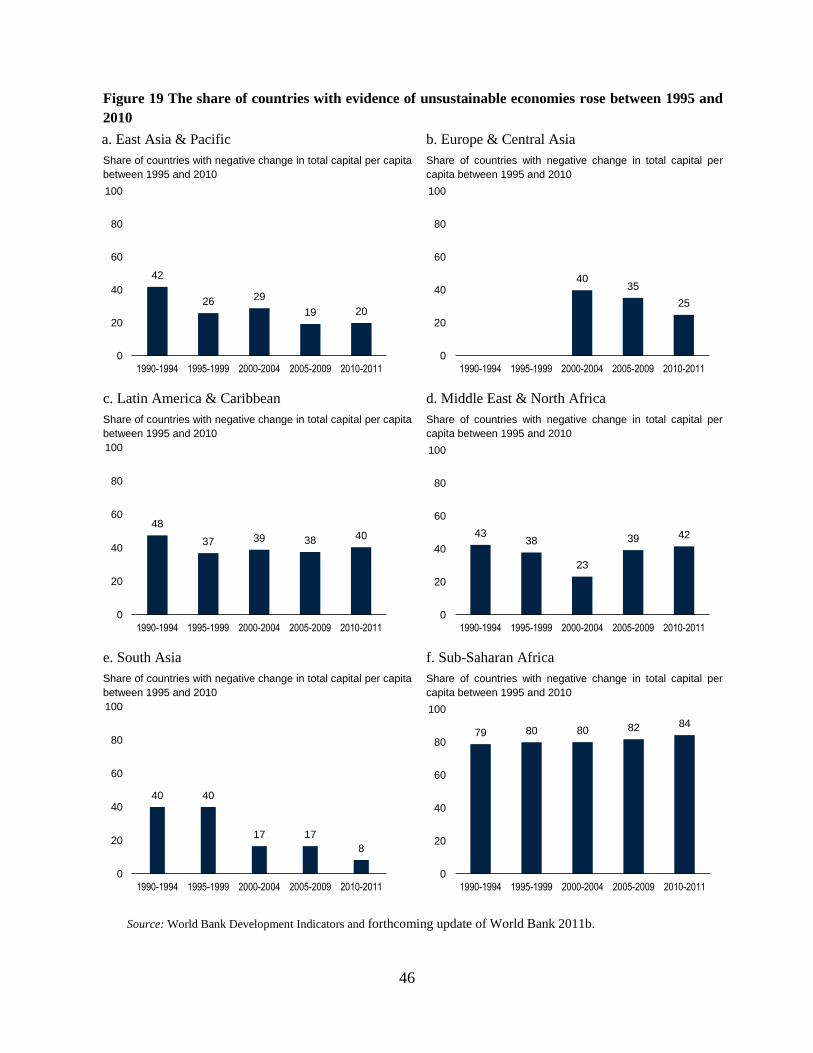
46
Figure 19 The share of countries with evidence of unsustainable economies rose between 1995 and
2010
a. East Asia & Pacific b. Europe & Central Asia
Share of countries with negative change in total capital per capita
between 1995 and 2010
Share of countries with negative change in total capital per
capita between 1995 and 2010
c. Latin America & Caribbean d. Middle East & North Africa
Share of countries with negative change in total capital per capita
between 1995 and 2010
Share of countries with negative change in total capital per
capita between 1995 and 2010
e. South Asia f. Sub-Saharan Africa
Share of countries with negative change in total capital per capita
between 1995 and 2010
Share of countries with negative change in total capital per
capita between 1995 and 2010
Source: World Bank Development Indicators and forthcoming update of World Bank 2011b.
42
26 29
19 20
0
20
40
60
80
100
1990-1994 1995-1999 2000-2004 2005-2009 2010-2011
4035
25
0
20
40
60
80
100
1990-1994 1995-1999 2000-2004 2005-2009 2010-2011
48
37 39 38 40
0
20
40
60
80
100
1990-1994 1995-1999 2000-2004 2005-2009 2010-2011
4338
23
39 42
0
20
40
60
80
100
1990-1994 1995-1999 2000-2004 2005-2009 2010-2011
40 40
17 17
8
0
20
40
60
80
100
1990-1994 1995-1999 2000-2004 2005-2009 2010-2011
79 80 80 82 84
0
20
40
60
80
100
1990-1994 1995-1999 2000-2004 2005-2009 2010-2011
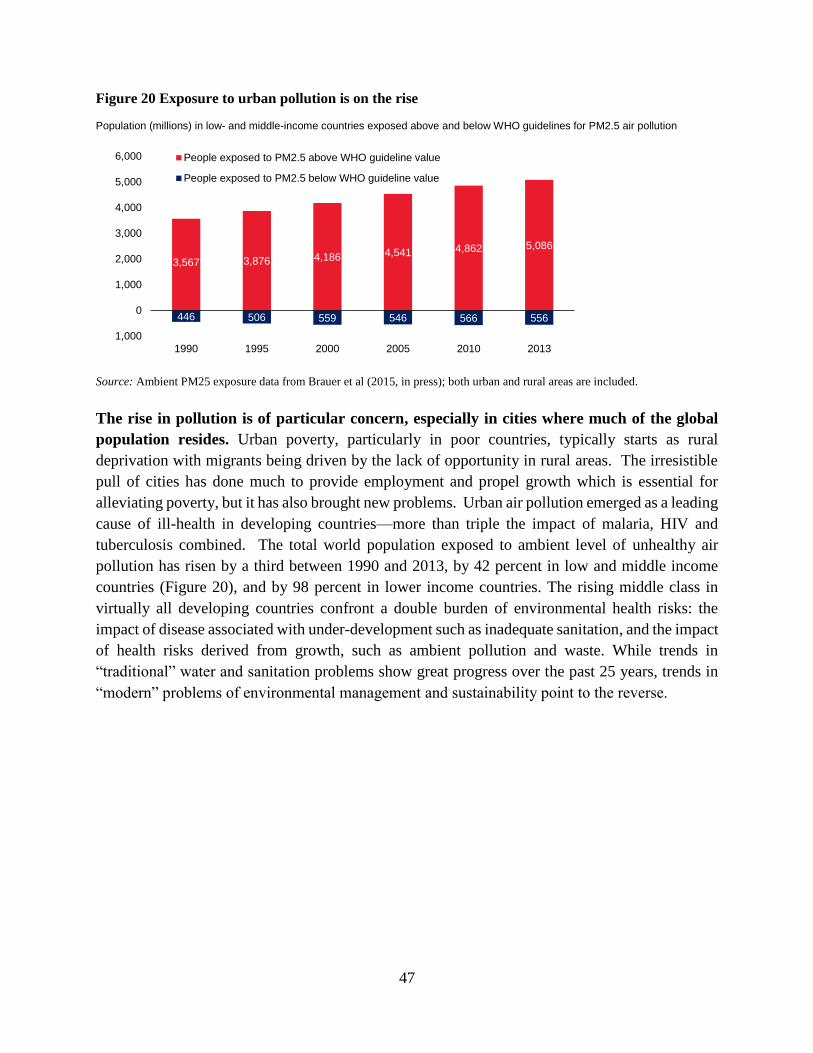
47
Figure 20 Exposure to urban pollution is on the rise
Population (millions) in low- and middle-income countries exposed above and below WHO guidelines for PM2.5 air pollution
Source: Ambient PM25 exposure data from Brauer et al (2015, in press); both urban and rural areas are included.
The rise in pollution is of particular concern, especially in cities where much of the global
population resides. Urban poverty, particularly in poor countries, typically starts as rural
deprivation with migrants being driven by the lack of opportunity in rural areas. The irresistible
pull of cities has done much to provide employment and propel growth which is essential for
alleviating poverty, but it has also brought new problems. Urban air pollution emerged as a leading
cause of ill-health in developing countries—more than triple the impact of malaria, HIV and
tuberculosis combined. The total world population exposed to ambient level of unhealthy air
pollution has risen by a third between 1990 and 2013, by 42 percent in low and middle income
countries (Figure 20), and by 98 percent in lower income countries. The rising middle class in
virtually all developing countries confront a double burden of environmental health risks: the
impact of disease associated with under-development such as inadequate sanitation, and the impact
of health risks derived from growth, such as ambient pollution and waste. While trends in
“traditional” water and sanitation problems show great progress over the past 25 years, trends in
“modern” problems of environmental management and sustainability point to the reverse.
446 506 559 546 566 556
3,567 3,876 4,186 4,541 4,862 5,086
1,000
0
1,000
2,000
3,000
4,000
5,000
6,000
1990 1995 2000 2005 2010 2013
People exposed to PM2.5 above WHO guideline value
People exposed to PM2.5 below WHO guideline value
48
IV. Ending Extreme Poverty and Sharing Prosperity: Policy Agenda
Putting an end to extreme poverty and promoting shared prosperity are ongoing challenges.
Country circumstances and contexts differ, and so policy priorities will also vary across countries.
For example, some countries have eradicated extreme poverty already and therefore the second
goal on shared prosperity is more relevant for them. In addition, significant overlap exists in the
types of policies needed to end poverty or share prosperity and these hold relevance for a broad
set of countries.
This section delineates the policy agenda and articulates key priorities that are of common
interest to a wide range of countries. First, it examines the rationale for policy intervention,
examines the possible synergies between goals of ending extreme poverty and sharing prosperity,
and explores how efficiency and equity interact. Second, it spells out a three-component strategy
that centers on growth, investment and insurance.
A. Delineating policy approaches
In light of country specifics, is there a common ground among policy approaches that
purport to end poverty and share prosperity? The answer is yes, but the policy mix needs to be
sensitive to the complementarities and trade-offs between the two goals.
Growth with equity is essential for meeting the two goals
The policy agenda underpinning the World Bank Group’s goals is “growth-with-equity”.
Growth has played a key role in reducing extreme poverty and promoting shared prosperity and is
critical to sustaining progress. Yet, aggregate growth by itself is not enough; it needs to be pursued
with equity, complemented by policies that enable the poorest and the B40 to fully participate in
and benefit from the growth process. To pursue growth without equity would be socially
destabilizing and to pursue equity without growth would tend to “redistribute economic
stagnation,” as Robert McNamara stated in 1980.32
32 Specifically, McNamara said: “The two goals are intrinsically related, though governments are often tempted to
pursue one without adequate attention to the other. But from a development point of view that approach always fails
in the end. For the pursuit of growth without a reasonable concern for equity is ultimately socially destabilizing, and
often violently so. And the pursuit of equity without a reasonable concern for growth merely tends to redistribute
economic stagnation. Neither pursuit, taken by itself, can lead to sustained, successful development.” (McNamara
1980).
49
The two aspects of equity that delineate the policy agenda are avoidance of absolute
deprivation and equality of opportunity. The quest to end extreme poverty builds on the societal
preference to avoid absolute deprivation and protect the livelihoods of its poorest members
regardless of whether the equal opportunity principle has been upheld. The quest to promote shared
prosperity reflects the principle of equal opportunity, whereby the outcomes of a person’s life, in
its many dimensions, should mostly reflect his or her efforts and talents, not his or her background.
The notion of pursuing the World Bank Group’s goals in an economically, environmentally and
socially sustainable manner in turn serves equity and the equality of opportunity intertemporally,
reaching future generations, who then too can live lives without deprivation and full of
opportunity.
The poverty and shared prosperity goals are mutually reinforcing
Country circumstances will determine the relative importance of the extreme poverty and
shared prosperity goals, as the B40 may comprise many possible populations (box 8). In
countries where extreme poverty rates are around 40 percent, the two goals almost completely
overlap: increasing the income growth of the B40 accelerates the reduction of poverty and
promotes shared prosperity. In countries where extreme poverty rates are significantly greater than
40 percent (mostly in Sub-Saharan Africa), the shared prosperity goal implies a focus on the
poorest of the poor and therefore has a narrower scope than the poverty eradication goal. In other
countries, where extreme poverty exists but at rates well below 40 percent, the shared prosperity
objective is broader than the poverty goal because it includes a potentially much larger group of
those who are in absolute terms moderately poor or vulnerable to falling into poverty. Finally, in
countries where extreme poverty is no longer an issue, the shared prosperity objective offers a lens
on those who are relatively poor, a concept intrinsically connected to inequality.
In countries where poverty reduction is a key priority, the shared prosperity lens enhances
that effort. In some countries, shared prosperity may complement national poverty lines and
strengthen the focus on the poor. In others, it may help broaden the focus of international poverty
lines to whomever national authorities consider to be deprived based on the standards of their
societies. In all of these circumstances, shared prosperity is doubly good for the poor: First,
effective shared prosperity strategies that expand the opportunities of the B40 through greater
participation in the development process will affect poverty reduction directly if indeed many of
the B40 are poor. Second, to the extent that shared prosperity reduces inequality, the poverty
reduction power of future economic growth is likely to be enhanced, leading to a greater growth
elasticity of poverty reduction.33
33 World Bank (2005) finds that this elasticity is close to zero in countries with high income inequality.
50
This reinforced focus on poverty reduction is essential if the world is to reach the ambitious
goal of 3 percent global poverty by 2030. As is argued in World Bank (2015c), meeting the
poverty goal by 2030 requires both strong aggregate economic growth and an increase in the
income share of the extremely poor. Reductions in inequality arising from higher income growth
among the B40 can make the difference. One estimate suggests that a shared prosperity premium
of 2 percentage points, which requires B40 incomes to grow significantly faster than mean
incomes, is necessary to achieve the poverty goal (Lakner, Negre, and Prydz 2014). This focus on
raising the income share of the poor will be all the more necessary given the ambitiousness of the
poverty target, the elevated poverty rates that are expected to persist in much of Sub-Saharan
Africa, and the large number of people in Sub-Saharan Africa and South Asia who are expected to
continue experiencing multiple deprivations beyond income poverty.
“More equitable” need not mean “less efficient”
The equity-efficiency trade-off has for a long time animated the discussion on the feasibility
and desirability of redistributive policies. Arthur Okun hypothesized that redistributive policies
intended to reduce inequality imply a “big trade-off,” where lower inequality can be achieved only
at a great efficiency cost (the “leaky buckets” hypothesis).34 The trade-off rests on the premise that
markets work perfectly and that redistribution produces administrative costs, disincentive effects,
and productivity distortions. In the presence of market failures, however, the equity-efficiency
trade-off need not always hold, a fact that gives rise to the possibility of redistributive policies that
also enhance efficiency (World Bank 2005).35 While complementarities exist between equity and
efficiency, this is not to say that the trade-off does not exist anymore. In the presence of resource
constraints, many investment and policy choices will likely need to contend with a trade-off of
some sort (where the time horizon plays a key role in assessing the trade-off). How the trade-off
is resolved lies at the heart of how growth-with-equity is operationalized in the real world.
Given that such a trade-off need not always hold, policies may be able to simultaneously
improve growth and equity. Growth and its incidence across the income distribution are
determined jointly and therefore policies that affect one will also affect the other. An equity
component need not be embedded in each policy. It suffices that the overall package is consistent
with growth and equity and that the underlying process is fair (World Bank 2005). Moreover, there
is a substantial reform agenda that comprises policies that can simultaneously raise growth and
equity. Such synergistic, win-win policies address equality of opportunity and help broaden
34 The year 2015 marks the 40th anniversary of Arthur M. Okun’s famous book, Equality and Efficiency: The Big
Trade-Off. One of the original supply-side economists, Okun introduced the metaphor of the leaky bucket, which has
become famous among economists: “The money must be carried from the rich to the poor in a leaky bucket. Some of
it will simply disappear in transit, so the poor will not receive all the money that is taken from the rich” (Okun 1975,
p. 91). 35 Some financial inclusion policies, such as broadening credit access (in government’s efforts toward achieving
equitable opportunities) could entail a trade-off with macroeconomic stability even if it achieves higher growth (Sahay
et al. 2015).
51
participation in the process of growth; examples are policies that improve access to markets, level
the playing field for firms large and small, build human capabilities, and remove barriers to job
creation (Qureshi 2015).
Growth gives governments the fiscal space to implement redistributive policies that raise the
incomes and welfare of the poor and the B40. In the presence of significant failures in credit,
insurance, labor, or land markets one cannot presume that the market outcomes are efficient, and
there is scope for efficient and equitable redistributive policies. Policies that redistribute wealth
help poorer people overcome credit constraints to invest in human capital, or effectively insure
them against transient shocks, or targeted safety nets have dynamic efficiency effects that
ultimately support growth and enhance its sustainability.
More sustainable development does not imply lower growth
The promise of sustainable development requires greater commitment to green growth
policies. Such policies typically have the broad objectives of protecting and ensuring the
sustainable use of natural capital, improving environmental quality, and advancing lower carbon
and more resilient growth in the face of a changing climate. Green growth policies not only reduce
large welfare costs and environmental externalities, they can contribute directly to economic
growth and the well-being of the poor in several ways, including by: (a) promoting efficiency gains
that are cost-effective, reduce energy and materials use, and increase private sector profits; (b)
reducing future costs of natural resources, such as water, through improved management; (c)
improving the health and productivity of the work-force, and lower health expenses in the state
budget; (d) promoting the expansion of new industries and technologies offsetting losses in sunset
industries; (e) responding to changes in consumer preferences through expansion of less-polluting
and energy-intensive service industries (often including realizing opportunities that would
otherwise be lost, such as tourism); and (f) proactively adapting to disaster risks in ways that reduce
the impact of those risks, reduce costs, and improve knowledge.
52
Box 8 Who is in the B40?
To assess trends in shared prosperity and calibrate policies, it is essential to understand the
composition of the B40. Just like the poor, the B40 is not a static subgroup of the population. Some people
move in and out of the B40, whereas others are chronically at the lower end of the income distribution. Yet,
it is possible to characterize the B40 as a group. As shown below, the composition of the B40 is very
different across countries. These differences need to be taken into account when identifying strategies to
boost shared prosperity, which in some countries will overlap strongly with the struggle against extreme
poverty, whereas in others the connections with reducing inequality will be stronger.
The profile of the richest B40 person varies considerably across countries. Map B8.1 illustrates the
geographical distribution of the characteristics of the 40th percentile, identifying whether the richest person
belonging to the B40 is extremely poor as defined by the international poverty line, moderately poor,
vulnerable, or none of these but rather a member of the “middle class” or even rich.
Most of the countries in which the richest among the B40 are still extremely poor are in Sub-
Saharan Africa.
In some places in Sub-Saharan Africa, most of East Asia and the Pacific, and all of South Asia, the
richest of the B40 are moderately poor. The B40 in these countries thus consists entirely of
populations that are either extremely poor or moderately poor.
In most of Latin America and the Caribbean, the richest among the B40 is vulnerable. Following
impressive gains in shared prosperity that lifted many out of poverty, the richest B40 person
remains susceptible to falling back into poverty.
Overall, the B40 group as a whole encompasses many different combinations of extreme poverty,
moderate poverty, and vulnerability. At the top of figure B8.1a are countries where extreme poverty rates
exceed 40 percent, suggesting that a B40 focus in those countries would emphasize the poorest among the
extremely poor and potentially overlook others in extreme poverty above the bottom 40% cut-off but below
the extreme poverty line. Directly below are countries where moderate poverty is becoming an increasing
concern, since poverty rarely ends when a poor person climbs over the extreme poverty line. The lower half
of the figure shows countries where extreme poverty has been mostly eradicated, but many people remain
moderately poor, and a significant share may be characterized as vulnerable to falling back into poverty.
At the bottom of the figure are richer countries, where most of the B40 have become middle class and have
low risk of falling into extreme poverty.
Among richer countries, where absolute poverty is of lesser concern, the B40 may encompass many
of those who are considered to be relatively poor. Figure B8.1b shows that in OECD countries many of
the less well-off are considered to be living in relative poverty, even after taking into account transfers.
They are seen to be unable to enjoy an acceptable standard of living relative to that of the majority of the
population. Given that the relative poverty measure is based on a poverty line set at 60 percent of median
national income, the notion is more closely related to within-country inequality. Yet, it does show that the
focus on the B40 allows for flexibility in focusing on what societies care most about.
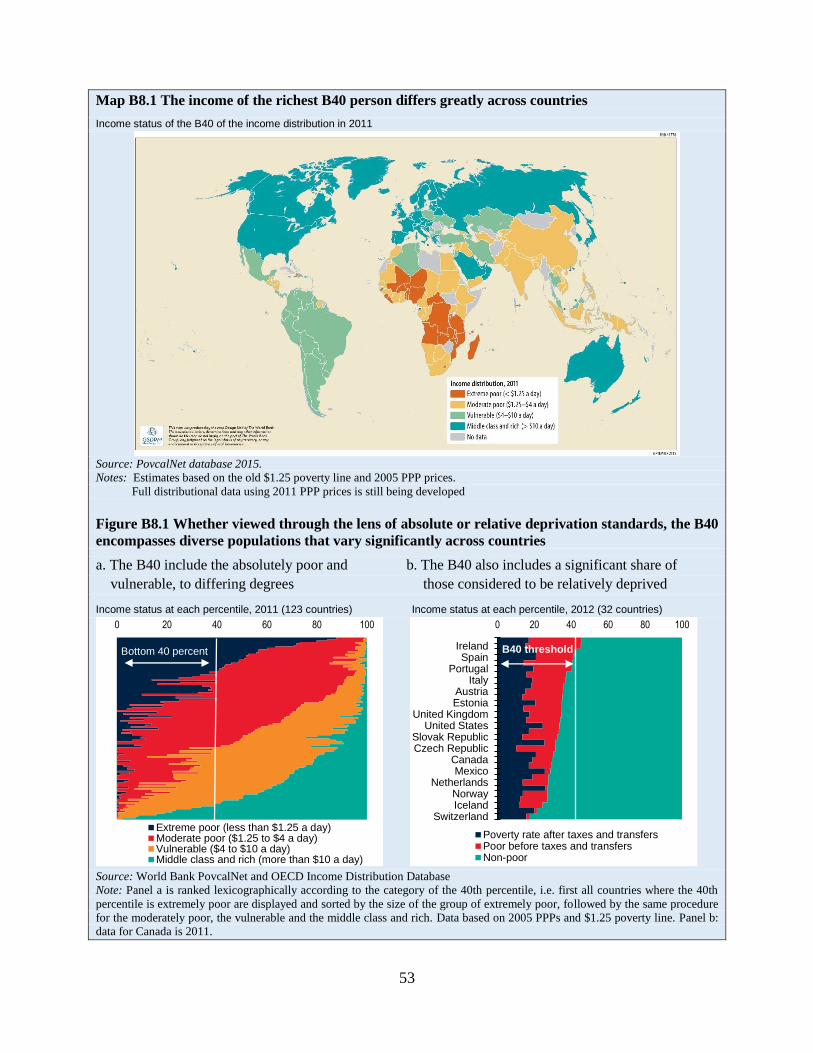
53
Map B8.1 The income of the richest B40 person differs greatly across countries
Income status of the B40 of the income distribution in 2011
Source: PovcalNet database 2015.
Notes: Estimates based on the old $1.25 poverty line and 2005 PPP prices.
Full distributional data using 2011 PPP prices is still being developed
Figure B8.1 Whether viewed through the lens of absolute or relative deprivation standards, the B40
encompasses diverse populations that vary significantly across countries
a. The B40 include the absolutely poor and b. The B40 also includes a significant share of
vulnerable, to differing degrees those considered to be relatively deprived
Income status at each percentile, 2011 (123 countries) Income status at each percentile, 2012 (32 countries)
Source: World Bank PovcalNet and OECD Income Distribution Database
Note: Panel a is ranked lexicographically according to the category of the 40th percentile, i.e. first all countries where the 40th
percentile is extremely poor are displayed and sorted by the size of the group of extremely poor, followed by the same procedure
for the moderately poor, the vulnerable and the middle class and rich. Data based on 2005 PPPs and $1.25 poverty line. Panel b:
data for Canada is 2011.
0 20 40 60 80 100
Extreme poor (less than $1.25 a day)Moderate poor ($1.25 to $4 a day)Vulnerable ($4 to $10 a day)Middle class and rich (more than $10 a day)
Bottom 40 percent
0 20 40 60 80 100
SwitzerlandIcelandNorway
NetherlandsMexico
CanadaCzech RepublicSlovak Republic
United StatesUnited Kingdom
EstoniaAustria
ItalyPortugal
SpainIreland
Poverty rate after taxes and transfersPoor before taxes and transfersNon-poor
B40 threshold
54
B. Identifying key policy ingredients
To sustainably end extreme poverty and boost shared prosperity, three policy ingredients
are needed in any strategy.36
Sustaining broad-based growth. Economic growth has been the main building block of
poverty reduction and shared prosperity over the past several decades. Among economies
that have managed to sustain rapid growth for extended periods, five characteristics are
common: effective leadership and governance, macroeconomic stability, a market
orientation to guide structural change, an outward orientation for domestic and external
discipline, and a future orientation to boost savings and meet investment needs. But growth
is not an end in itself. It is a means for increasing the incomes and well-being of people.
And it is most effective in reaching low-income people when it increases their labor
incomes by supporting productive employment. Policy makers must keep in mind the
effects of interventions on job creation and income growth for the extreme poor and the
B40.
Investing in human development. Human development is essential to remedying the
multidimensional deprivations of the poor and the B40 and a requirement for broad-based
economic growth. Vital human development investments include education, health and
population programs, safe water, and sanitation. These services are especially important
for children, whose opportunities early in life determine their future lives as adults. The
quality of services is also important. It is not enough to get kids to school: teachers need to
show up, textbooks need to arrive, and kids need to be taught in ways that enable them to
learn. Health clinics need to be staffed with trained personnel, stocked, and able to provide
adequate services. Effective service delivery, in turn, requires effective, accountable, and
transparent mechanisms and institutions.
Insuring against risks. Social policies can protect the extremely poor from destitution and
protect the vulnerable against risks. They can help families avoid irreversible losses and
prevent them from having to make decisions with costly long-run implications. Good social
programs support growth and human development and come in three kinds.
Noncontributory social assistance programs for the chronic or extreme poor protect them
from destitution and promote investments in their children’s human capital. Social
insurance programs prevent people falling back into poverty, whether caused by individual
illness, temporary unemployment, or localized droughts. And global insurance
mechanisms help countries cope with massive natural disasters or pandemics. To design
such programs, a dynamic understanding of poverty and vulnerability is essential.
36 This section builds on Gill and Revenga (2015) and World Bank (2010b, 2010c and 2014c).
55
In all of the above, it is essential that natural capital, environmental health, and ecosystem
sustainability concerns are integrated into economic decision-making. In both rural and urban
areas, poverty alleviation strategies need to give greater attention to the environmental and
resource dimensions of poverty because the number of people involved is large and the
consequences of neglect significant. Where resource dependence is high and opportunities for
economic diversification are limited, it is unlikely that policies can eliminate poverty without
acknowledging the critical role of natural resources in supporting the poor. Natural resources are
often the only significant assets that the poor have access to, and if managed efficiently they could
provide a sustainable foundation for economic viability. If not, however, the loss of natural capital
through weaknesses in property rights, poor local knowledge, price distortions, or poor
infrastructure means that eradicating poverty over the longer term will be unachievable.
Broad-based growth must be sustained over time
Continued progress in poverty reduction and shared prosperity requires economic
dynamism to generate income-earning opportunities for broad segments of society. As part
of this endeavor, economic growth—both its pace and pattern—is critical. In very poor countries,
it is arithmetically impossible to reduce poverty significantly without growth because the pool to
redistribute from is very small. In richer countries, growth again is key because it explains most
of the variation in income among the B40. In addition to the pace of growth, its pattern also matters.
Some kinds of growth benefit the poor or the B40 more effectively than others. The expansion of
smallholder farming or labor-intensive manufacturing, for example, may convey greater benefits
to the poor than the expansion of capital-intensive mining. Moreover, for growth to have a lasting
impact, it must be sustained over a long period of time. Sustained growth results in mass job
creation, making labor more scarce and valuable and thereby lifting incomes. Growth can thereby
bite deeply into poverty and contribute to prosperity by being shared within and between
generations.
Fast growth in labor-intensive sectors will help reduce poverty and share prosperity,
especially when coupled with efforts to increase labor force participation. Two distinct, but
not mutually exclusive, pathways for boosting labor incomes exist: fuller employment and higher
returns to employment. Growth in labor incomes was the foundation of the rapid reduction in
poverty in East Asia during the 1970s and 1980s, as well as in the developing countries that were
most successful at reducing poverty in the 1990s and 2000s. Much of the recovery since the 2008
economic crisis has been in the form of jobless growth, which has dampened the benefits of growth
for lower-income groups.
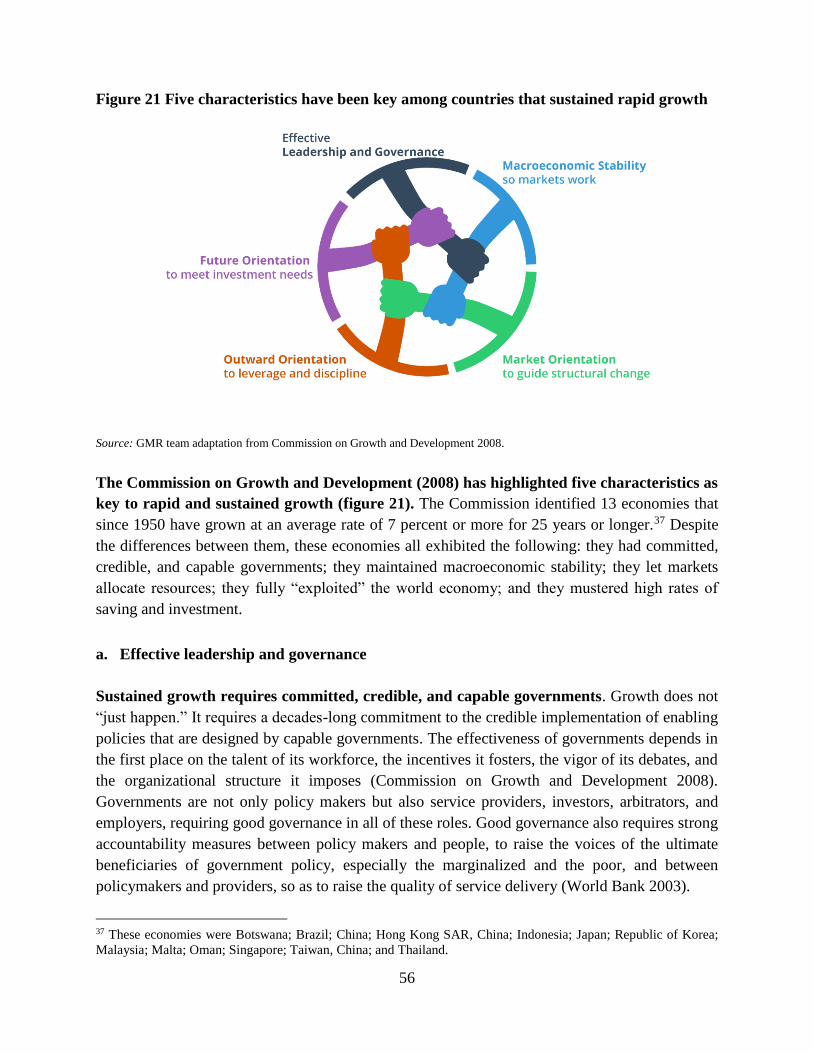
56
Figure 21 Five characteristics have been key among countries that sustained rapid growth
Source: GMR team adaptation from Commission on Growth and Development 2008.
The Commission on Growth and Development (2008) has highlighted five characteristics as
key to rapid and sustained growth (figure 21). The Commission identified 13 economies that
since 1950 have grown at an average rate of 7 percent or more for 25 years or longer.37 Despite
the differences between them, these economies all exhibited the following: they had committed,
credible, and capable governments; they maintained macroeconomic stability; they let markets
allocate resources; they fully “exploited” the world economy; and they mustered high rates of
saving and investment.
a. Effective leadership and governance
Sustained growth requires committed, credible, and capable governments. Growth does not
“just happen.” It requires a decades-long commitment to the credible implementation of enabling
policies that are designed by capable governments. The effectiveness of governments depends in
the first place on the talent of its workforce, the incentives it fosters, the vigor of its debates, and
the organizational structure it imposes (Commission on Growth and Development 2008).
Governments are not only policy makers but also service providers, investors, arbitrators, and
employers, requiring good governance in all of these roles. Good governance also requires strong
accountability measures between policy makers and people, to raise the voices of the ultimate
beneficiaries of government policy, especially the marginalized and the poor, and between
policymakers and providers, so as to raise the quality of service delivery (World Bank 2003).
37 These economies were Botswana; Brazil; China; Hong Kong SAR, China; Indonesia; Japan; Republic of Korea;
Malaysia; Malta; Oman; Singapore; Taiwan, China; and Thailand.
57
b. Macroeconomic stability so markets work
Macroeconomic stability is a key prerequisite for growth to flourish. Instability in price levels,
interest rates, the exchange rate, or the tax burden deter private investment. Sound macroeconomic
policies reduce distortions in relative prices and returns to assets and encourage investments in
productive sectors. Macroeconomic stability also ensures that fiscal resources are productively
used to finance critical expenditures, including in education, health and infrastructure, rather than
merely servicing the debt (Commission on Growth and Development 2008). The recent financial
crisis has brought to the fore the damaging consequences of macroeconomic instability on
economic growth and living standards, contributing to job losses, rising poverty levels, and thereby
endangering progress toward poverty reduction and shared prosperity.
c. Market orientation to guide structural change
Microeconomic dynamism is a necessary feature of an adaptive economy and, guided by the
market mechanism, a key driver of structural change. Growth entails structural transformation
within and across sectors.38 Within sectors, opportunities arise to deepen comparative advantages
and boost productivity by operating more efficiently and moving up the value chain. As
comparative advantages evolve, structural shifts occur between sectors, from agriculture to
industry and services, from rural to urban areas, and from informal to formal activities. Well-
functioning markets are essential to guide these processes. Their price signals ration scarce
resources to their most productive uses. This rationing is accomplished through competition,
buttressed by contestability in product markets and mobility in capital and labor markets.39 The
negative impact of inefficient resource allocation may not be immediately visible, but it will slowly
accrue over time. Recent evidence from the Latin America region suggests, for example, that 80
percent of the efficiency gap between the region and the United States is explained by
misallocation of resources, where the efficiency gap itself explains about half of the income gap
(Araujo et al. 2015). Key priorities are the following:
Accelerating productivity growth in agriculture. Increased agricultural productivity
growth is important because the majority of the poor continue to live in rural areas where
agriculture is central to their livelihoods. Special consideration is needed for women, who
make up over 43 percent of the global agricultural labor force, yet continue to face major
constraints reducing their productivity (O’Sullivan et al. 2014). Experience in all regions
38 Commission on Growth and Development (2008) notes: “The growth of GDP may be measured up in the
macroeconomic treetops, but all the action is in the microeconomic undergrowth, where new limbs sprout, and dead
wood is cleared away.” 39 Howitt, 2009. Aghion, Harris and Howitt (2001) find that greater competition, however, does not automatically lead
to faster productivity growth as preconditions need to be satisfied so that firms are sufficiently enabled to innovate.
For competition to effectively spur innovation, elementary risk mitigation and coping mechanisms need to be in place
to protect individuals—though not necessarily industries, firms or jobs—from the downside risks of failure.
58
has shown that improving the living conditions of the extreme and moderate poor hinges
on the creation of a dynamic agricultural sector. Despite some inroads into productivity-
enhancing agricultural technology, agricultural success stories in Africa are few compared
with the experiences in Asia and Latin America, and yields per hectare in Africa are about
the same as they were in 1970. Better output prices through more open trade (as seen in
Cambodia, Ethiopia, and Rwanda, among others) provide necessary incentives to adopt
fertilizer and improved seed varieties, especially when reinforced by complementary
policies to reduce the cost of inputs, such as improved infrastructure and access to finance
and insurance. Institutional measures such as land reform, market infrastructure, and more
effective producers’ organizations can catalyze investment in agriculture (Gill and
Revenga 2015).
Widening the economic footprint of natural resources. Many countries have
opportunities to enhance the economy-wide potential of the natural resource sector.
Depending on the location, suitable policies may include improved rural-to-urban
connectivity, stronger value-chains, rural finance, protection of community and indigenous
property rights, and environmental regulation. The potential pitfalls of natural resource-
based growth are well understood, both at the micro-level (resource degradation) and
macro-level (possible real exchange rate appreciation that may render the manufacturing
sector uncompetitive, and heightened volatility due to commodity prices). At the micro-
level the appropriate response to these potential negative effects is very location specific,
but often have to do with property rights, access, and fostering alternatives to traditional
practices. At the macro-level, appropriate policies include not limiting commodity exports
or erecting costly import barriers to protect domestic industries. Instead, policies should
alleviate demand and supply constraints on productivity activity by improving
infrastructure, creating a conducive investment climate, and facilitating private sector
access to capital, skills, technology and markets (Chandra, Lin, and Wang 2012; De
Cavalcanti, Mohaddes, and Raissi 2012; IMF 2011).
Sustaining competitiveness in manufacturing. In other countries, structural
transformation of the manufacturing sector will be a key priority. Competitive pressure has
transformed the landscape of manufacturing industries worldwide, placing a high premium
on maintaining a competitive edge in line with a country’s comparative advantage. For
poorer countries, where the fields are still so oversupplied with labor that the marginal
productivity of agricultural labor is low, the objective will be to efficiently produce low-
cost, high-volume, labor-intensive manufacturing goods, helping absorb low-skilled labor
in higher-value-added activities. For others, the objective is to move up the value chain
into more skill-intensive and innovation-driven manufacturing, and in the process to
develop new competitive niches, generating jobs and lifting incomes along the way. In both
cases, exposure to internal and external competition is key so that market forces can help
firms explore and develop their comparative advantages (World Bank 2010a, 2014c).
59
Raising the efficiency and quality of services. Many countries grapple with inefficiencies
in segments of their services sectors, producing a loss in productivity. Large segments of
the services sector remain informal, expensive, of low quality, and/or inefficient. Services
play a key role in economic growth and job creation. Improvements in the productivity,
quality and range of services contribute to economic growth directly but also indirectly,
given the role of services as inputs into all other sectors. Services are typically labor-
intensive and they may be skill-intensive too. Increased job creation in services can
contribute to poverty alleviation and B40 income growth. Enhanced service delivery in the
areas of education and health can also promote human capital development to the benefit
of longer-term growth prospects. A more dynamic services sector also allows countries to
insert themselves more fully into the production of tradable services—a rapidly growing
dimension of global trade (World Bank, 2010b and 2014b).
d. Outward orientation to leverage and discipline
Outward orientation—openness to the global economy—plays a distinct role in fostering
structural change and can contribute to growth in multiple ways. By leveraging the global
economy, domestic firms are offered deep, elastic markets for exports, which may support job
creation and income growth. Trade may also raise real incomes by lowering the prices of products.
For example, lower-priced consumption goods imports from China have helped expand Brazil’s
“consumption frontier” (World Bank 2014b). Trade openness provides an economy the freedom
to specialize in whatever it is best at producing, while also imposing discipline to use resources
efficiently. Labor mobility across borders may contribute to remittances and beneficial return
migration. Capital flows can complement domestic savings, alleviate credit constraints, and
impose discipline on macroeconomic policies. Knowledge flows contribute to ideas, technologies,
and know-how that are all shared and augmented across borders.
However, the capacity of the poor and the B40 to benefit from a greater outward orientation
is not guaranteed, suggesting a role for complementary and compensatory policies. It is
generally accepted that more open economies fare better in the aggregate than closed ones and that
relatively open policies contribute considerably to development. Yet, openness may lead to greater
uncertainty, and greater openness may not always be positive for the poorest in the short run; even
in the longer run, some people may be left behind in poverty (World Bank and WTO 2015).
Various challenges may be present, such as market barriers in agriculture, fragility and conflict,
informality, and gender biases. Complementary policies may help the poor to extract maximum
benefit. For example, trade facilitation can be strengthened and connectivity can be improved to
reduce remoteness from markets at the subnational level, broadening access for poor and small
traders. Moreover, since trade liberalization can produce adjustment costs that raise poverty,
compensatory policies can be considered to mitigate this impact (Winters, McCulloch, and McKay
2004).
60
e. Future orientation to meet investment needs
An orientation toward the future—the willingness to postpone current consumption in
return for higher consumption later—is essential to generate the savings needed to finance
investment. The speed of growth, especially in early stages of development, is limited mainly by
the pace of investment—both public and private—which reflects the availability of both domestic
and foreign savings. Future-oriented economies are characterized by their ability to raise funds
and invest them productively, generating lasting growth in the process. Investment needs are broad
and cover infrastructure as well as education and health. Public infrastructure investment (in roads,
ports, airports, and power) helps attract crowd in private investment and paves the way for
diversification and structural transformation. Financing infrastructure needs requires sufficient
fiscal space, but governments can also team up with the private sector in public-private
partnerships that share financial benefits and burdens while clearly delineating risks.
Access to infrastructure has potentially important effects on the ability of the poor to
generate income. Connective infrastructure is a crucial means of linking the farms and firms
where the poor live and work to markets. Electrification of poor areas in South Africa has resulted
in a 9 percentage point increase in female labor force participation, consumption, and earnings by
allowing reallocation of time use within the household thanks to time-saving appliances
(Dinkelman 2011). Along the same lines, rural electrification in India has caused changes in
consumption and earnings, with increases in the labor supply of both men and women, and
promoted girls’ schooling by reallocating their time to tasks more conducive to school attendance.
Investment in integration and connectedness through railroads in India helped reduce the exposure
of agricultural prices and real income to rainfall shocks, and helped diminish the famine and
mortality risks associated with recurrent weather shocks (Burgess and Donaldson 2010).
Investment in human development is key
Achieving the ambitious World Bank Group goals will require leveraging human resources
to their fullest potential. The capacity of households to contribute to overall growth and their
own well-being depends on the assets they control, the returns to these assets, and how intensively
the assets can be used (World Bank 2014c). The assets come in many forms, including human
capital (education, health, nutrition), financial capital, physical capital (land, machinery), and
social capital. Many of these assets—especially human and social capital—have both intrinsic and
instrumental value. They are goods in their own right and contribute to well-being, and they also
increase a person’s income-generating capabilities. The focus on inequality of opportunities rather
than inequality of outcomes is motivated by the need to provide incentives to accumulate human
and physical capital. However, the same inequality of outcomes may prevent poorer households
from borrowing to accumulate human and physical capital, which perpetuates poverty and
inequality. Policies that enable poorer households to accumulate assets by reducing inequalities of
opportunity are therefore crucial.
61
Equitable access to quality social services, such as education, health, water and sanitation, is
key. To upgrade the human capital of lower-income groups, investments need to be made to ensure
equality of access and quality for critical basic social services, such as education, health, water and
sanitation. These investments often take place over multiple periods, with critical windows and
sensitive periods depending on the type of investment. For example, in low- and middle-income
countries, policies targeted at promoting survival, as well as policies focused on investments in
nutrition and stimulation during the first years of life have the highest potential returns. Addressing
deprivations during the prenatal period is critical. Providing access to prenatal care and ensuring
that births are managed by skilled professionals will reduce the odds of maternal and child
mortality (Campbell and Graham 2006). Beyond birth and survival, early environments have a
powerful influence on shaping long-term outcomes. Socioeconomic gaps in child development
emerge early in life, before school begins, persist through childhood and are strongly predictive of
adult outcomes, shaping social and economic inequalities in the long run (Fryer and Levitt 2004;
Paxson and Schady 2007).
a. Access to quality education for all
Investments to increase access to education and vocational training and improve educational
quality are needed to equip poor people to take advantage of opportunities. Despite
impressive gains in school enrollment over the past 25 years, 55 million primary-school-age
children do not attend school, especially in Sub-Saharan Africa. In some cases no school is nearby,
but more often other obstacles prevent children from attending school. School fees may be
prohibitively expensive for parents. Even schools that are nominally free may be unaffordable
because of ancillary costs such as books, supplies, uniforms, or miscellaneous fees. The
opportunity cost of attending school may be too high for children who are needed to attend to
household chores such as collecting water or firewood, cooking, caring for younger children, or
helping with the family farm. Parents may consider the financial and opportunity costs too high if
they are unaware of the potential returns to investing in their children’s education, or they may
rightly calculate that the returns are low because absentee teachers or lack of supplies deliver a
low-quality education.
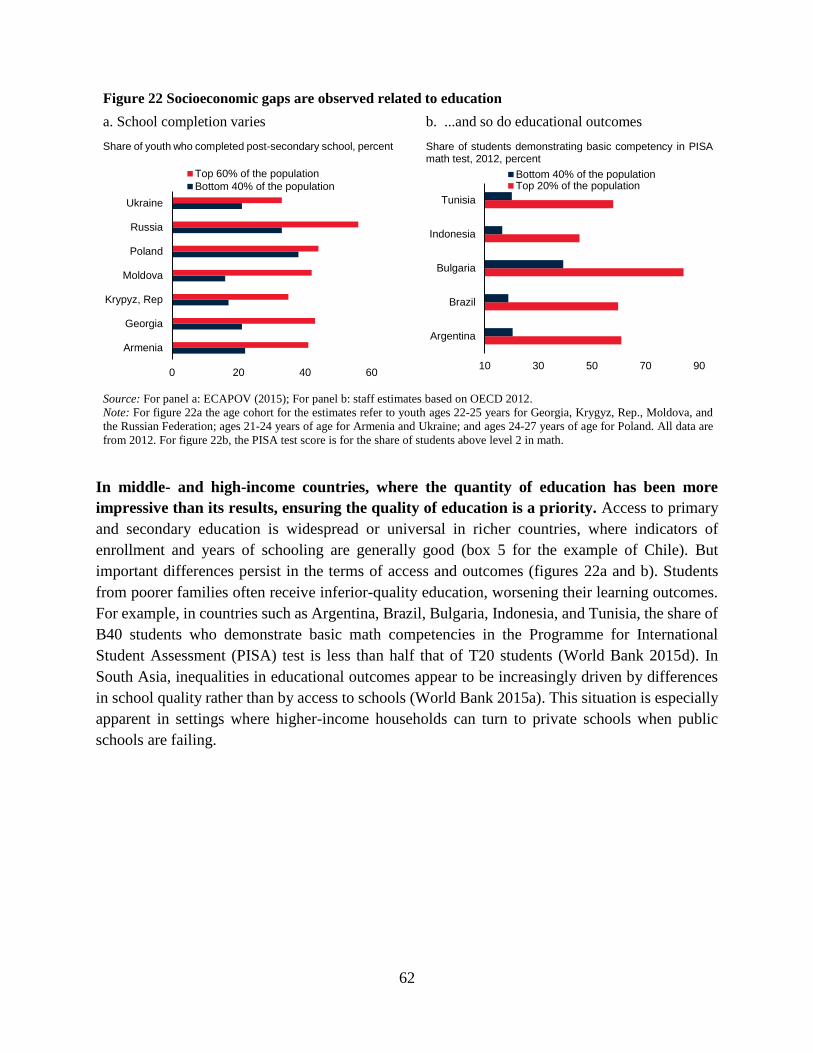
62
Figure 22 Socioeconomic gaps are observed related to education
a. School completion varies b. ...and so do educational outcomes
Share of youth who completed post-secondary school, percent Share of students demonstrating basic competency in PISA math test, 2012, percent
Source: For panel a: ECAPOV (2015); For panel b: staff estimates based on OECD 2012.
Note: For figure 22a the age cohort for the estimates refer to youth ages 22-25 years for Georgia, Krygyz, Rep., Moldova, and
the Russian Federation; ages 21-24 years of age for Armenia and Ukraine; and ages 24-27 years of age for Poland. All data are
from 2012. For figure 22b, the PISA test score is for the share of students above level 2 in math.
In middle- and high-income countries, where the quantity of education has been more
impressive than its results, ensuring the quality of education is a priority. Access to primary
and secondary education is widespread or universal in richer countries, where indicators of
enrollment and years of schooling are generally good (box 5 for the example of Chile). But
important differences persist in the terms of access and outcomes (figures 22a and b). Students
from poorer families often receive inferior-quality education, worsening their learning outcomes.
For example, in countries such as Argentina, Brazil, Bulgaria, Indonesia, and Tunisia, the share of
B40 students who demonstrate basic math competencies in the Programme for International
Student Assessment (PISA) test is less than half that of T20 students (World Bank 2015d). In
South Asia, inequalities in educational outcomes appear to be increasingly driven by differences
in school quality rather than by access to schools (World Bank 2015a). This situation is especially
apparent in settings where higher-income households can turn to private schools when public
schools are failing.
0 20 40 60
Armenia
Georgia
Krypyz, Rep
Moldova
Poland
Russia
Ukraine
Top 60% of the population
Bottom 40% of the population
10 30 50 70 90
Argentina
Brazil
Bulgaria
Indonesia
Tunisia
Bottom 40% of the populationTop 20% of the population
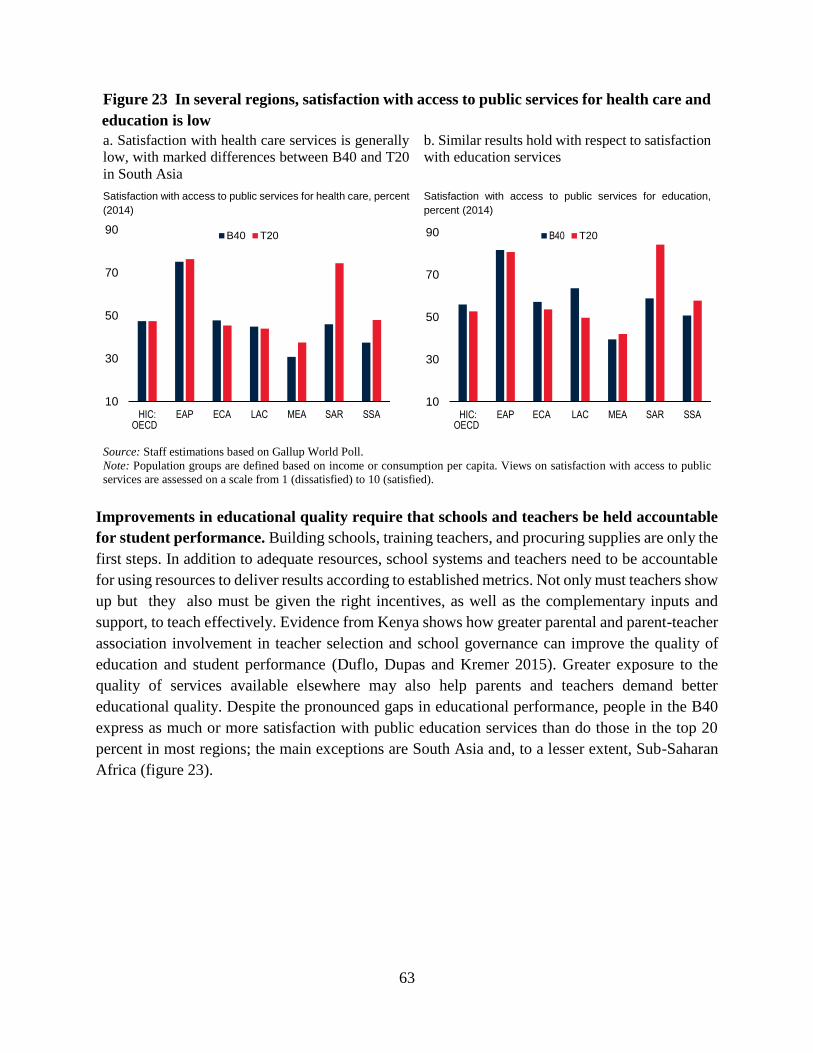
63
Figure 23 In several regions, satisfaction with access to public services for health care and
education is low
a. Satisfaction with health care services is generally
low, with marked differences between B40 and T20
in South Asia
b. Similar results hold with respect to satisfaction
with education services
Satisfaction with access to public services for health care, percent
(2014)
Satisfaction with access to public services for education,
percent (2014)
Source: Staff estimations based on Gallup World Poll.
Note: Population groups are defined based on income or consumption per capita. Views on satisfaction with access to public
services are assessed on a scale from 1 (dissatisfied) to 10 (satisfied).
Improvements in educational quality require that schools and teachers be held accountable
for student performance. Building schools, training teachers, and procuring supplies are only the
first steps. In addition to adequate resources, school systems and teachers need to be accountable
for using resources to deliver results according to established metrics. Not only must teachers show
up but they also must be given the right incentives, as well as the complementary inputs and
support, to teach effectively. Evidence from Kenya shows how greater parental and parent-teacher
association involvement in teacher selection and school governance can improve the quality of
education and student performance (Duflo, Dupas and Kremer 2015). Greater exposure to the
quality of services available elsewhere may also help parents and teachers demand better
educational quality. Despite the pronounced gaps in educational performance, people in the B40
express as much or more satisfaction with public education services than do those in the top 20
percent in most regions; the main exceptions are South Asia and, to a lesser extent, Sub-Saharan
Africa (figure 23).
10
30
50
70
90
HIC: EAP ECA LAC MEA SAR SSAOECD
B40 T20
10
30
50
70
90
HIC: EAP ECA LAC MEA SAR SSAOECD
B40 T20
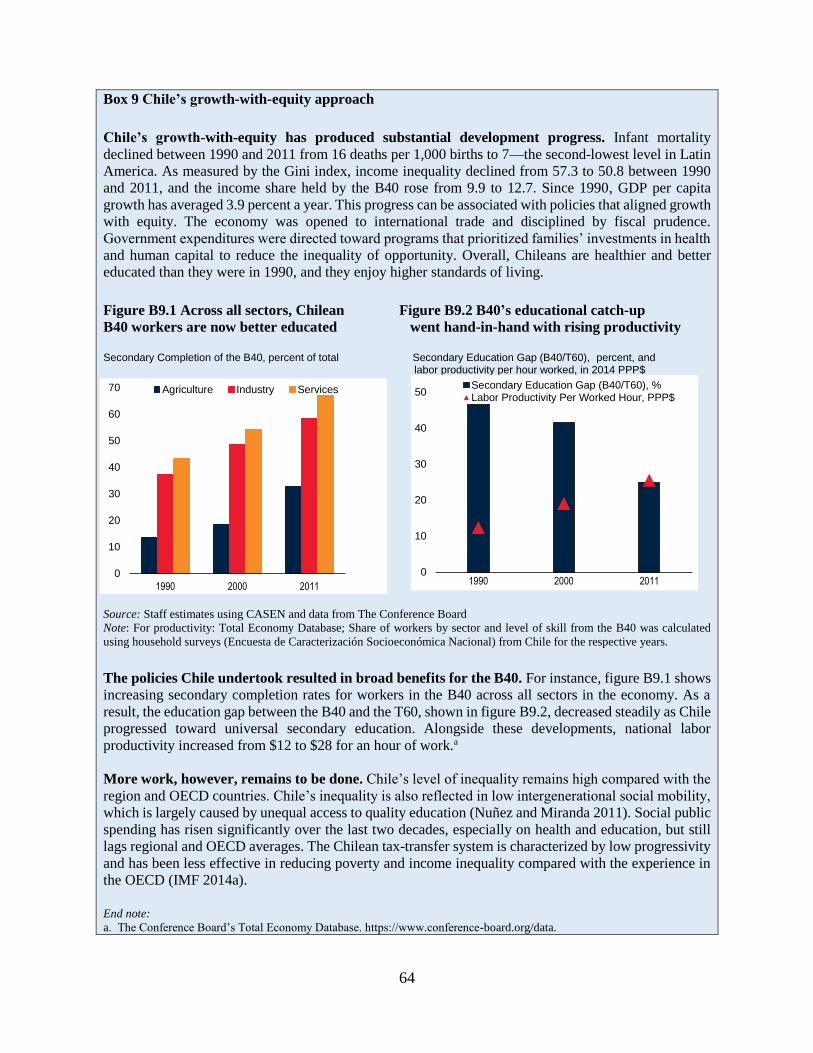
64
Box 9 Chile’s growth-with-equity approach
Chile’s growth-with-equity has produced substantial development progress. Infant mortality
declined between 1990 and 2011 from 16 deaths per 1,000 births to 7—the second-lowest level in Latin
America. As measured by the Gini index, income inequality declined from 57.3 to 50.8 between 1990
and 2011, and the income share held by the B40 rose from 9.9 to 12.7. Since 1990, GDP per capita
growth has averaged 3.9 percent a year. This progress can be associated with policies that aligned growth
with equity. The economy was opened to international trade and disciplined by fiscal prudence.
Government expenditures were directed toward programs that prioritized families’ investments in health
and human capital to reduce the inequality of opportunity. Overall, Chileans are healthier and better
educated than they were in 1990, and they enjoy higher standards of living.
Figure B9.1 Across all sectors, Chilean Figure B9.2 B40’s educational catch-up
B40 workers are now better educated went hand-in-hand with rising productivity
Secondary Completion of the B40, percent of total Secondary Education Gap (B40/T60), percent, and
labor productivity per hour worked, in 2014 PPP$
Source: Staff estimates using CASEN and data from The Conference Board
Note: For productivity: Total Economy Database; Share of workers by sector and level of skill from the B40 was calculated
using household surveys (Encuesta de Caracterización Socioeconómica Nacional) from Chile for the respective years.
The policies Chile undertook resulted in broad benefits for the B40. For instance, figure B9.1 shows
increasing secondary completion rates for workers in the B40 across all sectors in the economy. As a
result, the education gap between the B40 and the T60, shown in figure B9.2, decreased steadily as Chile
progressed toward universal secondary education. Alongside these developments, national labor
productivity increased from $12 to $28 for an hour of work.a
More work, however, remains to be done. Chile’s level of inequality remains high compared with the
region and OECD countries. Chile’s inequality is also reflected in low intergenerational social mobility,
which is largely caused by unequal access to quality education (Nuñez and Miranda 2011). Social public
spending has risen significantly over the last two decades, especially on health and education, but still
lags regional and OECD averages. The Chilean tax-transfer system is characterized by low progressivity
and has been less effective in reducing poverty and income inequality compared with the experience in
the OECD (IMF 2014a). End note:
a. The Conference Board’s Total Economy Database. https://www.conference-board.org/data.
0
10
20
30
40
50
1990 2000 2011
Secondary Education Gap (B40/T60), %Labor Productivity Per Worked Hour, PPP$
0
10
20
30
40
50
60
70
1990 2000 2011
Agriculture Industry Services
65
b. Health care to meet evolving needs
In the health sector, investments are needed to strengthen the physical infrastructure,
especially the systems that deliver health care. The quality of health care delivery needs to be
upgraded, particularly in key areas such as primary care and maternal and child health. At the same
time, health care services need to be extended to areas that are currently underserved, possibly
through partnerships with the private sector and greater use of community-level providers. As in
education, increasing the accountability of the health system is crucial and can be achieved by
better linking spending to results, as community-level monitoring has done in Uganda (Gill and
Revenga, 2015). Reducing the costs of health care for low-income individuals is also needed,
including better control of both official out-of-pocket payments and unofficial fees that are
sometimes paid to speed delivery of services.
Richer countries, especially those whose populations are aging rapidly, need health systems
that are equipped to meet the growing burden of chronic non-communicable diseases
(NCDs). Treatment of cardiovascular diseases, chronic respiratory diseases, cancer, and diabetes
claims a rapidly growing share of national health care budgets. For low-income households
without adequate health insurance, these diseases also have a major impact on household budgets.
The incidence of non-communicable disease can be curbed by prevention-oriented policies such
as dietary education, food price policies that do not effectively subsidize unhealthy foods, public
funding for smoking-cessation programs, and programs to encourage more physically active
lifestyles. Policies that contain the out-of-pocket costs for low-income patients are also needed.
c. Water and sanitation for healthy environments
Creating an environment conducive to good public health is just as important as improving
the health care system. Improving health and physical well-being begins with prevention. Lack
of access to clean water and sanitation leaves poor people susceptible to infectious disease both in
the rural countryside and in congested urban slums. Provision of piped water and latrines has been
shown to reduce disease and child mortality. A healthy environment has an intrinsic positive
impact on the quality of life and an instrumental impact on productivity in the workplace and on
full participation in society. Beyond the initial investment to install adequate water supply,
sanitation and drainage facilities, it is critical that the systems be maintained regularly.
66
The poor and vulnerable need robust insurance
Robust mechanisms are needed to assist both those left behind in the development process
and those whose well-being can be severely negatively affected by various shocks. Contrary
to the general perception of social protection as a narrowly defined cash transfer program, a range
of public interventions can protect the poor and vulnerable while promoting competitiveness and
growth. Social assistance and insurance schemes are key components of a social protection system.
They combine with labor market policies and regulations to form the broader social protection
system. A well-functioning social protection system also enhances people’s capacity to manage
risks, cushions the impact of crises or economic adjustments, and enables people to take greater
advantage of economic opportunities. As cross-country experiences illustrate, social protection
institutions are essential to address adversity and foster long-term prosperity (World Bank 2010b).
a. Social assistance to address poverty
Effective social assistance programs can provide a floor that keep the poor from destitution,
as well as a ladder to help escape poverty. Noncontributory social transfers ensure that those
who are not able to take advantage of opportunities in the labor market can still meet their basic
needs. These transfers may also give poor households the financial breathing room to pursue
investment opportunities, such as schooling for their children, which might otherwise be
unaffordable. They also provide an element of protection from transient shocks. Fiscally efficient
transfers are those that are both well-targeted to the poor population (low errors of inclusion) and
have good coverage (low errors of exclusion). The design of social assistance policies is an
important determinant of their effectiveness; avoiding disincentives to work, such as sharp
reductions in benefits for relatively small increases in earned income, is particularly important.
Conditional cash transfers provide benefits to alleviate current poverty while simultaneously
promoting behavior that is likely to provide a pathway out of poverty. Pioneered in Latin
America and now in place around the globe, such programs provide cash or noncash benefits to
families on the condition that they make investments in human capital, such as taking their children
for vaccinations or other preventive health services or sending their children to school. The cash
transfers received by households not only ease their poverty but also allow them to look beyond
their immediate subsistence needs to invest in their children’s futures.
b. Social insurance to deal with vulnerability
Individuals—especially those among the already-poor and the B40—face a variety of risks
that can have serious consequences for their well-being. External shocks, such as localized
droughts or floods, and repeated shocks can drive households into (deeper) poverty. Commodity
price volatility may depress income from agriculture and may hurt the vulnerable the most. Events
specific to individuals, such as illness or poor health of the head of household can have the same
67
effect. In these cases it is not joblessness per se that pushes families into poverty but rather the
destruction of personal and household assets. Even taking these shocks into account, however, job
losses remain a critical factor sending people deeper into poverty. More generally, as countries
pursue market-oriented structural change and expose their economies to greater forces of
competition, adjustment costs may arise in the near term even if over the longer term net positive
benefits may accrue. However, a competitive economy can coexist with an inclusive society if
minimum levels of protection are provided against the risks of economic restructuring.
Social insurance policies are an important mechanism for providing protection against such
risks. Social insurance policies are not only designed to help families through idiosyncratic shocks
described above but are also geared to keeping people out of poverty from predictable events;
contributory old-age pensions to provide income during retirement are one example. The choice
of policy instrument depends upon the nature of the risk being considered and the affordability of
the intervention. Precautionary policies can cushion the vulnerable against shocks to a limited
extent. In developing countries, where farming and self-employment are more prevalent and
income support mechanisms more limited, macroeconomic instability caused by price shocks has
less impact on open unemployment and more on earnings from work (World Bank 2013b).
Governments can adopt active social protection policies to mitigate the impact of shocks on the
poor. Many countries have public unemployment insurance systems to help mitigate the risk of
job loss. Many also have disability insurance to cover situations where illness or injury affects
employment opportunities.
c. Global insurance to absorb systemic shocks
Beyond assisting the destitute and insuring against individual risks, protection also needs to
extend to large systemic shocks. Natural disasters or global pandemics are examples of systemic
shocks that can set progress back for years. Natural and climate-related shocks appear to be
growing in importance, with the poor in low-income countries the least prepared for managing
such risks. To better equip them to manage and cope with these risks, a range of options exists that
transcend borders. One option is to ensure that funding for disaster preparedness and disaster
response is already available before such events occur. In this context, the World Bank Group has
worked with donors and the private sector to develop a Disaster Risk Financing and Insurance
facility that does exactly this. A similar initiative, the Pandemic Emergency Facility, is being
developed to quickly disburse substantial funding in response to objective epidemiological criteria.
An additional goal of such initiatives is to stimulate greater country investments in preparedness.
These include early-warning systems, response planning, training of frontline professionals, and
preparedness equipment and logistics, as well as investments in health systems (Gill and Revenga
2015; World Bank 2013c.)
68
V. Conclusion
Every country in the world—low, middle and high income—continues to grapple with
poverty. In developing countries, extreme poverty remains a concern. As indicated by the new
global poverty estimates, based on the 2011 PPP indexes, developing countries have made a great
deal of progress in reducing extreme poverty. Yet the challenges remain vast. Reaching the World
Bank’s target of reducing extreme poverty to 3 percent of the world’s population by 2030 is
ambitious, particularly for natural resource-based and conflicted-affected countries in Sub-Saharan
Africa. The latest poverty estimates and projections show that, to meet the global target, policies
must go beyond targeting rates of aggregate economic growth, because growth alone will not be
sufficient to achieve the goal. Economic growth has helped reduce poverty by about 1 percentage
point a year since the 1980s. Yet, in the absence of targeted and effective policies, it is likely that
this rate will not be sustainable, particularly as the 3-percent target is approached. Unless extra
efforts are made to ensure economic, environmental and social sustainability, the pace of poverty
decline associated with a given rate of economic growth can be expected, at some point, to
diminish markedly and possibly even reverse.
Just as critically, ending global poverty requires more than reducing the number of people
living below the extreme poverty line. Even if the 3 percent target were reached in the aggregate,
many countries would still have high levels of poverty. Similarly, within countries deep pockets
of poverty would remain, often in rural areas, where broader economic growth as a poverty
eliminator may still not reach the poor. The deepening impact of climate change will contribute to
such spatial concentrations of poverty by endangering agricultural output through different
channels, including negative effects on access to fresh water. Moreover, poverty is not just about
income: the levels and trends in income-based poverty are imperfectly correlated with other basic
variables such as under-five mortality, primary education, and undernourishment. It is possible
that even if the first goal of eradicating extreme poverty were achieved in income-based terms,
acute multidimensional poverty could still be prevalent.
Many countries—including high-income countries—have seen robust income growth among
the poorer segments of the population, but progress has been uneven and challenges remain.
Persistent inequalities in opportunities continue, constraining not only the well-being of those
affected but also their income-generating capacity and thereby the prospects for broad-based
economic growth that benefits everyone. New challenges are also appearing. In a range of
countries, growth—a key driver of shared prosperity—may be less buoyant than it was before the
global financial crisis. Further constraints may arise if the underlying factors that led to an increase
in the B40 income share in many countries turn out to be transitory or unsustainable. In light of
these factors, further policy efforts will be needed not only to advance the agenda where progress
has remained incomplete or uneven but also to preserve the gains of the past.
69
The policy approaches for sustainably ending global poverty and boosting shared prosperity
are similar in spirit. Complementary policies are needed to foster economic growth while also
lifting the incomes of those on the bottom rungs of the economic ladder. Good identification
methods are needed to assess poverty in all its dimensions. Efforts can be targeted geographically
to regions (particularly Sub-Saharan Africa), to individual countries, and to locations within
countries. Countries also would do well to pursue a comprehensive strategy focused on generating
broad-based growth, investing in human development, and providing robust social protection
mechanisms. Throughout, such strategy needs to be mindful of sustainability—economic, social
and environmental. With such strategies in place, the world stands a better chance of ending
extreme poverty by 2030 and lifting the well-being of lower-income people in every country of
the world.
70
References
Aghion, P., C. Harris, and P. Howitt. 2001. “Competition, Imitation and Growth with Step-by-
Step Innovation”, Review of Economic Studies 68 (3): 467-492.
Alkire, S., J. Foster, S. Seth, M. E. Santos, J. M. Roche, and P. Ballon. 2015a. Multidimensional
Poverty Measurement and Analysis. Oxford: Oxford University Press.
Alkire, S., C. Jindra, G.R. Aguilar, S. Seth, and A. Vaz. 2015b. Global Multidimensional Poverty
Index 2015. Oxford: Oxford Poverty and Human Development Initiative.
Alkire, S. and J. Foster. 2011. “Understandings and Misunderstandings of Multidimensional
Poverty Measurement.” Journal of Economic Inequality 9: 476-87.
Alkire, S., and M. E. Santos. 2013. “Measuring Acute Poverty in the Developing World:
Robustness and Scope of the Multidimensional Poverty Index.” Working Paper 59, Oxford
Poverty and Human Development Initiative, Oxford.
Alkire, S., J. Foster, and M. E. Santos. 2011. “Where did Identification Go?” Journal of Economic
Inequality 9: 501-5.
Alkire, S., and S. Seth. 2013. “Multidimensional Poverty Reduction in India between 1999 and
2006: Where and How?” Working Paper 60, Oxford Poverty and Human Development
Initiative, Oxford.
Alkire, S., C. Jindra, G. R. Aguilar, S. Seth, and A. Vaz. 2015. Global Multidimensional Poverty
Index 2015. Oxford, U.K.: Oxford Poverty and Human Development Initiative.
Angelsen, A., P. Jagger, R. Babigumira, B. Belcher, N.J. Hogarth, S. Bauch, & S. Wunder. 2014.
“Environmental Income and Rural Livelihoods: A Global-Comparative Analysis,” World
Development 64 (Supplement 1): S12-S28.
Araujo, J. A. de T. R., E. Vostroknutova, K. M. Wacker, and M. Clavijo. 2015. Understanding
Latin America and the Caribbean’s Income Gap. Washington, DC: World Bank Group.
Atkinson, A. B., T. Piketty, and E. Saez. 2011. “Top Incomes in the Long Run of History.” Journal
of Economic Literature 49 (1): 3–71.
Atkinson, A.B. 2014. “After Piketty?” The British Journal of Sociology 65: 619–638.
Banerjee, A. V., and E. Duflo. 2003. “Inequality and Growth: What Can the Data Say?” Journal
of Economic Growth 8(3): 267-299.
Barros, R. P. de, F. H. G. Ferreira, J. R. Molinas Vega, and J. Saavedra Chanduvi. 2009. Measuring
Inequality of Opportunities in Latin America and the Caribbean. Washington, DC:World
Bank and London: Palgrave Macmillan.
71
Basu, K. 2001. “On the Goals of Development.” In Frontiers of Development Economics: The
Future in Perspective, edited by G. M. Meier and J. E. Stiglitz, 61-86. New York: Oxford
University Press.
_____. 2006. “Globalization, Poverty, and Inequality: What is the Relationship? What Can Be
Done?” World Development 34 (8): 1361-1373.
Battistin, E., R. Blundell, and A. Lewbel. 2009. “Why Is Consumption More Log Normal than
Income? Gibrat's Law Revisited.” Journal of Political Economy 117: 1140-1154.
Bentham, J. 2000. (Published in 1789.) The Principles of Morals and Legislation. Kitchener,
Ontario, Canada: Batoche Books.
Berg, A., J. D. Ostry, and J. Zettelmeyer. 2012. “What Makes Growth Sustained?” Journal of
Development Economics 98 (2): 149-166.
Bourguignon, F., and L. Pereira da Silva (Eds). 2003. The Impact of Economic Policies on Poverty
and Income Distribution: Evaluation Techniques and Tools. New York: Oxford University
Press for the World Bank.
Bourguignon, F., et al. 2010. “The Millennium Development Goals at Midpoint: An Assessment”
In Equity and Growth in a Globalizing World, edited by R. Kanbur and A. M. Spence, 17-
39. Washington, DC: Commission for Growth and Development.
Bourguignon, F., and G. Fields. 1990. “Poverty Measures and Anti-Poverty Policy.” Recherches
Economique de Louvain 56 (3-4): 409-27.
Burgess R., and D. Donaldson (2010) “Can Openness Mitigate the Effects of Weather Shocks?
Evidence from India’s Famine Era.” American Economic Review 100(2): 449-53.
Bussolo, M., R. De Hoyos, D. Medvedev, and D. Van der Mensbrugghe. 2008. “Global Growth
and Distribution: Are China and India Reshaping the World?” Working Paper Series
RP2008/29, United Nations University World Institute for Development Economic
Research, Helsinki.
Brauer, M. et al. 2015. "Ambient Air Pollution Exposure Estimation for the Global Burden of
Disease 2013." Paper submitted for publication, Institute for Health Metrics and
Evaluation, University of Washington, Seattle.
Brunori, P., F. H. G. Ferreira, and V. Peragine. 2013. “Inequality of Opportunity, Income
Inequality and Economic Mobility: Some International Comparisons.” Policy Research
Working Paper 6304, World Bank, Washington, DC.
Campbell, O., and W. Graham. 2006. “Strategies for Reducing Maternal Mortality: Getting on
With What Works.” Lancet 368(7), 1284-99.
Castleman, T., J. Foster, and S. C. Smith. 2015. “Person-equivalent Headcount Measures of
Poverty.” Institute for International Economic Policy Working Paper Series 2015-10. Elliot
School of International Affairs. George Washington University, Washington, DC.
72
Chandra, V., J.Y. Lin, and Y. Wang. 2012. “Leading Dragons Phenomenon: New Opportunities
for Catch-Up in Low-Income Countries.” World Bank Policy Research Working Paper
6000, Washington, DC.
.Chen, S., and M. Ravallion. 2003. “Household Welfare Impacts of China’s Accession to the
World Trade Organization.” World Bank Policy Research Working Paper 3040,
Washington, DC.
_____. 2010. “The Developing World is Poorer than We Thought, but No Less Successful in the
Fight against Poverty,” Quarterly Journal of Economics 125 (4): 1577-1625.
_____. 2013. “More Relatively-Poor People in a Less Absolutely-Poor World.” Review of Income
and Wealth 59 (1): 1-28.
Chenery, H., C. Bell, J. Duloy, and R. Duloy. 1974. Redistribution with Growth. Oxford: Oxford
University Press.
Cingano, F. 2014. “Trends in Income Inequality and its Impact on Economic Growth”, OECD
Social, Employment and Migration Working Papers No. 163, OECD Publishing,
Organization for Economic Co-operation and Development, Paris.
Commission on Growth and Development. 2008. The Growth Report. Strategies for Sustained
Growth and Inclusive Development. Washington, DC: World Bank.
De Cavalcanti, T., K. Mohaddes, and M. Raissi. 2012. “Commodity Price Volatility and the
Sources of Growth.” IMF Working Paper 12/12, International Monetary Fund,
Washington, DC.
Dinkelman, T. 2011. "The Effects of Rural Electrification on Employment: New Evidence from
South Africa." American Economic Review, 101 (7): 3078-3108.
Dollar, D., and A. Kraay. 2002. “Growth Is Good for the Poor.” Journal of Economic Growth 7:
195-225.
Dollar, D., T. Kleineberg, and A. Kraay. 2013. “Growth Still Is Good for the Poor.” Policy
Research Working Paper 6568, World Bank, Washington, DC.
_____. 2015. “Growth, Inequality, and Social Welfare: Cross-Country Evidence,” Economic
Policy 30(82): 335-377.
Dreze, J., and A. Sen. 2011. 2014. “Putting Growth in its Place,” Outlook, November 14.
Duflo, E., P. Dupas, and M. Kremer. 2015. "School governance, teacher incentives, and pupil-
teacher ratios: Experimental evidence from Kenyan primary schools," Journal of Public
Economics 123: 92-110.
Dworkin, R. 1981a. “What is Equality? Part 1: Equality of Welfare.” Philosophy and Public
Affairs 10 (3): 185–246.
_____. 1981b. “What is Equality? Part 2: Equality of Resources.” Philosophy and Public Affairs
10 (3): 283–345.
73
Easterly, W. 2007. “Inequality Does Cause Underdevelopment: Insights from a New Instrument,”
Journal of Development Economics 84 (2): 755-776.
Ferreira, F. H. G., and M. A. Lugo. 2013. “Multidimensional Poverty Analysis: Looking for a
Middle Ground.” World Bank Research Observer 28(2): 220-235.
Ferreira , F. and M. Ravallion. 2011. “Poverty and Inequality: the Global Context.” In The Oxford
Handbook of Economic Inequality, edited by B, Nolan, W. Salverda, and T. M. Smeeding,
Oxford University Press.
Ferreira, F. H. G., S. Chen, A. Dabalen, D. Jolliffe, A. Narayan, E. B. Prydz, A. Revenga, P.
Sangraula and N. Yoshida. 2015. A Global Count of the Extreme Poor in 2012: Data Issues,
Methodology and Initial Results. Manuscript. Washington, DC: The World Bank.
Field, C. B., ed. 2014. Climate Change 2014: Impacts, Adaptation, and Vulnerability. Vol. 1.
Geneva: Intergovernmental Panel on Climate Change (IPCC).
Forbes, K. J. 2000. “A Reassessment of the Relationship between Inequality and Growth”,
American Economic Review 90(4): 869-887.
Foster, J. “A Framework for Measuring Inclusive Growth” (unpublished paper, Institute for
International Economic Policy, George Washington University, Washington, DC, 2015).
Foster, J., and S. Smith. “Measuring Ultrapoverty: A New Class of Indices and an Application to
Rural Ethiopia Panel Data.” (unpublished paper, Institute for International Economic
Policy, George Washington University, Washington, DC, 2014.
Fryer R.G., and S.D. Levitt. 2004. “Understanding the Black-White Test Score Gap in the First
Two Years of School.” Review of Economics and Statistics 86 (2): 447-464.
Füssel, H.-M., and R. J. T. Klein. 2006. “Climate Change Vulnerability Assessments: An
Evolution of Conceptual Thinking.” Climatic Change 75: 301–29.
Gill, I., and H. Kharas, 2007. An East Asian Renaissance. Ideas for Economic Growth.
Washington, DC: The World Bank.
Gill, I., and A. Revenga. Forthcoming. Grow, Invest, Insure – A Plan to End Poverty. Washington,
DC: The World Bank.
Government of India, Planning Commission. 2009. Report of the Expert Group to Review the
Methodology for Estimation of Poverty.
Harsanyi, J. C. 1955. “Cardinal Welfare, Individualistic Ethics, and Interpersonal Comparisons of
Utility.” Journal of Political Economy 63 (4): 309–21.
Hertel, T. W., and S. D. Rosch. 2010. "Climate Change, Agriculture, and Poverty." Applied
Economic Perspectives and Policy 32 (3): 355-385.
74
Howitt, P. 2009. “Competition, Innovation and Growth: Theory, Evidence and Policy Challenges”,
In Innovation and Growth. Chasing a Moving Frontier, edited by Chandra., V., D. Erocal,
Paris: Organization for Economic Co-operation and Development.
Inchauste, G., et al. 2014. Understanding Changes in Poverty. Directions in Development:
Poverty. Washington, DC: World Bank.
Inchauste, G., and J. Saavedra-Chanduvi. 2014. “Opportunity Knocks: Deepening Our
Understanding of Poverty Reduction.” In Understanding Changes in Poverty, 1-13.
Washington, DC: World Bank.
Institute for Health Metrics and Evaluation (IHME). Global Burden of Disease 2010 Study
(database), IHME, University of Washington, Seattle (accessed August 2015).
International Monetary Fund (IMF). 2011. New Growth Drivers for Low-Income Countries: The
Role of BRICS. Washington, DC: IMF.
_____. 2013. Regional Economic Outlook, Sub-Saharan Africa: Keeping the Pace.
https://www.imf.org/external/pubs/ft/reo/2013/afr/eng/sreo1013.htm
_____. 2014a. “Chile: Selected Issues.” IMF Country Report No. 14/219.
http://www.imf.org/external/pubs/ft/scr/2014/cr14219.pdf
_____. 2014b. Regional Economic Outlook, Sub-Saharan Africa: Staying the Course.
https://www.imf.org/external/pubs/ft/reo/2014/afr/eng/sreo1014.pdf
Jalan, J., and M. Ravallion. 2001. “Household Income Dynamics in Rural China.” Policy Research
Working Paper 2706, World Bank, Washington, DC.
Jolliffe, D., and E. B. Prydz. 2015. “Global poverty goals and prices: how purchasing power parity
matters.” Policy Research Working Paper 7256, World Bank, Washington.
Kraay, A., and D. McKenzie. 2014. “Do Poverty Traps Exist?” World Bank Policy Research
Working Paper 6835, World Bank, Washington, DC.
Kuznets, S. 1955. “Economic Growth and Income Inequality.” American Economic Review 45 (1):
1-28.
Lakner, C., M. Negre, and E.B. Prydz. 2014. “Twinning the Goals: How Can Promoting Shared
Prosperity Help to Reduce Global Poverty?” Policy Research Working Paper 7106, World
Bank, Washington, DC.
Lakner. C., and B. Milanovic. 2013. “Global Income Distribution: From the Fall of the Berlin Wall
to the Great Recession.” Policy Research Working Paper 6719, World Bank, Washington,
DC.
Leichenko, R., and J. A. Silva. 2014. "Climate Change and Poverty: Vulnerability, Impacts, and
Alleviation Strategies." Wiley Interdisciplinary Reviews: Climate Change 5 (4): 539-556.
75
Li, H.. and H.-F. Zou, 1998. “Income Inequality Is Not Harmful for Growth: Theory and
Evidence,” Review of Development Economics 2(3): 318-334.
Loayza, N., and C. Raddatz. 2010. “The Composition of Growth Matters for Poverty Alleviation.”
Journal of Development Economics 93: 137-151.
Marrero, G., and J.-G. Rodriguez . 2012. “Inequality of Opportunity in Europe,” Review of Income
and Wealth 58(4): 597-621.
_____. 2013. “Inequality of Opportunity and Growth,” Journal of Development Economics
104(C): 107-122.
McNamara, Robert S. 1972. Address to the Board of Governors by Robert S. McNamara.
Washington, DC: World Bank.
http://documents.worldbank.org/curated/en/1972/09/15535489/address-board-governors-
robert-s-mcnamara
_____. 1980. Remarks to the Foreign Relations Association and Economic Society of the Canton
of Berne, November 28, 1980. Washington, DC: World Bank.
https://archivesholdings.worldbank.org/remarks-to-foreign-relations-association-and-
economic-society-of-canton-of-berne-nov-28-1980-correspondence-01
Messner, J. J., et al. 2015. Fragile States Index 2015: The Book. Washington, DC: The Fund for
Peace.
Milanovic, B. 2015. All the Ginis Database. Washington, DC: World Bank.
Nachtergaele. F., M. Petri. R.Biancalani, G. Van Lynden, and H. Van Velthuizen. 2010. Global
Land Degradation Information System (GLADIS), Beta Version, an Information Database
for Land Degradation Assessment at Global Level: Land Degradation Assessment in
Drylands Technical Report, no. 17. Rome: United Nations Food and Agriculture
Organization.
Narayan, A., J. Saavedra-Chanduvi, J. and S. Tiwari. 2013. “Shared Prosperity: Links to Growth,
Inequality and Inequality of Opportunity.” Policy Research Working Paper No. 6649,
World Bank, Washington, DC.
Núñez, J., and L. Miranda. 2011. “Intergenerational Income and Educational Mobility in Urban
Chile”, Estudios de Economia, Vol. 38 – 1: 195-221
O’Donnell, O., van Doorslaer, E., Wagstaff, A., and M. Lindelow. 2008. “Measurement of Living
Standards.” In Analyzing Health Equity Using Household Survey Data, a Guide to
Techniques and their Implementation. Washington, DC: World Bank Institute.
O'Sullivan, M., A. Rao, R. Banerjee, K. Gulati, and M. Vinez. 2014. Levelling the Field: Improving
Opportunities for Women Farmers in Africa. Washington, DC: World Bank Group.
Okun, A. M. 1975. Equality and Efficiency: the Big Tradeoff. Washington, DC: Brookings
Institution.
76
Palma, J. G. 2011. “Homogeneous Middles vs. Heterogeneous Tails, and the End of the ‘Inverted-
U’: It’s all about the Share of the Rich,” Development and Change 42 (1): 87–153.
Paxson C., and N. Schady. 2007. “Cognitive Development among Young Children in Ecuador:
The Roles of Wealth, Health, and Parenting," Journal of Human Resources 42(1): 49-84.
Piketty, T. 2014. Capital in the Twenty-First Century. Translated by A. Goldhammer. Cambridge,
MA: Harvard University Press/Belknap Press.
PovcalNet. 2015. World Bank PovcalNet database. http://iresearch.worldbank.org/PovcalNet.
Qureshi, Zia. 2015. “Addressing Rising Inequality in G20 Economies.” Let’s Talk Development
Blog, June 16. http://blogs.worldbank.org/developmenttalk/addressing-rising-inequality-
g20-economies
Rauniyar, G., and R. Kanbur. 2010. “Inclusive Development.” Working Paper, Department of
Applied Economics and Management, Cornell University, Ithaca, New York.
Ravallion, M. 2003. “Measuring Aggregate Welfare in Developing Countries: How Well Do
National Accounts and Surveys Agree?” The Review of Economics and Statistics 85(3):
645-652.
_____. 2010. “Mashup Indices of Development,” Policy Research Working Paper 5432, World
Bank, Washington DC.
_____. 2011. “On Multidimensional Indices of Poverty,” Journal of Economic Inequality 9(2):
235-48.
_____. 2012. “Why Don’t We See Poverty Convergence?” American Economic Review 102 (1):
504–23.
_____. 2013. “How Long Will It Take to Lift One Billion People Out of Poverty?” The World
Bank Research Observer 28 (2): 139-58.
Ravalion, M. S. Chen, and Prem Sangraula, 2009, "Dollar a Day Revisited," World Bank Economic
Review 23: 163-184.
Rawls, J. 1971. A Theory of Justice. Cambridge, MA: Harvard University Press.
Roemer, J. E. 1998. Equality of Opportunity. Cambridge, MA: Harvard University Press.
Sahay, R., M. Čihák, P. N’Diaye, A. Barajas, S. Mitra, A. Kyobe, Y. N. Mooi, and S. Reza Yousefi.
Forthcoming. “Financial Inclusion: Can It Meet Multiple Macroeconomic Goals?” IMF
Staff Discussion Note, International Monetary Fund, Washington, DC.
Sen, A. 1976. Poverty: An Ordinal Approach to Measurement. Econometrica 44 (2): 219-31.
Sen, A. 1983. “Poor, Relatively Speaking,” Oxford Economic Papers 35(2): 153-169.
_____. 1985. Commodities and Capabilities. Amsterdam: North-Holland.
77
_____. 1999. Development as Freedom. Oxford: Oxford University Press.
Shepherd, G., C. Kazoora, and D. Müller. 2013. “Forests, Livelihoods and Poverty Alleviation:
the Case of Uganda.” Forestry Policy and Institutions Working Paper 32, United Nations
Food and Agriculture Organization, Rome.
Székely, M., and M. Hilgert. 2000. “What Drives Differences in Inequality Across Countries?”
IDB Working Paper 369, Inter-American Development Bank, Washington, DC.
Székely, M., N. Lustig, M. Cumpa, and J. A. Mejía. 2000. “Do We Know How Much Poverty
There Is?” IDB Working Paper No.437, Inter-American Development Bank, Washington,
DC.
Skoufias, E., S. Tiwari, and A. R. Shidiq. 2014. “Sharing Prosperity: The Poverty, Growth and
Equity Nexus in Thailand.” Policy Research Working Paper, World Bank, Washington,
DC.
Skoufias, E, M. Rabassa, and S. Olivieri. 2012. “The Forecast for Poverty: A Review of the
Evidence.” In The Poverty and Welfare Impacts of Climate Change: Quantifying the
Effects, Identifying the Adaptation Strategies, edited by E. Skouafias. Washington, DC:
World Bank.
Stiglitz, J.E., A. Sen, and J.-P. Fitoussi. 2009. Report by the Commission on the Measurement of
Economic Performance and Social Progress. The Commission on the Measurement of
Economic Performance and Social Progress.
UNDP (United Nations Development Program). 1997. Human Development Report. New York:
UNDP.
Voitchovsky, S. 2005. “Does the Profile of Income Inequality Matter for Economic Growth?”
Journal of Economic Growth 10: 273-296.
van der Weide, R., and B. Milanovic. 2014. “Inequality is Bad for Growth of the Poor (But Not
for That of the Rich.” Policy Research Working Paper 6963, World Bank, Washington,
DC.
Winters, L. A, N. McCulloch, and A. McKay. 2004. “Trade Liberalization and Poverty: The
Evidence So Far,” Journal of Economic Literature 42(1): 72-115.
World Bank, 1990. World Development Report 1990: Poverty. New York: Oxford University
Press.
______. 2001. World Development Report 2000/2001: Attacking Poverty. Washington, DC:
World Bank.
______. 2003. World Development Report 2003/2004: Making Services Work for Poor People.
Washington, DC: World Bank.
78
______. 2010a. Malaysia Economic Monitor. Growth through Innovation. Washington, DC:
World Bank.
______. 2010b. Malaysia Economic Monitor. Inclusive Growth. Washington, DC: World Bank.
______. 2005. World Development Report 2005/2006: Equity and Development. Washington, DC:
World Bank.
______. 2010c. World Development Report: Development and Climate Change. Washington DC:
World Bank.
______. 2011a. World Development Report: Conflict, Security, and Development. Washington,
DC: World Bank.
______. 2011b. The Changing Wealth of Nations: Measuring Sustainable Development in the New
Millennium. Washington, DC: World Bank.
______. 2012. Inclusive Green Growth: The Pathway to Sustainable Development. Washington,
DC: World Bank.
______. 2013a. Economic Mobility and the Rise of the Latin American Middle Class. Washington,
DC: World Bank.
______. 2013b. The World Bank Group Goals: End Extreme Poverty and Promote Shared
Prosperity. Washington, DC: World Bank
______. 2013c. World Development Report: Risk and Opportunity: Managing Risk for
Development. Washington, DC: World Bank.
______. 2014a. Global Monitoring Report 2014/2015: Ending Poverty and Sharing Prosperity.
Washington, DC: World Bank.
______. 2014b. Implications of a Changing China for Brazil: A New Window of Opportunity?
Washington, DC: World Bank.
______. 2014c. Shared Prosperity Paving the Way in Europe and Central Asia. Washington, DC:
World Bank.
______. 2015a. Addressing Inequality in South Asia. Washington, DC: World Bank.
______. 2015b. Global Economic Prospects: Having Fiscal Space and Using It. January,
Washington, DC: World Bank.
______. 2015c. A Measured Approach to Ending Poverty and Boosting Shared Prosperity
Concepts, Data, and the TGs. Washington, DC: World Bank.
______. 2015d. Visualize Inequality: PISA, the Bottom 40%. Washington, DC: World Bank.
______. 2015e. The Poverty Focus of Country Programs: Lessons from World Bank Experience.
Independent Evaluation Group. Washington, DC: World Bank.
79
______. 2015f. Global Monitoring Report 2015/2016: Development Goals in an Era of
Demographic Change. Washington, DC: World Bank.
______. Forthcoming. Poverty in Africa: Revisiting the Facts. Washington, DC: World Bank.
World Bank and World Trade Organization. The Role of Trade in Ending Poverty. Unpublished
report, World Bank, Washington, DC, 2015.
World Development Indicators 2015 (database), World Bank, Washington, DC, (accessed August
2015), http://data.worldbank.org/products/wdi.
Yohe, G., and R. S. J. Tol. 2009. “Indicators for Social and Economic Coping Capacity—Moving
Towards a Working Definition of Adaptive Capacity.” Global Environmental Change 12:
25–40.
Yoshida, N., H. Uematsu, and C. E. Sobrado. 2014. “Is Extreme Poverty Going to End? An
Analytical Framework to Evaluate Progress in Ending Extreme Poverty.” Policy Research
Working Paper 6740. Washington, DC: World Bank.