end-expiratory lungfdisease...output (dye-dilution technique), systemic blood pressure, central...
TRANSCRIPT

Ventilation with end-expiratory pressure inacute lung disease
Konrad J. Falke, … , Bennie Geffin, Myron B. Laver
J Clin Invest. 1972;51(9):2315-2323. https://doi.org/10.1172/JCI107042.
In 10 patients with severe, acute respiratory failure we studied the effects of positive end-expiratory pressure when intermittent positive pressure ventilation (IPPV) with inspiredoxygen (FIO2
) up to 0.5 failed to maintain arterial oxygen tension (PaO2) above 70 torr.
Positive end-expiratory pressures (PEEP) of 0, 5, 10, and 15 cm H2O were applied for 30-min periods each and in random order. Blood gas exchange, lung volumes, compliance,and hemodynamics were studied at each level of PEEP. PaO2
(FIO2 = 1.0) rose linearly with
elevation of PEEP, the mean increase being from 152 to 347 torr, or 13 torr/cm H2O PEEP.Mean functional residual capacity (FRC) was 1.48±0.78 liters at zero PEEP (i.e., IPPV) andthe increase was essentially linear, reaching 2.37 liters at 15 cm H2O PEEP. PaO2
and FRC
showed a close correlation. Total and lung static compliance were greater during ventilationwith high than with low levels of PEEP. The increase in PaO2
correlated with the specific
lung compliance. Dynamic lung compliance decreased progressively with rising levels ofPEEP except for an increase with 5 and 10 cm H2O PEEP in patients with initial values of0.06 liter/cm H2O or higher. Cardiac index fell in some patients and rose in others and therewas no correlation of mean cardiac index, systemic blood pressure, or peripheral vascularresistance with […]
Research Article
Find the latest version:
http://jci.me/107042-pdf

Ventilation with End-Expiratory
Pressure in Acute LungFDiseaseKoRADJ. FAL1iE, HENNINGPONTOPPIDAN,ANnL KUMAR,DAVI E. LErT,BENNIE GEFFIN, and MYRONB. LAvEu
From the Respiratory Unit and Anesthesia Laboratories of Harvard MedicalSchool at Massachusetts General Hospital, Boston, Massachusetts 02114
A B ST RACT In 10 patients with severe, acuterespiratory failure we studied the effects of positiveend-expiratory pressure when intermittent positivepressure ventilation (IPPV) with inspired oxygen(Fio2) up to 0.5 failed to maintain arterial oxygentension (Pao2) above 70 torr.
Positive end-expiratory pressures (PEEP) of 0, 5, 10,and 15 cm H20 were applied for 30-min periods eachand in random order. Blood gas exchange, lung vol-umes, compliance, and hemodynamics were studied ateach level of PEEP. Pao2 (FIO2 = 1.0) rose linearlywith elevation of PEEP, the mean increase being from152 to 347 torr, or 13 torr/cm H20 PEEP. Mean func-tional residual capacity (FRC) was 1.4840.78 liters atzero PEEP (i.e., IPPV) and the increase was essentiallylinear, reaching 2.37 liters at 15 cm H20 PEEP. Pao2and FRC showed a close correlation. Total and lungstatic compliance were greater during ventilation withhigh than with low levels of PEEP. The increase inPao2 correlated with the specific lung compliance.Dynamic lung compliance decreased progressively withrising levels of PEEPexcept for an increase with 5 and10 cm H20 PEEP in patients with initial values of0.06 liter/cm H20 or higher. Cardiac index fell in somepatients and rose in others and there was no correlationof mean cardiac index, systemic blood pressure, orperipheral vascular resistance with level of PEEP. Themost probable explanation for the effect of PEEP onPao, and compliance is recruitment of gas exchangeairspaces and prevention of terminal airway closure.
Address reprint requests to Dr. Pontoppidan.Received for publication 17 June 1971 and in revised
form 23 May 1972.
INTRODUCTION
The effectiveness of ventilation with positive end-expiratory pressure (PEEP)' in raising arterial oxygentension (Pao2) in patients with severe, acute respiratoryfailure has been increasingly recognized since the reportby Ashbaugh, Petty, Bigelow, and Harris (1). It isgenerally agreed that improvement in oxygenation andthe effect on cardiac output appear to be related to themagnitude of PEEPand the resultant increase in func-tional residual capacity (FRC) (2, 3). However, theresponse of the individual patient to different levels ofPEEP has not previously been reported and data arelacking on the associated changes in pulmonary com-pliance. Thus, if the increase in FRC results fromrecruitment of terminal airspaces (alveoli or smallairways, or both) one would expect lung compliance torise (4). Conversely, if overdistention of open airspacesis the predominant event, then no change or even a fallin pulmonary compliance should become apparent.
This study was carried out to clarify qualitativelyand quantitatively the effects of mechanical ventilationwith different levels of end-expiratory pressure on thecirculation, lung volume, and blood-gas exchange inpatients with severe respiratory failure. Based on thesefindings, it was our intent to characterize an optimalmagnitude of end-expiratory pressure for the individualpatient that will result in a minimal disturbance tocardiopulmonary function.
I Abbreviations used in this paper: Cdyn, C8tat., dynamic andstatic lung compliance; Cdynt, Ctatt, total dynamic and totalstatic lung compliance; CVP, central venous pressure; FIO,,inspired fraction of oxygen; FRC, functional residual capacity;IPPV, intermittent positive pressure ventilation; Pao0,Paco2, arterial oxygen and carbon dioxide tension; Paw, Pee, P,,airway, esophageal, and transpulmonary pressure; PEEP,positive end-expiratory pressure; VT, tidal volume.
The Journal of Clinical Investigation Volume 51 September 1972 2315

nsoi rotor y __ .s
FLOW (li/er/sec) 0Expiratory
2 i
40 j
AIRWAY PRESSURE20F-F7(Cm HBNEVAV
CONTROL BENNETT VALVE
IPPV PEEP
FIGURE 1 Typical flow and airway pressure patterns obtainedwith and without PEEP. The patient was being ventilatedwith an Emerson postoperative ventilator and ventilationwith PEEPwas instituted by addition of a special device tothe expiratory port of the ventilator providing a positive ex-piratory pressure plateau (Bennett No. 3434 gas collectingmanifold). Note difference to the pattern used by Kumaretal. (3).
METHODSSelection of patients. Data were obtained in 10 patients'
all of whom had severe respiratory failure necessitating me-chanical support of ventilation. The criteria for consideringthe use of PEEP in the pattern of ventilation were as pre-viously described (3), i.e., inability to maintain Pao, at ac-ceptable3 levels during IPPV when the inspired fraction ofoxygen (Fio,) was-0.5 or higher. The initial PaO during IPPV(i.e., with zero end-expiratory pressure) and an FxO2 of 1.0was less than 300 torr in all patients and less that 65 torr insix. All patients were ventilated with a volume preset ventila-tor4 through a cuffed endotracheal or tracheostomy tube.Each patient was studied in the semirecumbent position withthe trunk elevated approximately 350 from the horizontalplane. The inspiratory-to-expiratory time ratio ranged from0.3 to 0.9, the respiratory frequency from 9 to 18/min and thetidal volume from 8.9 to 24.1 ml/kg body wt (2.9 to 6.2 ml/cmheight). A positive end-expiratory plateau pressure was pro-
2 Characteristic for all patients included in this study wasa marked improvement in Pao2 when PEEP was added tothe regimen with intermittent positive pressure ventilation(IPPV). They are representative of the approximately 100patients per year who require treatment with mechanicalventilation and added PEEPor 10% of the total number ofpatients treated yearly with prolonged mechanical ventila-tion in our institution. A small number of patients with severe,acute respiratory failure and a large right-to-left shunt re-spond to mechanical ventilation with PEEP by showing nochange or even a fall in Pao2. Three such patients have beendescribed (3); three additional patients have been seen whohave failed to show an improvement of oxygenation whenhigh levels of PEEPwere applied. Wehave not been able toidentify a common clinical or pathological denominator.
3 An acceptable Pao2 is an arbitrary value determinedfor each patient on the basis of age, systemic disease, cardio-vascular performance and, above all, stability of arterialoxygenation. We have considered a value below 70 torr asunacceptable.
The Emerson Postoperative Ventilator (Emerson Res-pirator Iron Lung Co., Cambridge, Mass.) was used in eightpatients and the Bennett MA-1 ventilator (Bennett Respi-ration Products, Inc., Santa Monica, Calif.) in two patients(Nos. 3 and 4).
duced with a gas-collecting manifold' attached to the ex-piratory port of the ventilator (Fig. 1). All patientsreceived intermittent sedation as indicated by clinicalcriteria. Attempts to interpose respiratory effort duringmechanical ventilation was suppressed either with i.v.morphine (approximately 15 jug/kg per hr) or fentanyl (ap-proximately 1-2 jug/kg per hr). Occasionally a muscle re-laxant,-e.g., d-tubocurare, (60 jAg/kg per hr) was added tofacilitate control of ventilation.
Except for the change in end-expiratory pressure as re-quired by the protocol, the ventilator settings remained un-changed throughout the study. Control measurements wereobtained during I PPV (zero end-expiratory pressure) towhich PEEP of 5, 10, and 15 cm H20 was added in randomorder, each being sustained for 30-35 minutes. During thelast 10 min of each phase, arterial blood gases, pH, cardiacoutput (dye-dilution technique), systemic blood pressure,central venous pressure, and pulmonary compliance weremeasured. Positive end-expiratory pressure was discontinuedbriefly at the end of each period and the change, in FRC(AFRC) calculated as follows: AFRC = VE - Vi, where VEequals first exhaled 'tidal volume after discontinuation ofPEEP, VI equals last inspired volume with PEEP. (AFRCcould not be measured accurately at the beginning of eachperiod because the end-expiratory pressure was usually in-creased slowly over a period of about 2 min to allow forhemodynamic adjustment.) In two patients AFRCwas com-pared with the change in FRCcalculated from the differenceof two measurements obtained with helium dilution, one withPEEP and another 30 min after PEEP was discontinued.Comparison revealed a difference which was smaller than theerror inherent in the helium method. Control FRC at zeroend-expiratory pressure was measured in all cases with theclosed circuit helium dilution method (5) either immediatelybefore or after completion of the study. During the heliumequilibration period adequate tidal exchange was effected bymanual compression of a rebreathing bag to generate pres-sures and volumes similar to those produced by the ventilator.
Airway, esophageal, and transpulmonary pressures (Paw,Pea, and P,) were measured with transducers6 calibrated witha water manometer. P.8 was recorded with an esophagealballoon (10 cm) with the tip placed in the lower portion ofthe esophagus and inflated with 0.4 ml of air (6, 7). Tidalvolume was obtained from integration of flow' through aheated Fleisch pneumotachograph. Inphase rejection of thedifferential pressure transducers was tested by applying upto 50 cm H20 pressure simultaneously to both sides of thetransducers. The recorded differential pressure was alwayszero. All signals were recorded on an eight-channel recorder.8The volume channel was calibrated by displacing knownvolumes of air through the pneumotachograph. Accuracy ofthe gas volume measurements was tested according to theprinciples established by Grenvik et al. (8, 9). Pressurevolume loops were obtained from photograp hs of the graphicaldisplay on the screen of a storage oscilloscope. The followingcalculations were made:
6 Bennett No. 3434.6 Sanborn Model 270 (Sanborn Div., Hewlett-Packard
Co., Waltham, Mass.).7Sanborn Model 330- 100B and Model 350-5000A.8 Hewlett-Packard Model 7868A (Hewlett-Packard Co.,
Palo Alto, Calif.).9 Tektronix type RM 564 with amplifiers Type 3AT2
(Tektronix, Inc., Beaverton, Ore.).
2316 Falke, Pontoppidan, Kumar, Leith, Geffin, and Laver
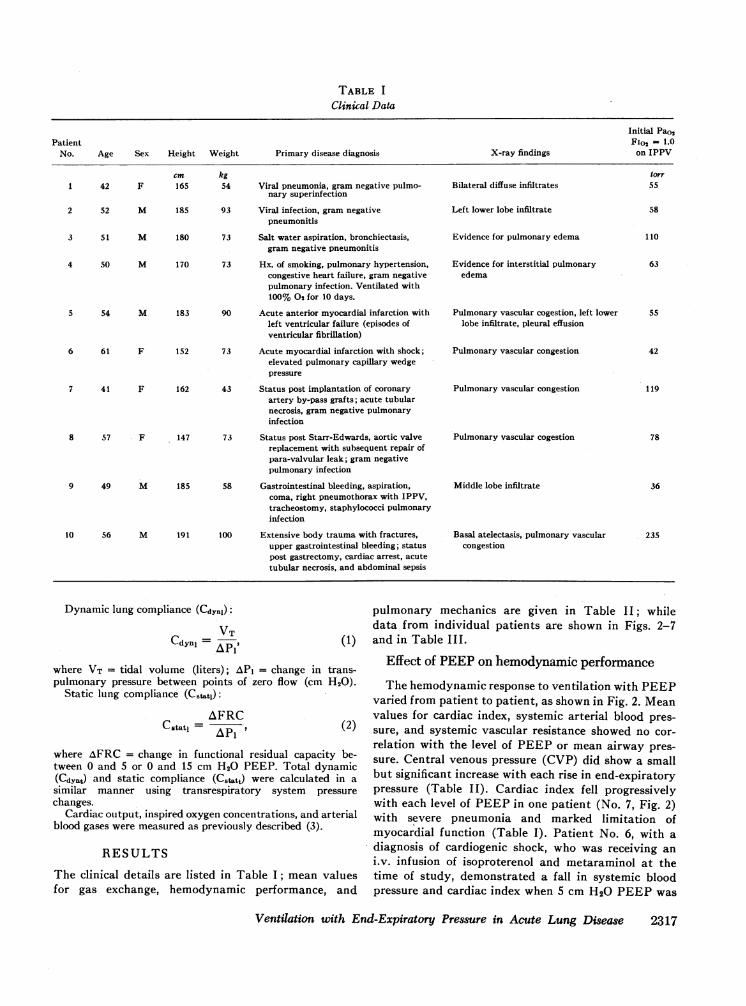
TABLE I
Clinical Data
Initial Pao2Patient Fio, = 1.0
No. Age Sex Height Weight Primary disease diagnosis X-ray findings on IPPV
cm kg forr1 42 F 165 54 Viral pneumonia, gram negative pulmo- Bilateral diffuse infiltrates 55
nary superinfection
2 52 M 185 93 Viral infection, gram negative Left lower lobe infiltrate 58pneumonitis
3 51 M 180 73 Salt water aspiration, bronchiectasis, Evidence for pulmonary edema 110gram negative pneumonitis
4 50 M 170 73 Hx. of smoking, pulmonary hypertension, Evidence for interstitial pulmonary 63congestive heart failure, gram negative edemapulmonary infection. Ventilated with100% 02 for 10 days.
5 54 M 183 90 Acute anterior myocardial infarction with Pulmonary vascular cogestion, left lower 55left ventricular failure (episodes of lobe infiltrate, pleural effusionventricular fibrillation)
6 61 F 152 73 Acute myocardial infarction with shock; Pulmonary vascular congestion 42elevated pulmonary capillary wedgepressure
7 41 F 162 43 Status post implantation of coronary Pulmonary vascular congestion 119artery by-pass grafts; acute tubularnecrosis, gram negative pulmonaryinfection
8 57 F 147 73 Status post Starr-Edwards, aortic valve Pulmonary vascular cogestion 78replacement with subsequent repair ofpara-valvular leak; gram negativepulmonary infection
9 49 M 185 58 Gastrointestinal bleeding, aspiration, Middle lobe infiltrate 36coma, right pneumothorax with IPPV,tracheostomy, staphylococci pulmonaryinfection
10 56 M 191 100 Extensive body trauma with fractures, Basal atelectasis, pulmonary vascular 235upper gastrointestinal bleeding; status congestionpost gastrectomy, cardiac arrest, acutetubular necrosis, and abdominal sepsis
Dynamic lung compliance (CdYn1):
Cdynj pIp
where VT = tidal volume (liters); API = change in trans-pulmonary pressure between points of zero flow (cm H20).
Static lung compliance (Ctats):AFRC
C Ptat 1= ' (2)
where AFRC = change in functional residual capacity be-tween 0 and 5 or 0 and 15 cm H20 PEEP. Total dynamic(Cd9) and static compliance (Cstatt) were calculated in asimilar manner using transrespiratory system pressurechanges.
Cardiac output, inspired oxygen concentrations, and arterialblood gases were measured as previously described (3).
RESULTS
The clinical details are listed in Table I; mean valuesfor gas exchange, hemodynamic performance, and
pulmonary mechanics are given in Table II; whiledata from individual patients are shown in Figs. 2-7and in Table III.
Effect of PEEPon hemodynamic performance
The hemodynamic response to ventilation with PEEPvaried from patient to patient, as shown in Fig. 2. Meanvalues for cardiac index, systemic arterial blood pres-sure, and systemic vascular resistance showed no cor-relation with the level of PEEPor mean airway pres-sure. Central venous pressure (CVP) did show a smallbut significant increase with each rise in end-expiratorypressure (Table II). Cardiac index fell progressivelywith each level of PEEPin one patient (No. 7, Fig. 2)with severe pneumonia and marked limitation ofmyocardial function (Table I). Patient No. 6, with adiagnosis of cardiogenic shock, who was receiving ani.v. infusion of isoproterenol and metaraminol at thetime of study, demonstrated a fall in systemic bloodpressure and cardiac index when 5 cm H20 PEEPwas
Ventilation with End-Expiratory Pressure in Acute Lung Disease 2317

6
CARD/ACINDEX
i/ier/rm/n per MI j
5
3
2
to
9_
%., 6,* 6
|% w---_7
0 8
0 ~~~~~~~~~~~5
-,v0 5 10 15
ENo-ExP/AAoIrwA/6 r REiSSURE(cmn.O
FIGURE 2 Cardiac index recorded at four different levels of end-expiratorypressure, each used for a period of 30 to 35 min. Patient number is enteredat right (see Table I). Patient No. 6 received metaraminol 8 ,ug/min andisoproterenol 8.ug/min as i.v. infusion during IPPV. The infusion rate formetaraminol was increased to 75 pug/min, 150 pg/min, and 204 pg/minduring ventilation with PEEPat 5, 10, and 15 cm H20, respectively.
applied. This effect was subsequently reversed by anincrease in the vasopressor infusion rate during ventila-tion with 10 and 15 cm H20 PEEP.
Effect of PEEPon blood gas exchangeArterial Po2 rose linearly with each step increase in
end-expiratory pressure (mean increase: 13 torr/cmH20 PEEP) (Table II). A small, but significant risein Paco2 (2.2 torr) was recorded when PEEP was in-creased from 10 to 15 cm H20 and corresponded to asimultaneous small decrease in minute ventilation dueprobably to an increased gas leak from the ventilator.
Effect of PEEPon FRC (Fig. 3, Table III). ControlFRC (in per cent of predicted normal for the supineposition and assumed to equal 80% of the value in theupright position [10]) was low in six of the sevenpatients in whom it was measured (mean ±SD: 1.48±0.78 liters) and rose essentially linearly with PEEP.The mean rise at 15 cm H20 PEEPwas 0.8440.33 literor 0.056 liter/cm H20 PEEP. In two patients (Nos. 4and 6) FRC reached its predicted value at 15 cm H20PEEP. One patient with chronic bronchitis and bronchi-ectasis had a normal FRCdespite a low Pao2.
In all patients studied, each step increase in FRCwas followed by a rise in Pao2 (Fig. 3).
Effect of PEEPon compliance (Fig. 4). Static com-pliance (Cutat) measured over a change in functionalresidual capacity (AFRC) from 0 to 15 cm H20 PEEPwas greater than that found with a volume change from0 to 5 cm H20 PEEP. Except for patient No. 3, the
MF/C %OfPRE/O/CTED VALUFUPRIGHT
1oo "3
90oF-sul
80 -
70 k60k
50o
40F-
301-
20
tO
100 200 300 400
P002 (Fiji)
tINE100
90
80
70
60
50
40
30
20
10
FIGURE 3 Correlation between FRCand the Pao2 (FiO2 = 1-0)at four different levels of end-expiratory pressure. Eachlowest point represents the relationship during IPPV, thenext at 5 cm PEEP, etc. Note that patient No. 3 had bronchi-ectasis. Values for the predicted FRCare from Bates, Mack-lem, and Christie (10).
2318 Falke, Pontoppidan, Kumar, Leith, Geffin, and Laver
4 _

TABLE I IData on Gas Exchange, Hemodynamics, and Respiratory Mechanics
End-expiratory pressure (cm H20)IPPV
control 5 - 10 15
PaO2, torrA-aDo2, torrPaco2, torrpH
Heart rate/minStroke volume, mlMean arterial pressure, mmHgMean central venous pressure, mmHg
Peak airway pressure, cm H20Mean airway pressure, cm H20Peak inspiratory flow, liter/secPeak expiratory flow, liter/secMinute ventilation, liter/min
literDynamic total respiratory compliance, cm H20
literDynamic lung compliance, cm H20
152±100515±10140.9±7.77.42 ±0.03
95±872.9±29.3
79±166.7±4.5
25.7±3.58.5 i1.7
0.76±0.101.19±0.25
1 1.57±2.09
203 ± 120**464± 120**39.3±7.47.43±0.04
95±874.5 ±35.1
81 ±267.8±4.3*
29.3 ±4.7**12.8±2.5**0.79±0.061.24±0.20
11.20±2.08
279± 106**384± 106**
39.4±6.17.43 ±0.05
97± 1271.1 ±41.5
804±208.4 ±3.6*
35.0±5.8**1 7.6±2.5**0.78±0.071.26±0.24
10.88±-1.96
347±4104**323 ±94**
41.6i7.247.40±0.06tt
100± 1072.1 ±43.1
86±2410.4 ±2.9**
42.046.3**21.5 -3.3**0.74±0.071.2940.23
10.2942.33t0.041 ±0.010 0.043 ±0.010 0.042 ±0.014 0.037±t0.014:
0.058±t0.017 0.0624±0.022 0.060±0.026 0.053±0.0241
Mean ±-SD, correlated t test was used to determine the significance of the changes.* P < 0.05, ** P < 0.01. Significantly different from value with any other level of end-expiratory pressure, with P as indicated.I P < 0.05, At P < 0.01. Significantly different only from value on 10 cm H20 end-expiratory pressure, with P as indicated.
TABLE I I IIndividual Data on Respiratory Mechanics
End-expiratory airway pressure (cm H20)IPPV
0 5 10 15PatientNo. FRC Pa,, P1 Pes VT Pas PI Pe. VT AFRC Pa. Pi Pe, VT AFRC Pa, P, Pes VT AFRC
1 0.8727 15 6
0.5833 20 13
0.58 0.0839 26 12
054 0.2245 31 12
0.48 0.420 -5 4 5 -2 8 10 4 8 15 7 8
2 1.63 24 101.15
22.5 12 121.15 0.23
36 18 141.05 0.55
41 21 181.05 1.010 -7 7 .5 -2.5 6.5 10 2.5 8 15 3 12
25 16 9 29 17 11 36 21.5 14 42 25 16.53 3.19 - - - 1.10 2 0- 1.10 0.25 -2 1.07 0.55 - --- - 1.03 0.92
0 -2 1 5 4.T5 10 5.0 5.5 1-5 8i 6.;5
4 1.3816.5 5.5 11 0.86
20 6.5 130.85 0.35
25 9 13.5 0.84 0.731 13 16
0.82 1.4541.38-- -086 - -0.85 035 ~~~-0-._ -084078 -6 -4 -8141 -5 6 5.5 -2.5 7.5 10. . 6 4 11
5 _20 11.5 8
1.0521 14 6
1.05 0.2026 18.5 8
1.15 0.44 8121 6.5 1.05 0.720 -3.5 3 5 0.5 4 10 4.5 6 1-47~.5 6.5
6 0.95 0 _3 -5 0.73 23 1 -15 0.77 0.25 - 1-0.730.50 - 0.67 0.780 -3 3 5 0 1F1 10 -3 11I.5 14 5 1-3
7 1-3329.5 22.5 55
0.7735.5 28 6.5 0-76 0-16
45 35.5 5-5 073 04051 39 12 0.62 0.58
0 2.5 -2 5 5.5 -0.5 1-110f.5 -0.5 ~ 1512.5 2
8 1.07 - -- 3 - - - -0 5 10
Mean 1.48 0.22 0.49 0.84SD 1:0.78 4:0.08 4:0.17 1:0.33
Pressures in cm H20; VT, and AFRCin liters. All pressures were obtained in succession; the negative transpulmonary pressures may result from thesemirecumbent position of the patient and a balloon volume of 0.4 ml (Milic-Emili et al. [6, 7]).
Ventilation with End-Expiratory Pressure in Acute Lung Disease 2319
0-5 0-i5 0-5 .0-15
cmPEEP
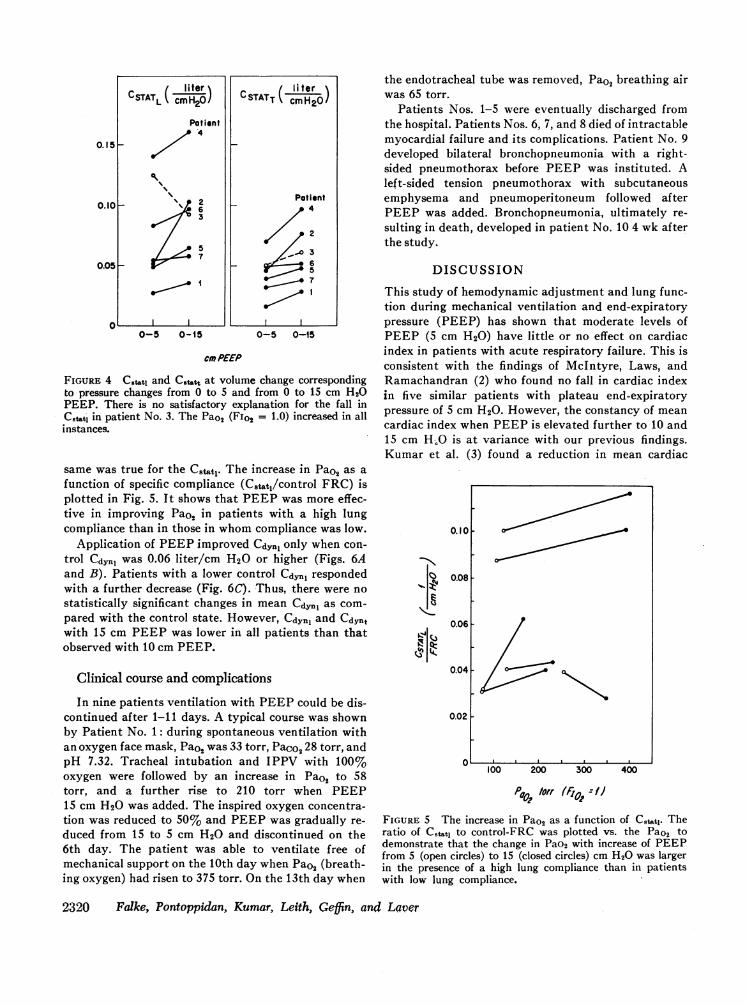
FIGURE 4 Cstatj and C~ttt at volume change correspondingto pressure changes from 0 to 5 and from 0 to 15 cm H20PEEP. There is no satisfactory explanation for the fall inC8tlt' in patient No. 3. The Pao2 (FiO2 = 1.0) increased in allinstances.
same was true for the Cstat. The increase in Pao2 as afunction of specific compliance (Cstat,/control FRC) isplotted in Fig. 5. It shows that PEEPwas more effec-tive in improving Pao2 in patients with a high lungcompliance than in those in whomcompliance was low.
Application of PEEPimproved Cdyn1 only when con-trol Cd.,1l was 0.06 liter/cm H20 or higher (Figs. 6Aand B). Patients with a lower control Cdyn, respondedwith a further decrease (Fig. 6C). Thus, there were nostatistically significant changes in mean Cdvl as com-pared with the control state. However, Cdynj and CdYntwith 15 cm PEEPwas lower in all patients than thatobserved with 10 cm PEEP.
Clinical course and complications
In nine patients ventilation with PEEPcould be dis-continued after 1-11 days. A typical course was shownby Patient No. 1: during spontaneous ventilation withan oxygen face mask, PaO2 was 33 torr, PaCo2 28 torr, andpH 7.32. Tracheal intubation and IPPV with 100%oxygen were followed by an increase in Pao2 to 58torr, and a further rise to 210 torr when PEEP15 cm H20 was added. The inspired oxygen concentra-tion was reduced to 50% and PEEPwas gradually re-duced from 15 to 5 cm H20 and discontinued on the6th day. The patient was able to ventilate free ofmechanical support on the 10th day when Pao2 (breath-ing oxygen) had risen to 375 torr. On the 13th day when
the endotracheal tube was removed, Pao2 breathing airwas 65 torr.
Patients Nos. 1-5 were eventually discharged fromthe hospital. Patients Nos. 6, 7, and 8 died of intractablemyocardial failure and its complications. Patient No. 9developed bilateral bronchopneumonia with a right-sided pneumothorax before PEEP was instituted. Aleft-sided tension pneumothorax with subcutaneousemphysema and pneumoperitoneum followed afterPEEP was added. Bronchopneumonia, ultimately re-sulting in death, developed in patient No. 10 4 wk afterthe study.
DISCUSSION
This study of hemodynamic adjustment and lung func-tion during mechanical ventilation and end-expiratorypressure (PEEP) has shown that moderate levels ofPEEP (5 cm H20) have little or no effect on cardiacindex in patients with acute respiratory failure. This isconsistent with the findings of McIntyre, Laws, andRamachandran (2) who found no fall in cardiac indexin five similar patients with plateau end-expiratorypressure of 5 cm H20. However, the constancy of meancardiac index when PEEPis elevated further to 10 and15 cm H.O is at variance with our previous findings.Kumar et al. (3) found a reduction in mean cardiac
0.101
C.
At
0.08-
0.06 -
0.04
0.02 I
100 200
P 02/rr300
tto:r //
400
FIGURE 5 The increase in Pao2 as a function of Cstatl. Theratio of C8,utj to control-FRC was plotted vs. the Pao2 todemonstrate that the change in Pao2 with increase of PEEPfrom 5 (open circles) to 15 (closed circles) cm H20 was largerin the presence of a high lung compliance than in patientswith low lung compliance.
2320 Falke, Pontoppidan, Kumar, Leith, Geffin, and Laver

s3.5100
Cd,.a No,
0.091 39S
0.0" 29S
0.04
0.062
120
63 _
0 10 20
3.0
2.5
2.0
I .5
I"
97
7?.5.
1.0
0.5
0 10 20 30
rRANSPULAAUARYPRSS& *f (coa
40
3.5
2.0
15
i.0
0.5
0.0200.0200.0240.0290JO29
-10 0 to 20 30 40
A ( Patient No. 4 ) B (Patient No. 2) C (Patient No. I)
FIGURE 6 Pressure volume loops of the lung with IPPV and different levels of PEEP. The scalemarked FRC (per cent of predicted) applies to all three figures; the scale to the right of each figureindicates the actual lung volume in liters. In figures A and B a loop is shown for each level of end-expiratory airway pressure with the lowermost obtained at zero cm H20 (IPPV). In figure C mostof the pressure volume loops for 5 and 10 cm H20 have been omitted for the sake of clarity andonly the end-expiratory static part retained. The values for Cdyl (liter/cm H20) are derived fromthe time tracings (see text and Table III); the values for Pao2 (torr) with a FiO2 = 1 are included.
index from 4.5 to 3.6 liters when an average level of13 cm H20 PEEPwas reapplied after 30 min of IPPV.In the present study end-expiratory plateau pressures
were produced without the use of expiratory flow im-pedance (Fig. 1) whereas Kumar et al. (3) used ex-
piratory flow impedance for the same purpose. Theflow impedance technique might be expected to resultin a higher mean airway pressure and more profoundcirculatory depression, as demonstrated in dogs byColgan, Barrow, and Fanning (11). In fact, the rise inmean airway pressure (from 11 to 23 cm H20) de-scribed by Kumar after 13 cm H20 PEEP was no
greater than the change extrapolated from the present
data for the same level of PEEP, i.e., from 8.5 to20 cm H20. Thus, the discrepancy cannot be explainedsolely by differences in technique of generating positiveend-expiratory airway pressures.
Inspection of individual changes (Fig. 2) shows thatthe cardiac index fell in the majority of patients, andthat the mean value is raised considerably by the dis-proportionate increase in cardiac index which occurredin patients Nos. 2 and 10.
A stereotyped hemodynamic response to applicationof PEEPcannot be expected since both the relationshipbetween available blood volume and capacity of the
intravascular bed (12) as well as the type of underlyinglung disease (13) influence this response. Uzawa andAshbaugh (14) and Cheney and Martin (15) observedlarge decreases in cardiac index with application ofPEEPin dogs with oleic acid induced acute respiratoryfailure. However, it is likely that acute hypovolemiadue to the severe pulmonary edema and massive fluidloss into the lungs was a mitigating factor.
PEEP and oxygenation. Mechanical ventilationwith PEEPmay effect arterial oxygenation by severalmechanisms. First, a change in cardiac output will altermixed venous oxygen content (oxygen consumption andOs/OT assumed constant) and, thus, influence Pao2.Also a change in cardiac output may be associated witha change in pulmonary artery pressure and redistribu-tion of pulmonary blood flow (16). The resultant changein Pao2 will depend on the relative perfusion of thenonventilated area, and whether this lesion is in a
dependent or nondependent portion of the lung. In our
series, two patients with predominantly unilateraldisease exhibited a significant rise in Pao2 with PEEPonly when the better lung was dependent. This phe-nomenon is illustrated in Fig. 7. Wehave found no cor-
relation between cardiac index and Pao2; however,pulmonary artery pressures were not measured. Second,
Ventilation with End-Expiratory Pressure in Acute Lung Disease
75 _
CA'WA1%3
'4.
50 _
251-
ii..
2.0
1.5 W
Z0
1.0 4
0.5
0I
P6%2101997455
2321

FIGURE 7 Influence of body position on the effect of positiveend-expiratory pressure (PEEP) on Pao2 seen in patientNo. 2 with left-sided pulmonary infiltrates, FIO2 = 1.0.
PEEP may produce regional changes in lung volumewith redistribution of blood flow to ventilated-perfusedand ventilated, nonperfused parts of the lung (17, 18).Third, an alteration of pulmonary mechanics may leadto improved gas distribution.
The low FRC observed in this and other studies(2, 3) is characteristic of patients with acute respiratoryfailure and large intrapulmonary right-to-left shunt(Qs/OT). It is not known whether the low FRC is an
artifact produced by the presence of a small com-
municating gas volume, i.e., closure of conductingairways with gas trapping, or closure of terminal gas-
exchanging air units. Although the evidence is incom-plete, we favor the latter for the following reasons.
First, as shown by Kumar et al. (3) when PEEP isdiscontinued abruptly, arterial Po2 falls sharply within1 min. Small airway closure (19) with subsequent ab-sorption of trapped gas and atelectasis (20) may explainthe subsequent, more gradual diminution in Pao2.
Second, if the airway pressure generated exceeds theopening pressure of distal conducting airways duringhelium equilibration by manual ventilation (seeMethods), then intermittent opening would allowhelium wash-in to distal airspaces, and this volume willbe included in the FRC measurement. Furthermore,during ventilation with 100l% oxygen, intermittentairway closure and gas trapping during part of therespiratory cycle will not lead to pronounced right-to-left shunting since fresh oxygen will enter gas-exchang-ing airspaces with each breath. If, on the other hand,peak inspiratory airway pressures are below criticalopening pressures for small, conducting airways, a
reduction in Qs/QT after the application of 5-10 cm
H20 PEEPwould be difficult to explain. The data are
inadequate to resolve the problem.PEEP and compliance. Inspection of the pressure
volume loops (Fig. 6A and B) reveals two changeswhen PEEP is elevated from 0 to 15 cm H20. First,a line joining the end-expiratory, static points of theloops describes a curve with a rising slope. This was
apparent in six of seven patients, and is interpreted as
evidence for an increase in static compliance with risinglevels of PEEP, probably secondary to recruitment ofterminal airspaces (4). The consistent increase inCstatt is well illustrated in Fig. 4. It is matched by a
similar increase in Cstatt with the exception of case
No. 3 where an unexplained fall was observed.In five patients the inflation limb of the pressure
volume loops recorded during ventilation with PEEPwere less convex towards the pressure axis than duringIPPV (Fig. 6B). Such changes in convexity probablyreflect a diminution in flow-resistive pressure and thealtered static pressure-volume behavior of a lung wheninflation is associated with recruitment of closed units.We conclude, therefore, that a decrease in airway re-
sistance, or diminished closure of lung units, or both,does take place when FRC is increased with PEEP.Patient No. 4 (Fig. 6A) who demonstrated the greatestrise in Pao2, showed no visible change in the inflationportion of his loop and only a small increase of therelatively high Cstat,. Another mechanism which may
have contributed to the large increase in Pao2 includesthe redistribution of blood flow secondary to regionalchanges in lung volumes (17, 18), as was discussedabove.
The fall in Cdyn1 and Cdynt observed in all patientswhen PEEPwas increased from 10 to 15 cm H20 may
reflect increasing stiffness of highly distended airspaces.On the other hand, the continued increase in Pao2 in theface of reduction in Cdyn1 and Cdynt may indicate thesimultaneous occurrence of airspace recruitment withoverdistention of open alveoli represented by theupper, flatter portion of the pressure volume curve.
The relative contribution of each to the change in lung
2322 Falke, Pontoppidan, Kumar, Leith, Geffin, and Laver
PC02 (TORR)POSITION P_PEEP 'EPEEP
Supine 66 97
Left Infiltrate Jii? 76Dependent @
Left Infiltrate 65 152Nondependent Ken6iiI 5
L

volume probably modulates the ensuing relationshipbetween FRCand Pao2.
ACKNOWLEDGMENTSThis work was supported by Grants GM-15904-03 and15904-04 from the National Institute of General MedicalSciences.
REFERENCES1. Ashbaugh, D. G., T. L. Petty, D. B. Bigelow, and T. M.
Harris. 1969. Continuous positive-pressure breathing(CPPB) in adult respiratory distress syndrome. J.Thorac. Cardiovasc. Surg. 57: 31.
2. McIntyre, R. W., A. K. Laws, and P. R. Ramachandran.1969. Positive expiratory pressure plateau: improved gasexchange during mechanical ventilation. Can. Anaesth.Soc. J. 16: 477.
3. Kumar, A., K. J. Falke, B. Geffin, C. F. Aldredge, M. B.Laver, E. Lowenstein, and H. Pontoppidan. 1970. Con-tinuous positive-pressure ventilation in acute respiratoryfailure. Effects on hemodynamics and lung function.N. Engl. J. Med. 283: 1430.
4. Mead, J., and C. Collier. 1959. Relation of volume historyof lungs to respiratory mechanics in anesthetized dogs.J. Appl. Physiol. 14: 669.
5. Laws, A. K. 1968. Effect of induction of anaesthesia andmuscle paralysis on functional residual capacity of thelungs. Can. Anaesth.lSoc. J. 15: 325.
6. Milic-Emili, J., J. Mead, J. M. Turner, and E. M. Glauser.1964. Improved technique for estimating pleural pressurefrom esophageal balloons. J. Appl. Physiol. 19: 207.
7. Milic-Emili, J., J. Mead, and J. M. Turner. 1964. Topog-raphy of esophageal pressure as a function of posture inman. J. Appi. Physiol. 19: 212.
8. Grenvik, A., and U. Hedstrand. 1966. The reliability ofpneumotachography in respirator ventilation. ActaAnesthesiol. Scand. 10: 157.
9. Grenvik, A., U. Hedstrand, and H. Sjorgren. 1966.
Problems in pneumotachography. Acta Anaesthesiol.Scand. 10: 147.
10. Bates, D. V., P. T. Macklem, and R. V. Christie. 1971.Respiratory Function in Disease. W. B. Saunders Com-pany, Philadelphia, Pa. 2nd edition. 93.
11. Colgan, F. J., R. E. Barrow, and G. L. Fanning. 1971.Constant positive-pressure breathing and cardiorespira-tory function. Anesthesiology. 34: 145.
12. Sykes, M. K., A. P. Adams, W. E. I. Finlay, P. W. Mc-Cormick, and A. Economides. 1970. The effects of varia-tions in end-expiratory inflation pressure on cardiorespira-tory function in normo-, hypo-, and hypervolaemic dogs.Brit. J. Anaesth. 42: 669.
13. Hedley-Whyte, J., H. Pontoppidan, and M. J. Morris.1966. The response of patients with respiratory failureand cardiopulmonary disease to different levels of constantvolume ventilation. J. Clin. Invest. 45: 1543.
14. Uzawa, T., and D. G. Ashbaugh. 1969. Continuous posi-tive-pressure breathing in acute hemorrhagic pulmonaryedema. J. Appi. Physiol. 26: 427.
15. Cheney, F. W., and W. E. Martin. 1971. Effects of con-tinuous positive-pressure ventilation on gas exchange inacute pulmonary edema. J. Appl. Physiol. 30: 378.
16. West J. B. 1970. Ventilation/Blood Flow and Gas Ex-change, Blackwell Scientific Publications Ltd., Oxford.2nd edition.
17. Hughes, J. M. B., J. B. Glazier, J. E. Maloney, and J. B.West. 1968. Effect of lung volume on the distribution ofpulmonary blood flow in man. Respir. Physiol. 4: 58.
18. Roos, A., L. J. Thomas, Jr., E. L. Nagel, and D. C.Prommas. 1961. Pulmonary vascular resistance as deter-mined by lung inflation and vascular pressures. J. Appl.Physiol. 16: 77.
19. Craig, D. B., W. M. Wahba, H. F. Don, J. G. Couture,and M. R. Becklake. 1971. "Closing volume" and itsrelationship to gas exchange in seated and supine positions.J. Appl. Physiol. 31: 717.
20. Burger, E. J., Jr., and P. Macklem. 1968. Airway closure:demonstration by breathing 100% 02 at low lung volumesand by N2 washout. J. Appl. Physiol. 25: 139.
Ventilation with End-Expiratory Pressure in Acute Lung Disease 2323