enablinggreen computing environments
TRANSCRIPT

Enabling Green Computing in Cloud Environments: Network Virtualization Approach Towards 5G Support
Jitendra Kumar Verma1, Sushil Kumar1, Omprakash Kaiwartya2, Yue Cao2,*, Jaime Lloret3, C. P. Katti1,and Rupak Kharel4
1School of Computer & Systems Sciences, Jawaharlal Nehru University, New Delhi-110067, India.{[email protected], [email protected], [email protected]}
2Department of Computer and Information Sciences, Northumbria University, Newcastle, U.K.{[email protected], [email protected]}
3Department of Communications, Polytechnic University of Valencia, Camino de Vera 46022,Valencia, Spain{[email protected]}
4School of Engineering, Manchester Metropolitan University, Manchester,M1 5GD, UK{[email protected]}
Abstract
Virtualization technology has revolutionized the mobile network and widely used in 5G innovation. It is a way of computingthat allows dynamic leasing of server capabilities in the form of services like SaaS, PaaS, and IaaS. The proliferation ofthese services among the users led to the establishment of large-scale cloud data centers that consume an enormousamount of electrical energy and results into high metered bill cost and carbon footprint. In this paper, we propose threeheuristic models namely Median Migration Time (MeMT), Smallest Void Detection (SVD) and Maximum Fill (MF) that canreduce energy consumption with minimal variation in SLAs negotiated. Specifically, we derive the cost of running cloud datacenter, cost optimization problem and resource utilization optimization problem. Power consumption model is developed forcloud computing environment focusing on liner relationship between power consumption and resource utilization. A virtualmachine migration technique is considered focusing on synchronization oriented shorter stop-and-copy phase. The completeoperational steps as algorithms are developed for energy aware heuristic models including MeMT, SVD and MF. To evaluateproposed heuristic models, we conduct experimentations using PlanetLab server data often ten days and synthetic workloaddata collected randomly from the similar number of VMs employed in PlanetLab Servers. Through evaluation process, wededuce that proposed approaches can significantly reduce the energy consumption, total VM migration, and host shutdownwhile maintaining the high system performance.
Index Terms
Mobility; Cloud computing; Energy efficiency; Virtualization; VM consolidation.
F
1 INTRODUCTION
C LOUD computing is a cost-effective model to deliver computing services such as Software as a Service (SaaS), Platformas a Service (PaaS) and Infrastructure as a Service (IaaS) on pay-as-you-go basis. It offers the benefit in terms of efficient
IT management and maintenance with changing business needs without even letting know about the upgrading processto the clients. The proliferation of cloud computing led to the emergence of large-scale data centers around the world thathost thousands of computing node facilities. These data centers consume enormous amount of electrical energy due to thehuge hardware infrastructure associated. According to a report published by Environmental Protection Energy (EPA), thecurrent power consumption by data centers in the US is more than 3% of the total electricity usage by the country thatbecomes approximately 1.5%–3% of global energy consumption which is growing about 12% every year [1]. Nowadays,data centers worldwide are originating more than 43 million tons of CO2 per year and adversely affecting the environmenttowards global warming. Besides of the economic impact, the heat and carbon content generated by the cooling system ofthe data centers are expected to overtake the aviation industry by 2020 [2].
Fifth Generation (5G) cellular wireless networks is a promising solution towards high data rate demanding appli-cations, improved quality-of-experience, end-to-end latency and lower energy consumption [3]. Liang et al. proposed an
*Corresponding Author: [email protected]
Transactions on Emerging Telecommunications Technologies
Cite As: VERMA, J., KUMAR, S., KAIWARTYA, O., CAO, Y., LLORET, J., KATTI, C. P., KHAREL, R., 2018.
Enabling green computing in cloud environments: Network virtualization approach toward 5G support. Transactions on Emerging Telecommunications Technologies, pp. e3434.
brought to you by COREView metadata, citation and similar papers at core.ac.uk
provided by Nottingham Trent Institutional Repository (IRep)

ii
information-centric wireless network virtualization architecture to integrate wireless network virtualization and information-centric networking for software-defined 5G mobile wireless networks [4]. The key components of this architecture areradio spectrum resource, wireless network infrastructure, virtual resources, and information-centric wireless virtualizationcontroller [5]. Virtual resources includes content-level slicing, network-level slicing, and flow-level slicing and powersvirtual resource allocation. The in-network caching strategy is formulated as an optimization problem with the fact that thegain is not only virtualization but also in-network caching. Wang et al. suggested a packet switching scheme to improveperformance of wireless network virtualization by locating frames into user space and placing control and data frame inkernel space [6] . In [7], a hierarchical control based cell clustering model is suggested to integrate heterogenous wirelessnetwork and to coordinate among network resources towards optimizing resource utilization.
Virtulization is the central technology behind 5G support and success of cloud computing paradigm for resource sharingto meet rising level of resource demand in daily resource request patterns and facilitating ultra-short latency [8, 9]. Cloudcomputing helps to reduce carbon footprint of data centers and saves operating cost by improving resource utilization ofdata centers using virtualization technologies. The improved resource utilization cut downs higher energy consumptionrequired for running cloud data centers. Virtualization technology allows creation of multiple isolated partition of resourcecapabilities available with computing nodes and make those partitions able to run multiple guest Operating Systems(OS) at the same computing node. These isolated partitions running guest OS share computing resources and are calledVirtual Machines (VM). Virtualization technologies enable live migrations of VMs among computing nodes without evendisrupting the application services hosted on VMs. The property of live migration offered by cloud infrastructure is thecore heart of VM consolidations that helps to improve the resource utilization of a physical host, by migrating VMs fromleast loaded hosts to normal loaded hosts. In this way, smaller resource capabilities available with physical hosts are ableto handle higher incoming workloads and thus reduce computing and cooling energy requirements [10, 11, 12, 13, 14].
In order to cope up with energy inefficiency problem of cloud infrastructure, we leverage the benefit of VM consolidationmodel for consolidating VMs on relatively small number of physical hosts and switch rest of the hosts in sleep/standbymode to minimize energy consumption [15]. Standard Performance Evaluation Corporation (SPEC) provides benchmarkon power consumption data that are utilized in the measurement of total power consumption by a large scale cloud datacenter as summation of power consumption by the individual physical host [16]. We apply VM consolidation mechanismsby reducing active physical machines with power consumption data of servers on different load levels for measurement ofpower consumption. In [17], expected energy consumption model is suggested for cloud computing systems to calculatetask sojurn time and mean energy consumption for the hosts. It optimize energy consumption using deadline aware taskscheduling algorithm by reducing variance of service time based on similar tasks. However, it is impractical to identify thetask sojurn time and expected energy consumption until the jobs are finished. Moreover, deadline aware task schedulingcauses extra penalty on the system and increases the cost of scheduling. VM consolidation model has been suggestedusing reinforcement learning that utilize Q-learning method to learn effective control policy for a given task without priorlearning of environment [18]. However, Q-learning method turns out to be slower and may trap in the local minima.Ref. [19] provides regression based utilization prediction model that approximates not only the future CPU utilizationbut also memory utilization of VMs and hosts along with model validation using PlanetLab and google cluster data[20, 21]. However, the model is limited to liner relationship and it is so sensitive to outliers. A utility based model hasbeen suggested that apply frequency settings prior to VM scheduling for consolidation to force scheduling under currentactual utilization rather than unreal utilizations [22]. Similarly, our approach triggers server offloading on current serverutilization rates if it exceeds the dynamic utilization threshold value. Ant colony meta-heuristic has been suggested tooptimize VM placement on physical hosts that uses artificial ants to consolidate VMs on reduced number of active hostsbased on three resource dimensions namely, CPU, memory and network Input/Output [23]. However, we focus our studyon computation part that depends on CPU utilization rate and major source of energy consumption.
In this paper, we address the problem of energy efficiency in Cloud computing environment by adopting the methodol-ogy of VM consolidation models. We propose three novel energy efficient heuristic models to optimize energy consumptionon cloud data centers. The main contributions in this work are as follows:
(i) We formulate the cloud data center running cost as a cost optimization problem by considering the costs of runningsingle physical host as a basic unit for cost calculation. It considers cost of power consumption and cost incurred dueto penalties associated with hosts suffering from SLA violation due to the host overutilization.
(ii) We formulate resource utilization optimization problem to identify the availability of rooms for accommodating oneor more VMs on same physical hosts to understand the consolidation process and optimize VM allocation in cloudenvironments.
(iii) We propose three novel heuristic models namely, Median Migration Time (MeMT), Smallest Void Detection (SVD) andMaximum Fill Technique (MFT) to optimize the VM allocation and consolidation process.
(iv) We derive a new metric called total host shutdown for performance evaluation of the proposed heuristic models.(v) We perform simulations for the proposed algorithms by extending CloudSim simulation toolkit to evaluate the
performance of the proposed methods in composition with the benchmark algorithms for VM consolidation.Rest of the paper is organized as follows. Section 2 provides literature review and discuss related work, Section 3
presents the detail of the proposed energy aware virtualization models, Section 4 discusses the performance evaluation ofthe proposed models compared with the baseline benchmark methods. Section 5 concludes the paper.
Cite As: VERMA, J., KUMAR, S., KAIWARTYA, O., CAO, Y., LLORET, J., KATTI, C. P., KHAREL, R., 2018.
Enabling green computing in cloud environments: Network virtualization approach toward 5G support. Transactions on Emerging Telecommunications Technologies, pp. e3434.

iii
2 RELATED WORK
The proposed work is built upon the following considerations. An important feature of online power management is theability of data center to deal with heterogeneous server configuration. Nathuji and Schwan proposed resource managementstrategies for VM consolidation that achieve efficiency through local and global policies using live migration of VMs fromoverloaded servers [24]. At the local level, the system applies power management policies of guest OSs. On the other hand,global manager keeps an eye the current resource allocation by the local manager. Global manager implements its policy onlocal resources to decide whether the VM placement is required. They did not considered any specific policy for automaticresource management at the global level.
Kusic et al. proposed the idea of Limited Lookahead Control (LLC) where they consolidate VMs as sequential opti-mization using LLC. The LLC explores for state-space trajectory within a horizon of length h [25]. They used Kalman filterto predict the number of impending arrivals to deal with time varying nature of workload and to perform necessary re-allocations [26]. Their model requires simulation-based learning for the application-specific adjustments, Such adjustmentscannot be implemented by IaaS Cloud providers such as Amazon EC2. Moreover, the execution time of the optimizationcontroller of their model approaches to 30 minutes even for 15 nodes. Such situation is not suitable for large-scalecloud systems. On the contrary, the proposed heuristic model in this paper aims to achieve high performance for largeinfrastructure and does not require simulation based learning prior to deployment of application in real cloud system.
Verma et al. proposed the idea of power and migration cost-aware placement of applications in a virtualized environ-ment based on bin-packing problem that suggests for packing not more than 11
9 OPT + 1 balls in a bin where OPT isgiven by the optimal solution [27] [28]. To represent heterogeneous environment they considered heterogeneously sizedbins where hosts correspond to the bins and VMs to the balls. Meanwhile, the proposed algorithm does not ensure theService Level Agreement (SLA) negotiated due to workload variability in the case of PlanetLab server traces and randomworkload traces both. Workload traces of PlanetLab servers were collected as a part of CoMon project which is a monitoringinfrastructure for PlanetLab servers located at more than 500 places around the world [20].
Gmach et al. proposed host load simulator that forecast workload’s time-varying resource requirement based onhistorical data to suggest appropriate simulated server [29]. The simulated host determines the workload demand gapfor the resources by using fair share scheduling strategy static threshold for VM migrations in their work. Similarly,Beloglazov et al. proposed static threshold based approach with minimum migration technique for dynamic consolidationof workload [30]. However, static threshold based approach is not suitable for an Infrastructure-as-a-Service (IaaS) typedeployment model of Cloud computing environment because static values based thresholds are not able to cope up withdynamic and unpredictable workload [31]. On the contrary, we have chosen mechanism of choosing upper and lowerthresholds to be dynamic in consonance of impending dynamic workload to the hosts.
Host offloading at runtime with resource near the device at the logical edge is a is a challenging task due to the conflictbetween resource demand and user experience and dynamically changing context that makes for good or bad offloadingstrategies [32]. Beloglazov et al. proposed modified best fit decreasing heuristic for VM placement and proposed minimummigration policy of VM selection on overloaded hosts [33]. They introduced double threshold (upper and lower) methodto keep utilization of hosts between the thresholds. In their another work, they proposed several adaptive heuristics forenergy efficient allocation of resources to overcome the problem of static threshold values [15]. Similarly, we adopted doublethreshold method to keep the utilization level of a host at optimum level where lower threshold is depicted indirectly bychoosing minimum utilized host as the underloaded host.
Kistowski et al. proposed several Interpolation methods like Nearest Neighbour Interpolation, Linear Interpolation,Shepard Interpolation and Polynomial Interpolation in to identify the power consumption and compared them to deter-mine the accuracy of the proposed methods to select the best interpolation method using independent reference datasetcontaining a large set of data points [34]. On the contrary, we apply the standard power consumption details on given CPUutilization of hosts to estimate energy consumption for specified duration under the experimental setup used in this paper.
Live migration is a core function to replace running VMs seamlessly across distinct physical hosts [35, 36, 37]. It refers tothe moving of a VMs that are in execution between different physical hosts without even disrupting its services. At the endof live migration process, the CPU, memory, storage, and network connectivity of the VM are transferred from the originalguest machine to the destination [38]. In virtualized data centers, live migration provides a significant benefits that areextremely powerful tool for system management in cloud computing such as virtual server mobility without disruption ofservices, VM load balancing, fault tolerance, power management and other applications [24, 39, 40, 41, 42].
3 ENERGY AWARE VM CONSOLIDATION
3.1 Problem SpecificationIn data centers jobs are majorly classified into two categories including Compute intensive and Data intensive [43]. VMconsolidation models for energy efficiency majorly rely upon CPU utilization of servers. This fact makes it difficult to builda precise analytical power consumption model for modern multi core CPUs due to the unavailability of empirical dataon all the variables involved. Meanwhile, We identified following issues with existing cloud computing models: (i) IaaSprovider needs to find efficient packing solution for VM provisioning across a large pool of servers, (ii) For packing theseVMs on non-overloaded hosts, several live migrations are required, (iii) Live migration of VMs leaves several physical
Cite As: VERMA, J., KUMAR, S., KAIWARTYA, O., CAO, Y., LLORET, J., KATTI, C. P., KHAREL, R., 2018.
Enabling green computing in cloud environments: Network virtualization approach toward 5G support. Transactions on Emerging Telecommunications Technologies, pp. e3434.

iv
hosts to be underloaded that needs to be either switched into standby mode or turned off, (iv) Waking up servers in activestate causes extra penalties that should be reduced by minimizing host shutdowns.
VM consolidation is the process of consolidating large number of VMs on fewer physical hosts to minimize totalenergy consumption. It signifies that servers are more energy efficient at higher utilization level and less efficient at lowerutilization due to the ideal power consumption around 50% power consumption at full utilization level [44]. Two majorproblems with VM consolidation includes minimizing total cost of running a physical host; and minimizing total cost ofthe penalty caused by SLA violations.
Every CPU clock consumed during active, idle and sleep period of a host causes power consumption and contributetowards total cost of running physical hosts [45]. Meanwhile, the SLA violations occur when the total demand for theCPU resources exceed the available CPU capacity of a particular physical host. Let us assume that Cp is the cost ofpower required for running an active physical host and Cv is the cost of SLA violation by a physical host due to excessiveresource demand. We define cost of running a cloud data center as cost optimization problem in (1) and resource utilizationoptimization problem for a host in (2).
minimizeC
C =m∑i=0
T∑t=t0
Cp m∑i=0
ati + Cv
m∑j=0
vtj
subject to Cp ≥ 0,
Cv ≥ 0,
ati, vtj ∈ 0, 1,
Cp, Cv ∈ R+.
(1)
and,
minimizeZ
Z = Tu,j −Nu,jsubject to Tu,j −Nu,j > 0,
Tu,j , Nu,j ≥ 0,
Tu,j , Nu,j ≤ 1,
(2)
whereNu,j =∑ni=1 Υ(VMi,j), ati ∈ {0, 1}, ati is either “0” or “1” for inactive and active hosts, respectively. similarly, vtj ∈
{0, 1}, vtj is “1” if the host is suffering from SLA violations and “0” if there are no SLA violations for the correspondinghost. T is the total period of observation, t0 is the starting point of time when observation starts. Z is the resource wastagedue to gap between utilization threshold Tu,j of host j and Nu,j is utilization of host j when host runs below the Tu,j ,Υ(·) provides ratio of MIPS allocated to the VM and MIPS capacity of the host, and VMi,j is ith VM executing over hostj. Z should be minimized to optimize VM allocation for improving resource utilization of the host and in nutshell globalutilization of Cloud data center.
As can be seen in Fig. 1, VM consolidations to fewer hosts takes four steps that S1, S2, S3 and S4. Global monitoringmodule keeps track of CPU utilizations of m hosts in step S1 that declare a host to be overloaded, underloaded ornormal loaded. VM selection criteria is applied in S2 to identify suitable VMs from overloaded and underloaded hosts foroffloading them using live migration of VMs in S3. In S4, VM allocation takes place to optimize VM placement in physicalhosts.
TABLE 1: Power consumption benchmark data (Watt)
Physical Host 0 % 10 % 20 % 30 % 40 % 50 % 60 % 70 % 80 % 90 % 100 %
HP ProLiant G4 86 89.4 92.6 96 99.5 102 106 108 112 114 117HP ProLiant G5 93.7 97 101 105 110 116 121 125 129 133 135
3.2 Power ModelIn cloud computing environment, a typical server rarely experience CPU utilization more than 50% that are provisionedwith an additional capacity to deal with load spikes of high variations. Recent studies have affirmed that power con-sumption are described by linear relationship between power consumption and CPU utilizations where CPU is utilized intimesharing manner by various tasks executing in VMs. For a single server system, the linear relationship can be establishedas shown in (3).
Ptotal = Psleep + Pnosleep (3)
where Psleep accounts for power consumption while server is in standby state (Pstandby) and server switches from sleepmode to no-sleep mode (Ptransition). Meanwhile, Pnosleep accounts for the sum of static power consumption (Ps) when
Cite As: VERMA, J., KUMAR, S., KAIWARTYA, O., CAO, Y., LLORET, J., KATTI, C. P., KHAREL, R., 2018.
Enabling green computing in cloud environments: Network virtualization approach toward 5G support. Transactions on Emerging Telecommunications Technologies, pp. e3434.

v
ServerServer ServerServer ServerServer
. . .
Overloaded HostsServerServer ServerServer ServerServer
. . .
Underloaded HostsServerServer ServerServer ServerServer
. . .
Normal Load Hosts
ServerServer ServerServer ServerServer
. . .
Normal Load HostsServerServer ServerServer ServerServer
. . .
Underloaded Hosts
. . .
Standby Hosts
Global Monitoring Module
VM Selection
VM AllocationVM
Consolidation
VM
Migrations
1S
2S
3S
4S
Fig. 1: In architecture shwn above, VM consolidation has two steps of VM selection and VM allocation. Before makingdecision of VM consolidation, all hosts are monitored for being overloaded, underloaded and normal load. VMs areselected and migrated from overloaded host to the normal loaded or underloaded hosts.
host is ideal and when host is active and performing computation (c · V 2 · f ) where c is constant, V is voltage applied andf is CPU clock frequency.
In this paper, total power consumption by a data center constitutes server running cost, cooling device cost and networkpower consumption cost [46]. Power consumption is triggered by CPU utilization ratings (host’s states) given by standardpower consumption benchmarks [16] for the servers as shown in Table 1. Assuming, Phost to be power consumption byphysical hosts, Pcooling to be power consumption in cooling data center, and Pnetwork to be power consumption networkequipments, then power consumption by the data center can be modeled as provided in (4).
Pdatacenter = Phost + Pcooling + Pnetwok (4)
where Phost is∑mi=1 Phi
, Pcooling is∑pj=1 Pj , and Pnetwork is PToR+PAgr+PCR. In this context Phi
is power consumptioncorresponding to ith physical host, Pj is power consumption in cooling corresponding to the jth rack of active hosts, PToRis power consumption by switches on top of racks, PAgr is power consumption by aggregation layer switches and PCR ispower consumption by core router of the network.
3.3 Live Migration of VMsIn the live migration process, physical memory image is pushed across network to the new destination host in severalrounds as pages while the source VM continues running on old host. The pages that are transferred successfully to thenew host machine are flagged in original VM at source the host (pre-copying). During the transfer, the pages might getdirty and has to be resent to ensure memory consistency. After several rounds of synchronization, a very short stop-and-copy phase is performed to transmit the remaining pages for resuming execution of VM on new destination. Meanwhile,the cost of live migrations varies significantly for different workloads due to variety of VM configurations and workloadcharacteristics. The relatively small stop-and-copy phase results in to a VM downtime that consists of following two partsand shown in (5): (i) Time spent on transferring remaining pages during the stop-and-copy phase (Tn), and (ii) Time spenton resuming execution of VM at the destination host (Tresume).
Tdowntime = Tn + Tresume (5)
3.4 Proposed Energy Aware AlgorithmsIn this section, we propose host offloading techniques to bring the host utilization below the host utilization thresholdand improve the host utilization to omptimize the energy consumption. Let us assume, HO and HU are the representationof hosts that are overloaded and underloaded, respectively. The overloaded and non-overloaded hosts are presented in
Cite As: VERMA, J., KUMAR, S., KAIWARTYA, O., CAO, Y., LLORET, J., KATTI, C. P., KHAREL, R., 2018.
Enabling green computing in cloud environments: Network virtualization approach toward 5G support. Transactions on Emerging Telecommunications Technologies, pp. e3434.

vi
Tu
Cu
(a) Overloaded Host withCu > Tu
Tu
Cu
(b) Non-Overloaded Hostwith Cu < Tu
Tu
Cu
(c) Under loaded Hostwith Cu << Tu
Fig. 2: Delineating states of overloaded, non-overloaded servers and underloaded host
Fig. 2(a) and Fig. 2(b), respectively where as Fig. 2(c) shows an underloaded host with CPU utilization much less thanutilization threshold of the host. The proposed host offloading methods come in action when the host h ∈ HO. The Hostis considered to be underloaded that is h ∈ HU if the host is experiencing minimum utilization among all the hosts andtherefore all the VMs shall migrate from this host. The proposed host offloading techniques, when h ∈ HO , are as followsin the subsequent sections.
3.4.1 Median Migration TimeThe best VM selection policy in [15] was shown to be Minimum Migration Time (MMT) that selects the VM v with theminimum migration time relatively to other VMs. The migration time is the ratio of amount of memory utilized by VM ito the bandwidth spare with physical host j over which ith VM is executing as shown in (6).
ttransferi =Cmemi,j
hBWj(6)
where Cmemi,j is memory utilized by ith VM on jth host, hBWj is spare bandwidth to the jth host, and ttransferi is VMmigration/transfer time.
A physical host or cloud sever includes multiple processors and a large quantity of memory that demands a significantamount of electrical power for their operations involved. Much of electrical power consumed by these processors andmemory dissipates as heat content resulting into creation of hot-spots. In data centers, hot-spots are a serious issue dueto excessive temperature in one or more areas causing damage of equipments. Meanwhile, the MMT fails to address theissue of hot-spots causing few PMs to be highly overloaded. In addition to this, the MMT is unable to address the high VMmigrations from the overloaded host necessitating several more live migrations. For instance, an overloaded host is filled upby all the VM instance types (Table 3) that is t1.medium, t1.xlarge, t1.small, and t1.micro then MMT force the migrationof one or more instances of t1.micro due to its primary criteria of selecting a VM with lowest transfer time to make thehost non-overloaded. This condition does not ensure restriction on total live VM migrations. Moreover, the process of livemigration of VMs increases the task completion time that are in execution due to the small downtime associated with VMtransfer from source host to the destination host that disrupts task execution on VM. High VM migrations exacerbatesenergy consumption because of the load transfer factor in the part of network, increased task completion time, and VMmigrations overhead in MMT.
VM1 VM2 VM3 VM4 VM5 VM6
Selected VM
VM7
(a) If (|VM | mod 2 ≡ 0), andVMmedianE ,l,j is not in migration
VM1 VM2 VM3 VM4 VM5 VM6
Selected VM
(b) If (|VM | mod 2 ≡ 0), andVMmedianE ,l,j is not in migration
VM1 VM2 VM3 VM4 VM5 VM6
Selected VM
(c) If (|VM | mod 2 ≡ 0) andVMmedianE ,l,j is in migration
Fig. 3: Median Migration Time Based VM Migration
We introduce Median Migration Time (MeMT) policy to address the issue of MMT. This technique is centered aroundthe memory possessed by a VM. MeMT not only help to cope up with hot-spot issue but also reduce the VM migrations. thehotspot in fewer migrations often leads to a decrease in SLA violation. Therefore, this study proposes VM selection policies
Cite As: VERMA, J., KUMAR, S., KAIWARTYA, O., CAO, Y., LLORET, J., KATTI, C. P., KHAREL, R., 2018.
Enabling green computing in cloud environments: Network virtualization approach toward 5G support. Transactions on Emerging Telecommunications Technologies, pp. e3434.
vii
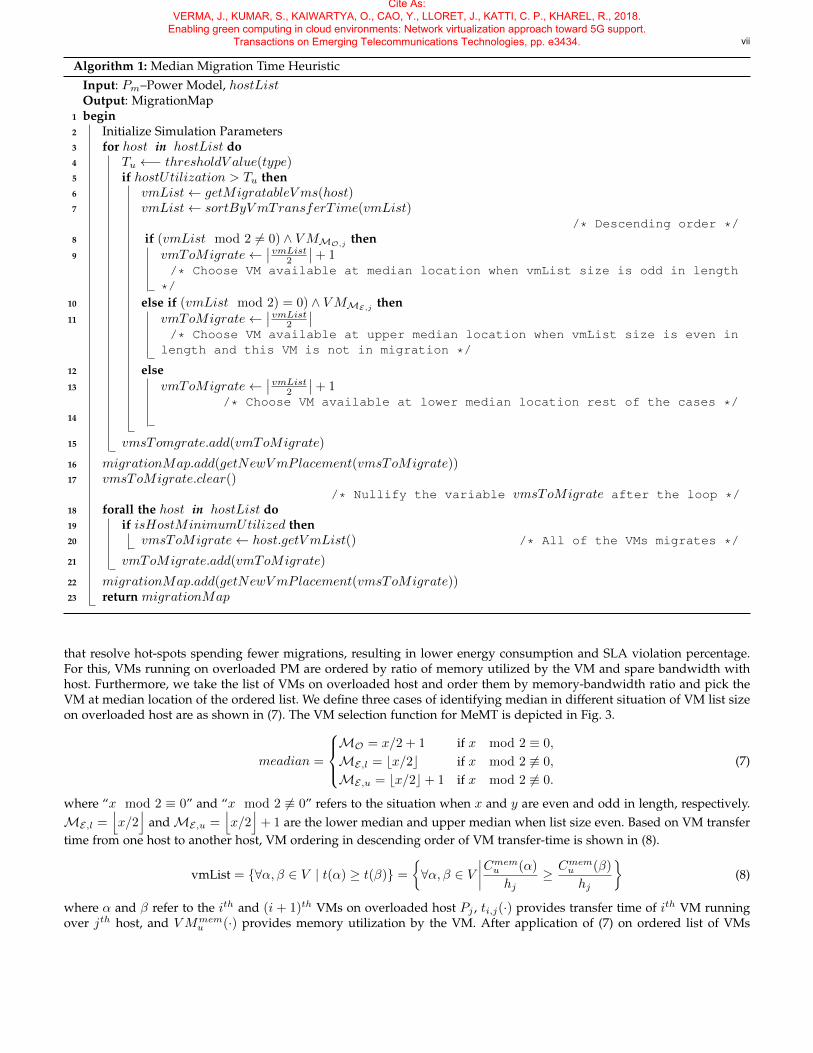
Algorithm 1: Median Migration Time HeuristicInput: Pm–Power Model, hostListOutput: MigrationMap
1 begin2 Initialize Simulation Parameters3 for host in hostList do4 Tu ←− thresholdV alue(type)5 if hostUtilization > Tu then6 vmList← getMigratableV ms(host)7 vmList← sortByV mTransferT ime(vmList)
/* Descending order */8 if (vmList mod 2 6= 0) ∧ VMMO,j
then9 vmToMigrate←
∣∣ vmList2
∣∣+ 1/* Choose VM available at median location when vmList size is odd in length
*/
10 else if (vmList mod 2) = 0) ∧ VMME,j then11 vmToMigrate←
∣∣ vmList2
∣∣/* Choose VM available at upper median location when vmList size is even in
length and this VM is not in migration */
12 else13 vmToMigrate←
∣∣ vmList2
∣∣+ 1/* Choose VM available at lower median location rest of the cases */
14
15 vmsTomgrate.add(vmToMigrate)
16 migrationMap.add(getNewVmPlacement(vmsToMigrate))17 vmsToMigrate.clear()
/* Nullify the variable vmsToMigrate after the loop */18 forall the host in hostList do19 if isHostMinimumUtilized then20 vmsToMigrate← host.getV mList() /* All of the VMs migrates */
21 vmToMigrate.add(vmToMigrate)
22 migrationMap.add(getNewVmPlacement(vmsToMigrate))23 return migrationMap
that resolve hot-spots spending fewer migrations, resulting in lower energy consumption and SLA violation percentage.For this, VMs running on overloaded PM are ordered by ratio of memory utilized by the VM and spare bandwidth withhost. Furthermore, we take the list of VMs on overloaded host and order them by memory-bandwidth ratio and pick theVM at median location of the ordered list. We define three cases of identifying median in different situation of VM list sizeon overloaded host are as shown in (7). The VM selection function for MeMT is depicted in Fig. 3.
meadian =
MO = x/2 + 1 if x mod 2 ≡ 0,
ME,l = bx/2c if x mod 2 6≡ 0,
ME,u = bx/2c+ 1 if x mod 2 6≡ 0.
(7)
where “x mod 2 ≡ 0” and “x mod 2 6≡ 0” refers to the situation when x and y are even and odd in length, respectively.ME,l =
⌊x/2
⌋andME,u =
⌊x/2
⌋+ 1 are the lower median and upper median when list size even. Based on VM transfer
time from one host to another host, VM ordering in descending order of VM transfer-time is shown in (8).
vmList = {∀α, β ∈ V | t(α) ≥ t(β)} =
{∀α, β ∈ V
∣∣∣∣Cmemu (α)
hj≥ Cmemu (β)
hj
}(8)
where α and β refer to the ith and (i + 1)th VMs on overloaded host Pj , ti,j(·) provides transfer time of ith VM runningover jth host, and VMmem
u (·) provides memory utilization by the VM. After application of (7) on ordered list of VMs
Cite As: VERMA, J., KUMAR, S., KAIWARTYA, O., CAO, Y., LLORET, J., KATTI, C. P., KHAREL, R., 2018.
Enabling green computing in cloud environments: Network virtualization approach toward 5G support. Transactions on Emerging Telecommunications Technologies, pp. e3434.

viii
obtained, VMs are selected for migration from overloaded hosts in the following manner as shown in (9).
v =
VMMO,j if (|VM | mod 2 6≡ 0) andB(VMMO,j) = 0,
V MME,l,j if (|VM | mod 2 ≡ 0) andB(VMME ,l,j) = 0,
V MME,u,j otherwise.
(9)
B : x→ y, where x ∈ VM and y ∈ {0, 1}
where VMmedianO,j refers to the VM available at median location (i.e. |VM |2 + 1) when VM list size is odd in length,VMmedianE ,l,j refers to the VM available at lower-median location (i.e. |VM |2 ) when VM list size is even in length, andVMmedianE ,u,j refers to the VM available at upper-median location (i.e. |VM |2 +1) when VM list size is even in length. B(·)is a boolean function that returns 0 when its argument corresponding to the VM on overloaded host is not in migration.Stepwise illustration of MeMT (Algorithm 1) is summarized below:
1) Step-1: Power model Pm and hostList is supplied.2) Step-2: Simulation parameters are initialized.3) Step-3–16: for loop detects overloaded hosts and VMs are arranged in descending order of VM migration time. VM
available at median location of the list according to the criteria provided in (7) is set for migration to offload the hostif this VM is not already under migration. Furthermore, the host is evaluated for overloading and step continues untilthe host will become non-overloaded. It continues until all the hosts are processed.
4) Step-16–17: All the migrated VMs are optimally packed/placed on active physical machines according to the constraint119 OPT . After allocation of VMs flush the memory variable containing list of those VMs which are selected for
migration.5) Step-18–21: Hosts are detected for undertilized host. Minimum utilized host among all hosts is declared underutilized
host and all VMs from this host are migrated to pack over other active hosts.
3.4.2 Smallest Void Detection TechniqueThis technique is centered around the overloading detection mechanism that allow to consolidate VMs on hosts to improveCPU utilization of the hosts. Smallest Void Detection (SVD) technique aims at minimizing the gap between CPU utilizationthreshold and current utilization of CPU when former is greater than later one. We refer this gap as “Void” and it iscalculated by finding V oid = |Tu − C ′u|. C ′u is calculated as follows in (10).
C ′u =
∑ni=1 ||C
cpui,j ||
||hcpuj ||and Tu > Uc (10)
where Tu is CPU utilization threshold for a host, C ′u current CPU utilization for a host, ||Ccpui,j || is absolute value of Mips(i.e.) CPU allocated to the host, pcpuj is Mips owned by jth host.
Cu − Tu > 0 indicates that host is overloaded while Cu − Tu ≤ 0 marks a host as non-overloaded. To make a hostnon-overloaded we sort the vmList at very first place in descending order of CPU utilizations by the VMs as shown in(11). We propose following two criteria for VM migration if a host is found to be overloaded: (i) Migrate a VM from sortedvmList existing at 0th location until following occurs; (ii) If migrating next VM from sorted sequence makes host to benon-overloaded then identify a VM that causes smallest possible void between Tu and Cu as described in (11).
vmList ={∀α, β ∈ Vj
∣∣∣Ccpuu (α) ≥ Ccpuu (β)}
(11)
where α and β belongs to set of VMs Vj on overloaded host pi, VM cpuu (·) provides absolute value of CPU utilization of
corresponding VM. While selecting a VM for migration to bring down CPU utilization below utilization threshold, maycreate larger void between Cu and Tu and may generate unnecessary VM migrations, therefore, SVD selects such VMwhich creates smaller void between Cu and Tu as shown in Fig. 4(a) and Fig. 4(b).
v =
φ if hj 6∈ HOVM cpu
i=0,j if hj ∈ HO and Cu − ||Ccpui=0,j || ≥ Tu,V Mi=τ,j if hj ∈ HO and Cu − ||Ccpuτ,j || < Tu.
(12)
where,
τ = minz∈VM
f(z)
= min
{∀i ∈ VM
∣∣∣voidList[i], where 0 ≤ i ≤ |VM |}
Cite As: VERMA, J., KUMAR, S., KAIWARTYA, O., CAO, Y., LLORET, J., KATTI, C. P., KHAREL, R., 2018.
Enabling green computing in cloud environments: Network virtualization approach toward 5G support. Transactions on Emerging Telecommunications Technologies, pp. e3434.

ix
Algorithm 2: Smallest Void Detection HeuristicInput: Pm–Power Model, hostListOutput: migrationMap
1 begin2 Initialize Simulation Parameters3 for host in hostList do4 Tu ←− thresholdV alue(type)5 if hostUtilization > Tu then6 vmList← getMigratableV ms(host)7 vmList← sortByCpuAllocation(vmList)
/* Descending order */8 if hostUtilization− ||Ccpui=0,j || ≥ Tu then9 vmToMigrate← VMi=0,j
/* Migrates largest VM by CPU allocation when its migration does not causehost utilization to fall below Tu */
10 else if hostUtilization− ||Ccpui=0,j || < Tu then11 vmToMigrate← vmList.getIndex(Procedure smallestV oid(host))
/* Migrates a VM that creates smallest void between Tu and hostutilization, when migration of VM at 0th index of vmList cause utilizationfall below Tu */
12 else if hostUtilization < Tu then13 vmToMigrate← φ
/* No VM migraton due to empty set φ */
14 vmsToMigrate.add(vmToMigrate)
15 migrationMap.add(getNewVmPlacement(vmsToMigrate))16 vmsToMigrate.clear()
/* Nullify the variable vmsToMigrate after the loop */17 for host in hostList do18 if isHostMinimumUtilized then19 vmsToMigrate← host.getV mList() /* All of the VMs migrates */
20 vmsToMigrate.add(vmToMigrate)
21 migrationMap.add(getNewVmPlacement(vmsToMigrate))22 return migrationMap
Procedure smallestVoid(host)
1 smallestVoid(host) begin2 vmList← getMigratableV ms(host)3 voidLis[1 . . . |vmList|]4 for VM in vmList do5 if VM is in Migration then6 voidList[1 . . . |vmList|]← Double.MAX
/* Maximum value generated by Double wrapper class of Java */
7 else if hostUtlization− |VM | ≥ Tu then8 voidList[1 . . . |vmList|]← Double.MAX
/* Maximum value generated by Double wrapper class of Java */
9 else if hostUtlization− |VM | < Tu then10 voidList[1 . . . |vmList|]← Tu − ||VM cpu
i,j ||/* Size of V oid generated by migration of VMi,j */
11 index← findIndexOfSmallestV alue(voidList1 . . . |vmList|)12 return index
Cite As: VERMA, J., KUMAR, S., KAIWARTYA, O., CAO, Y., LLORET, J., KATTI, C. P., KHAREL, R., 2018.
Enabling green computing in cloud environments: Network virtualization approach toward 5G support. Transactions on Emerging Telecommunications Technologies, pp. e3434.

x
VM1 VM2 VM3
Cu,1
Cu,2
Cu,3
Tu
Cu
(a) Possible Voids on Host due to VM migration
VM1 VM2 VM3 VM4 VM5 VM6
Selected VM
(b) Largest VM Selection with smallest Void (i.e.Tu − VMi)
Fig. 4: Smallest Void Detection Based VM Migration
and,
voidList[i] =
Double.MAX if B(VMi,j) = 1,
Double.MAX if Cu − ||Ccpui,j || ≥ Tu,Tu − ||VM cpu
i,j || if Cu − ||Ccpui,j || < Tu.
where VM cpuu (·) indicates v is VM selected for migration,HO be the set of overloaded PMs, |VM | ∈ N, |VM | is cardinality
of set VM and N is a natural number, where ||Ccpui,j || is absolute value of CPU’s Mips allocated to the ith VM executing overjth PM, (Tu − ||Ccpui,j ||) is size of void, Double.MAX is the maximum value generated from Double primitive wrapper classof Java, B(VMi,j) = 1 indicates ith VM on jth host is in migration. Stepwise illustration of SVD (Algorithm 2) is givenbelow:
1) Step-1: Power model Pm and hostList is supplied.2) Step-2: Simulation parameters are initialized.3) Step-3–14: for loop detects overloaded hosts and VMs are arranged in descending order of CPU utilization rates.
VMs are set for migration from the overloaded hosts according to the criteria shown in (12). If migration of the VMavailable at 0th index of the list does not causes to fall utilization level of the host below the utilization threshold ofthe host then VM indexed at 0th location of the list will set for migration. Otherwise, a VM whose migration will leaveminimum void between utilization threshold of the host and utilization level of the host on removing that VM willset for migration. For this purpose an auxiliary list of void is created in the following manner and index of minimumcell value will be chosen to identify the index of VM to be migrated as summarized below and shown in Procedure“smallestVoid”:
a) If corresponding VM is under migration then set cell value as the maximum value provided by “Double” wrapperclass.
b) Subtracting CPU utilization rates of corresponding VM from current utilization level of host becomes value greaterthan equal to utilization threshold (will never occur) then set the cell value as the maximum value provided by“Double” wrapper class.
c) Otherwise set value of difference of current CPU utilization host and CPU utilization rates of corresponding VM.Furthermore, the host is evaluated for overloading and step continues until the host will become non-overloaded. Itcontinues until all the hosts are processed.
4) Step-15–16: All the migrated VMs are optimally packed/placed on active physical machines according to the constraint119 OPT . After allocation of VMs flush the memory variable containing list of those VMs which are selected for
migration.5) Step-17–21: Hosts are detected for undertilized host. Minimum utilized host among all hosts is declared underutilized
host and all VMs from this host are migrated to pack over other active hosts.
3.4.3 Maximum Fill TechniqueThis technique is also centered around host overloading detection criteria. We went one step ahead in this method toconsolidate VMs more tightly on hosts running beyond host utilization thresholds. Maximum Fill Technique (MFT) aimsupon migration of VMs from overloaded host in such a way that leads to packing of a host with high numbers of VMsto pack a host tightly while host is in active mode. Let us assume that a random host has n VMs executing over it thencurrent host utilization is ratio of sum of MIPS allocated to the VM that is
∑ni=1 C
cpui,j and total MIPS capacity of the host
hj . Let Vj be a set of VMs currently allocated to the host j, MFT finds a VM v that satisfies the condition given in (13) anddepicted in Fig. 5(a)–5(b).
vmList ={∀α, β ∈ Vj , Pj
∣∣∣Ccpuu (α) ≤ Ccpuu (β)}
(13)
where α and β are the VMs from VM pool available on jth overloaded host Pj , VM cpuu (·) is the CPU utilization. In the
sorted sequence of VM, MFT selects a suitable VM that either causes minimum increase in CPU allocation to the VM.
Cite As: VERMA, J., KUMAR, S., KAIWARTYA, O., CAO, Y., LLORET, J., KATTI, C. P., KHAREL, R., 2018.
Enabling green computing in cloud environments: Network virtualization approach toward 5G support. Transactions on Emerging Telecommunications Technologies, pp. e3434.

xi
Algorithm 3: Maximum Fill Technique HeuristicInput: Pm–Power Model, hostListOutput: MigrationMap
1 begin2 Initialize Simulation Parameters3 for host in hostList do4 Tu ←− thresholdV alue(type)5 if hostUtilization > Tu then6 vmList← getMigratableV ms(host)7 vmList← reverseSortByCpuAllocation(vmList)
/* Ascending order */8 nmax ← |vmList| − 19 if (Cu − Tu > VM) ∧ (n = nmax) then
10 vmToMigrate← VMi=n,j
/* If all the VMs on overloaded host are smaller in CPU allocation from(Cu − Tu) while Cu > Tu */
11 else if (Cu − Tu ≤ VM) ∧ (0 ≤ i < nmax) then12 vmToMigrate← VMi,j
/* If one or more VMs on overloaded host are large in CPU allocation from(Cu − Tu) while Cu > Tu */
13 else if (Cu − Tu ≤ VM) ∧ (i < nmax) then14 vmToMigrate← φ
/* No VM migraton due to empty set φ */
15 vmsToMigrate.add(vmToMigrate)
16 migrationMap.add(getNewVmPlacement(vmsToMigrate))17 vmsToMigrate.clear()
/* Nullify the variable vmsToMigrate after the loop */18 for host in hostList do19 if isHostMinimumUtilized then20 vmsToMigrate← host.getV mList() /* All of the VMs migrates */
21 vmsToMigrate.add(vmsToMigrate)
22 migrationMap.add(getNewVmPlacement(vmsToMigrate))23 return migrationMap
Cu,3
VM1 VM2 VM3
Cu,2
Cu,1
Tu
Cu
,
(a) Possible Voids on Host due to VM migra-tion
VM1 VM2 VM3 VM4 VM5 VM6
Selected VM
(b) Largest VM Selection with MFT criteria
Fig. 5: Maximum Fill Technique Based VM Migration
Cite As: VERMA, J., KUMAR, S., KAIWARTYA, O., CAO, Y., LLORET, J., KATTI, C. P., KHAREL, R., 2018.
Enabling green computing in cloud environments: Network virtualization approach toward 5G support. Transactions on Emerging Telecommunications Technologies, pp. e3434.
xii
Assuming V oid = (Tu − ||Ccpui,j ||), a host will run below its efficiency as much as large the void size. Meanwhile,migrating the largest possible VM in vmList from overloaded host may create a large size void. Moreover, SVD doesnot provide a suitable criteria to maximize the server utilization up to its capacity. A server is marked as overloaded ifCu > Tu holds true. To cope up with void size problem, we scan the vmList obtained from (13) and identifies a VM thatfulfill following condition as shown in (14) in consonance with (15).
Cu − Tu < VM cpuindex,j where 0 ≤ index ≤ nmax (14)
v =
∅ if Cu − Tu > Ccpui,j and i < nmaxVi=n,j if Cu − Tu > Ccpui,j and n = nmaxVMi,j if Cu − Tu ≤ Ccpui,j and 0 ≤ i < nmax
(15)
where nmax = (|VM | − 1) and |VM | is the maximum possible size of vmList on overloaded host, “v” is the VM selectedfor migration on applying MFT criteria on overloaded host. VMi,j represents a VM i executing over jth host. Cu,j iscurrent utilization of jth host and Tu,j utilization threshold of jth host. Stepwise illustration of MFT (Algorithm 3) is givenbelow:
1) Step-1: Power model Pm and hostList is supplied.2) Step-2: Simulation parameters are initialized.3) Step-3–15: for loop detects overloaded hosts and VMs are arranged in descending order of CPU utilization rates.
VMs are set for migration from the overloaded hosts according to the criteria shown in (15) and summarized as givenbelow:
a) No migration if CPU utilization rates of VM smaller than gap between current utilization (Cu) of host and utilizationthreshold (Tu) of index of VM is other than maximum index of vmList (nmax).
b) Migrate VM at highest (nmax) index of vmList CPU utilization rates of VM smaller than gap between currentutilization (Cu) of host and utilization threshold (Tu).
c) Migrate a largest VM at index other than (nmax) whose CPU utilization rates are greater than gap between currenthost utilization (Cu) and host utilization threshold (Tu).
Furthermore, the host is evaluated for overloading and step continues until the host will become non-overloaded. Itcontinues until all the hosts are processed.
4) Step-16–17: All the migrated VMs are optimally packed/placed on active physical machines according to the constraint119 OPT . After allocation of VMs flush the memory variable containing list of those VMs which are selected for
migration.5) Step-18–22: Hosts are detected for undertilized host. Minimum utilized host among all hosts is declared underutilized
host and all VMs from this host are migrated to pack over other active hosts.
4 PERFORMANCE EVALUATION
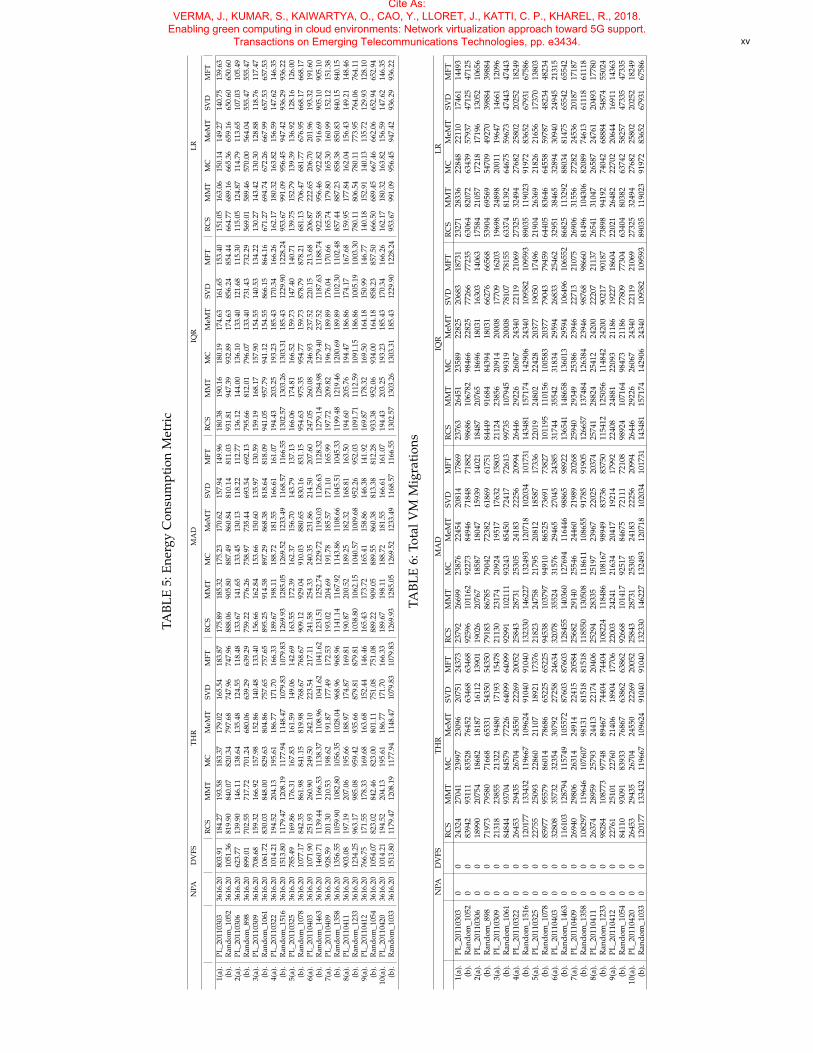
In this section, we conduct performance evaluation of the proposed heuristic models using simulations along withcomparative study of benchmark algorithms. The metrics like energy consumption, host shutdowns, total VM migrationsare considered for the expalantion.
4.1 Simulation SetupWe targeted IaaS deployment model of cloud computing for our experimentations. An IaaS deployment model of Cloudis supposed to create a view of infinite computing resources to the client side. It is tough to conduct experiments on largescale real infrastructure repetitively for the proposed heuristics. Therefore, we find simulations as the best alternative forperformance evaluation. CloudSim is chosen as a testbed for performing simulations on proposed heuristics [47]. It is a Javabased advanced simulator where all the requirements for realization of cloud computing environment are already present.For experimentation purpose, one has to make certain settings according to the necessity of the experiment. The simulationparameters taken into consideration for our experimentations are given in Table 2. The underlying hardware architectureused for experimental analysis is as follows: Intel(R) Core(TM) i7-3770 CPU @3.40 GHz (8 MB SmartCache) with 4 coreshaving the capability to issue 8 hyper threads, 10 GB RAM DDR3 1330 with systems architecture of 64 bits, 1 TeraBytesecondary storage and Windows 10 Pro N operating system. We have considered simulation architecture as shown inFig. 6 with assembly of overloaded, normal loaded and underloaded hosts as container of virtual servers/machines thatare made available for execution of impending jobs arriving from dynamic workload traces.
We have simulated a data center with 1200 heterogeneous physical machines among which 600 of them are HP ProLiantML110 G4 servers, and rest of the 600 are HP ProLiant ML110 G5 servers. The characteristics of the servers and data ontheir power consumption are given in Table 1. We take Amazon EC2 instance type [48] VMs having characteristics asshown in Table 3. The VMs simulated are of single core type due to the reason that workload data taken from traces comesfrom single core physical machines. At the initial stage, the VMs are allocated according to the resource requirements as
Cite As: VERMA, J., KUMAR, S., KAIWARTYA, O., CAO, Y., LLORET, J., KATTI, C. P., KHAREL, R., 2018.
Enabling green computing in cloud environments: Network virtualization approach toward 5G support. Transactions on Emerging Telecommunications Technologies, pp. e3434.

xiii
TABLE 2: Simulation Parameters
Values/Type
Parameters NPA THR MAD IQR LR
1. Total Hosts 1200 1200 1200 1200 12002. Safety Parameter None None 1.5 2.5 1.23. Threshold None 0.8 1− s×MAD 1− s× IQR 1− s× LR
4. PE/Cloudlet 1 1 1 1 15. Scheduling Interval 300 300 300 300 3006. Simulation Limit 24 Hours 24 ours 24 Hours 24 Hours 24 Hours
7. PlanetLab Workload 03/03/2011 03/03/2011 03/03/2011 03/03/2011 03/03/2011
Realtraces ofPlanetLabserverworkloadby Dates
06/03/2011 06/03/2011 06/03/2011 06/03/2011 06/03/201109/03/2011 09/03/2011 09/03/2011 09/03/2011 09/03/201122/03/2011 22/03/2011 22/03/2011 22/03/2011 22/03/201125/03/2011 25/03/2011 25/03/2011 25/03/2011 25/03/201103/04/2011 03/04/2011 03/04/2011 03/04/2011 03/04/201109/04/2011 09/04/2011 09/04/2011 09/04/2011 09/04/201111/04/2011 11/04/2011 11/04/2011 11/04/2011 11/04/201112/04/2011 12/04/2011 12/04/2011 12/04/2011 12/04/201120/04/2011 20/04/2011 20/04/2011 20/04/2011 20/04/2011
8. Random Workload 1052 1052 1052 1052 1052
Total VMsSimulatedforsyntheticworkload
898 898 898 898 8981061 1061 1061 1061 10611516 1516 1516 1516 15161078 1078 1078 1078 10781463 1463 1463 1463 14631358 1358 1358 1358 13581233 1233 1233 1233 12331054 1054 1054 1054 10541033 1033 1033 1033 1033
Virtual
Machine/
Server
Virtual
Machine/
Server
Virtual
Machine/
Server
Virtual
Machine/
Server
Virtual
Machine/
Server
Virtual
Machine/
Server
Virtual
Machine/
Server
Overloaded Host Normal Loaded Host Underloaded Host
Physical Server Physical Server Physical Server
Impending
Jobs
VM Migration VM Migration
Fig. 6: Simulation Architecture
TABLE 3: Characteristics of Amazon EC2 VM instances
ResourceTypes
High-CPUMedium Instance
(t1.medium)
Extra LargeInstance
(t1.xlarge)
SmallInstance
(t1.small)
MicroInstance
(t1.micro)
MIPS 2500 2000 1000 500RAM 0.85 GB 3.75 GB 1.7 GB 613 MB
Cite As: VERMA, J., KUMAR, S., KAIWARTYA, O., CAO, Y., LLORET, J., KATTI, C. P., KHAREL, R., 2018.
Enabling green computing in cloud environments: Network virtualization approach toward 5G support. Transactions on Emerging Telecommunications Technologies, pp. e3434.

xiv
per the VM types. However, VMs suffer from resources underutilization during the simulations according to workloadprovisioning and create opportunities for dynamic consolidation.
To evaluate the proposed methods we adopted simulation based validation that rely upon real workload traces fromreal systems that are available publicly. We used data provided from CoMon project for monitoring infrastructure ofPlanetLab servers [20] that was included in CloudSim simulation toolkit for 10 random days (during March and April2011). The workload traces contains data on CPU utilizations with interval of measurement of 5 minutes from more than athousand VMs hosted on more than 1000 server located at 645 places of the world [13]. The workload traces collected arerepresentative of IaaS type clouds similar to Amazon EC2 where independent users create and manage VMs of single-core.As the utilization value of some VMs in the data set is so low, we filter the original data and only consider the range ofCPU and memory utilization between 5% to 90%. So we can evaluate the proposed VM consolidation by considering bothCPU and memory intensive tasks. Apart from this, we utilize synthetic workload data (provided by CloudSim class) to testout the performance of proposed algorithms with dynamic and non-stationary random workloads. The random workloadgenerates cloudlets as a small task that takes simulation time as a seed value. In Table 4, P-i’s are PlanetLab workloadtraces and R-i’s are synthetic random workload traces coming out of the similar number of VMs as in PlanetLab traces.
TABLE 4: PlanetLab Workload Data Traces
PlanetLabWorkloadInstance
Date Number of VMs Mean St. Dev. Quartile 1 (%) Median (%) Quartile 3 (%) RandomWorkloadInstance
PL-1 03/03/2011 1052 12.31 17.09 2 6 15 R-1PL-2 06/03/2011 898 11.44 16.83 2 5 13 R-2PL-3 09/03/2011 1061 10.70 15.57 2 4 13 R-3PL-4 22/03/2011 1516 9.26 12.78 2 5 12 R-4PL-5 25/03/2011 1078 10.56 14.14 2 6 14 R-5PL-6 03/04/2011 1463 12.39 16.55 2 6 17 R-6PL-7 09/04/2011 1358 11.12 15.09 2 6 15 R-7PL-8 11/04/2011 1233 11.56 15.07 2 6 16 R-8PL-9 12/04/2011 1054 11.54 15.15 2 6 16 R-9PL-10 20/04/2011 1033 10.43 15.21 2 4 12 R-10
4.2 Baseline MethodsWe discuss the utility of employing a utilization prediction model by comparing proposed heuristics with baselineheuristics proposed in [33] and [15]. Two types of methods are used for comparative evaluation of proposed models: (i) Hostoverloading detection methods, and (ii) Host offloading methods. Host overloading methods consider two approaches,namely static thresholds (THR) and dynamic thresholds. The first one assumes static values of host utilization thresholdswhile later one calculate dynamic host utilization threshold values on runtime. Dynamic methods like Median AbsoluteDeviation (MAD), Interquartile Range (IQR) and Local Regression (LR) for host overloading detection thresholds [15] thatare shown in general equation (16).
Tu =
{1− s ·X if X ∈ {IQR,MAD,LR}THR, otherwise.
(16)
Host offloading methods consider three benchmark methods namely, (i) Random Selection (RCS) policy that selectsa VM for migration according to uniformly distributed discrete random variable X d
= U((0, |Vj |)), whose values indexa set of VMs Vj allocated to a host j. (ii) Minimum Migration Time (MMT) policy that selects a VM v for migrationthat takes minimum time to migrate a VM allocated the overloaded host. The migration time is calculated as the ratio ofamount of RAM utilized by the VM to the spare network bandwidth available for the host j as formalized as RAMu(v)
NETj,
and (iii) Maximum Correlation (MC) selects a VM for migration from overloaded host having highest multiple correlationcoefficient that is squared coefficient of correlation between observed value y and predicted value y for the randomvariable Y on CPU utilization by that VM [15] [49] [50]. On considering n VMs to be hosted by the physical host, themultiple correlation coefficient is calculated as shown in (17).
R2Y,X1,X2,··· ,Xn−1
=
∑ni=1(yi − µY )2(yi − µY )2∑n
i=1(yi − µY )2∑ni=1(yi − µY )2
(17)
where X1, X2, · · ·X(n−1) are the random variable on CPU utilizations by those (n−1) VMs that are not eligible to migratein accordance to the MC policy, yi and y are observed and predicted values of dependent variable Y , µY and µY are thesample means of Y and Y , respectively.
Cite As: VERMA, J., KUMAR, S., KAIWARTYA, O., CAO, Y., LLORET, J., KATTI, C. P., KHAREL, R., 2018.
Enabling green computing in cloud environments: Network virtualization approach toward 5G support. Transactions on Emerging Telecommunications Technologies, pp. e3434.
xv
TABL
E5:
Ener
gyC
onsu
mpt
ion
Met
ric
NP A
DV
FSTH
RM
AD
IQR
LR
RC
SM
MT
MC
MeM
TSV
DM
FTR
CS
MM
TM
CM
eMT
SVD
MFT
RC
SM
MT
MC
MeM
TSV
DM
FTR
CS
MM
TM
CM
eMT
SVD
MFT
1(a)
.PL
2011
0303
3616
.20
803.
9118
4.27
193.
5818
3.37
179.
0216
5.54
183.
8717
5.89
185.
3217
5.23
170.
6215
7.94
149.
9618
0.38
190.
1618
0.19
174.
6316
1.65
153.
4015
1.05
163.
0615
0.14
149.
2714
0.75
139.
63(b
).R
ando
m10
5236
16.2
010
51.3
681
9.90
840.
0782
0.34
797.
6874
7.96
747.
9688
8.06
905.
8088
7.49
860.
8481
0.14
811.
0393
1.81
947.
3993
2.89
174.
6385
6.24
854.
4466
4.77
689.
1666
5.36
659.
1665
0.60
650.
602(
a).
PL20
1103
0636
16.2
062
3.77
139.
9014
6.11
138.
6413
5.48
124.
5511
8.48
133.
6714
1.65
133.
4513
0.13
118.
2211
2.77
136.
1214
4.00
136.
1013
3.40
121.
6811
5.30
115.
0512
4.87
114.
7911
3.65
107.
0310
5.49
(b).
Ran
dom
898
3616
.20
899.
0170
2.55
717.
7270
1.24
680.
0663
9.29
639.
2975
9.22
776.
2675
8.97
735.
4469
3.54
692.
1379
5.66
812.
0179
6.07
133.
4073
1.43
732.
2956
9.01
589.
4657
0.00
564.
0455
5.47
555.
473(
a).
PL20
1103
0936
16.2
070
8.68
159.
3216
6.92
157.
9815
2.86
140.
4813
3.40
156.
6616
2.84
153.
6615
0.60
135.
9713
0.59
159.
1916
8.17
157.
9015
4.55
140.
5313
4.22
130.
2714
3.42
130.
3012
8.88
118.
7611
7.47
(b).
Ran
dom
1061
3616
.20
1061
.72
830.
0384
8.00
829.
6380
4.86
757.
6575
7.65
895.
2591
4.58
897.
2986
8.38
818.
6481
8.09
941.
0595
7.79
941.
1215
4.55
866.
1586
4.16
671.
2769
4.74
672.
2666
7.99
657.
5365
7.53
4(a)
.PL
2011
0322
3616
.20
1014
.21
194.
5220
4.13
195.
6118
6.77
171.
7016
6.33
189.
6719
8.11
188.
7218
1.55
166.
6116
1.07
194.
4320
3.25
193.
2318
5.43
170.
3416
6.26
162.
1718
0.32
163.
8215
6.59
147.
6214
6.35
(b).
Ran
dom
1516
3616
.20
1513
.80
1179
.47
1208
.19
1177
.94
1148
.47
1079
.83
1079
.83
1269
.93
1285
.05
1269
.52
1233
.49
1168
.57
1166
.55
1302
.57
1303
.26
1303
.31
185.
4312
29.9
012
28.2
495
3.67
991.
0995
6.45
947.
4293
6.29
936.
225(
a).
PL20
1103
2536
16.2
078
5.49
169.
8617
6.31
167.
8316
1.59
149.
0614
2.69
163.
5517
2.39
162.
3715
6.70
143.
7913
7.13
166.
0617
4.81
166.
5215
9.73
147.
4014
0.71
139.
7515
2.79
139.
3913
6.92
128.
1612
6.00
(b).
Ran
dom
1078
3616
.20
1077
.17
842.
3586
1.98
841.
1581
9.98
768.
6776
8.67
909.
1292
9.04
910.
0388
0.65
830.
1683
1.15
954.
6397
5.35
954.
7715
9.73
878.
7987
8.21
681.
1370
6.47
681.
7767
6.95
668.
1766
8.17
6(a)
.PL
2011
0403
3616
.20
1071
.90
251.
9326
0.90
249.
5024
2.10
223.
5421
7.11
241.
5825
4.33
240.
3523
1.86
214.
5020
7.60
247.
0526
0.08
246.
9323
7.52
220.
1521
3.68
206.
8722
2.65
206.
7020
1.96
193.
3219
1.60
(b).
Ran
dom
1463
3616
.20
1460
.71
1139
.44
1166
.53
1138
.37
1108
.96
1041
.62
1041
.62
1231
.51
1252
.74
1229
.72
1193
.03
1126
.63
1128
.32
1279
.14
1284
.98
1279
.40
237.
5211
87.6
311
88.7
492
2.58
956.
4692
2.82
916.
6990
5.10
905.
107(
a).
PL20
1104
0936
16.2
092
8.59
201.
3021
0.53
198.
6219
1.87
177.
4917
2.53
193.
0220
4.69
191.
7818
5.57
171.
1016
5.99
197.
7220
9.82
196.
2718
9.89
176.
0417
0.66
165.
7417
9.80
165.
3016
0.99
152.
1215
1.38
(b).
Ran
dom
1358
3616
.20
1356
.55
1059
.90
1082
.80
1056
.35
1028
.04
968.
9696
8.96
1141
.14
1167
.92
1143
.86
1108
.66
1045
.51
1045
.33
1199
.48
1219
.46
1200
.69
189.
8911
02.3
011
02.4
885
7.44
887.
2385
8.38
850.
8384
0.15
840.
158(
a).
PL20
1104
1136
16.2
090
3.08
197.
1920
7.06
195.
6618
8.97
174.
8716
9.81
190.
8720
0.52
189.
2518
2.32
168.
8116
3.50
194.
6020
5.76
194.
4718
6.86
174.
1716
7.68
159.
9517
7.84
162.
0415
6.43
149.
2114
8.46
(b).
Ran
dom
1233
3616
.20
1234
.25
963.
1798
5.08
959.
4293
5.66
879.
8187
9.81
1038
.80
1062
.15
1040
.57
1009
.68
952.
2695
2.03
1091
.71
1112
.59
1091
.15
186.
8610
05.1
910
03.3
078
0.11
806.
5478
0.11
773.
9576
4.06
764.
119(
a).
PL20
1104
1236
16.2
076
6.75
171.
5517
8.33
169.
6816
3.68
152.
4414
6.46
165.
4317
3.72
165.
4115
8.86
146.
3814
1.92
169.
8717
8.32
169.
5016
4.18
150.
9914
6.77
140.
1815
2.91
140.
1313
5.72
129.
9312
8.10
(b).
Ran
dom
1054
3616
.20
1054
.07
823.
0284
2.46
823.
0080
1.11
751.
0875
1.08
889.
2290
9.05
889.
5586
0.38
813.
3881
2.28
933.
3895
2.06
934.
0016
4.18
858.
2385
7.50
666.
5068
9.45
667.
4666
2.06
652.
9465
2.94
10(a
).PL
2011
0420
3616
.20
1014
.21
194.
5220
4.13
195.
6118
6.77
171.
7016
6.33
189.
6719
8.11
188.
7218
1.55
166.
6116
1.07
194.
4320
3.25
193.
2318
5.43
170.
3416
6.26
162.
1718
0.32
163.
8215
6.59
147.
6214
6.35
(b).
Ran
dom
1033
3616
.20
1513
.80
1179
.47
1208
.19
1177
.94
1148
.47
1079
.83
1079
.83
1269
.93
1285
.05
1269
.52
1233
.49
1168
.57
1166
.55
1302
.57
1303
.26
1303
.31
185.
4312
29.9
012
28.2
495
3.67
991.
0995
6.45
947.
4293
6.29
936.
22
TABL
E6:
Tota
lVM
Mig
rati
ons
NPA
DV
FSTH
RM
AD
IQR
LRR
CS
MM
TM
CM
eMT
SVD
MFT
RC
SM
MT
MC
MeM
TSV
DM
FTR
CS
MM
TM
CM
eMT
SVD
MFT
RC
SM
MT
MC
MeM
TSV
DM
FT1(
a).
PL20
1103
030
024
324
2704
123
997
2309
620
751
2437
323
792
2669
923
876
2245
420
814
1786
923
763
2645
123
589
2282
520
683
1873
123
271
2833
622
848
2211
017
461
1449
3(b
).R
ando
m10
520
083
942
9311
183
528
7645
263
468
6346
892
596
1011
6292
273
8494
671
848
7188
298
686
1067
8298
466
2282
577
266
7723
563
064
8207
263
439
5793
747
125
4712
52(
a).
PL20
1103
060
018
990
2075
418
682
1818
716
112
1390
119
026
2076
718
587
1804
715
939
1402
118
487
2076
518
696
1803
116
303
1406
317
584
2105
717
218
1719
613
052
1065
6(b
).R
ando
m89
80
071
973
7958
071
668
6533
154
350
5435
079
183
8678
579
042
7238
261
869
6175
184
449
9168
484
394
1803
166
276
6656
853
904
6956
954
709
4927
039
884
3988
43(
a).
PL20
1103
090
021
318
2385
521
322
1948
017
193
1547
821
130
2317
420
924
1951
717
632
1580
321
124
2385
620
914
2000
817
709
1620
319
698
2489
820
011
1964
714
661
1209
6(b
).R
ando
m10
610
084
844
9370
484
579
7722
664
099
6409
992
991
1021
1193
243
8545
072
417
7261
399
735
1079
4599
319
2000
878
107
7815
563
374
8139
264
675
5967
347
443
4744
34(
a).
PL20
1103
220
026
453
2943
526
704
2455
022
269
2005
225
843
2873
125
305
2418
322
256
2099
426
446
2922
626
067
2434
022
119
2106
927
325
3249
427
682
2580
220
252
1824
9(b
).R
ando
m15
160
012
0177
1334
3211
9667
1096
2491
040
9104
013
2330
1462
2713
2493
1207
1810
2034
1017
3114
3481
1571
7414
2906
2434
010
9582
1095
9389
035
1190
2391
972
8365
267
931
6758
65(
a).
PL20
1103
250
022
755
2509
322
860
2110
718
921
1737
621
823
2475
821
795
2081
218
587
1733
622
019
2480
222
428
2037
719
050
1749
621
904
2636
921
826
2165
617
370
1380
3(b
).R
ando
m10
780
085
977
9557
986
014
7868
665
225
6522
594
538
1037
9794
910
8652
573
691
7382
710
1195
1101
5610
0583
2037
779
043
7945
964
405
8364
664
558
5978
748
234
4823
46(
a).
PL20
1104
030
032
808
3573
232
354
3079
227
258
2463
432
078
3552
431
576
2946
527
045
2438
531
744
3554
231
834
2959
426
833
2546
232
951
3846
532
894
3094
024
945
2131
5(b
).R
ando
m14
630
011
6103
1287
9411
5749
1055
7287
603
8760
312
8455
1403
6012
7694
1164
4698
865
9892
213
6541
1486
5813
6013
2959
410
6496
1065
5286
825
1132
9288
034
8147
565
542
6554
27(
a).
PL20
1104
090
026
940
2980
626
314
2491
422
415
2058
425
682
2914
025
546
2446
021
989
2026
825
940
2934
925
386
2394
622
713
2107
526
906
3155
627
282
2453
620
187
1718
7(b
).R
ando
m13
580
010
8297
1196
4610
7607
9813
181
518
8151
811
8550
1305
0811
8611
1086
5591
785
9190
512
6657
1374
8412
6384
2394
698
768
9866
081
496
1043
0682
089
7461
361
118
6111
88(
a).
PL20
1104
110
026
374
2895
925
793
2441
322
174
2040
625
294
2833
525
197
2396
722
025
2037
425
741
2882
425
412
2420
022
207
2113
726
541
3104
726
587
2476
120
493
1778
0(b
).R
ando
m12
330
098
284
1087
7397
748
8946
774
404
7440
410
8224
1184
8610
8167
9894
983
736
8375
011
5412
1250
5611
4842
2420
090
217
9018
773
898
9419
274
042
6888
454
874
5502
49(
a).
PL20
1104
120
022
761
2510
122
760
2140
618
904
1770
622
003
2424
121
634
2041
719
214
1799
222
408
2488
122
093
2118
619
227
1860
422
021
2648
222
702
2064
416
911
1436
3(b
).R
ando
m10
540
084
110
9309
183
933
7686
763
862
6386
292
668
1014
1792
517
8467
572
111
7210
898
924
1071
6498
473
2118
677
809
7730
463
404
8038
263
742
5825
747
335
4733
510
(a).
PL20
1104
200
026
453
2943
526
704
2455
022
269
2005
225
843
2873
125
305
2418
322
256
2099
426
446
2922
626
067
2434
022
119
2106
927
325
3249
427
682
2580
220
252
1824
9(b
).R
ando
m10
330
012
0177
1334
3211
9667
1096
2491
040
9104
013
2330
1462
2713
2493
1207
1810
2034
1017
3114
3481
1571
7414
2906
2434
010
9582
1095
9389
035
1190
2391
972
8365
267
931
6758
6
Cite As: VERMA, J., KUMAR, S., KAIWARTYA, O., CAO, Y., LLORET, J., KATTI, C. P., KHAREL, R., 2018.
Enabling green computing in cloud environments: Network virtualization approach toward 5G support. Transactions on Emerging Telecommunications Technologies, pp. e3434.

xvi
4.3 Performance Evaluation MetricsThe main goals of the proposed work includes: (i) to reduce the energy consumption by servers deployed in clouddata center; (ii) to minimize the excessive number of shutdowns of physical servers (cycle of host deactivation andreactivation); and (iii) to minimize the VM migrations. We evaluate the performance of the proposed models considerfollowing performance metrics.• Energy Consumption: Energy consumption of a physical machine has two components, namely, (i) Static component
(Esleep = Psleept + Etransition) when hosts is in sleep/standby mode that includes the period he transition periodwhen the host moves from sleep state to wake-up mode, and (ii) Dynamic component (Enosleep = P0t + (cV 2f)t)when host is in active mode that includes the period when the host is either performing computation or host is in idlemode. Meanwhile, energy consumption is also written as a function of host utilization as shown in (18).
E(t) =
∫ T
t=0P (u(t))dt (18)
Esleep and Psleep are the energy and power consumption when host is in sleep mode, Enosleep and Pnosleep are energyand power consumption when host is in active mode, Etransition is the energy consumption when host trigger fromsleep state to idle/active state, P0 is idle power consumption, c is constant, V is the voltage and f is CPU frequency,and t is time.
• Total Host Shutdowns: Excessive host shutdowns (frequent cycle of host deactivation and reactivation) causes extrapenalty for invoking the servers back due to sudden upsurge in demand and leads to non-fulfillment of SLAs dueto delay in fulfilling resource demanded by application services. The proposed approaches turn off the hosts that arefound to be underutilized or ideal to cut down the energy consumption. However, excessive shutdowns cause extraefforts and delay to revoke them when need arises.
• VM Migration: Live migration of VMs is a costly operation that causes involvement of (i) some amount of CPUprocessing in the part of source server, (ii) the usage of bandwidth link between the source and destination servers,(iii) the downtime of the application services executing over migrating VM and (iv) total migration time of the VM[51]. In addition, VM migration consumes negligible energy that is considered for measuring SLA violations as 10% ofCPU utilization during all VM migrations in the servers.
• SLA Violations: SLA violations (SLAV) metric was proposed in [15] to measure the SLAs delivered to VMs in IaaSclouds. SLAV is a composite metric that capture the SLA violations due to over utilization (SLAVO) and SLA violationdue the VM migrations (SLAVM) together. Measurement of SLAV, SLAVO, and SLAVM are performed using equationsshown in (19), (20) and (21).
SLAV = SLAV O × SLAVM (19)
SLAV O = αTvTa
=1
M
M∑i=1
TsiTai
(20)
SLAVM = βCvCa
=1
N
N∑j=1
CdjCrj
(21)
where α and β are the scaling constant, M is the total number of physical hosts, N is the total number of VMs, Taiis the total time during which host i experienced CPU utilizations 100% leading to SLA violations. Tai is the totaltime during which host i remained active, Cdj is estimate of performance degradation for VM j and Cr,j is total CPUcapacity requested by VM j during VMs lifetime.
• ESV: It is a composite metric ESV (t) proposed in [33] that attempts to capture the effect of energy consumption andSLAV at once as shown in (22).
ESV = E(t)× SLAV (22)
4.4 Analysis of ResultsWe evaluate proposed methods on considered simulation framework considering ten workload traces of PlanetLab Serversand ten synthetic random workload traces. We get the results of Energy consumption metric and Total VM migrationsmetric as shown in Table 5 and Table 6. Similarly, we have collected the results of rest of the performance metrics and plotthe results of performance metrics in Fig. 7–13.
On simulating benchmark algorithms and proposed heuristic algorithms, we have found that proposed approachesoutperforms over the benchmark methods on energy consumption metric for both of the workload traces as indicated inresults of Table 5 and Fig. 7(a)–7(b). The efficiency of the algorithm is attributed to efficient packing of VMs on servers thatutilize the server resources for long span of time and improve resource utilizations which do not generates unnecessaryVM migrations.
Cite As: VERMA, J., KUMAR, S., KAIWARTYA, O., CAO, Y., LLORET, J., KATTI, C. P., KHAREL, R., 2018.
Enabling green computing in cloud environments: Network virtualization approach toward 5G support. Transactions on Emerging Telecommunications Technologies, pp. e3434.

xvii
ThrRcs
-0.8
ThrM
mt-0
.8
ThrM
c-0.
8
ThrM
eMt-0
.8
ThrSvd
-0.8
ThrM
ft-0.
8
Mad
Rcs-2
.5
Mad
Mm
t-2.5
Mad
Mc-
2.5
Mad
MeM
t-2.5
Mad
Svd-2
.5
Mad
Mft-
2.5
IqrR
cs-1
.5
IqrM
mt-1
.5
IqrM
c-1.
5
IqrM
eMt-1
.5
IqrS
vd-1
.5
IqrM
ft-1.
5
LrRcs
-1.2
LrM
mt-1
.2
LrM
c-1.
2
LrM
eMt-1
.2
LrSvd
-1.2
LrM
ft-1.
2100
120
140
160
180
200
220
240
260E
nerg
y C
onsu
mpt
ion
(kW
h)
Box Plot for Energy Consumption Metric
(a) PlanetLab Workload
ThrRcs
-0.8
ThrM
mt-0
.8
ThrM
c-0.
8
ThrM
eMt-0
.8
ThrSvd
-0.8
ThrM
ft-0.
8
Mad
Rcs-2
.5
Mad
Mm
t-2.5
Mad
Mc-
2.5
Mad
MeM
t-2.5
Mad
Svd-2
.5
Mad
Mft-
2.5
IqrR
cs-1
.5
IqrM
mt-1
.5
IqrM
c-1.
5
IqrM
eMt-1
.5
IqrS
vd-1
.5
IqrM
ft-1.
5
LrRcs
-1.2
LrM
mt-1
.2
LrM
c-1.
2
LrM
eMt-1
.2
LrSvd
-1.2
LrM
ft-1.
2
200
400
600
800
1000
1200
Ene
rgy
Con
sum
ptio
n (k
Wh)
Box Plot for Energy Consumption Metric
(b) Random Workload
Fig. 7: Energy consumption metric on workload traces of Planetlab servers and random synthetic workload
ThrRcs
-0.8
ThrM
mt-0
.8
ThrM
c-0.
8
ThrM
eMt-0
.8
ThrSvd
-0.8
ThrM
ft-0.
8
Mad
Rcs-2
.5
Mad
Mm
t-2.5
Mad
Mc-
2.5
Mad
MeM
t-2.5
Mad
Svd-2
.5
Mad
Mft-
2.5
IqrR
cs-1
.5
IqrM
mt-1
.5
IqrM
c-1.
5
IqrM
eMt-1
.5
IqrS
vd-1
.5
IqrM
ft-1.
5
LrRcs
-1.2
LrM
mt-1
.2
LrM
c-1.
2
LrM
eMt-1
.2
LrSvd
-1.2
LrM
ft-1.
2
1
1.5
2
2.5
3
3.5
Tot
al V
M M
igra
tions
×104 Box Plot for Total VM Migrations
(a) PlanetLab Workload
ThrRcs
-0.8
ThrM
mt-0
.8
ThrM
c-0.
8
ThrM
eMt-0
.8
ThrSvd
-0.8
ThrM
ft-0.
8
Mad
Rcs-2
.5
Mad
Mm
t-2.5
Mad
Mc-
2.5
Mad
MeM
t-2.5
Mad
Svd-2
.5
Mad
Mft-
2.5
IqrR
cs-1
.5
IqrM
mt-1
.5
IqrM
c-1.
5
IqrM
eMt-1
.5
IqrS
vd-1
.5
IqrM
ft-1.
5
LrRcs
-1.2
LrM
mt-1
.2
LrM
c-1.
2
LrM
eMt-1
.2
LrSvd
-1.2
LrM
ft-1.
2
2
4
6
8
10
12
14
16
Tot
al V
M M
igra
tions
×104 Box Plot for Total VM Migrations
(b) Random Workload
Fig. 8: Total VM migrations metric on workload traces of Planetlab servers and random synthetic workload
Total VM migrations is an important parameter for real environment of cloud computing technology which involves ahuge bandwidth cost for live migrations of VMs. Results of Table 6 and Fig. 8(a)–8(b) show that proposed algorithms reportlow VM migrations in comparison to benchmark algorithms on both of the PlantLab and random workloads. However,MeMT reports lowest VM migration rate with IQR threshold on employing random workload. Meanwhile, MeMT withcombination of IQR performs extraordinarily over all possible combinations on employing random traces of syntheticworkload due to detection of hotspots (overloaded hosts) easily. For rest of the cases, MFT model with LR overloadingdetection method reports lowest value of total VM migration metric. The success of the proposed models is attributed tocontrolled VM migration through VM selection methods with identified safety parameter for the overloading detectionmethod.
Results of Fig. 9(a)–9(b) show that the proposed models are not only able to reduce the energy consumption and totalVM migrations but also reduce the total host shutdowns. The reason of lower host shutdowns is attributed to efficientpacking of VMs on fewer hosts that do not violate the utilization thresholds of the servers and may not require further VMmigration until the applications hosted in VMs finish their jobs. MeMT reports lowest host shutdowns along with lowestenergy consumption due to ability of spotting of hotspots associated with MeMT as shown in Fig. 9(a)–9(b). Similarly,we collected the results on SLA violations, SLAVO, SLAVM and ESV metric whose results are plotted in Fig. 10(a)–10(b),Fig 11(a)–11(b), Fig. 12(a)–12(b), and Fig. 13(a)–13(b). The proposed methods, namely, MeMT, SVD and MFT yields bestresults with combinations of static and dynamic thresholds in terms of energy consumption, total host shutdowns and thetotal VM migrations due to efficient VM packing under the constraint of 11
9 OPT + 1 VMs over a host [28] in comparison
Cite As: VERMA, J., KUMAR, S., KAIWARTYA, O., CAO, Y., LLORET, J., KATTI, C. P., KHAREL, R., 2018.
Enabling green computing in cloud environments: Network virtualization approach toward 5G support. Transactions on Emerging Telecommunications Technologies, pp. e3434.

xviii
ThrRcs
-0.8
ThrM
mt-0
.8
ThrM
c-0.
8
ThrM
eMt-0
.8
ThrSvd
-0.8
ThrM
ft-0.
8
Mad
Rcs-2
.5
Mad
Mm
t-2.5
Mad
Mc-
2.5
Mad
MeM
t-2.5
Mad
Svd-2
.5
Mad
Mft-
2.5
IqrR
cs-1
.5
IqrM
mt-1
.5
IqrM
c-1.
5
IqrM
eMt-1
.5
IqrS
vd-1
.5
IqrM
ft-1.
5
LrRcs
-1.2
LrM
mt-1
.2
LrM
c-1.
2
LrM
eMt-1
.2
LrSvd
-1.2
LrM
ft-1.
2
3000
3500
4000
4500
5000
5500
6000
6500
7000
7500
8000T
otal
Hos
t Shu
tdow
nsBox Plot for Total Host Shutdowns
(a) PlanetLab Workload
ThrRcs
-0.8
ThrM
mt-0
.8
ThrM
c-0.
8
ThrM
eMt-0
.8
ThrSvd
-0.8
ThrM
ft-0.
8
Mad
Rcs-2
.5
Mad
Mm
t-2.5
Mad
Mc-
2.5
Mad
MeM
t-2.5
Mad
Svd-2
.5
Mad
Mft-
2.5
IqrR
cs-1
.5
IqrM
mt-1
.5
IqrM
c-1.
5
IqrM
eMt-1
.5
IqrS
vd-1
.5
IqrM
ft-1.
5
LrRcs
-1.2
LrM
mt-1
.2
LrM
c-1.
2
LrM
eMt-1
.2
LrSvd
-1.2
LrM
ft-1.
2
0.5
1
1.5
2
2.5
3
3.5
4
Tot
al H
ost S
hutd
owns
×104 Box Plot for Total Host Shutdowns
(b) Random Workload
Fig. 9: Total host shutdowns metric on workload traces of Planetlab servers and random synthetic workload
to existing VM selection models viz. RCS, MMT and MC due to associated server runtime with relatively high workloaddue to inefficient packing.
ThrRcs
-0.8
ThrM
mt-0
.8
ThrM
c-0.
8
ThrM
eMt-0
.8
ThrSvd
-0.8
ThrM
ft-0.
8
Mad
Rcs-2
.5
Mad
Mm
t-2.5
Mad
Mc-
2.5
Mad
MeM
t-2.5
Mad
Svd-2
.5
Mad
Mft-
2.5
IqrR
cs-1
.5
IqrM
mt-1
.5
IqrM
c-1.
5
IqrM
eMt-1
.5
IqrS
vd-1
.5
IqrM
ft-1.
5
LrRcs
-1.2
LrM
mt-1
.2
LrM
c-1.
2
LrM
eMt-1
.2
LrSvd
-1.2
LrM
ft-1.
2
0.3
0.4
0.5
0.6
0.7
0.8
0.9
1
1.1
SLA
V
Box Plot for SLAV Metric
(a) PlanetLab Workload
ThrRcs
-0.8
ThrM
mt-0
.8
ThrM
c-0.
8
ThrM
eMt-0
.8
ThrSvd
-0.8
ThrM
ft-0.
8
Mad
Rcs-2
.5
Mad
Mm
t-2.5
Mad
Mc-
2.5
Mad
MeM
t-2.5
Mad
Svd-2
.5
Mad
Mft-
2.5
IqrR
cs-1
.5
IqrM
mt-1
.5
IqrM
c-1.
5
IqrM
eMt-1
.5
IqrS
vd-1
.5
IqrM
ft-1.
5
LrRcs
-1.2
LrM
mt-1
.2
LrM
c-1.
2
LrM
eMt-1
.2
LrSvd
-1.2
LrM
ft-1.
20.5
1
1.5
2
2.5
3
3.5
4
4.5
SLA
V
Box Plot for SLAV Metric
(b) Random Workload
Fig. 10: SLA violations metric on workload traces of Planetlab servers and random synthetic workload
Apart from the results discussed above, results of SLAV, SLAVO and SLAVM do not give any clue about the fitness ofany algorithm due to variations existing in the results as can be seen in Fig. 10(a)–10(b), Fig. 11(a)–11(b) and Fig. 12(a)–12(b). However, the results obtained for proposed algorithms are not kind of outlier in comparison to the benchmarkalgorithms and therefore confirms their suitability. Meanwhile, ESV (t) is not weighted metric and it is difficult to decideover efficiency of any algorithm by looking at value of ESV (t) only. Considering example of Non Power Aware (NPA)and Dynamic Voltage and Frequency Scaling (DVFS) based application deployment environment, both of them do notgenerate any SLA violations due to no VM migrations (Fig. 8(a)–8(b)), hence results into minimum values of ESV that iszero. However, both of them are not the efficient way to deploy applications in Cloud environment, therefore, we do notset ESV as the primary criteria to decide over goodness of algorithm.
4.5 Test of SignificanceUsing workload described in Section 4.1, we simulated all combinations of four overloading detection methods (THR,MAD, IQR and LR) with six server offloading methods (RCS, MMT, MC, MeMT, SVD, and MFT). Moreover, we havetaken safety parameter to be 0.8, 2.5, 1.5 and 1.2 for THR, MAD, IQR and LR, respectively to control aggressiveness of themethods for consolidating VMs. To perform the test of significance on proposed methods we select Kolmogorov-Smirnov
Cite As: VERMA, J., KUMAR, S., KAIWARTYA, O., CAO, Y., LLORET, J., KATTI, C. P., KHAREL, R., 2018.
Enabling green computing in cloud environments: Network virtualization approach toward 5G support. Transactions on Emerging Telecommunications Technologies, pp. e3434.

xix
ThrRcs
-0.8
ThrM
mt-0
.8
ThrM
c-0.
8
ThrM
eMt-0
.8
ThrSvd
-0.8
ThrM
ft-0.
8
Mad
Rcs-2
.5
Mad
Mm
t-2.5
Mad
Mc-
2.5
Mad
MeM
t-2.5
Mad
Svd-2
.5
Mad
Mft-
2.5
IqrR
cs-1
.5
IqrM
mt-1
.5
IqrM
c-1.
5
IqrM
eMt-1
.5
IqrS
vd-1
.5
IqrM
ft-1.
5
LrRcs
-1.2
LrM
mt-1
.2
LrM
c-1.
2
LrM
eMt-1
.2
LrSvd
-1.2
LrM
ft-1.
2
5
5.5
6
6.5
7
7.5
8S
LAT
AH
Box Plot for SLATAH Metric
(a) PlanetLab Workload
ThrRcs
-0.8
ThrM
mt-0
.8
ThrM
c-0.
8
ThrM
eMt-0
.8
ThrSvd
-0.8
ThrM
ft-0.
8
Mad
Rcs-2
.5
Mad
Mm
t-2.5
Mad
Mc-
2.5
Mad
MeM
t-2.5
Mad
Svd-2
.5
Mad
Mft-
2.5
IqrR
cs-1
.5
IqrM
mt-1
.5
IqrM
c-1.
5
IqrM
eMt-1
.5
IqrS
vd-1
.5
IqrM
ft-1.
5
LrRcs
-1.2
LrM
mt-1
.2
LrM
c-1.
2
LrM
eMt-1
.2
LrSvd
-1.2
LrM
ft-1.
2
8
10
12
14
16
18
20
22
SLA
TA
H
Box Plot for SLATAH Metric
(b) Random Workload
Fig. 11: SLAVO metric on workload traces of PlanetLab servers and random synthetic workload
ThrRcs
-0.8
ThrM
mt-0
.8
ThrM
c-0.
8
ThrM
eMt-0
.8
ThrSvd
-0.8
ThrM
ft-0.
8
Mad
Rcs-2
.5
Mad
Mm
t-2.5
Mad
Mc-
2.5
Mad
MeM
t-2.5
Mad
Svd-2
.5
Mad
Mft-
2.5
IqrR
cs-1
.5
IqrM
mt-1
.5
IqrM
c-1.
5
IqrM
eMt-1
.5
IqrS
vd-1
.5
IqrM
ft-1.
5
LrRcs
-1.2
LrM
mt-1
.2
LrM
c-1.
2
LrM
eMt-1
.2
LrSvd
-1.2
LrM
ft-1.
2
0.06
0.08
0.1
0.12
0.14
0.16
0.18
PD
M
Box Plot for PDM Metric
(a) PlanetLab Workload
ThrRcs
-0.8
ThrM
mt-0
.8
ThrM
c-0.
8
ThrM
eMt-0
.8
ThrSvd
-0.8
ThrM
ft-0.
8
Mad
Rcs-2
.5
Mad
Mm
t-2.5
Mad
Mc-
2.5
Mad
MeM
t-2.5
Mad
Svd-2
.5
Mad
Mft-
2.5
IqrR
cs-1
.5
IqrM
mt-1
.5
IqrM
c-1.
5
IqrM
eMt-1
.5
IqrS
vd-1
.5
IqrM
ft-1.
5
LrRcs
-1.2
LrM
mt-1
.2
LrM
c-1.
2
LrM
eMt-1
.2
LrSvd
-1.2
LrM
ft-1.
2
0.1
0.12
0.14
0.16
0.18
0.2
0.22
0.24
0.26
0.28
PD
M
Box Plot for PDM Metric
(b) Random Workload
Fig. 12: SLAVM metric on workload traces of PlanetLab servers and random synthetic workload
test and Shapiro-Wilk test [52] [53]. Both of the test yields p− value > 0.05 for all the proposed combination and pass thetest of normality validating that results are statistically significantly different. The proposed algorithms not only reduce theenergy consumption but also obtains low VM migrations and host shutdowns.
Cite As: VERMA, J., KUMAR, S., KAIWARTYA, O., CAO, Y., LLORET, J., KATTI, C. P., KHAREL, R., 2018.
Enabling green computing in cloud environments: Network virtualization approach toward 5G support. Transactions on Emerging Telecommunications Technologies, pp. e3434.

xx
ThrRcs
-0.8
ThrM
mt-0
.8
ThrM
c-0.
8
ThrM
eMt-0
.8
ThrSvd
-0.8
ThrM
ft-0.
8
Mad
Rcs-2
.5
Mad
Mm
t-2.5
Mad
Mc-
2.5
Mad
MeM
t-2.5
Mad
Svd-2
.5
Mad
Mft-
2.5
IqrR
cs-1
.5
IqrM
mt-1
.5
IqrM
c-1.
5
IqrM
eMt-1
.5
IqrS
vd-1
.5
IqrM
ft-1.
5
LrRcs
-1.2
LrM
mt-1
.2
LrM
c-1.
2
LrM
eMt-1
.2
LrSvd
-1.2
LrM
ft-1.
2
60
80
100
120
140
160
180
200
220E
SV
Box Plot for ESV Metric
(a) PlanetLab Workload
ThrRcs
-0.8
ThrM
mt-0
.8
ThrM
c-0.
8
ThrM
eMt-0
.8
ThrSvd
-0.8
ThrM
ft-0.
8
Mad
Rcs-2
.5
Mad
Mm
t-2.5
Mad
Mc-
2.5
Mad
MeM
t-2.5
Mad
Svd-2
.5
Mad
Mft-
2.5
IqrR
cs-1
.5
IqrM
mt-1
.5
IqrM
c-1.
5
IqrM
eMt-1
.5
IqrS
vd-1
.5
IqrM
ft-1.
5
LrRcs
-1.2
LrM
mt-1
.2
LrM
c-1.
2
LrM
eMt-1
.2
LrSvd
-1.2
LrM
ft-1.
2
0
500
1000
1500
2000
2500
3000
3500
4000
4500
ES
V
Box Plot for ESV Metric
(b) Random Workload
Fig. 13: ESV metric on workload traces of PlanetLab servers and random synthetic workload
5 CONCLUSION AND FUTURE WORK
Resource under-utilization is the major root cause of higher energy consumption in cloud computing infrastructure andit is necessary to improve resource utilization to cut down the energy consumption. In this paper, we proposed MedianMigration Time (MeMT), Smallest Void Detection (SVD) and Maximum Fill Technique (MFT) algorithms for efficientconsolidation of VMs on relatively small number of physical hosts. We tested proposed algorithm with Static Threshold(THR), Median Absolute Deviations (MAD), Interquartile Range (IQR) and Local Regression (LR) based overloadingdetection methods. The proposed algorithms outperforms on energy consumption, total host shutdowns and total VMmigrations metrics with all combinations of overloading detection methods. Additionally, we perform statistical test ofsignificance on proposed algorithms. The algorithms pass the test of normality and confirms that results are statisticallysignificantly different.
In future authors we intend to identify more real datasets to test out the behaviour of proposed methods. We alsointend to propose VM cost/price models which is also an important and exciting issue for the cost optimization in thepart of end-user and cloud provider [54]. Furthermore, we plan to investigate the performance of proposed methods overOpenStack Neat and CloudStack like environments as a future direction of research [55, 56].
REFERENCES
[1] G. Cook and J. Van Horn, “How dirty is your data? a look at the energy choices that power cloud computing,” Greenpeace (April 2011), 2011.[2] J. Varia, “Best practices in architecting cloud applications in the aws cloud,” Cloud Computing: Principles and Paradigms, pp. 457–490, 2011.[3] E. Hossain and M. Hasan, “5G cellular: key enabling technologies and research challenges,” IEEE Instrumentation & Measurement Magazine,
vol. 18, no. 3, pp. 11–21, 2015.[4] C. Liang, F. R. Yu, and X. Zhang, “Information-centric network function virtualization over 5G mobile wireless networks,” IEEE network,
vol. 29, no. 3, pp. 68–74, 2015.[5] S. Khan and J. L. Mauri, Green Networking and communications: ICT for sustainability. CRC press, 2013.[6] X. Wang, C. Xu, G. Zhao, and S. Yu, “Tuna: an efficient and practical scheme for wireless access point in 5G networks virtualization,” IEEE
Communications Letters, 2017.[7] Z. Feng, C. Qiu, Z. Feng, Z. Wei, W. Li, and P. Zhang, “An effective approach to 5G: Wireless network virtualization,” IEEE Communications
Magazine, vol. 53, no. 12, pp. 53–59, 2015.[8] I. Farris, T. Taleb, H. Flinck, and A. Iera, “Providing ultra-short latency to user-centric 5G applications at the mobile network edge,”
Transactions on Emerging Telecommunications Technologies, 2017.[9] C. A. Garcıa-Perez and P. Merino, “Experimental evaluation of fog computing techniques to reduce latency in LTE networks,” Transactions on
Emerging Telecommunications Technologies, 2017.[10] A. S. Sadiq, T. Z. Almohammad, R. A. B. M. Khadri, A. A. Ahmed, and J. Lloret, “An energy-efficient cross-layer approach for cloud wireless
green communications,” in Fog and Mobile Edge Computing (FMEC), 2017 Second International Conference on. IEEE, 2017, pp. 230–234.[11] A. T. Al-Hammouri, Z. Al-Ali, and B. Al-Duwairi, “ReCAP: A distributed captcha service at the edge of the network to handle server
overload,” Transactions on Emerging Telecommunications Technologies.[12] J. Shuja, A. Gani, K. Ko, K. So, S. Mustafa, S. A. Madani, and M. K. Khan, “SIMDOM: A framework for simd instruction translation and
offloading in heterogeneous mobile architectures,” Transactions on Emerging Telecommunications Technologies, 2017.[13] P. Arroba, J. M. Moya, J. L. Ayala, and R. Buyya, “Dynamic voltage and frequency scaling-aware dynamic consolidation of virtual machines
for energy efficient cloud data centers,” Concurrency and Computation: Practice and Experience, vol. 29, no. 10, 2017.[14] S. Andrade-Morelli, E. Ruiz-Sanchez, S. Sendra, and J. Lloret, “Router power consumption analysis: towards green communications,” in
International Conference on Green Communications and Networking. Springer, 2012, pp. 28–37.[15] A. Beloglazov and R. Buyya, “Optimal online deterministic algorithms and adaptive heuristics for energy and performance efficient dynamic
consolidation of virtual machines in cloud data centers,” Concurrency and Computation: Practice and Experience, vol. 24, no. 13, pp. 1397–1420,2012.
Cite As: VERMA, J., KUMAR, S., KAIWARTYA, O., CAO, Y., LLORET, J., KATTI, C. P., KHAREL, R., 2018.
Enabling green computing in cloud environments: Network virtualization approach toward 5G support. Transactions on Emerging Telecommunications Technologies, pp. e3434.

xxi
[16] K.-D. Lange, “Identifying shades of green: The specpower benchmarks,” Computer, vol. 42, no. 3, pp. 95–97, 2009.[17] D. P. Doane and L. E. Seward, “Applied statistics in business and economics,” USA: Irwin, 2005.[18] F. Farahnakian, P. Liljeberg, and J. Plosila, “Energy-efficient virtual machines consolidation in cloud data centers using reinforcement
learning,” in Parallel, Distributed and Network-Based Processing (PDP), 2014 22nd Euromicro International Conference on. IEEE, 2014, pp. 500–507.[19] F. Farahnakian, T. Pahikkala, P. Liljeberg, J. Plosila, N. T. Hieu, and H. Tenhunen, “Energy-aware vm consolidation in cloud data centers
using utilization prediction model,” IEEE Transactions on Cloud Computing, 2016.[20] K. Park and V. S. Pai, “CoMon: a mostly-scalable monitoring system for planetlab,” ACM SIGOPS Operating Systems Review, vol. 40, no. 1,
pp. 65–74, 2006.[21] “Traces of Google workloads: Migrated from Google code repository,” https://github.com/google/cluster-data, (Accessed on 06/16/2017).[22] E. Arianyan, H. Taheri, and V. Khoshdel, “Novel fuzzy multi objective dvfs-aware consolidation heuristics for energy and sla efficient
resource management in cloud data centers,” Journal of Network and Computer Applications, vol. 78, pp. 43–61, 2017.[23] F. Farahnakian, A. Ashraf, T. Pahikkala, P. Liljeberg, J. Plosila, I. Porres, and H. Tenhunen, “Using ant colony system to consolidate vms for
green cloud computing,” IEEE Transactions on Services Computing, vol. 8, no. 2, pp. 187–198, 2015.[24] R. Nathuji and K. Schwan, “VirtualPower: coordinated power management in virtualized enterprise systems,” in ACM SIGOPS Operating
Systems Review, vol. 41, no. 6. ACM, 2007, pp. 265–278.[25] D. Kusic, J. O. Kephart, J. E. Hanson, N. Kandasamy, and G. Jiang, “Power and performance management of virtualized computing
environments via lookahead control,” Cluster computing, vol. 12, no. 1, pp. 1–15, 2009.[26] H. C. Andrew, “Forecasting, structural time series models and the kalman filter,” Cambridge University, 1989.[27] A. Verma, P. Ahuja, and A. Neogi, “pMapper: power and migration cost aware application placement in virtualized systems,” in
ACM/IFIP/USENIX International Conference on Distributed Systems Platforms and Open Distributed Processing. Springer, 2008, pp. 243–264.[28] N. Karmarkar and R. M. Karp, “An efficient approximation scheme for the one-dimensional bin-packing problem,” in Foundations of Computer
Science, 1982. SFCS’08. 23rd Annual Symposium on. IEEE, 1982, pp. 312–320.[29] D. Gmach, J. Rolia, L. Cherkasova, and A. Kemper, “Resource pool management: Reactive versus proactive or lets be friends,” Computer
Networks, vol. 53, no. 17, pp. 2905–2922, 2009.[30] A. Beloglazov and R. Buyya, “Energy efficient allocation of virtual machines in cloud data centers,” in Cluster, Cloud and Grid Computing
(CCGrid), 2010 10th IEEE/ACM International Conference on. IEEE, 2010, pp. 577–578.[31] J. K. Verma, C. P. Katti, and P. C. Saxena, “MADLVF: An energy efficient resource utilization approach for cloud computing,” International
Journal of Information Technology and Computer Science, vol. 6, no. 7, pp. 56–64, 2014.[32] G. Orsini, D. Bade, and W. Lamersdorf, “Cloudaware: Empowering context-aware self-adaptation for mobile applications,” Transactions on
Emerging Telecommunications Technologies.[33] A. Beloglazov, J. Abawajy, and R. Buyya, “Energy-aware resource allocation heuristics for efficient management of data centers for cloud
computing,” Future generation computer systems, vol. 28, no. 5, pp. 755–768, 2012.[34] J. V. Kistowski and S. Kounev, “Univariate Interpolation-based Modeling of Power and Performance,” in Proceedings of the 9th EAI International
Conference on Performance Evaluation Methodologies and Tools (VALUETOOLS 2015), December 2015.[35] C. Clark, K. Fraser, S. Hand, J. G. Hansen, E. Jul, C. Limpach, I. Pratt, and A. Warfield, “Live migration of virtual machines,” in Proceedings
of the 2nd conference on Symposium on Networked Systems Design & Implementation-Volume 2. USENIX Association, 2005, pp. 273–286.[36] H. Liu, H. Jin, X. Liao, L. Hu, and C. Yu, “Live migration of virtual machine based on full system trace and replay,” in Proceedings of the 18th
ACM international symposium on High performance distributed computing. ACM, 2009, pp. 101–110.[37] M. Nelson, B.-H. Lim, G. Hutchins et al., “Fast transparent migration for virtual machines.” in USENIX Annual technical conference, general
track, 2005, pp. 391–394.[38] A. Lesovsky, Getting Started with OVirt 3.3. Packt Publishing Ltd, 2013.[39] T. Wood, P. J. Shenoy, A. Venkataramani, M. S. Yousif et al., “Black-box and gray-box strategies for virtual machine migration.” in NSDI,
vol. 7, 2007, pp. 17–17.[40] A. B. Nagarajan, F. Mueller, C. Engelmann, and S. L. Scott, “Proactive fault tolerance for hpc with xen virtualization,” in Proceedings of the
21st annual international conference on Supercomputing. ACM, 2007, pp. 23–32.[41] A. Kangarlou, D. Xu, P. Ruth, and P. Eugster, “Taking snapshots of virtual networked environments,” in Virtualization Technology in Distributed
Computing (VTDC), 2007 Second International Workshop on. IEEE, 2007, pp. 1–8.[42] B. Sotomayor, K. Keahey, and I. Foster, “Combining batch execution and leasing using virtual machines,” in Proceedings of the 17th international
symposium on High performance distributed computing. ACM, 2008, pp. 87–96.[43] J. Jiang, Y. Feng, J. Zhao, and K. Li, “DataABC: A fast abc based energy-efficient live vm consolidation policy with data-intensive energy
evaluation model,” Future Generation Computer Systems, 2016.[44] S. Power and P. B. Methodolody, “V2. 1,” Standard Performance and Evaluation Corporation (SPEC), 2011.[45] A. Berl, E. Gelenbe, M. Di Girolamo, G. Giuliani, H. De Meer, M. Q. Dang, and K. Pentikousis, “Energy-efficient cloud computing,” The
computer journal, vol. 53, no. 7, pp. 1045–1051, 2010.[46] S. Esfandiarpoor, A. Pahlavan, and M. Goudarzi, “Structure-aware online virtual machine consolidation for datacenter energy improvement
in cloud computing,” Computers & Electrical Engineering, vol. 42, pp. 74–89, 2015.[47] R. N. Calheiros, R. Ranjan, A. Beloglazov, C. A. De Rose, and R. Buyya, “CloudSim: a toolkit for modeling and simulation of cloud computing
environments and evaluation of resource provisioning algorithms,” Software: Practice and Experience, vol. 41, no. 1, pp. 23–50, 2011.[48] “Amazon EC2 Instance Types: Amazon Web Services (AWS),” https://aws.amazon.com/ec2/instance-types/, (Accessed on 12/23/2017).[49] H. Abdi, “Multiple correlation coefficient,” The University of Texas at Dallas, 2007.[50] A. Verma, G. Dasgupta, T. K. Nayak, P. De, and R. Kothari, “Server workload analysis for power minimization using consolidation,” in
Proceedings of the 2009 conference on USENIX Annual technical conference. USENIX Association, 2009, pp. 28–28.[51] A. Murtazaev and S. Oh, “Sercon: Server consolidation algorithm using live migration of virtual machines for green computing,” IETE
Technical Review, vol. 28, no. 3, pp. 212–231, 2011.[52] H. W. Lilliefors, “On the kolmogorov-smirnov test for normality with mean and variance unknown,” Journal of the American statistical
Association, vol. 62, no. 318, pp. 399–402, 1967.[53] S. S. Shapiro and R. Francia, “An approximate analysis of variance test for normality,” Journal of the American Statistical Association, vol. 67,
no. 337, pp. 215–216, 1972.[54] J. K. Verma and C. P. Katti, “Study of cloud computing and its issues: A review.” Smart Computing Review, vol. 4, no. 5, pp. 389–411, 2014.[55] “OpenStack Neat: Dynamic consolidation of virtual machines in openstack clouds,” http://openstack-neat.org/, (Accessed on 12/22/2017).[56] “Apache cloudstack: Open source cloud computing,” https://cloudstack.apache.org/, (Accessed on 12/22/2017).
Cite As: VERMA, J., KUMAR, S., KAIWARTYA, O., CAO, Y., LLORET, J., KATTI, C. P., KHAREL, R., 2018.
Enabling green computing in cloud environments: Network virtualization approach toward 5G support. Transactions on Emerging Telecommunications Technologies, pp. e3434.