enabling science to improve the quality of life · pdf fileour core mission of enabling...
TRANSCRIPT
SAFC Commercial
Enabling Science to Improve the Quality of Life
Research Applied
2012 Annual Report
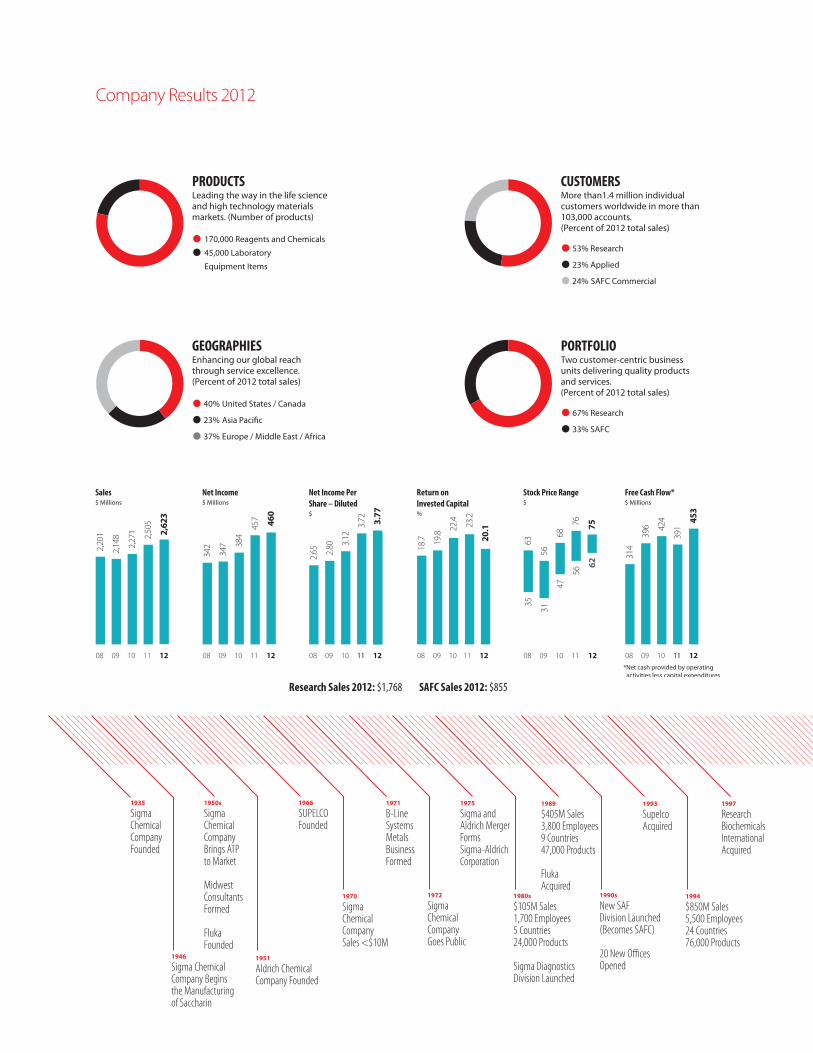
Company Results 2012
1997
Research Biochemicals International Acquired
1993
Supelco Acquired
1994
$850M Sales 5,500 Employees 24 Countries 76,000 Products
1990s
New SAF Division Launched(Becomes SAFC)
20 New Offices Opened
1989
$405M Sales 3,800 Employees 9 Countries 47,000 Products
Fluka Acquired
1975
Sigma and Aldrich Merger Forms Sigma-Aldrich Corporation
1971
B-Line Systems Metals Business Formed
1951
Aldrich Chemical Company Founded
1935
Sigma Chemical Company Founded
1970
Sigma Chemical Company Sales <$10M
1950s
Sigma ChemicalCompany Brings ATP to Market
Midwest Consultants Formed
FlukaFounded
1972
Sigma Chemical Company Goes Public
1966
SUPELCOFounded
1946
Sigma Chemical Company Begins the Manufacturing of Saccharin
1980s
$105M Sales 1,700 Employees 5 Countries 24,000 Products
Sigma Diagnostics Division Launched
Sales$ Millions
08 09 10 11
2,2
01
2,1
48
2,2
71
2,5
05
12
2,62
3
Net Income$ Millions
342
347 3
84
457
Net Income Per Share – Diluted$
2.6
5
2.8
0
3.1
2
3.7
7
Return on Invested Capital%
18.
7
19.
8 22.
4
Stock Price Range$
63
35
56
31
68
47
76
56
75
62
Free Cash Flow*$ Millions
*Net cash provided by operating activities less capital expenditures
314
396 4
24 453
08 09 10 11
460
12 08 09 10 11
3.7
2
11 12 08 09 10 11
23.
2
12
20.
1
08 09 10 11 12 08 09 10 11
391
11 12
Research Sales 2012: $1,768 SAFC Sales 2012: $855
CUSTOMERSMore than1.4 million individual customers worldwide in more than103,000 accounts.(Percent of 2012 total sales)
PRODUCTSLeading the way in the life science and high technology materials markets. (Number of products)
PORTFOLIOTwo customer-centric business units delivering quality products and services. (Percent of 2012 total sales)
GEOGRAPHIES Enhancing our global reach through service excellence. (Percent of 2012 total sales)
• 53% Research
• 23% Applied
• 24% SAFC Commercial
• 170,000 Reagents and Chemicals • 45,000 Laboratory
Equipment Items
• 67% Research
• 33% SAFC
• 40% United States / Canada
• 23% Asia Paci�c
• 37% Europe / Middle East / Africa
2012 AnnuAl RepoRt 1
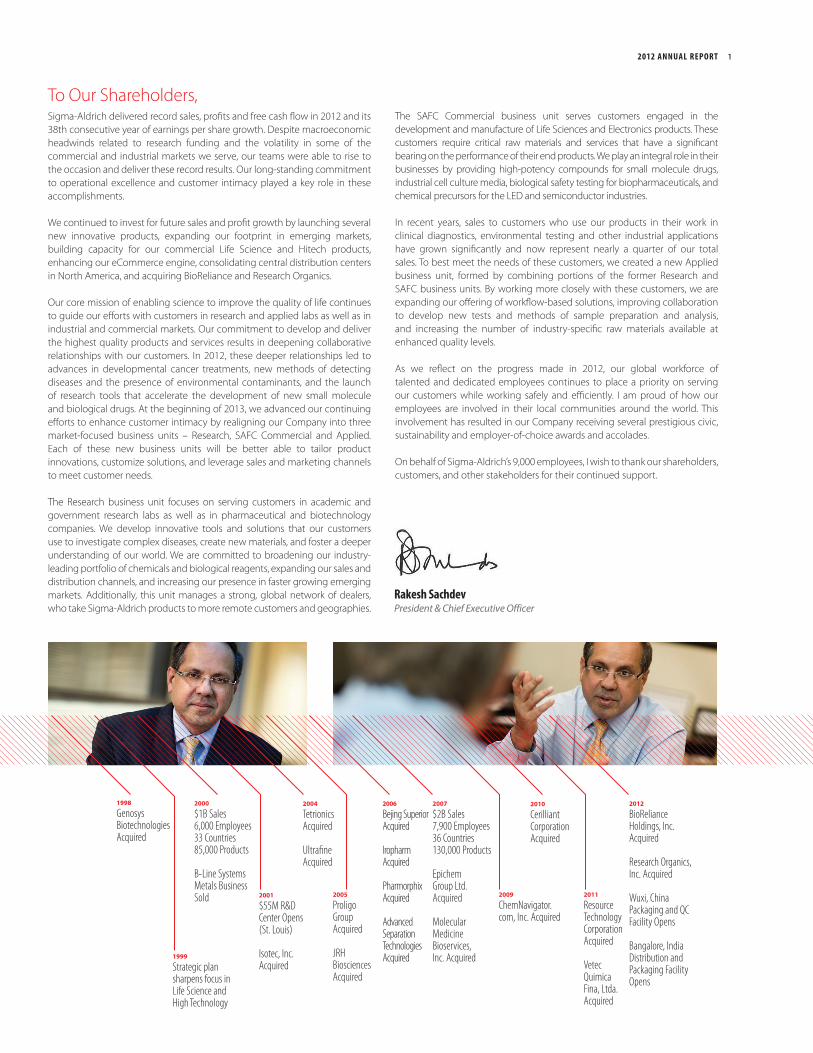
Rakesh Sachdev President & Chief Executive Officer
To Our Shareholders, Sigma-Aldrich delivered record sales, profits and free cash flow in 2012 and its 38th consecutive year of earnings per share growth. Despite macroeconomic headwinds related to research funding and the volatility in some of the commercial and industrial markets we serve, our teams were able to rise to the occasion and deliver these record results. Our long-standing commitment to operational excellence and customer intimacy played a key role in these accomplishments.
We continued to invest for future sales and profit growth by launching several new innovative products, expanding our footprint in emerging markets, building capacity for our commercial Life Science and Hitech products, enhancing our eCommerce engine, consolidating central distribution centers in North America, and acquiring BioReliance and Research Organics.
Our core mission of enabling science to improve the quality of life continues to guide our efforts with customers in research and applied labs as well as in industrial and commercial markets. Our commitment to develop and deliver the highest quality products and services results in deepening collaborative relationships with our customers. In 2012, these deeper relationships led to advances in developmental cancer treatments, new methods of detecting diseases and the presence of environmental contaminants, and the launch of research tools that accelerate the development of new small molecule and biological drugs. At the beginning of 2013, we advanced our continuing efforts to enhance customer intimacy by realigning our Company into three market-focused business units – Research, SAFC Commercial and Applied. Each of these new business units will be better able to tailor product innovations, customize solutions, and leverage sales and marketing channels to meet customer needs.
The Research business unit focuses on serving customers in academic and government research labs as well as in pharmaceutical and biotechnology companies. We develop innovative tools and solutions that our customers use to investigate complex diseases, create new materials, and foster a deeper understanding of our world. We are committed to broadening our industry-leading portfolio of chemicals and biological reagents, expanding our sales and distribution channels, and increasing our presence in faster growing emerging markets. Additionally, this unit manages a strong, global network of dealers, who take Sigma-Aldrich products to more remote customers and geographies.
The SAFC Commercial business unit serves customers engaged in the development and manufacture of Life Sciences and Electronics products. These customers require critical raw materials and services that have a significant bearing on the performance of their end products. We play an integral role in their businesses by providing high-potency compounds for small molecule drugs, industrial cell culture media, biological safety testing for biopharmaceuticals, and chemical precursors for the LED and semiconductor industries.
In recent years, sales to customers who use our products in their work in clinical diagnostics, environmental testing and other industrial applications have grown significantly and now represent nearly a quarter of our total sales. To best meet the needs of these customers, we created a new Applied business unit, formed by combining portions of the former Research and SAFC business units. By working more closely with these customers, we are expanding our offering of workflow-based solutions, improving collaboration to develop new tests and methods of sample preparation and analysis, and increasing the number of industry-specific raw materials available at enhanced quality levels.
As we reflect on the progress made in 2012, our global workforce of talented and dedicated employees continues to place a priority on serving our customers while working safely and efficiently. I am proud of how our employees are involved in their local communities around the world. This involvement has resulted in our Company receiving several prestigious civic, sustainability and employer-of-choice awards and accolades.
On behalf of Sigma-Aldrich’s 9,000 employees, I wish to thank our shareholders, customers, and other stakeholders for their continued support.
2001
$55M R&D Center Opens (St. Louis)
Isotec, Inc. Acquired
2000
$1B Sales 6,000 Employees 33 Countries 85,000 Products
B-Line Systems Metals Business Sold
2012
BioReliance Holdings, Inc. Acquired
Research Organics, Inc. Acquired
Wuxi, China Packaging and QC Facility Opens
Bangalore, India Distribution and Packaging Facility Opens
1999
Strategic plan sharpens focus in Life Science and High Technology
2011
Resource Technology Corporation Acquired Vetec Quimica Fina, Ltda. Acquired
1998
GenosysBiotechnologies Acquired
2010
Cerilliant Corporation Acquired
2009
ChemNavigator.com, Inc. Acquired
2007
$2B Sales7,900 Employees36 Countries130,000 Products
Epichem Group Ltd. Acquired
Molecular Medicine Bioservices, Inc. Acquired
2006
Bejing Superior Acquired
Iropharm Acquired
Pharmorphix Acquired
Advanced Separation Technologies Acquired
2005
Proligo Group Acquired
JRH Biosciences Acquired
2004
Tetrionics Acquired Ultrafine Acquired
2 SIGMA-ALDRICH
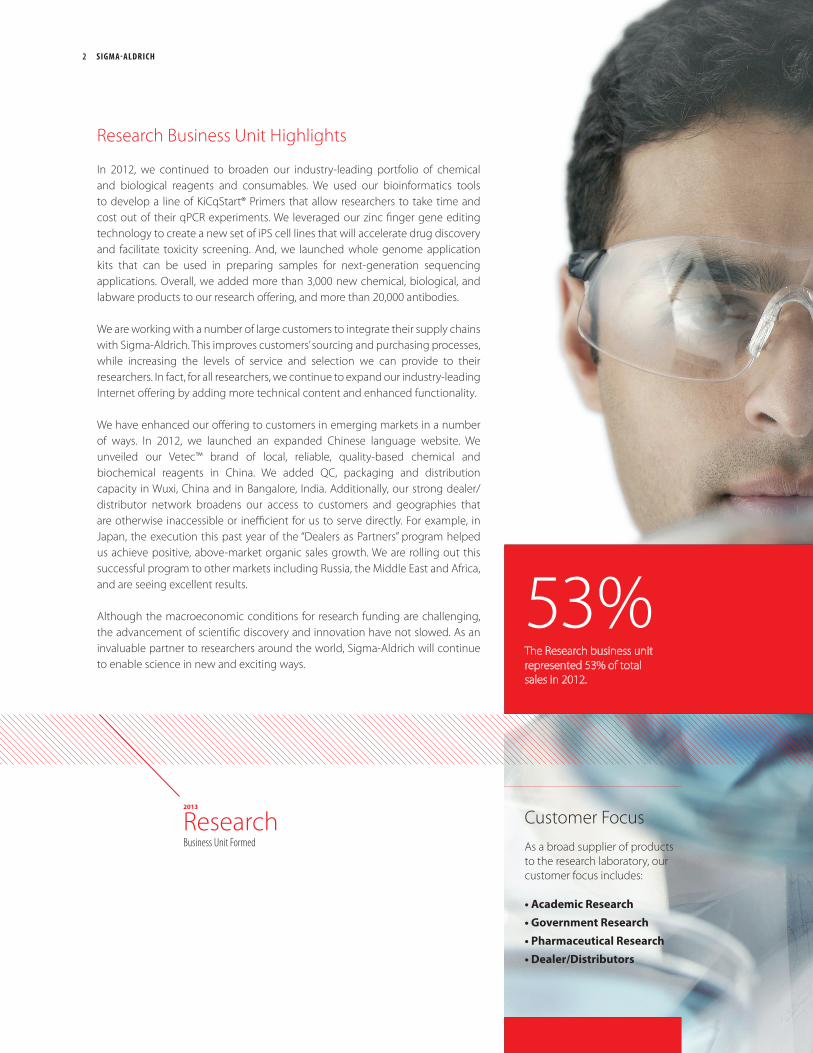
Customer FocusAs a broad supplier of products to the research laboratory, our customer focus includes:
• Academic Research• Government Research• Pharmaceutical Research• Dealer/Distributors
53%The Research business unit represented 53% of total sales in 2012.
Research Business Unit Highlights
In 2012, we continued to broaden our industry-leading portfolio of chemical and biological reagents and consumables. We used our bioinformatics tools to develop a line of KiCqStart® Primers that allow researchers to take time and cost out of their qPCR experiments. We leveraged our zinc finger gene editing technology to create a new set of iPS cell lines that will accelerate drug discovery and facilitate toxicity screening. And, we launched whole genome application kits that can be used in preparing samples for next-generation sequencing applications. Overall, we added more than 3,000 new chemical, biological, and labware products to our research offering, and more than 20,000 antibodies.
We are working with a number of large customers to integrate their supply chains with Sigma-Aldrich. This improves customers’ sourcing and purchasing processes, while increasing the levels of service and selection we can provide to their researchers. In fact, for all researchers, we continue to expand our industry-leading Internet offering by adding more technical content and enhanced functionality.
We have enhanced our offering to customers in emerging markets in a number of ways. In 2012, we launched an expanded Chinese language website. We unveiled our Vetec™ brand of local, reliable, quality-based chemical and biochemical reagents in China. We added QC, packaging and distribution capacity in Wuxi, China and in Bangalore, India. Additionally, our strong dealer/distributor network broadens our access to customers and geographies that are otherwise inaccessible or inefficient for us to serve directly. For example, in Japan, the execution this past year of the “Dealers as Partners” program helped us achieve positive, above-market organic sales growth. We are rolling out this successful program to other markets including Russia, the Middle East and Africa, and are seeing excellent results.
Although the macroeconomic conditions for research funding are challenging, the advancement of scientific discovery and innovation have not slowed. As an invaluable partner to researchers around the world, Sigma-Aldrich will continue to enable science in new and exciting ways.
2013
ResearchBusiness Unit Formed

Eric M. GreenExecutive Vice President and President, Research
Eric Green leads our Research business unit. He was previously responsible for our strong growth in the Asia Pacific and Latin America region for the past several years. Eric has also held key positions in Europe, Canada and the U.S.
Who We Serve
Research business unit customers are at the forefront of technology and innovation, continually pushing the boundaries of scientific discovery. These customers conduct their research in academic and government labs and pharmaceutical and biotechnology companies around the world. Their success depends on the scientific depth, product breadth, quality, consistency, and convenience that only Sigma-Aldrich can offer. They value products that are easy to order, in stock, and delivered on time to research laboratories anywhere in the world. Researchers have come to expect that the latest tools in analytical, biology, chemistry, and material sciences are just a mouse click or phone call away. They trust Sigma-Aldrich, and we will continue to live up to that trust.
MEETING CUSTOMER NEEDS“ We are increasing our focus on customer segments by providing tailored product and
service offerings according to our customers’ research interests and organizational context. We have exciting opportunities to expand our reach to new customers and geographies, to broaden our portfolio of new products and services, and to leverage our operational capabilities.” – Eric Green
2012 AnnuAl RepoRt 3
4 SIGMA-ALDRICH
24%The SAFC Commercial business unit represented 24% of sales in 2012.
SAFC Commercial Business Unit Highlights
SAFC Commercial has taken a “Top 100” approach, focusing on providing our largest customers with solutions and reinforcing our ability to solve our customers’ development and manufacturing challenges. Although we have a strong focus on the 100 largest customers, each and every customer matters to us and we continue to develop unique strategies to support all of our customers globally.
In 2012, the Life Science products group of SAFC Commercial, provided cell culture media and reagents for the manufacture of several leading biopharmaceutical drugs, produced advanced intermediates and APIs for small molecule drugs, and expanded our partnerships with a number of companies that have therapeutic products currently in clinical trials. Our Life Science Services launched a number of new assays with applications in therapeutic development including a 3D Skin Assay that detects DNA damage from drug candidates that are to be used topically.
SAFC Hitech expanded capacity and customer reach in 2012. We opened a new LED Precursor plant in Taiwan that will increase capacity to meet growing demand. We launched a joint venture in the Korean market, strengthening our presence in this geography and our relationships with key customers.
By providing products and services in both Life Science and Hitech, SAFC Commercial strives to deliver high quality customized manufacturing materials and value added services that drive customers’ end product performance. These are demanding markets that continue to reward our commitment to the most challenging science, high quality, and exemplary service.
Gilles A. CottierExecutive Vice President and President, SAFC Commercial
The SAFC Commercial business unit will continue to be led by Gilles Cottier. This business unit forms the core of our successful SAFC franchise and has generated solid growth over the past two decades. During that period, through a combination of internal and external investments, our SAFC business grew from 10% to nearly 24% of Sigma-Aldrich sales.
2013
SAFC CommercialBusiness Unit Formed
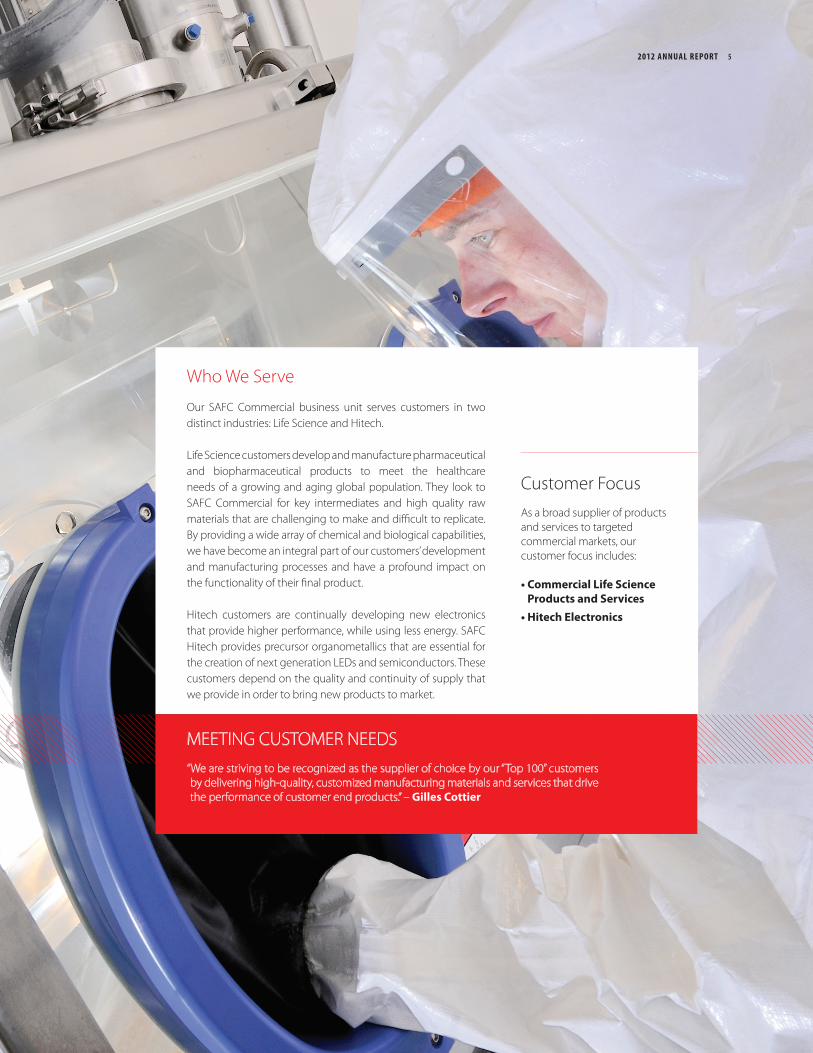
Who We Serve
Our SAFC Commercial business unit serves customers in two distinct industries: Life Science and Hitech.
Life Science customers develop and manufacture pharmaceutical and biopharmaceutical products to meet the healthcare needs of a growing and aging global population. They look to SAFC Commercial for key intermediates and high quality raw materials that are challenging to make and difficult to replicate. By providing a wide array of chemical and biological capabilities, we have become an integral part of our customers’ development and manufacturing processes and have a profound impact on the functionality of their final product.
Hitech customers are continually developing new electronics that provide higher performance, while using less energy. SAFC Hitech provides precursor organometallics that are essential for the creation of next generation LEDs and semiconductors. These customers depend on the quality and continuity of supply that we provide in order to bring new products to market.
MEETING CUSTOMER NEEDS“ We are striving to be recognized as the supplier of choice by our “Top 100” customers by delivering high-quality, customized manufacturing materials and services that drive the performance of customer end products.” – Gilles Cottier
Customer FocusAs a broad supplier of products and services to targeted commercial markets, our customer focus includes:
• Commercial Life Science Products and Services
• Hitech Electronics
2012 AnnuAl RepoRt 5
6 SIGMA-ALDRICH
Franklin D. WicksExecutive Vice President and
President, Applied
Frank Wicks is leading our Applied business unit. Most recently, Frank was the head of our Research business. Frank has also been head of SAFC and was a crucial leader in the formation and success of that business unit.
Customer FocusAs a broad supplier of products to applied, our customer focus includes:
• Diagnostics & Testing• Industrial Applications
2013
AppliedBusiness Unit Formed
Applied Business Unit Highlights
The Applied business unit offers a wide selection of analytical tools, reference standards, high-quality raw materials, and consumables to customers in diagnostics, testing, and industrial settings. In the past year, these offerings have been focused and expanded, leading to growing intimacy with these customers.
For example, our Ascentis Express line of fused-core particle separation products has been incorporated into a number of applications. Collaboration with major hospital labs allowed Sigma-Aldrich scientists to develop breakthrough assays for diagnosing Vitamin D metabolism conditions. We also significantly expanded our collection of reagents and consumables for use in proteomics research, biomarker discovery, and drug development. And, we are a primary manufacturer of stable isotope compounds used in various imaging and diagnostic applications.
We also are focusing on customers with industrial application requirements that are uniquely well-served by the products and services we provide. For example, we provide the key components of a solution to enable power companies to conduct remote sensing of imminent failure in transformers. And, we expanded our offering of products that conform to an enhanced quality profile suitable for demanding manufacturing applications.
In 2012, we began to expand our offering of certified reference materials beyond North America to the global markets we serve. These products are used to monitor and measure drug levels in samples for workplace drug testing, medication levels, sports doping levels, clinical and forensic toxicology, and in forensic investigations.
Given the strong growth of this market segment and the specialized needs of these customers, we are enthusiastic about the prospects of the newly created Applied business unit.
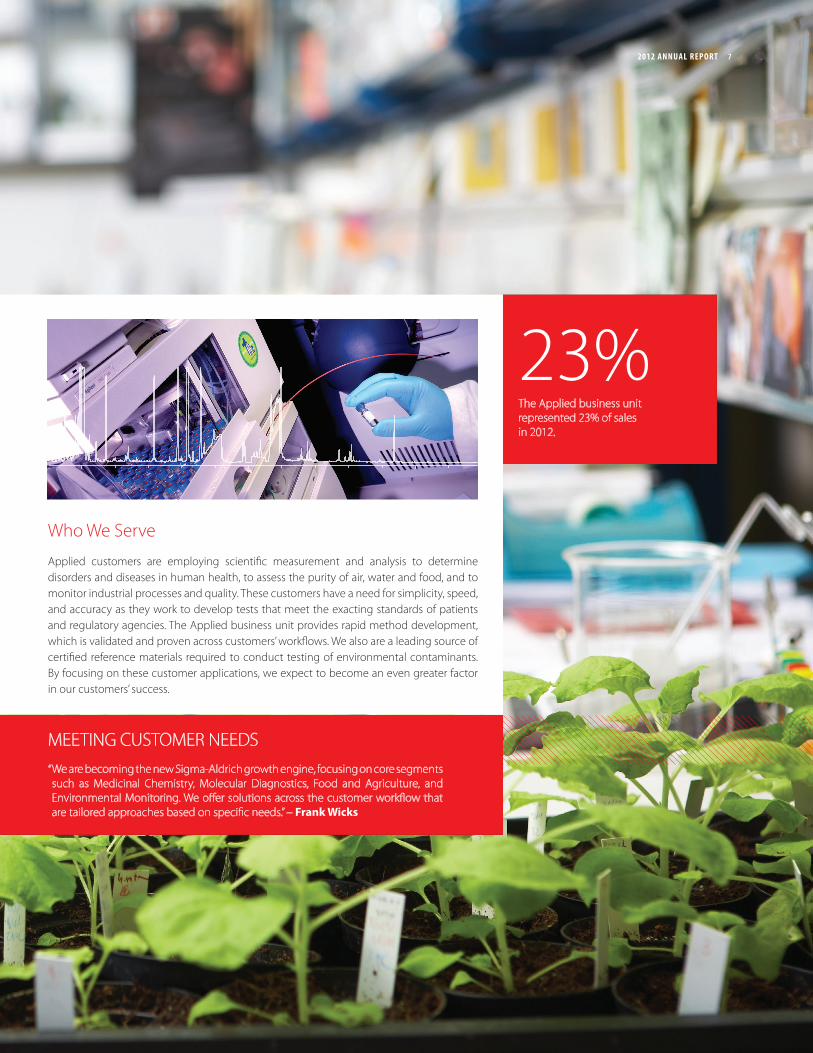
23%The Applied business unit represented 23% of sales in 2012.
MEETING CUSTOMER NEEDS“ We are becoming the new Sigma-Aldrich growth engine, focusing on core segments such as Medicinal Chemistry, Molecular Diagnostics, Food and Agriculture, and Environmental Monitoring. We offer solutions across the customer workflow that are tailored approaches based on specific needs.” – Frank Wicks
Who We Serve
Applied customers are employing scientific measurement and analysis to determine disorders and diseases in human health, to assess the purity of air, water and food, and to monitor industrial processes and quality. These customers have a need for simplicity, speed, and accuracy as they work to develop tests that meet the exacting standards of patients and regulatory agencies. The Applied business unit provides rapid method development, which is validated and proven across customers’ workflows. We also are a leading source of certified reference materials required to conduct testing of environmental contaminants. By focusing on these customer applications, we expect to become an even greater factor in our customers’ success.
2012 AnnuAl RepoRt 7
8 SIGMA-ALDRICH
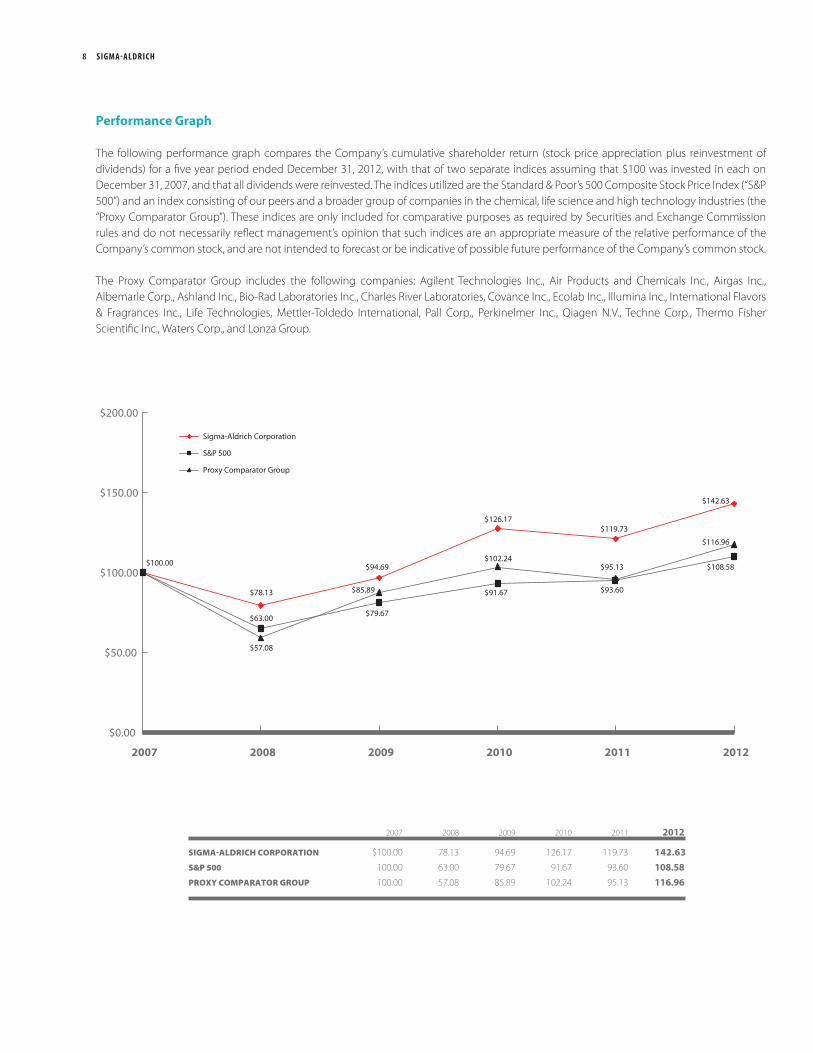
Performance Graph
The following performance graph compares the Company’s cumulative shareholder return (stock price appreciation plus reinvestment of dividends) for a five year period ended December 31, 2012, with that of two separate indices assuming that $100 was invested in each on December 31, 2007, and that all dividends were reinvested. The indices utilized are the Standard & Poor’s 500 Composite Stock Price Index (“S&P 500”) and an index consisting of our peers and a broader group of companies in the chemical, life science and high technology industries (the “Proxy Comparator Group”). These indices are only included for comparative purposes as required by Securities and Exchange Commission rules and do not necessarily reflect management’s opinion that such indices are an appropriate measure of the relative performance of the Company’s common stock, and are not intended to forecast or be indicative of possible future performance of the Company’s common stock.
The Proxy Comparator Group includes the following companies: Agilent Technologies Inc., Air Products and Chemicals Inc., Airgas Inc., Albemarle Corp., Ashland Inc., Bio-Rad Laboratories Inc., Charles River Laboratories, Covance Inc., Ecolab Inc., Illumina Inc., International Flavors & Fragrances Inc., Life Technologies, Mettler-Toldedo International, Pall Corp., Perkinelmer Inc., Qiagen N.V., Techne Corp., Thermo Fisher Scientific Inc., Waters Corp., and Lonza Group.
2007 2008 2009 2010 2011 2012
Sigma-aldrich corporation $100.00 78.13 94.69 126.17 119.73 142.63
S&p 500 100.00 63.00 79.67 91.67 93.60 108.58proXY comparator group 100.00 57.08 85.89 102.24 95.13 116.96
$85.89
$100.00
$57.08
$94.69
$126.17 $119.73
$142.63
$78.13
$79.67
$91.67
$95.13 $108.58
$63.00
$102.24
$93.60
$116.96
$0.00
$50.00
$100.00
$150.00
$200.00
2007 2008 2009 2010 2011 2012
Sigma-Aldrich Corporation
S&P 500
Proxy Comparator Group
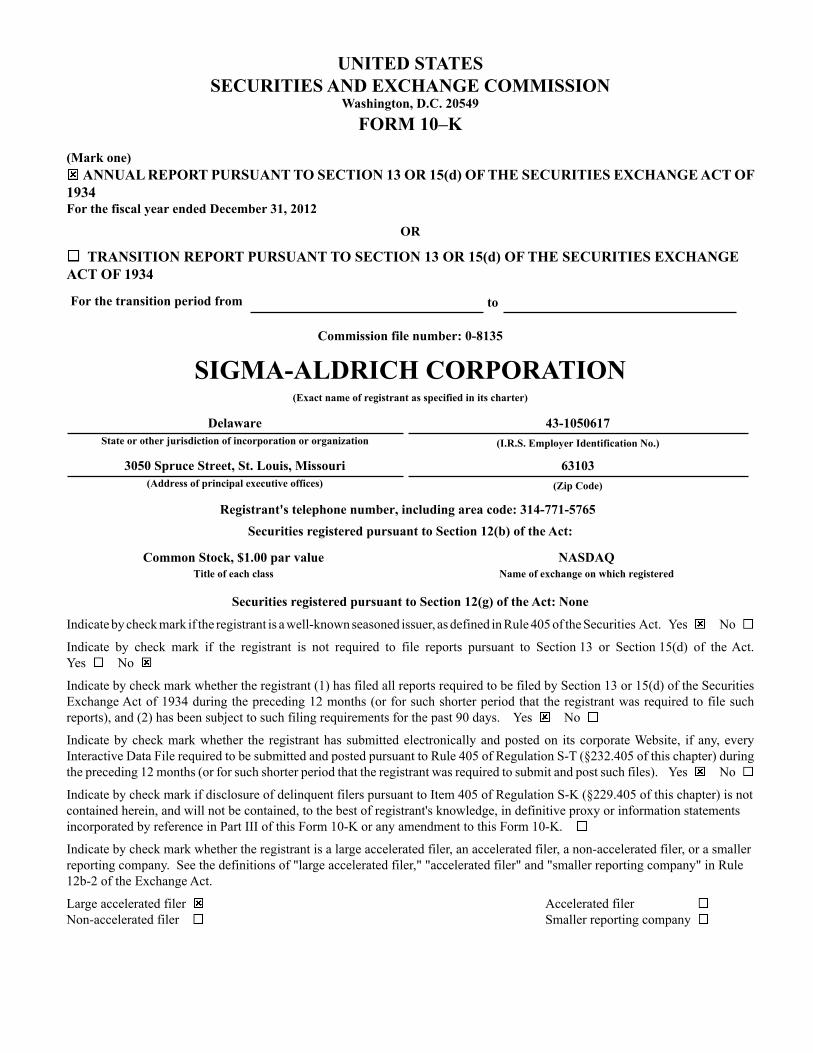
UNITED STATESSECURITIES AND EXCHANGE COMMISSION
Washington, D.C. 20549
FORM 10–K
(Mark one) ANNUAL REPORT PURSUANT TO SECTION 13 OR 15(d) OF THE SECURITIES EXCHANGE ACT OF
1934For the fiscal year ended December 31, 2012
OR
TRANSITION REPORT PURSUANT TO SECTION 13 OR 15(d) OF THE SECURITIES EXCHANGE ACT OF 1934
For the transition period from to
Commission file number: 0-8135
SIGMA-ALDRICH CORPORATION(Exact name of registrant as specified in its charter)
Delaware 43-1050617State or other jurisdiction of incorporation or organization (I.R.S. Employer Identification No.)
3050 Spruce Street, St. Louis, Missouri 63103(Address of principal executive offices) (Zip Code)
Registrant's telephone number, including area code: 314-771-5765Securities registered pursuant to Section 12(b) of the Act:
Common Stock, $1.00 par value NASDAQTitle of each class Name of exchange on which registered
Securities registered pursuant to Section 12(g) of the Act: None
Indicate by check mark if the registrant is a well-known seasoned issuer, as defined in Rule 405 of the Securities Act. Yes No
Indicate by check mark if the registrant is not required to file reports pursuant to Section 13 or Section 15(d) of the Act. Yes No
Indicate by check mark whether the registrant (1) has filed all reports required to be filed by Section 13 or 15(d) of the Securities Exchange Act of 1934 during the preceding 12 months (or for such shorter period that the registrant was required to file such reports), and (2) has been subject to such filing requirements for the past 90 days. Yes No
Indicate by check mark whether the registrant has submitted electronically and posted on its corporate Website, if any, every Interactive Data File required to be submitted and posted pursuant to Rule 405 of Regulation S-T (§232.405 of this chapter) during the preceding 12 months (or for such shorter period that the registrant was required to submit and post such files). Yes No
Indicate by check mark if disclosure of delinquent filers pursuant to Item 405 of Regulation S-K (§229.405 of this chapter) is not contained herein, and will not be contained, to the best of registrant's knowledge, in definitive proxy or information statements incorporated by reference in Part III of this Form 10-K or any amendment to this Form 10-K.
Indicate by check mark whether the registrant is a large accelerated filer, an accelerated filer, a non-accelerated filer, or a smaller reporting company. See the definitions of "large accelerated filer," "accelerated filer" and "smaller reporting company" in Rule 12b-2 of the Exchange Act.
Large accelerated filer Accelerated filer Non-accelerated filer Smaller reporting company
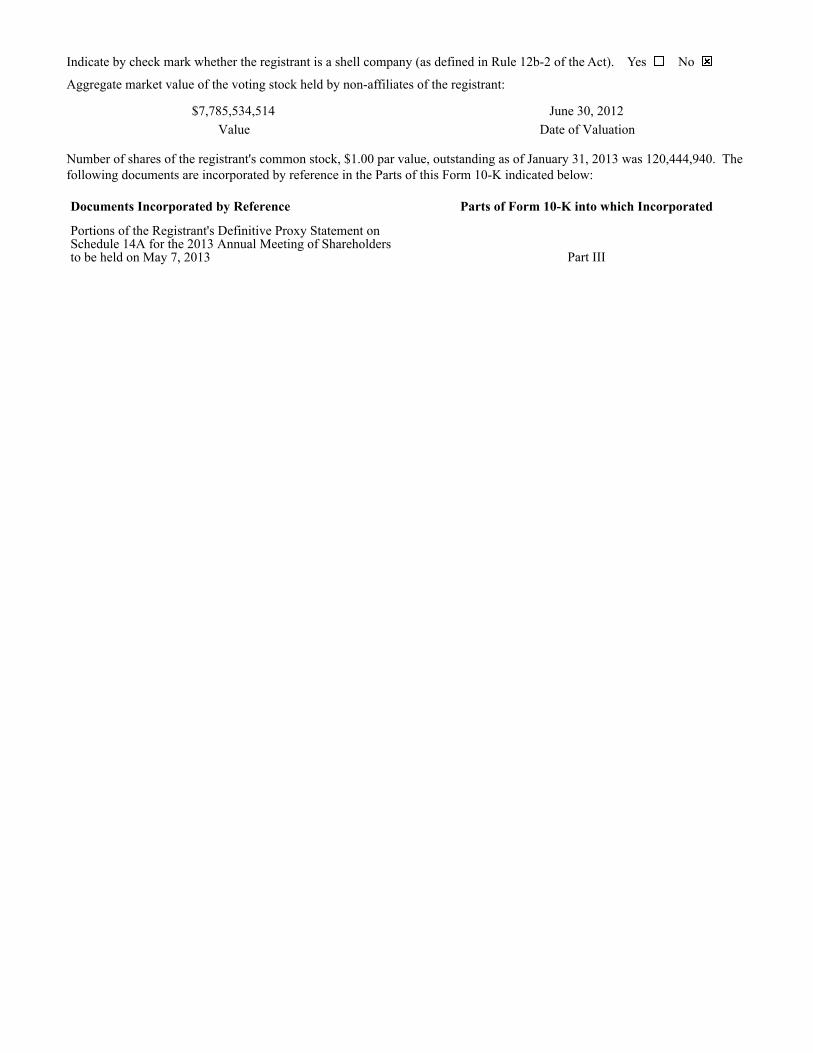
Indicate by check mark whether the registrant is a shell company (as defined in Rule 12b-2 of the Act). Yes No
Aggregate market value of the voting stock held by non-affiliates of the registrant:
$7,785,534,514 June 30, 2012Value Date of Valuation
Number of shares of the registrant's common stock, $1.00 par value, outstanding as of January 31, 2013 was 120,444,940. The following documents are incorporated by reference in the Parts of this Form 10-K indicated below:
Documents Incorporated by Reference Parts of Form 10-K into which Incorporated
Portions of the Registrant's Definitive Proxy Statement onSchedule 14A for the 2013 Annual Meeting of Shareholdersto be held on May 7, 2013 Part III
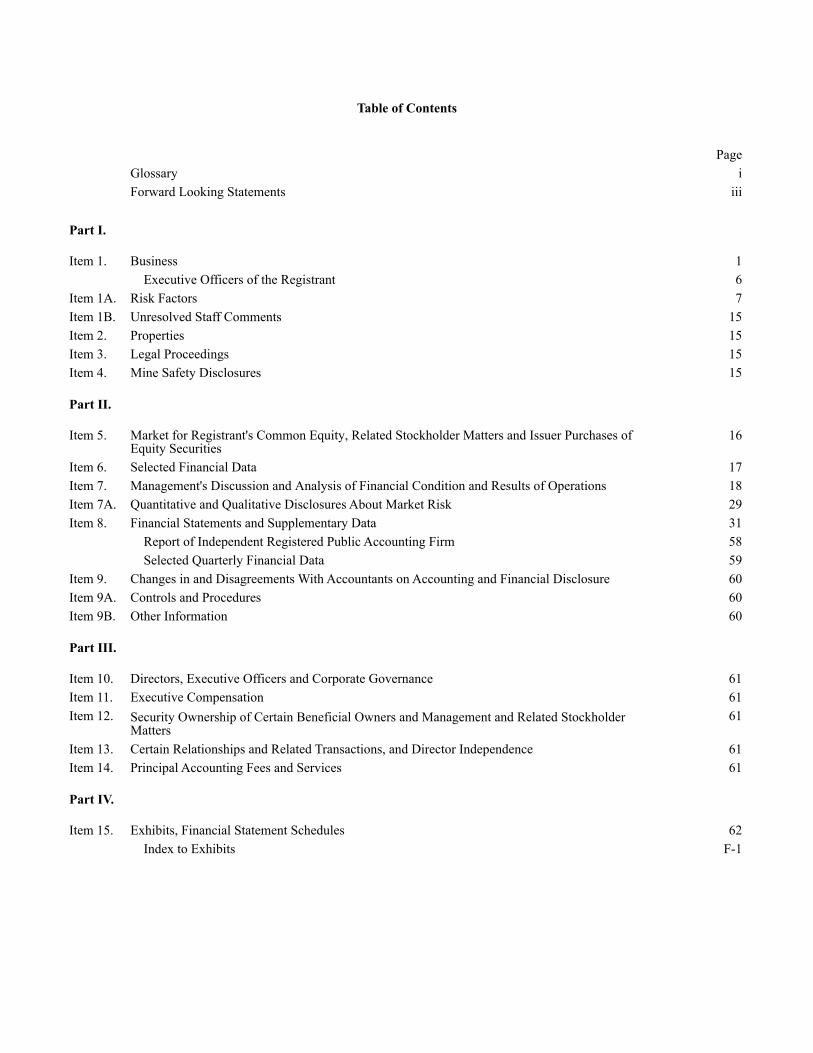
Table of Contents
PageGlossary
Market for Registrant's Common Equity, Related Stockholder Matters and Issuer Purchases ofEquity Securities
Management's Discussion and Analysis of Financial Condition and Results of Operations
iForward Looking Statements iii
Part I.
Item 1. Business 1 Executive Officers of the Registrant 6
Item 1A. Risk Factors 7Item 1B. Unresolved Staff Comments 15Item 2. Properties 15Item 3. Legal Proceedings 15Item 4. Mine Safety Disclosures 15
Part II.
Item 5. 16
Item 6. Selected Financial Data 17Item 7. 18Item 7A. Quantitative and Qualitative Disclosures About Market Risk 29Item 8. Financial Statements and Supplementary Data 31
Report of Independent Registered Public Accounting Firm 58 Selected Quarterly Financial Data 59
Item 9. Changes in and Disagreements With Accountants on Accounting and Financial Disclosure 60Item 9A. Controls and Procedures 60Item 9B. Other Information 60
Part III.
Item 10. Directors, Executive Officers and Corporate Governance 61Item 11. Executive Compensation 61Item 12. Security Ownership of Certain Beneficial Owners and Management and Related Stockholder
Matters61
Item 13. Certain Relationships and Related Transactions, and Director Independence 61Item 14. Principal Accounting Fees and Services 61
Part IV.
Item 15. Exhibits, Financial Statement Schedules 62 Index to Exhibits F-1
- i -
Glossary
2003 LTIP....................................................... Sigma-Aldrich Corporation 2003 Long-Term Incentive PlanAldrich ........................................................... Aldrich Chemical Company, Inc.AOCI.............................................................. Accumulated Other Comprehensive IncomeAPHIS............................................................ Animal and Plant Health Inspection ServiceAPLA ............................................................. Asia Pacific and Latin America RegionASC................................................................ Accounting Standards CodificationASU ............................................................... Accounting Standards UpdateBioReliance.................................................... BioReliance Holdings, Inc.Bioterrorism Act............................................. USA Patriot Act and Public Health Security and Bioterrorism Preparedness and
Response Act of 2002Board.............................................................. Sigma-Aldrich Corporation Board of DirectorsCAA ............................................................... Clean Air ActCBP................................................................ U.S. Customs and Border ProtectionCDC ............................................................... Centers for Disease ControlCEO................................................................ Sigma-Aldrich Corporation Chief Executive OfficerCERCLA........................................................ Comprehensive Environmental Response, Compensation and Liability Act of
1980CFO................................................................ Sigma-Aldrich Corporation Chief Financial OfficerCompany, we, us or our ................................. Sigma-Aldrich CorporationCWA............................................................... Clean Water ActDEA................................................................ U.S. Drug Enforcement AdministrationDHS ............................................................... U.S. Department of Homeland SecurityDOC ............................................................... U.S. Department of CommerceDOT ............................................................... U.S. Department of TransportationEAA................................................................ Export Administration Act of 1979EDI................................................................. Electronic Data InterchangeEffective tax rate ............................................ Income tax expense expressed as a percentage of income before income taxesEPCRA........................................................... Emergency Planning & Community Right-To-Know Act of 1986EPS................................................................. Earnings Per ShareEU .................................................................. European UnionExchange Act ................................................. Securities Exchange Act of 1934FASB.............................................................. Financial Accounting Standards BoardFDA................................................................ U.S. Food and Drug AdministrationFDCA............................................................. Federal Food, Drug and Cosmetic ActFX .................................................................. Foreign Currency Exchange RateGAAP............................................................. U.S. Generally Accepted Accounting PrinciplesGHS ............................................................... Globally Harmonized SystemGross profit margin ........................................ Gross profit as a percentage of salesHHS ............................................................... U.S. Department of Health and Human ServicesHMR .............................................................. Hazardous Material RegulationsHMTA............................................................ Hazardous Materials Transportation ActLED................................................................ Light-Emitting DiodeMSDSs ........................................................... Material Safety Data SheetsNASDAQ....................................................... National Association of Securities Dealers Automated Quotation System
- ii -
NRC ............................................................... U.S. Nuclear Regulatory CommissionOSHA............................................................. Occupational Safety and Health Act of 1970Operating income margin .............................. Operating income as a percentage of salesPOTW ............................................................ Publicly Owned Treatment WorksPPA................................................................. Pollution Prevention Act of 1990R&D............................................................... Research and DevelopmentRCRA............................................................. Resource Conservation and Recovery Act of 1976REACH.......................................................... Registration, Evaluation and Authorization of ChemicalsReport............................................................. Sigma-Aldrich Corporation Annual Report on Form 10-K for the year ended
December 31, 2012Research......................................................... Research Chemicals Business UnitResearch Organics ......................................... Research Organics, Inc.RSU................................................................ Restricted Stock UnitSAFC ............................................................. Sigma-Aldrich Fine Chemicals Business UnitSangamo......................................................... Sangamo BioSciences, Inc.SARA............................................................. Superfund Amendments and Reauthorization Act of 1986SEC ................................................................ U.S. Securities and Exchange CommissionSecurities Act ................................................. Securities Act of 1933SFAS .............................................................. Statement of Financial Accounting StandardsSG&A............................................................. Selling, General and Administrative ExpenseSigma Chemical ............................................. Sigma Chemical CompanyTSCA ............................................................. Toxic Substances Control Act of 1976UK.................................................................. United KingdomUSDA............................................................. U.S. Department of AgricultureVS .................................................................. Veterinary ServicesZFP................................................................. Zinc Finger DNA Binding Protein
- iii -
Forward-Looking Statements
This Report may include or incorporate forward-looking statements within the meaning of Section 27A of the Securities Act and Section 21E of the Exchange Act that involve risks and uncertainties, including financial, business environment and projections, as well as statements that are preceded by, followed by or that include the words "believes," "can," "expects," "plans," "anticipates," "should" or similar expressions, and other statements contained herein regarding matters that are not historical facts. Additionally, this Report contains forward-looking statements relating to future performance, goals, strategic actions and initiatives and similar intentions and beliefs, including, without limitation, statements with respect to the Company's expectations, goals, beliefs, intentions and the like regarding future sales, earnings, return on equity, cost savings, process improvements, free cash flow, share repurchases, capital expenditures, acquisitions and other matters, as well as the information included in Item 7 of Part II of this Report - Management's Discussion and Analysis of Financial Condition and Results of Operations - 2013 Outlook. These statements are based on assumptions regarding Company operations, investments and acquisitions and conditions in the markets the Company serves.
The Company believes these assumptions are reasonable and well founded. The statements in this Report are subject to risks and uncertainties, including, among others, certain economic, political and technological factors. Actual results could differ materially from those stated or implied in this Report, due to, but not limited to, such factors as:
(1) global economic conditions, particularly the uncertainties in the Eurozone and other factors affecting the creditworthiness of our Eurozone customers;
(2) changes in pricing and the competitive environment and the global demand for the Company's products;(3) changes in foreign currency exchange rates;(4) changes in research funding and the success of research and development activities;(5) failure of planned sales initiatives in our Research, Applied and SAFC Commercial business units;(6) dependence on uninterrupted manufacturing operations, global supply chain and security of our information systems;(7) changes in the regulatory environment in which the Company operates;(8) changes in worldwide tax rates or tax benefits from domestic and international operations, including the matters
described in Note 11 – Income Taxes to the Company's consolidated financial statements in Item 8 - Financial Statements and Supplementary Data of Part II of this Report;
(9) exposure to litigation including product liability claims;(10) the ability to maintain adequate quality standards;(11) reliance on third party package delivery services;(12) an unanticipated increase in interest rates;(13) other changes in the business environment in which the Company operates;(14) acquisitions or divestitures of businesses; and (15) the outcome of the outstanding matters described in Note 12 – Contingent Liabilities and Commitments to the
Company's consolidated financial statements in Item 8 - Financial Statements and Supplementary Data of Part II of this Report.
A further discussion of the Company's risk factors can be found in Item 1A of Part I of this Report. The Company does not undertake any obligation to update these forward-looking statements.
- 1 -
PART I
Item 1. Business.(a) General Development of Business
The Company was incorporated under the laws of the State of Delaware in May 1975. Effective July 31, 1975 (the "Reorganization"), the Company succeeded, as a reporting company, Sigma International, Ltd., the predecessor of Sigma Chemical, and Aldrich Chemical, both of which had operated continuously for more than 20 years prior to the Reorganization. The Company's principal executive offices are located at 3050 Spruce Street, St. Louis, Missouri, 63103.
During 2012, the Company acquired two businesses with aggregated sales of $127 million in 2012. One of these companies was BioReliance, a provider of global biopharmaceutical testing services. It was acquired on January 31, 2012 for $353 million (net of $11 million of cash acquired). The Company also acquired Research Organics, a supplier of high purity biochemicals, on April 2, 2012.
(b) Financial Information About Segments
The Company operates in one segment. Information concerning sales for the Company's business units is provided in Note 14 – Company Operations by Business Unit to the Company's consolidated financial statements in Item 8 - Financial Statements and Supplementary Data of Part II of this Report.
(c) Narrative Description of Business
The Company is a leading Life Science and High Technology company. The Company develops, manufactures, purchases and distributes the broadest range of high quality chemicals, biochemicals and equipment available throughout the world and also provides global biopharmaceutical testing services. These chemical products, kits and services are used in scientific research, including genomic and proteomic research, biotechnology, pharmaceutical development and as key components in pharmaceutical, diagnostic and other high technology manufacturing. The Company operates in 37 countries, manufacturing approximately 50,000 of the 170,000 chemical and biochemical products it offers. The Company also offers approximately 45,000 equipment products. The Company sells into approximately 160 countries, servicing over 103,000 accounts representing over 1.4 million individual customers.
Products and Services
The Company provides products and services that focus on:• research customers that use smaller quantities of our products in basic life science and high-technology R&D;• manufacturing customers that use our products in larger quantities in lab-stage development and
manufacturing; • life science customers who use our biopharmaceutical testing services to facilitate the development,
manufacturing and commercialization of biological drugs; and• industrial and diagnostic companies that use our products in various forms of assays and testing as well as in
clinical diagnostics.
Historically, the Company has operated with the Research units of Essentials, Specialties and Biotech and SAFC. During 2012, the 3 Research units were condensed into 1 Research business unit. Effective January 1, 2013, the Company's business unit structure was realigned into 3 market-focused business units that are defined by the customers and markets they serve: Research, Applied and SAFC Commercial.
Research provides reagents and consumables to life sciences and non-profit research organizations. Applied provides raw materials and solutions for testing in clinical and industrial applications. SAFC Commercial provides manufacturing raw materials for commercial products.
Sales and Distribution
During 2012, the Company sold products and services to over 103,000 accounts representing over 1.4 million individual customers, including pharmaceutical companies, universities, commercial laboratories, industrial companies, biotechnology companies, non-profit organizations, governmental institutions, diagnostic, chemical and electronics companies and hospitals. Orders in laboratory quantities averaging approximately $400 accounted for 67 percent, 71 percent and 72 percent of the Company's net sales in 2012, 2011 and 2010, respectively. The Company also makes its chemical products available in larger-scale quantities for use in manufacturing. Sales of these products accounted for 33
- 2 -
percent, 29 percent and 28 percent of net sales in 2012, 2011 and 2010, respectively.
Customers and potential customers, wherever located, are encouraged to contact the Company by telephone or via its website (www.sigma-aldrich.com) to place orders or obtain technical staff consultation. Information on the website does not constitute a part of this Report. Shipments are made at least five days per week from all locations conducting distribution activities. The Company strives to ship its products to customers on the same day an order is received and carries inventory levels which it believes to be appropriate to maintain this practice.
Production and Purchasing
The Company has chemical production facilities in Madison, Milwaukee and Sheboygan, Wisconsin; St. Louis, Missouri; Lenexa, Kansas; Houston and Round Rock, Texas; Bellefonte, Pennsylvania; Haverhill and Natick, Massachusetts; Urbana, Illinois; Miamisburg, Ohio; Carlsbad, California; Laramie, Wyoming; Cleveland, Ohio; Australia; Brazil; Canada; Germany; India; Ireland; Israel; Japan; Singapore; Switzerland; Taiwan; and the United Kingdom. Biochemicals are primarily produced by extraction and purification from yeast, bacteria and other naturally occurring animal and plant sources. Organic and inorganic chemicals are primarily produced by synthesis. Chromatography media and columns are produced using proprietary chemical synthesis and proprietary preparation processes. Similar processes are used for filtration and sample collection processes.
There are approximately 170,000 chemical and biochemical products and 45,000 equipment products listed in the Sigma, Aldrich, Fluka and Supelco catalogs. The Company produces approximately 50,000 of the chemical and biochemical products, which represented approximately 60 percent of sales in 2012. Products not manufactured by the Company are purchased from many sources either under contract or in the open market.
None of the Company's 10,000 suppliers accounted for more than 5 percent of the Company's chemical, biologic or equipment purchases in 2012. The Company has generally been able to obtain adequate supplies of products and materials to meet its needs. No assurance can be given that shortages will not occur in the future.
Whether a product is produced by the Company or purchased from suppliers, it is subjected to the same quality control procedures. Quality Control is performed by a staff of chemists, biologists and lab technicians in our network of labs around the world.
Patents, Trademarks and Licenses
The Company holds approximately 470 issued or pending patents, over 630 licenses and has approximately 960 registered trademarks and trademark applications worldwide. The Company's significant trademarks are the brand names: "Sigma-Aldrich," "Sigma," "Aldrich," "Fluka," "Riedel-de Haën," "Supelco," "SAFC," "SAFC Biosciences," "SAFC Hitech," "Genosys," "Proligo," "Pharmorphix," "Cerilliant," "Vetec" and "SAGE Labs." Their related registered logos and trademarks are expected to be maintained indefinitely. Approximately 70 percent of the Company's issued patent portfolio has a remaining life of at least five years.
The Company is aware of the desirability for patent and trademark protection for its products. The Company believes that other than its brand names, no single patent, license or trademark (or related group of patents, licenses or trademarks) is material in relation to its business as a whole.
In addition to patents, the Company relies on trade secrets and proprietary know-how. The Company seeks protection of these trade secrets and proprietary know-how, in part, through confidentiality and proprietary information agreements. The Company makes efforts to require its employees, directors, consultants and advisors, outside scientific collaborators and sponsored researchers, other advisors and other individuals and entities to execute confidentiality agreements upon the start of employment, consulting or other contractual relationships with the Company. These agreements provide that all confidential information developed or made known to the individual or entity during the course of the relationship is to be kept confidential and not disclosed to third parties except in specific circumstances. In the case of employees and some other parties, the agreements provide that all inventions conceived by the individual will be the Company's exclusive property. These agreements may not provide meaningful protection for or adequate remedies to protect the Company's technology in the event of unauthorized use or disclosure of information. Furthermore, the Company's trade secrets may otherwise become known to, or be independently developed by, its competitors.
Dependence on a Single Customer or Product
During the year ended December 31, 2012, no single customer accounted for more than 2 percent, and no single product accounted for more than 1 percent of the Company's net sales.
- 3 -
Backlog
The vast majority of customer orders are shipped from inventory on the day ordered, resulting in limited backlog. Individual items may occasionally be out-of-stock. These items are shipped as soon as they become available. Some orders for larger scale quantities specify a future delivery date, which we exclude from our backlog calculation. At December 31, 2012, the backlog of firm orders was not significant at about 3.5 percent of sales. The Company anticipates that substantially all of the backlog as of December 31, 2012 will be shipped during 2013.
Competition
The markets for the Company's products, services and technologies are both competitive and price sensitive. The Company believes it is a major supplier of biochemical and organic chemical products and kits used in scientific research and testing laboratories, including industrial applications, genomic and proteomic research, biotechnology, pharmaceutical development and as key components in pharmaceutical, diagnostic, environmental and other high technology manufacturing. The Company offers approximately 215,000 chemical, biologic and equipment items, some of which are unique with limited demand. There are many competitors that offer a narrower range of chemicals and many others offering a broader range of equipment products.
In all product areas, the Company competes primarily on the basis of customer service, product availability, quality and price. The Company's main marketing vehicles include its website, www.sigma-aldrich.com, as well as printed catalogs under the Sigma, Aldrich, Fluka and Supelco brands. These catalogs are supplemented with advertisements in life science, chemical and other scientific journals and trade publications, the mailing of special product brochures, the electronic distribution of various advertisements and product data, social media, news releases related to new product offerings and through personal visits with customers from management, sales and technical representatives.
Compliance With Regulations
The Company believes that it is in compliance in all material respects with federal, state and local regulations relating to the manufacture, sale and distribution of its products. The following are brief summaries of some of the federal laws and regulations which may have an impact on the Company's business. These summaries are only illustrative of the extensive regulatory requirements of federal, state and local governments and are not intended to provide the specific details of each law or regulation.
The Company also conducts its global business in compliance with or analogous to the following statutes and regulations as promulgated in the more than 160 countries into which we sell our products.
The Chemical Safety Information, Site Security and Fuels Regulatory Relief Act of 1999, and the regulations promulgated thereunder, regulate the handling and storage of certain flammable fuels and require an associated risk management program.
The CAA, as amended, and the regulations promulgated thereunder, regulate the emission of harmful pollutants to the air outside of the work environment. Federal or state regulatory agencies may require companies to acquire permits, perform monitoring and install control equipment for certain pollutants.
The Chemical Facility Anti-Terrorism Standard and the regulations promulgated thereunder, regulate facilities that manufacture, use, store or distribute certain chemicals above a listed Screening Threshold Quantity. A regulated facility must complete and submit a Chemical Security Assessment Tool, Top-Screen by January 19, 2008 or within 60 calendar days of coming into possession of the listed chemicals at or above the listed Screening Threshold Quantity. If required by the DHS, the facility must complete and submit to the DHS, a Security Vulnerability Assessment and Site Security Plan. The Company has several sites subject to this standard.
The CWA, as amended, and the regulations promulgated thereunder, regulate the discharge of harmful pollutants into the waters of the United States. Federal or state regulatory agencies may require companies to acquire permits, perform monitoring and treat wastewater before discharge to the waters of the United States or a POTW.
The CERCLA and the SARA, and the regulations promulgated thereunder, require notification of certain chemical spills and notification to state and local emergency response groups of the availability of MSDSs and the quantities of hazardous materials in the Company's possession. SARA, and the regulations promulgated thereunder, also stress the importance of permanent remedies and innovative treatment technologies to clean up hazardous waste sites.
The EPCRA, as amended, and the regulations promulgated thereunder, regulate MSDSs, chemical inventories and chemical release reporting. The EPCRA also requires coordinated emergency planning with state and local agencies.
The OSHA, including the Hazard Communication Standard (Right to Know), and the regulations promulgated thereunder, require the labeling of hazardous substance containers, the supplying of MSDSs on hazardous products to customers and
- 4 -
hazardous substances to which an employee may be exposed in the workplace, the training of employees in the handling of hazardous substances and the use of the MSDSs, along with other health and safety programs.
The PPA, as amended, and the regulations promulgated thereunder, focus on reducing the amount of pollution through cost-effective changes in production and raw materials usage. Pollution prevention also includes other practices that increase efficiency in the use of energy, water or other natural resources, and protect our resource base through conservation.
The RCRA, as amended, and the regulations promulgated thereunder, require certain procedures regarding the treatment, storage and disposal of hazardous waste.
The TSCA, and the regulations promulgated thereunder, require reporting, testing and pre-manufacture notification procedures for certain chemicals. Exemptions are provided from some of these requirements with respect to chemicals manufactured in small quantities solely for R&D use.
The DOT has promulgated regulations pursuant to the HMTA referred to as the HMR, which set forth the requirements for hazard labeling, classification, packaging of chemicals and shipment modes for products destined for shipment in interstate commerce.
The HMTA, and the regulations promulgated thereunder, seek to protect against risks to life, property and the environment that are inherent in the transportation of hazardous materials in intrastate, interstate and foreign commerce. HMTA regulates the transportation of dangerous goods via air, highway, rail and water. The Company ships and receives materials subject to the HMTA.
REACH, the EUs legislation covering the manufacturing and importation of chemicals, became law in 2007. A number of substances were registered under REACH in 2012. The next batch of substance registrations is due in 2013. Over the next five and one half years, the number of registrations will increase significantly. Additionally, the amount of products imported or manufactured must be monitored and more information must be passed along the supply chain. The costs to comply with REACH depend on the behavior of the other participants in the supply chain. So far, the costs have not been greater than what we expected.
The GHS is altering the rules for classification, labeling and, to some extent, the content of our MSDSs. In 2012 the system was implemented in the U.S. Countries in Asia and South America will follow soon. All hazardous products in our product portfolio will be affected and have to be reclassified.
The USDA, APHIS and VS regulate the importation and exportation of animal-derived materials to ensure that exotic animal and poultry diseases are not transferred. The USDA has issued permits and site approvals to several Company sites.
The DEA enforces the controlled substances laws and regulations of the U.S. The DEA has issued licenses to several Company sites to permit importation, manufacture, research, analysis, distribution and export of certain products regulated by the DEA. The Company screens customer orders involving products regulated by the DEA to verify that a license, if necessary, has been obtained.
The NRC licenses and regulates the nation's civilian use of byproduct, source and special nuclear materials in order to ensure the adequate protection of public health and safety, promote common defense and security and protect the environment. The NRC has issued licenses to several Company sites to permit exportation of certain products regulated by the NRC. The Company screens customer orders involving products regulated by the NRC to verify that a license, if necessary, has been obtained.
The DOC promulgated the Export Administration Regulations pursuant to the EAA, as amended, to regulate the export of certain products to specific destinations by requiring a special export license. The Company obtains several export licenses per year from the DOC. The Company reviews orders of specific regulated materials being exported to certain destinations to ensure the proper license is obtained.
The CDC regulates select agents and toxins. The HHS and the USDA published final rules, which implement the provisions of the Bioterrorism Act, setting forth the requirements for possession, use, and transfer of select agents and toxins. The CDC has issued one site license to the Company to permit the storage and transfer of these materials.
The Public Health Security Act and the Bioterrorism Act regulate the imports of food and certain food substances. The Bioterrorism Act requires that the FDA receive prior notice of food items imported into the U.S. and register facilities handling such items. The Company has registered several sites under the Bioterrorism Act to enable the importation and handling of these items.
The Company engages principally in the business of selling products that are not foods or food additives, drugs or cosmetics within the meaning of the FDCA. However, a limited number of the Company's products are subject to labeling, manufacturing and other provisions of the FDCA.
- 5 -
The Company is registered with the U.S. Department of State's Directorate of Defense Trade Controls as a manufacturer and exporter of products listed on the U.S. Munitions List. The Company reviews orders of these regulated materials being exported to certain destinations to ensure the proper license is obtained.
The Company's import declarations to the CBP represent several thousand entries and individual transaction lines from numerous countries. Within the Company's U.S. operations, imports encompass a wide array of harmonized tariff codes. These codes are largely represented in Chapters 28, 29 and 38 of the U.S. Harmonized Tariff Schedule, representing organic and inorganic chemicals and compounds and miscellaneous chemical products. These imports are subject to the Tariff Act of 1930, the Customs Modernization Act of 1993 and Title 19 of the Code of Federal Regulations.
R&D
R&D expenses were 2.6 percent of net sales in 2012 and 3.0 percent percent of net sales in both 2011 and 2010. The R&D expenses relate primarily to efforts to add new manufactured products and enhance manufacturing processes. Self-manufactured products accounted for approximately 60 percent of net sales in 2012.
Number of Persons Employed
The Company had approximately 9,000 employees as of December 31, 2012. The total number employed in the United States was approximately 4,500 with the remaining 4,500 employed by the Company's international subsidiaries. The Company employs approximately 3,300 people who have degrees in chemistry, biochemistry, engineering or other scientific disciplines, including approximately 420 with Ph.D. degrees.
Approximately 185 of the 4,500 persons employed by the Company's international subsidiaries were members of unions. None of the Company's employees in the United States were members of unions. The Company believes its labor relations are good.
(d) Financial Information About Geographic Areas and Business Units
Information concerning sales by geographic area and business unit for the years ended December 31, 2012, 2011 and 2010, is located in Note 14 – Company Operations by Business Unit to the Company's consolidated financial statements in Item 8 - Financial Statements and Supplementary Data of Part II of this Report.
The Company's net sales to customers located outside the United States were 65 percent in 2012 and 66 percent in both 2011 and 2010. These sales were made directly by the Company, by its subsidiaries located in 37 other countries and by a global network of independent distributors.
(e) Available Information
The Company's Annual Reports on Form 10-K, Quarterly Reports on Form 10-Q, Current Reports on Form 8-K, Definitive Proxy Statements on Schedule 14A and amendments to reports filed pursuant to Sections 13(a) and 15(d) of the Exchange Act are available on the Company's web site at www.sigma-aldrich.com as soon as reasonably practicable after being filed electronically with or furnished to the SEC. The information on the website does not constitute part of this Report.
- 6 -
(f) Executive Officers of the Registrant
The executive officers of the Registrant are:
Name of Executive Officer Age Positions and Offices Held
Jan A. Bertsch 56 Executive Vice President, Chief Financial Officer and TreasurerGilles A. Cottier 54 Executive Vice President and President, SAFC CommercialEric M. Green 43 Executive Vice President and President, ResearchMichael F. Kanan 49 Vice President and Corporate ControllerGeorge L. Miller 58 Senior Vice President, General Counsel & Secretary
Karen J. Miller 55 Senior Vice President, Corporate Development and Corporate Communications
Douglas W. Rau 56 Vice President, Human ResourcesRakesh Sachdev 56 President and Chief Executive OfficerFranklin D. Wicks 59 Executive Vice President and President, Applied
There is no family relationship between any of the officers or directors. These officers serve at the pleasure of the Board subject to the terms of any employment or similar agreements.
Ms. Bertsch has been Executive Vice President and Chief Financial Officer of the Company since March 2012 and took on the role of Treasurer in September 2012. She was previously Vice President, Controller and Principal Accounting Officer of Borg Warner Inc. from August 2011 to February 2012 and Vice President and Treasurer of Borg Warner Inc. from December 2009 to July 2011. From July 2008 to November 2009, Ms. Bertsch was Senior Vice President, Treasurer and Chief Information Officer for Chrysler Group, LLC and Chrysler LLC, and from May 2006 to June 2008, she was Chief Information Officer of Daimler Chrysler's Chrysler Group and Mercedes Benz NAFTA organizations and Chrysler LLC.
Mr. Cottier was named Executive Vice President and President, SAFC Commercial of the Company in January 2013. Prior to that, he was President of SAFC since January 2009 and was made an Executive Vice President of the Company in 2011. He served as President of the Research Essentials business unit of the Company from July 2005 until January 2009.
Mr. Green was named Executive Vice President and President, Research of the Company in January 2013. Prior to that, he was Vice President and Managing Director, International (or APLA) of the Company since October 2009. Previously, he served as Vice President, International Sales and Operations of the Company from August 2005 to September 2009.
Mr. Kanan has been Vice President and Corporate Controller of the Company since April 2009. Prior to that, he served as Vice President Finance-Light Vehicle Systems of ArvinMeritor from October 2006 to April 2009.
Mr. Miller has been Senior Vice President, General Counsel and Secretary of the Company since October 2009. Prior to that, he served as General Counsel of Novartis Services, Inc. from September 2008 to September 2009, and as General Counsel of Novartis Corporation from December 2005 to August 2008.
Ms. Miller was named Senior Vice President, Corporate Development and Corporate Communications of the Company in January 2013. Prior to that, she was Senior Vice President, Strategy & Corporate Development of the Company since May 2009 and was previously Vice President, Strategy & Corporate Development of the Company from January 2009 through May 2009. Prior to that, she served as Controller of the Company for more than five years.
Mr. Rau has been Vice President, Human Resources of the Company since October 2005.
Mr. Sachdev has been President and Chief Executive Officer of the Company since November 2010. He previously served as Senior Vice President, Chief Financial Officer and Chief Administrative Officer of the Company from May 2009 to November 2010. Previously, he served as Vice President and Chief Financial Officer of the Company from November 2008 to May 2009. Prior to that, he served as Senior Vice President and President, Asia Pacific of ArvinMeritor from March 2007 to July 2008.
Dr. Wicks was named Executive Vice President and President, Applied of the Company in January 2013. Prior to that, he was President of Research and has been an Executive Vice President of the Company since February 2011. He previously served as President of the Research Essentials and Specialties business units of the Company from January 2009 to February 2011 and Managing Director-U.S & Canada from January 2010 to February 2011. Prior to that, he served as President of SAFC for more than five years.
- 7 -
Item 1A. Risk Factors.
Our business is subject to certain risks and uncertainties, including, among others, certain economic, political and technological factors. You should carefully consider the risk factors below, together with other matters described in this Report or incorporated herein by reference, in evaluating our business and prospects. If any one or more of the following risks occurs, our business, financial condition or operating results could be adversely impacted and the trading price of our common stock could decline. Additional risks not presently known to us or that we currently deem immaterial may also adversely impact our business, financial condition and operating results.
Risks Related to Our Sales and Operations
Our performance may be affected by the economic conditions in the U.S. and in other nations where we do business.
Declining economic conditions may have a negative impact on our consolidated results of operations, financial condition and cash flows. Overall demand for our products could be reduced as a result of a global economic recession, especially in such customer segments as the pharmaceutical, biotechnology, diagnostic, chemical and electronics industries and academia.
We face significant competition, including changes in pricing.
The markets for our products and services are both competitive and price sensitive. Many of our competitors have significant financial, operations, sales and marketing resources and experience in research and development. Our industry remains fragmented with few companies possessing a significant share in any particular market, which allows some participants to continue consolidating specialty, regional and niche players in the industry. Competitors could develop new technologies that compete with our products and services or even render our products obsolete. If a competitor develops superior technology or cost-effective alternatives to our products and services, our business could be harmed.
The markets for some of our products are also subject to specific competitive risks because these markets are highly price competitive. Our competitors have competed in the past by lowering prices on certain products. If they do so again, we may be forced to respond by lowering our prices. This may reduce profits and possibly sales. Failure to anticipate and respond to price competition may also impact sales and profits.
We believe customers in our markets display a significant amount of loyalty to their supplier of a particular product. To the extent we are not the first to develop, offer and/or supply new products, customers may buy from our competitors or make materials themselves, causing our competitive position to suffer.
Our sales and results of operations are dependent on the research and development spending patterns at pharmaceutical, biotechnology and diagnostic companies.
A number of factors impact the amount of money spent on the purchase of research and development products by our customers. Many of our pharmaceutical customers reduced or redirected R&D spend over the past several years in all geographic areas. The Company does not have the ability to predict when this trend will reverse or the ultimate impact on demand for our products. Activities within these pharmaceutical companies, which are impacting demand for our products, include various programs to contain costs, shift from discovery to clinical research and mitigate risk in the supply chain through intense vendor management and consolation.
The credit crisis commencing in 2008 impacted the ability of small, emerging pharmaceutical, biotechnology and diagnostic companies to access funding. Venture capital funding has since recovered modestly, but not at the levels seen prior to 2008. The degree of funding will impact demand, and the extent to which demand from these customers will continue to be impacted is unknown.
Approximately 44 percent of the Company's revenues for the year ended December 31, 2012 are from pharmaceutical, biotechnology and diagnostic companies.
Our sales and results of operations depend on our customers' research and development efforts and their ability to obtain funding for these efforts.
Our customers include researchers at companies in the pharmaceutical, biotechnology, diagnostic, chemical, electronics and related industries, academic institutions, government laboratories and private foundations. Fluctuations in the R&D budgets of these researchers and their organizations could have a significant effect on the demand for our products. Our customers determine their R&D budgets based on several factors, including the need to develop new products, the availability of governmental and other funding, competition and the general availability of resources. As we continue to expand our international operations, we expect R&D spending levels in markets outside of the U.S. will become increasingly important to us.
R&D budgets fluctuate due to changes in available resources, spending priorities, general economic conditions, institutional and governmental budgetary limitations and mergers of companies in the key industry sectors we serve. Our business could be
- 8 -
seriously harmed by any significant decrease in life science and high technology R&D expenditures by our customers. By way of example, since 2009 there have been significant reductions in research staff of both U.S. and European-based pharmaceutical companies.
A small portion of our sales have been to researchers whose funding is dependent on grants from government agencies across the globe. In the U.S., these agencies include the U.S. National Institute of Health, the National Science Foundation, the National Cancer Institute and similar agencies or organizations. Government funding of research and development is subject to the political process, which is often unpredictable. Other government sponsored programs, or general efforts to reduce government budget deficits, could be viewed by the government as a higher priority. Any shift away from funding of life science and high technology R&D or delays surrounding the approval of governmental budget proposals may cause our customers to delay or forego purchases of our products and services, which could damage our business.
Some of our customers receive funds from approved grants at a particular time of year, many times set by government budget cycles. In the past, such grants have been frozen for extended periods or have otherwise become unavailable to various institutions without advance notice. The timing of the receipt of grant funds may affect the timing of purchase decisions by our customers and, as a result, cause fluctuations in our sales and operating results.
Likewise, public support of R&D in key markets in Europe and elsewhere has come under pressure which may lead to decreased sales of our Research products in those jurisdictions.
Due to heavy reliance on manufacturing and related operations to produce, package and distribute the products we sell, our business could be adversely affected by disruptions of these operations.
We rely upon our manufacturing operations to produce products accounting for approximately 60 percent of our sales. Our quality control, packaging and distribution operations support all of our sales. Any significant disruption of those operations for any reason, such as labor unrest, power interruptions, fire or other events beyond our control, could adversely affect our sales and customer relationships and therefore adversely affect our business. While insurance coverage may reimburse us, in whole or in part, for profits lost from such disruptions, our ability to provide these products in the longer term may affect our sales growth expectations and results.
We have limited redundancies and back-up in our global distribution network. Our global distribution, including for our U.S. customers, is handled primarily by automated warehouses in Milwaukee, Wisconsin and Schnelldorf, Germany. The efficiency and effectiveness of our global distribution network would be significantly compromised if these warehouses were impacted by natural disasters or other local disruption. If a disruption occurs, we may not be able to secure alternate distribution and replace the compromised inventory in a timely manner, causing deterioration in our current service levels. Failure to do so could have a material adverse effect on our business and results of operations.
If we experience a significant disruption in our information technology systems or if we fail to implement new systems and software successfully, our business could be adversely affected.
We depend on information systems throughout the Company to control our manufacturing processes, process orders, manage inventory, process and bill shipments to and collect cash from our customers, respond to customer inquiries, contribute to our overall internal control processes, maintain records of our property, plant and equipment and record and pay amounts due vendors and other creditors. Additionally, in 2012, approximately 51 percent of the Company's research sales originated through e-commerce. Our systems could also be subject to viruses, break-ins, sabotage, acts of terrorism, acts of vandalism, hacking, cyber-terrorism and similar misconduct. If we were to experience a prolonged disruption in our information systems that involve interactions with customers and suppliers, it could result in the loss of sales and customers and/or increased costs, which could adversely affect our business.
We are subject to regulation by various federal, state, local and foreign agencies that require us to comply with a wide variety of regulations, including those regarding the manufacture and distribution of products and environmental matters.
Some of our operations are subject to regulation by various U.S. federal agencies and similar state and international agencies, including the DOC, FDA, DOT, USDA and other comparable U.S., state, local and foreign governmental agencies. These regulations govern a wide variety of product activities, from design and development to labeling, manufacturing, handling, sales, distribution, importing and exporting of products. If we fail to comply with any or all of these regulations, we may be subject to fines or penalties, have to recall products and/or cease their manufacture and distribution, which would increase our costs and reduce our sales.
In addition to the foregoing, we have agreements in place for the sale of our products to government entities; consequently, we are subject to various statutes and regulations that apply to companies doing business with the government. A failure to comply with these statutes and regulations could result in suspension of these contracts, criminal, civil and administrative penalties or debarment.
- 9 -
We may be exposed to certain regulatory and financial risks related to climate change.
Our manufacturing processes for certain products involve the use of chemical and other substances that are regulated under various international, federal, state and local laws governing the environment. In the event that any future climate change legislation would require that stricter standards be imposed by domestic or international environmental regulatory authorities with respect to the use and/or levels of possible emissions from such chemicals and/or other substances, we may be required to make certain changes and adaptations to our manufacturing processes. There can be no assurance that any such changes would not have a material effect on our financial condition.
Another potential effect of climate change is an increase in the severity of global weather conditions. Although we believe that we have an adequate disaster recovery plan in place, severe weather conditions, including earthquakes, hurricanes, tornadoes and/or tsunami, could potentially cause significant damage to our manufacturing facilities in locations such as California, Taiwan or St. Louis. There can be no assurance that the effects of such damage and the resultant disruption of manufacturing operations would not have a materially adverse impact to our financial results.
We are subject to regulations that govern the handling of hazardous substances.
We are subject to various federal, state, local and international laws and regulations that govern the handling, transportation, manufacture, use, storage, disposal and sale of substances that are or could be classified as toxic or hazardous substances. Some risk of environmental and property damage and environmental liabilities, including potential cleanup liability relating to currently or formerly owned or operated sites or third party disposal sites and liabilities relating to the exposure to hazardous substances, is inherent in our operations and the products we manufacture, sell or distribute. Any failure by us to comply with the applicable government regulations could also result in product recalls or impositions of fines and restrictions on our ability to carry on with or expand a portion or possibly all of our operations. If we fail to comply with any or all of these regulations, we may be subject to fines or penalties, have to recall products and/or cease their manufacture and distribution, which would increase our costs and reduce our sales.
Changes in worldwide tax rates or tax benefits will impact our tax expense and profits.
We are subject to a variety of taxes in numerous local, regional, national and international jurisdictions. The laws regulating the taxes to which we are subject may change. We have no control over these changes and their impact, if any, on our results. Additionally, results of tax audit activity may also impact our tax provisions and our profits. We reflect changes in our actual or forecast income tax rates as relevant facts and circumstances become known to us. Variations to our forecast tax rates and forecast diluted EPS in the future are possible due in part to tax rate changes and changes in the status of tax uncertainties pursuant to ASC Subtopic 740-10.
Litigation may harm our business.
Substantial, complex or extended litigation could cause us to incur significant costs and distract our management. For example, lawsuits by employees, stockholders, collaborators, distributors, customers, competitors or others with protected intellectual property could be very costly and substantially disrupt our business. Disputes from time to time with such companies, organizations or individuals are not uncommon, and we cannot assure you that we will always be able to resolve such disputes or do so on terms favorable to us. Unexpected results could cause us to have financial exposure in these matters in excess of recorded reserves and insurance coverage, requiring us to provide additional reserves to address these liabilities, therefore impacting profits.
Potential product liability claims could affect our earnings and financial condition and harm our reputation.
We face potential liability claims arising out of the use of or exposure to our products and/or services. We carry product liability insurance coverage, generally available in the market, but which is limited in scope and amount. Our products are generally used by trained scientists and operators, however, there is no assurance that they will be used in accordance with our terms and conditions of sale. As a result, we could be forced to defend ourselves in connection with the use of these products or services.
Although we seek to reduce our potential liability through measures such as contractual indemnification provisions with customers and/or suppliers, we cannot assure you that such measures will be enforced or effective. Our financial position could be materially and adversely affected if we were required to pay damages or incur defense costs in connection with a claim that is outside the scope of the indemnification agreements, if the indemnity, although applicable, is not executed in accordance with its terms or if our liability exceeds the amount of applicable insurance or indemnification. There can be no assurance that our insurance coverage will be adequate or that insurance coverage will continue to be available on terms acceptable to us. Unexpected results could cause us to have financial exposure in these matters in excess of recorded reserves and insurance coverage, requiring us to provide additional reserves to address these liabilities, impacting profits.
- 10 -
If we fail to maintain adequate quality standards for our products and services, our business may be adversely affected and our reputation harmed.
Our life science and high technology customers are often subject to rigorous quality standards to obtain and maintain regulatory approval of their products and the manufacturing processes that generate them. A failure to maintain, or in some instances upgrade, our quality standards to meet our customers' needs could result in the loss of a customer's regulatory license and potentially substantial sales losses to us.
We heavily rely on third party air cargo carriers and other package delivery services, and a significant disruption in these services or significant increases in prices may disrupt our ability to ship products or import materials, increase our costs and lower our profitability and harm our reputation.
We emphasize our prompt service and shipment of products as a key element of our sales and marketing strategy. We ship a significant number of products to our customers through independent package delivery companies. In addition, we transport materials between our worldwide facilities and import raw materials from worldwide sources. Consequently, we heavily rely on both sea and air cargo carriers and other third party package delivery providers. If any of our key third party providers were to experience a significant disruption such that any of our products, components or raw materials could not be delivered in a timely fashion or we would incur additional costs that we could not pass on to our customers, our costs may increase and our relationships with certain customers may be adversely affected. In addition, if these third party providers increase prices, and we are not able to find comparable alternatives or make adjustments to our selling prices, our profitability could be adversely affected.
If we fail to attract and retain key personnel, our business could be adversely affected.
Most of our products and services are highly technical in nature. In general, only highly qualified and trained scientists have the necessary skills to develop, manufacture and market our products and provide our services. In addition, some of our manufacturing, quality control, safety and compliance, information technology, sales and e-commerce related positions require persons possessing highly technical skills. Our success depends in large part upon our ability to identify, hire, retain and motivate highly skilled professionals. We face intense competition for these professionals from our competitors, customers, marketing partners and other companies throughout the industries in which we compete. Any failure on our part to hire, train and retain a sufficient number of qualified professionals would seriously damage our business.
We depend heavily on the services of our senior management. We believe that our future success depends on the continued services of our management team. Our business may be harmed by the loss of a significant number of our senior management members in a short period of time.
Our business may be adversely affected by a decrease in the availability of commercial paper or other forms of credit.
We had $381 million of commercial paper outstanding at December 31, 2012. If the market for commercial paper or other forms of credit becomes restricted or unavailable, our business could be adversely affected including our consolidated results of operations, financial condition and cash flows.
Our sales and operating results may vary from period to period.
Our sales and operating results may vary significantly from quarter to quarter and from year to year, depending on a variety of factors including, without limitation, those previously identified within other risk factors and the following:
• the timing of our R&D, sales and marketing expenses and other charges;
• the timing of significant custom sales orders, typically associated with our SAFC Commercial business;
• the expected higher level of sales growth in our SAFC Commercial business creating downward pressure on overall gross profit margins;
• an increase in the sale of commoditized Research products creating downward pressure on overall gross profit margins;
• changes in GAAP; and
• unanticipated loss of market value of the securities we hold that are traded on public markets.
Our expense levels are based in part on our future sales expectations. Consequently, sales or profits may vary significantly from quarter to quarter or from year to year, and sales and profits in any interim period may not be indicative of results in subsequent periods.
Our share price will fluctuate.
Both the market price and the daily trading volume of our common stock may continue to be subject to significant fluctuations due not only to general stock market conditions but also to a change in sentiment in the market regarding our operations and business prospects. In addition to the risk factors discussed above, the price and volume volatility of our common stock may be
- 11 -
affected by:
• operating results that vary from the expectations of securities analysts and investors;
• the financial performance of the major end markets that we target;
• the operating and securities price performance of companies that investors consider to be comparable to us;
• announcements of strategic developments, acquisitions and other material events by us or our competitors; and
• changes in global financial markets and global economies and general market conditions, such as interest or foreign exchange rates, commodity and equity prices and the value of financial assets.
Dividends on our common stock could change in the future.
In fiscal year 2012, we issued annual dividends of $0.80 per share, and in fiscal year 2011, we issued annual dividends of $0.72 per share. In the future, the Board may continue to annually increase our common stock dividend, or reduce or eliminate our common stock dividend in order to fund investments for growth, repurchase shares or conserve capital resources.
Technology innovations in the markets that we serve may create alternatives to our products and result in reduced sales.
Technology innovations, which our current and potential customers might have access to, could reduce or eliminate their need for our products. A new, competing or other disruptive technology that reduces or eliminates the use of one or more of our products could negatively impact the sale of those products. Our customers also constantly attempt to reduce their manufacturing costs and improve product quality. We may be unable to respond on a timely basis to any or all of the changing needs of our customer base. Our failure to develop, introduce or enhance products able to compete with new technologies in a timely manner could have an adverse effect on our business, results of operations and financial condition. Furthermore, specific industries in which we strategically place investments, such as the LED industry, may not generate expected returns as new technologies are generated.
Demand for our products and services is subject to the commercial success of our customers' products, which may vary for reasons outside our control.
Even if we are successful in securing utilization of our products in a customer's manufacturing process, sales of many of our products and services remain dependent on the timing and volume of the customer's production, over which we have no control. The demand for our products depends on regulatory approvals and frequently depends on the commercial success of the customer's supported product. Regulatory processes are complex, lengthy and expensive and can often take years to complete. Commercial success of a customer's product, which would drive demand in their production and commensurate demand for our products and services, is dependent on many factors, some of which can change rapidly, despite early positive indications.
Rapid changes in the healthcare industry could directly or indirectly adversely affect our business.
A significant portion of our sales is derived from companies in the healthcare industry. This industry has undergone significant changes in an effort to control costs. These changes include:
• development of large and sophisticated group purchasing organizations;
• healthcare reform legislation;
• consolidation of pharmaceutical companies;
• increased outsourcing of certain activities, including biotechnology and pharmaceutical, to low-cost offshore locations;
• lower reimbursements for R&D; and
• legislative limitations on healthcare research.
We expect the healthcare industry to continue to change in the future. Some of these potential changes, such as a reduction in governmental support of healthcare services or adverse changes in legislation or regulations governing the ability to perform healthcare related research and the delivery or pricing of healthcare services or mandated benefits, may cause healthcare industry customers to purchase fewer of our products and services or to reduce the prices they are willing to pay for our products or services.
We may be unable to establish and maintain collaborative development and marketing relationships with business partners, which could result in a decline in sales or slower than anticipated growth rates.
As a part of our business strategy, we have formed, and intend to continue to form, strategic alliances and distribution arrangements with partners relating to the development and commercialization of certain of our existing and potential products to increase our sales and to leverage our product and service offerings. Our success will depend, in part, on our ability to
- 12 -
maintain these relationships and to cultivate additional, acceptable strategic alliances with such companies.
In addition, we cannot ensure that parties with which we have established, or will establish, collaborative relationships will not, either directly or in collaboration with others, pursue alternative technologies or develop alternative products in addition to, or instead of, products offered as a result of these collaborations. Our business partners may also experience financial or other difficulties that lessen their value to us and to our customers. Our results of operations and opportunities for growth may be adversely affected by our failure to establish and maintain successful collaborative relationships.
Lack of early success with our pharmaceutical and biotechnology customers could exclude us from future business with those customers.
A number of the products we sell to pharmaceutical and biotechnology customers are incorporated into the customers' drug manufacturing processes. In some cases, once a customer chooses a particular product for use in a drug manufacturing process, it is unlikely that the customer will later switch to a competing alternative. In many cases, the regulatory license for the product will specify the products qualified for use in the process. Obtaining the regulatory approvals needed for a change in the manufacturing process is time consuming, expensive and uncertain. Accordingly, if a pharmaceutical or biotechnology customer does not select our products early in its manufacturing design phase for any number of reasons, including, but not limited to, cost, ease of use, ability to supply large quantities or similar reasons, we may lose the opportunity to participate in the customer's manufacturing of such product. Because we face competition in this market from other companies, we run the risk that our competitors could win significant early business with a customer making it difficult for us to recover the late stage commercialization opportunity.
We have significant inventories on hand.
We maintain significant inventories and have an allowance for slow-moving and obsolete inventory. Any significant unanticipated changes in future product demand or market conditions, including the current uncertainty in the global market, could also have an impact on the value of inventory and adversely impact our results of operations. Additionally, if it would become necessary to rework product to make it saleable, this additional effort would impact cost and our operating results.
We expect to continue to implement various process improvement initiatives that may not achieve the desired results.
We have implemented a number of changes designed to improve operating efficiencies and reduce costs. In fiscal year 2012, we reduced our workforce by approximately 160 people. This restructuring program and regular ongoing evaluations of our cost structure could have the effect of reducing our talent pool and available resources and, consequently, could have long-term effects on our business by decreasing or slowing improvements in our products, affecting our ability to respond to customers and limiting our ability to hire and retain key personnel. We expect to continue to identify opportunities for operational efficiencies and cost reduction and implement changes to achieve these efficiencies. Such improvements may lead to, among other things, the consolidation and integration of products, brands, facilities, functions, systems and processes, any or all of which might present significant management challenges. There can be no assurance that such actions will be accomplished as rapidly as anticipated or that the full extent of expected cost reductions will be achieved.
Risks Related to Growth of Our Business
Acquisitions are an important part of our growth strategy.
We have acquired or invested in several businesses and technologies and routinely review additional opportunities. Certain risks exist including, without limitation, the potential for:
• the acquisition or investment failing to provide the benefits originally anticipated by management;
• difficulties in integrating the operations and systems of the acquired businesses and in realizing operating synergies;
• difficulties in assimilating and retaining employees and customers of the acquired companies;
• management's attention being diverted to the integration of the acquired businesses or acceptance of the acquired technology;
• rising interest rates on debt needed to provide cash to fund the purchase price of acquisitions; and
• unanticipated contract or regulatory issues.
None of these difficulties have been historically significant, but if they were to be in the future, we may be unable to achieve expectations from our acquisition strategy. In addition, we compete with other companies for suitable acquisition targets and may not be able to acquire certain targets that we seek. Also, certain businesses we have acquired or invested in may not generate the cash flow and/or earnings or other benefits we anticipated at the time of their acquisition. If we are unable to successfully complete and integrate acquisitions in a timely manner, such acquisitions may adversely affect our profitability. In
- 13 -
addition, if we are unable to hire and retain key management personnel, we may not be able to execute our acquisition strategy.
We must continually offer new products and technologies.
Our success depends in large part on continuous and timely development and introduction of new products that address evolving customer needs and changes in the market. We also believe that because of the initial time investment required by many of our customers to reach a purchasing decision for a new product, it may be difficult to regain that customer once the customer purchases a product from a competitor.
These facts have led us to focus significant efforts and resources on the development and identification of new technologies and products. As a result, we have a very broad product line and are continually seeking to develop, license or acquire new technologies and products to further broaden our offering. If we fail in these efforts, our customers likely will purchase products from our competitors, significantly harming our business. Once we develop or obtain a technology, to the extent that we fail to timely introduce new and innovative products that are accepted by our markets, we could fail to obtain an adequate return on our R&D, licensing and acquisition investments and could lose market share to our competitors, which would be difficult or impossible to regain and could damage our business. Some of the factors affecting market acceptance of our products include, without limitation:
• availability, quality and price as compared to competitive products;
• the functionality of new and existing products;
• the timing of introduction of our products compared to competitive products;
• scientists' opinions of the products' utility and our ability to incorporate their feedback into future products;
• citation of the products in published research; and
• general trends in life sciences research.
The realignment of our business into three business units may not result in an improvement in our operating results.
Effective January 1, 2013, the Company's business unit structure was realigned into 3 market-focused business units that are defined by the customers and markets they serve: Research, Applied and SAFC Commercial. If we do not manage this reorganization and the consequent realignment of responsibilities effectively or if this new organization does not provide better service and products to our customers, then our overall business could suffer resulting in consolidated sales and/or margin declines that could be material.
Risks Related to International Operations
Foreign currency exchange rate fluctuations may adversely affect our business.
Since we are a multinational corporation that sells and sources products in many different countries, changes in exchange rates have in the past, and could in the future, adversely affect our cash flows and results of operations. For example, the effect of translating foreign currency sales into U.S. Dollars decreased 2012 sales by 3 percent and increased 2011 and 2010 sales by 4 percent and 1 percent, respectively. Furthermore, reported sales and purchases made and expenses incurred in non-U.S. currencies by our international businesses, when translated into U.S. Dollars for financial reporting purposes, fluctuate due to exchange rate movement. Due to the number of currencies involved, the variability of currency exposures and the potential volatility of currency exchange rates, we cannot predict the effect of exchange rate fluctuations on future sales and operating results.
We are subject to economic, political and other risks associated with our significant international business, which could adversely affect our financial results.
We operate internationally primarily through wholly-owned subsidiaries located in North and South America, Europe, Asia, Israel, Australia and Africa. Sales outside the United States were in excess of 65 percent of total sales in 2012. We expect that sales from international operations will continue to represent a growing portion of our sales. During 2012, approximately 20 percent of the Company's U.S. operations' chemical and equipment purchases were from international suppliers. In addition, many of our manufacturing facilities, employees and suppliers to our international operations are located outside the U.S. Our sales and earnings could be adversely affected by a variety of factors resulting from our international operations, including, without limitation:
• future fluctuations in foreign currency exchange rates;
• complex regulatory requirements and changes in those requirements;
• trade protection measures, tariffs, royalties or taxes, and import or export licensing requirements or restrictions;
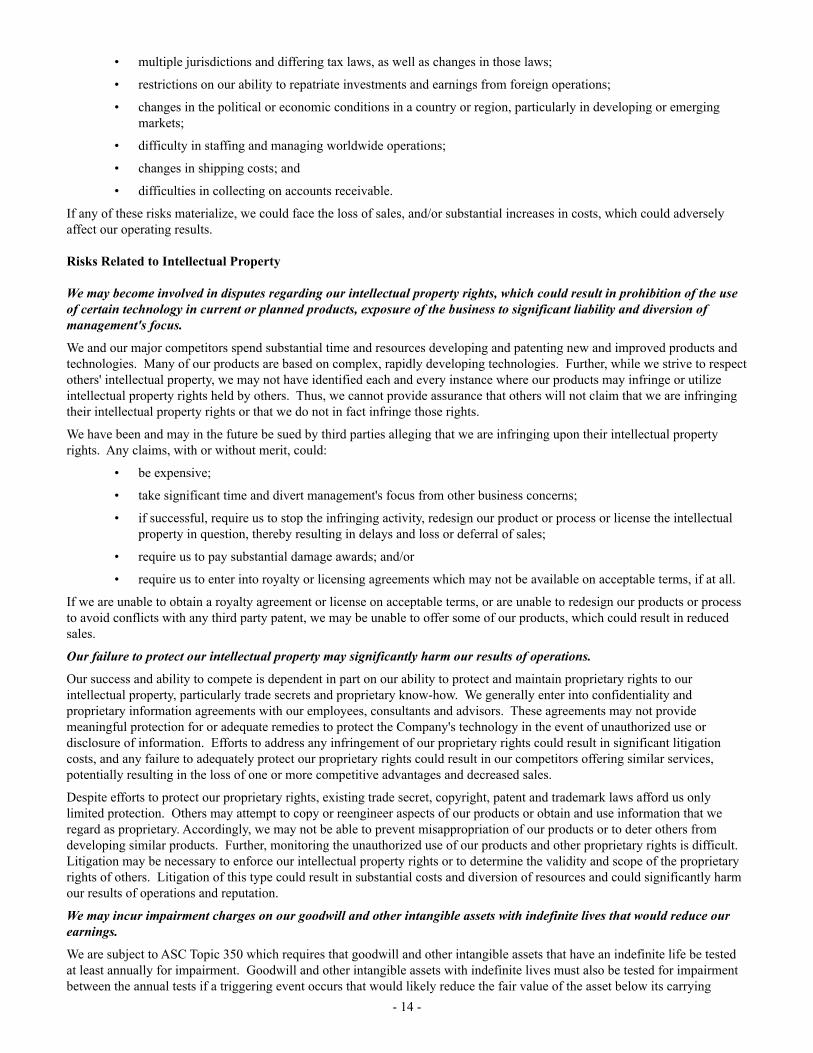
- 14 -
• multiple jurisdictions and differing tax laws, as well as changes in those laws;
• restrictions on our ability to repatriate investments and earnings from foreign operations;
• changes in the political or economic conditions in a country or region, particularly in developing or emerging markets;
• difficulty in staffing and managing worldwide operations;
• changes in shipping costs; and
• difficulties in collecting on accounts receivable.
If any of these risks materialize, we could face the loss of sales, and/or substantial increases in costs, which could adversely affect our operating results.
Risks Related to Intellectual Property
We may become involved in disputes regarding our intellectual property rights, which could result in prohibition of the use of certain technology in current or planned products, exposure of the business to significant liability and diversion of management's focus.
We and our major competitors spend substantial time and resources developing and patenting new and improved products and technologies. Many of our products are based on complex, rapidly developing technologies. Further, while we strive to respect others' intellectual property, we may not have identified each and every instance where our products may infringe or utilize intellectual property rights held by others. Thus, we cannot provide assurance that others will not claim that we are infringing their intellectual property rights or that we do not in fact infringe those rights.
We have been and may in the future be sued by third parties alleging that we are infringing upon their intellectual property rights. Any claims, with or without merit, could:
• be expensive;
• take significant time and divert management's focus from other business concerns;
• if successful, require us to stop the infringing activity, redesign our product or process or license the intellectual property in question, thereby resulting in delays and loss or deferral of sales;
• require us to pay substantial damage awards; and/or
• require us to enter into royalty or licensing agreements which may not be available on acceptable terms, if at all.
If we are unable to obtain a royalty agreement or license on acceptable terms, or are unable to redesign our products or process to avoid conflicts with any third party patent, we may be unable to offer some of our products, which could result in reduced sales.
Our failure to protect our intellectual property may significantly harm our results of operations.
Our success and ability to compete is dependent in part on our ability to protect and maintain proprietary rights to our intellectual property, particularly trade secrets and proprietary know-how. We generally enter into confidentiality and proprietary information agreements with our employees, consultants and advisors. These agreements may not provide meaningful protection for or adequate remedies to protect the Company's technology in the event of unauthorized use or disclosure of information. Efforts to address any infringement of our proprietary rights could result in significant litigation costs, and any failure to adequately protect our proprietary rights could result in our competitors offering similar services, potentially resulting in the loss of one or more competitive advantages and decreased sales.
Despite efforts to protect our proprietary rights, existing trade secret, copyright, patent and trademark laws afford us only limited protection. Others may attempt to copy or reengineer aspects of our products or obtain and use information that we regard as proprietary. Accordingly, we may not be able to prevent misappropriation of our products or to deter others from developing similar products. Further, monitoring the unauthorized use of our products and other proprietary rights is difficult. Litigation may be necessary to enforce our intellectual property rights or to determine the validity and scope of the proprietary rights of others. Litigation of this type could result in substantial costs and diversion of resources and could significantly harm our results of operations and reputation.
We may incur impairment charges on our goodwill and other intangible assets with indefinite lives that would reduce our earnings.
We are subject to ASC Topic 350 which requires that goodwill and other intangible assets that have an indefinite life be tested at least annually for impairment. Goodwill and other intangible assets with indefinite lives must also be tested for impairment between the annual tests if a triggering event occurs that would likely reduce the fair value of the asset below its carrying
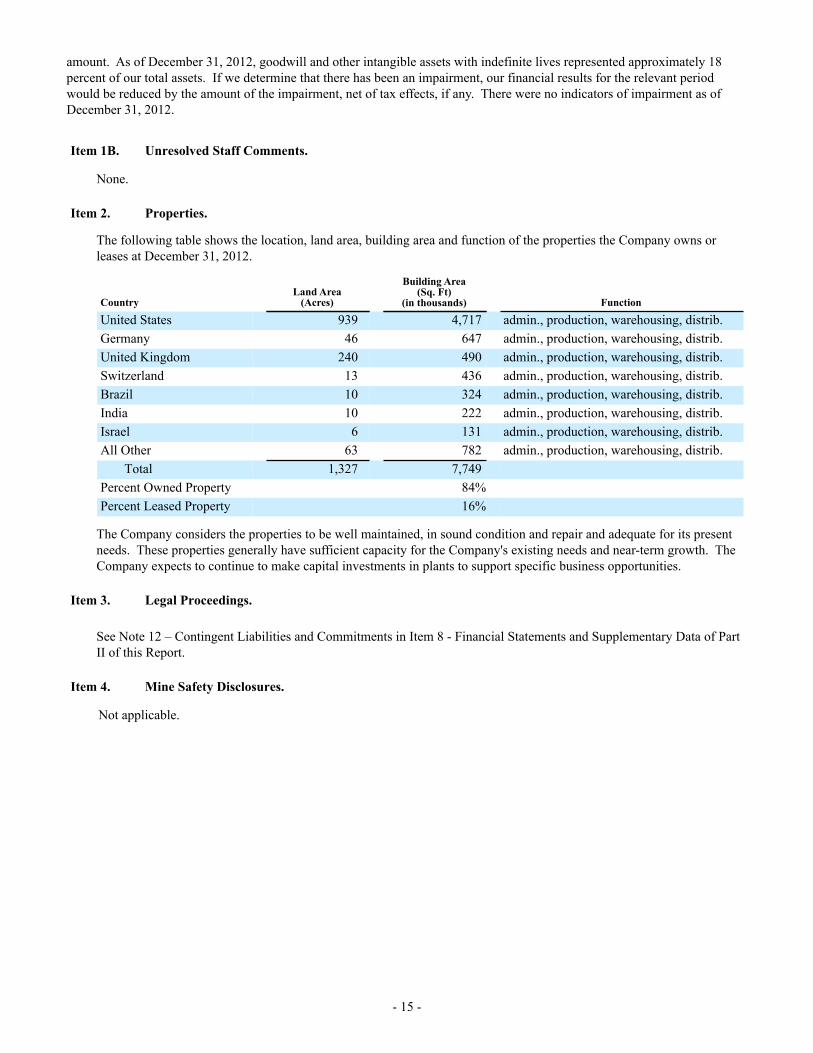
- 15 -
amount. As of December 31, 2012, goodwill and other intangible assets with indefinite lives represented approximately 18 percent of our total assets. If we determine that there has been an impairment, our financial results for the relevant period would be reduced by the amount of the impairment, net of tax effects, if any. There were no indicators of impairment as of December 31, 2012.
Item 1B. Unresolved Staff Comments.
None.
Item 2. Properties.
The following table shows the location, land area, building area and function of the properties the Company owns or leases at December 31, 2012.
CountryLand Area
(Acres)
Building Area(Sq. Ft)
(in thousands) Function
United States 939 4,717 admin., production, warehousing, distrib.Germany 46 647 admin., production, warehousing, distrib.United Kingdom 240 490 admin., production, warehousing, distrib.Switzerland 13 436 admin., production, warehousing, distrib.Brazil 10 324 admin., production, warehousing, distrib.India 10 222 admin., production, warehousing, distrib.Israel 6 131 admin., production, warehousing, distrib.All Other 63 782 admin., production, warehousing, distrib.
Total 1,327 7,749Percent Owned Property 84%Percent Leased Property 16%
The Company considers the properties to be well maintained, in sound condition and repair and adequate for its present needs. These properties generally have sufficient capacity for the Company's existing needs and near-term growth. The Company expects to continue to make capital investments in plants to support specific business opportunities.
Item 3. Legal Proceedings.
See Note 12 – Contingent Liabilities and Commitments in Item 8 - Financial Statements and Supplementary Data of Part II of this Report.
Item 4. Mine Safety Disclosures.
Not applicable.
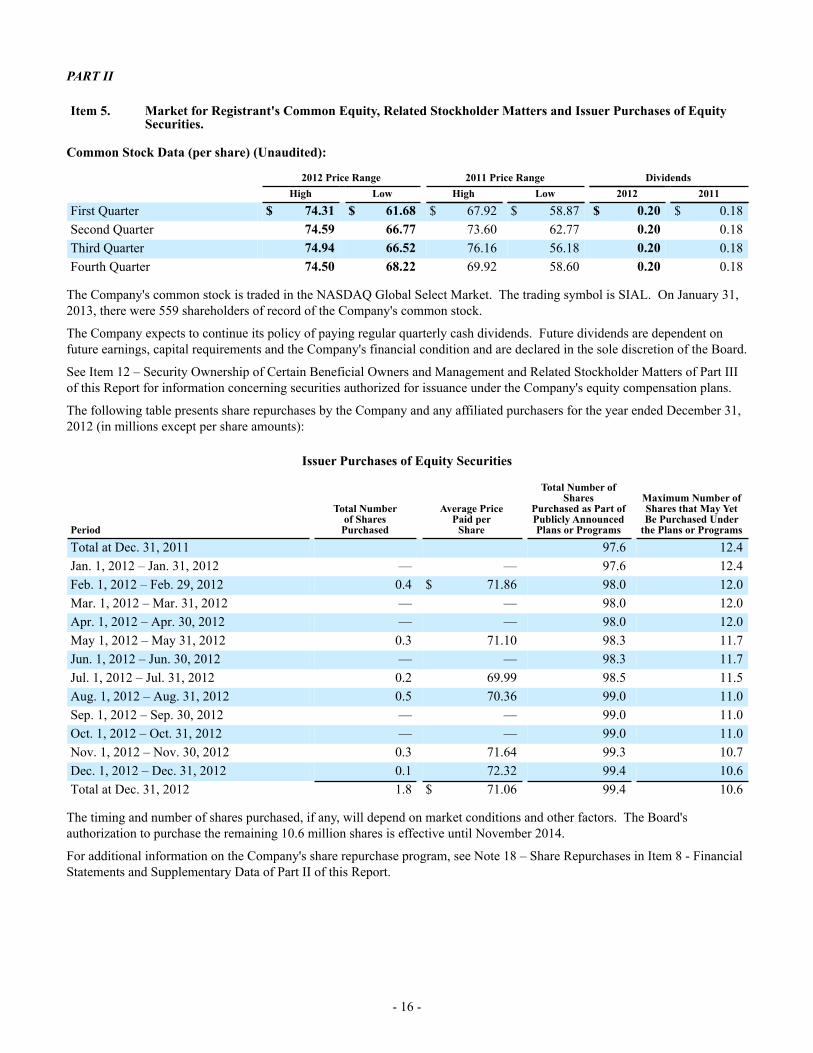
- 16 -
PART II
Item 5. Market for Registrant's Common Equity, Related Stockholder Matters and Issuer Purchases of Equity Securities.
Common Stock Data (per share) (Unaudited):
2012 Price Range 2011 Price Range Dividends High Low High Low 2012 2011
First Quarter $ 74.31 $ 61.68 $ 67.92 $ 58.87 $ 0.20 $ 0.18Second Quarter 74.59 66.77 73.60 62.77 0.20 0.18Third Quarter 74.94 66.52 76.16 56.18 0.20 0.18Fourth Quarter 74.50 68.22 69.92 58.60 0.20 0.18
The Company's common stock is traded in the NASDAQ Global Select Market. The trading symbol is SIAL. On January 31, 2013, there were 559 shareholders of record of the Company's common stock.
The Company expects to continue its policy of paying regular quarterly cash dividends. Future dividends are dependent on future earnings, capital requirements and the Company's financial condition and are declared in the sole discretion of the Board.
See Item 12 – Security Ownership of Certain Beneficial Owners and Management and Related Stockholder Matters of Part III of this Report for information concerning securities authorized for issuance under the Company's equity compensation plans.
The following table presents share repurchases by the Company and any affiliated purchasers for the year ended December 31, 2012 (in millions except per share amounts):
Issuer Purchases of Equity Securities
Period
Total Numberof Shares
Purchased
Average PricePaid per
Share
Total Number of Shares
Purchased as Part ofPublicly AnnouncedPlans or Programs
Maximum Number ofShares that May YetBe Purchased Under
the Plans or Programs
Total at Dec. 31, 2011 97.6 12.4Jan. 1, 2012 – Jan. 31, 2012 — — 97.6 12.4Feb. 1, 2012 – Feb. 29, 2012 0.4 $ 71.86 98.0 12.0Mar. 1, 2012 – Mar. 31, 2012 — — 98.0 12.0Apr. 1, 2012 – Apr. 30, 2012 — — 98.0 12.0May 1, 2012 – May 31, 2012 0.3 71.10 98.3 11.7Jun. 1, 2012 – Jun. 30, 2012 — — 98.3 11.7Jul. 1, 2012 – Jul. 31, 2012 0.2 69.99 98.5 11.5Aug. 1, 2012 – Aug. 31, 2012 0.5 70.36 99.0 11.0Sep. 1, 2012 – Sep. 30, 2012 — — 99.0 11.0Oct. 1, 2012 – Oct. 31, 2012 — — 99.0 11.0Nov. 1, 2012 – Nov. 30, 2012 0.3 71.64 99.3 10.7Dec. 1, 2012 – Dec. 31, 2012 0.1 72.32 99.4 10.6Total at Dec. 31, 2012 1.8 $ 71.06 99.4 10.6
The timing and number of shares purchased, if any, will depend on market conditions and other factors. The Board's authorization to purchase the remaining 10.6 million shares is effective until November 2014.
For additional information on the Company's share repurchase program, see Note 18 – Share Repurchases in Item 8 - Financial Statements and Supplementary Data of Part II of this Report.
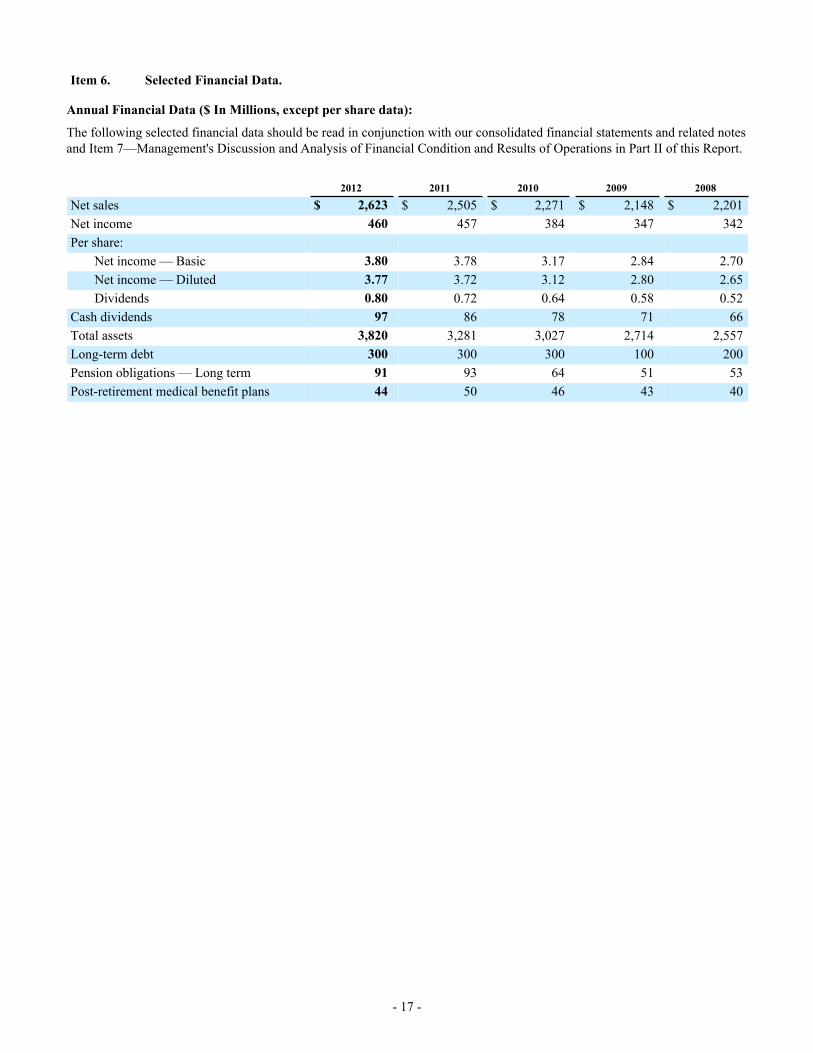
- 17 -
Item 6. Selected Financial Data.
Annual Financial Data ($ In Millions, except per share data):
The following selected financial data should be read in conjunction with our consolidated financial statements and related notes and Item 7—Management's Discussion and Analysis of Financial Condition and Results of Operations in Part II of this Report.
2012 2011 2010 2009 2008
Net sales $ 2,623 $ 2,505 $ 2,271 $ 2,148 $ 2,201Net income 460 457 384 347 342Per share:
Net income — Basic 3.80 3.78 3.17 2.84 2.70Net income — Diluted 3.77 3.72 3.12 2.80 2.65Dividends 0.80 0.72 0.64 0.58 0.52
Cash dividends 97 86 78 71 66Total assets 3,820 3,281 3,027 2,714 2,557Long-term debt 300 300 300 100 200Pension obligations — Long term 91 93 64 51 53Post-retirement medical benefit plans 44 50 46 43 40
- 18 -
Item 7. Management's Discussion and Analysis of Financial Condition and Results of Operations.
Management's Discussion And Analysis($ In Millions, Except Per Share Data)
The following should be read in conjunction with the consolidated financial statements and related notes.
Overview
The Company is a leading Life Science and High Technology company whose biochemical and organic chemical products, kits and services are used in scientific research, including genomic and proteomic research, biotechnology, pharmaceutical development, the diagnosis of disease and as key components in pharmaceutical, diagnostics and high technology manufacturing. Our customers include pharmaceutical and life science companies, university and government institutions, hospitals and industry. We believe over 1.4 million scientists and technologists use our products. We operate in 37 countries and have approximately 9,000 employees worldwide.
Historically, the Company has operated with the Research units of Essentials, Specialties and Biotech and SAFC. During 2012, the 3 Research units were condensed into 1 Research business unit. Effective January 1, 2013, the Company's business unit structure was realigned into 3 market-focused business units that are defined by the customers and markets they serve: Research, Applied and SAFC Commercial. The units are closely interrelated in their activities, share services such as order entry, billing, technical support, the e-commerce infrastructure, including the Company's website, purchasing and inventory control and share production and distribution facilities. Additionally, these units are supported by centralized functional areas such as finance, human resources, quality, safety and compliance and information technology.
The Research business unit, representing approximately 67 percent of sales for 2012, provides laboratory reagents to value conscious buyers, facilitates research by scientists through innovation in services and new products and provides first-to-market, innovative products and technologies to the Life Science researcher. SAFC, representing approximately 33 percent of sales for 2012, supports the manufacturing needs of commercial project managers through rapid delivery of custom products and services.
The Company has a broad customer base of commercial laboratories, pharmaceutical companies, industrial companies, universities, diagnostics companies, biotechnology companies, electronics companies, hospitals, governmental institutions and non-profit organizations located in the U.S. and internationally. The Company would not be significantly impacted by the loss of any one customer. However, economic conditions and government research funding in the U.S., the EU and elsewhere do impact demand from our customers.
Strategy
The Company's business strategy is designed to drive overall sales and earnings growth and to maintain a return on invested capital at an appropriate premium above the Company's cost of capital. Our key areas of focus address the most significant opportunities and challenges facing the Company, including:• Improving Customer Intimacy: We constantly strive to exceed our customers' expectations through offering the right
selection of high quality products and services, providing superior customer service and support and consistently delivering products that meet published or agreed specifications when and where our customers need them. The continued enhancement of a world-class e-commerce platform is a significant part of this approach.
• Expanding Products and Services: Increasing our geographic coverage, particularly in APLA, pursuing new and innovative technologies and expanding our product and service offerings organically and through strategic acquisitions, should enable us to drive continued sales growth.
• Accelerating Operational Excellence: Through the optimization of our worldwide footprint, strategic sourcing of our products and materials and driving efficiencies in our distribution networks and operating expenses, we aim to continually enhance our operating margins.
- 19 -
Key Business Trends and Highlights
In operating our business and monitoring its performance, the Company considers a number of performance measures, as well as trends affecting our industry as a whole, which include the following:• Macroeconomic Concerns Impacting Funding: Uncertainties in the U.S. and Europe around the macroeconomic
environment have impacted overall research funding. • Industry Consolidation: Our industry remains fragmented with few companies possessing a significant share in any
particular market, which allows some participants to continue consolidating specialty, regional and niche players in the industry. The Company plans to continue to explore opportunities to enhance sales growth and increase its market presence through strategic acquisitions, as evidenced by the recent acquisitions of BioReliance and Research Organics.
• Foreign Currency Exchange Rate Fluctuations: Since we are a multinational corporation that sells and sources products in many different currencies, changes in exchange rates have in the past, and could in the future, adversely affect our cash flows and results of operations. Due to the number of currencies involved, the variability of currency exposures and the potential volatility of currency exchange rates, we cannot predict the effect of exchange rate fluctuations on future sales and operating results.
• Emerging Market Growth: With the emerging markets in the APLA region growing at faster rates, we continue to focus our sales efforts on this region and achieved an increase in organic net sales of 10 percent compared to the prior year. The Company further expanded its footprint in this region with the 2012 openings of a new manufacturing facility in Kaohsiung, Taiwan, that serves the fast growing LED market, an expanded distribution center and new packaging facility in Bangalore, India, and a new packaging and quality control facility in Wuxi, China.
• Growth of Internet: The internet continues to change our marketspace. Ensuring a strong presence in this channel is critical to our long term success. Worldwide sales of Research products through the Company's e-commerce channels, including both web-based and EDI platforms, were $878 during 2012, a 6 percent organic increase compared to 2011, and have grown to over 50 percent of the Company's total sales of Research products.
• Pharmaceutical Outsourcing: We continue to take advantage of the expanded market opportunities brought about by the outsourcing trend and shift towards biologic drug development throughout the biotechnology and pharmaceutical industries, with an increased focus on enhancing outsourcing partnerships with our customers.
• Regulations: Our industry is experiencing opportunities resulting from regulatory trends towards improving the quality of life, with significant focus in the areas of renewable energy and reduced energy consumption. We believe the Company's Hitech business, part of the SAFC Commercial business unit, is poised to take advantage of these opportunities by supplying certain raw materials to manufacturers of LED products.
Highlights of our consolidated results for the year ended December 31, 2012, are as follows:• Sales were $2,623, an increase of 5 percent compared to the same period last year. Excluding the sales from
acquisitions, which increased sales by 5 percent, and changes in foreign currency exchange rates, which lowered sales by 3 percent, sales increased organically by 3 percent year over year.
• Gross profit margin was 51.4 percent, down from 52.9 percent in 2011 primarily as a result of the impact of acquisitions and the effects of changes in foreign currency exchange rates. Operating income margin was 25.1 percent, compared to 25.8 percent in 2011. This decline was largely attributable to the effects of changes in foreign currency exchange rates and the impact of amortization related to recent acquisitions. Restructuring costs and acquisition transaction costs also lowered the operating income margin in 2012. Lower SG&A as a percentage of sales partially offset these impacts.
• Diluted net income per share was $3.77, compared to $3.72 in 2011. During 2012, unfavorable currency impacts of $0.22 were overcome by higher sales levels and cost reduction initiatives, resulting in a 1 percent increase in diluted net income per share over prior year.
• Net cash provided by operating activities for the year ended December 31, 2012 was $567, an increase of $72 from last year.
• Total debt was $683 at December 31, 2012, an increase of $162 since December 31, 2011, largely due to additional borrowings to support acquisitions.
Non-GAAP Financial Measures
The Company supplements its disclosures made in accordance with GAAP with certain non-GAAP financial measures. The Company does not, and does not suggest investors should, consider such non-GAAP financial measures in isolation from, or as a substitute for, GAAP financial information. These non-GAAP measures may not be consistent with the presentation by similar companies in the Company's industry. Whenever the Company uses such non-GAAP measures, it provides a reconciliation of such measures to the most closely applicable GAAP measure.
- 20 -
With over 60 percent of sales denominated in currencies other than the U.S. Dollar, management uses currency adjusted growth, and believes it is useful to investors, to judge the Company's local currency performance. Organic sales growth data presented herein excludes currency impacts, and where indicated, acquisition impacts. The Company calculates the impact of changes in foreign currency exchange rates by multiplying current period activity by the difference between current period exchange rates and prior period exchange rates; the result is the defined impact of "changes in foreign currency exchange rates" or "changes in FX." While we are able to report currency impacts after the fact, we are unable to estimate changes that may occur in 2013 to applicable exchange rates. Any significant changes in currency exchange rates would likely have a significant impact on our reported growth rates due to the volume of our sales denominated in foreign currencies.
Management also uses free cash flow, a non-GAAP measure, to judge its performance and ability to pursue opportunities that enhance shareholder value. Free cash flow is defined as net cash provided by operating activities less capital expenditures. Management believes this non-GAAP information is useful to investors as well.
Critical Accounting Estimates
The preparation of consolidated financial statements in conformity with GAAP requires management to use judgment in making estimates and assumptions that affect the reported amounts of assets and liabilities, disclosures of contingent assets and liabilities at the date of the consolidated financial statements and the reported amounts of revenues and expenses during the periods presented. Actual results could differ from those estimates under different assumptions or conditions.
The following accounting policies are based on, among other things, judgments and assumptions made by management that include inherent risks and uncertainties. Management's estimates are based on the relevant information available at the end of each period.
Inventories. Inventories are valued at the lower of cost or market. The Company regularly reviews inventories on hand and records a provision for slow-moving and obsolete inventory, inventory not meeting quality standards and inventory subject to expiration. The provision for slow-moving and obsolete inventory is based on current estimates of future product demand, market conditions and related management judgment. Any significant unanticipated changes in future product demand or market conditions that vary from current expectations could have an impact on the value of inventories.
Long-Lived Assets. Long-lived assets, including intangibles with definite lives, are amortized over their expected useful lives. Goodwill and other intangibles with indefinite lives are not amortized against earnings. Goodwill is assessed annually for impairment. All long-lived assets are assessed whenever events and changes in business conditions indicate that the carrying amount of an asset may not be fully recoverable. If impairment is indicated, the asset value is written down to its fair market value. Any significant unanticipated changes in business or market conditions that vary from current expectations could have an impact on the fair value of these assets and a potential associated impairment. There were no indications of impairment as of December 31, 2012.
Pension and Other Post-Retirement Benefits. The determination of the obligation and expense for pension and other post-retirement benefits is dependent on the Company's selection of certain assumptions used by actuaries to calculate such amounts. Those assumptions are described in Note 15 – Pension and Post-retirement Benefit Plans to the Company's consolidated financial statements in Item 8 – Financial Statements and Supplementary Data of Part II in this Report and include, among others, the discount rate, expected return on plan assets and rates of increase in compensation and health care costs.
In accordance with GAAP, actual results that differ from the assumptions are accumulated and amortized over future periods and therefore, generally affect the recognized expense in such future periods. While the Company believes that the assumptions are appropriate, significant differences in actual experience or significant changes in the assumptions may materially affect the Company's pension and other post-retirement benefit obligations and the Company's future expense. A 1 percent increase or decrease in the discount rate assumption or the expected return on plan assets would not have a material impact on the Company's consolidated financial statements.
Taxes. The Company operates within multiple taxing jurisdictions and is subject to audit in these jurisdictions. These audits can involve complex issues, which may require an extended period of time to resolve. The Company regularly reviews its potential tax liabilities for tax years subject to audit. In management's opinion, adequate provisions for income taxes have been made for all years presented.
The provision for income taxes is based on pretax income reported in the consolidated statements of earnings and currently enacted tax rates for each jurisdiction. No provision has been made for U.S. income taxes on the undistributed earnings of the Company's international subsidiaries where the earnings are considered permanently invested or otherwise indefinitely retained for continuing international operations. Recognition of U.S. taxes on undistributed earnings of the international subsidiaries
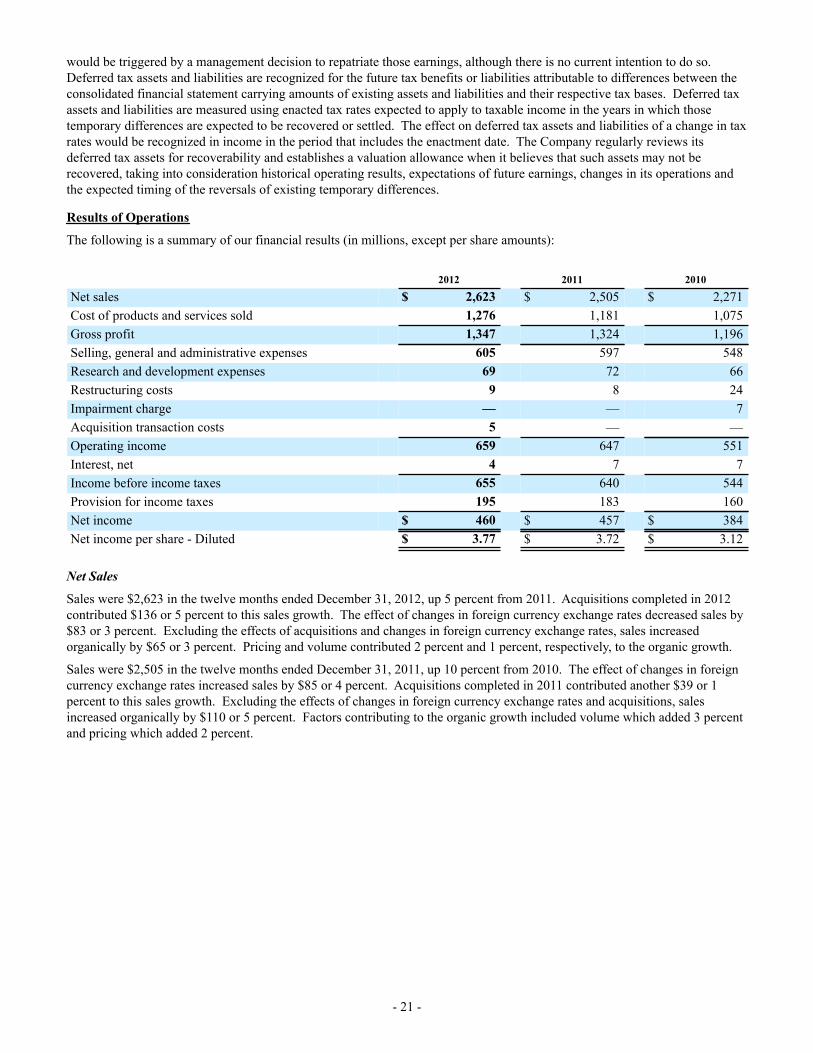
- 21 -
would be triggered by a management decision to repatriate those earnings, although there is no current intention to do so. Deferred tax assets and liabilities are recognized for the future tax benefits or liabilities attributable to differences between the consolidated financial statement carrying amounts of existing assets and liabilities and their respective tax bases. Deferred tax assets and liabilities are measured using enacted tax rates expected to apply to taxable income in the years in which those temporary differences are expected to be recovered or settled. The effect on deferred tax assets and liabilities of a change in tax rates would be recognized in income in the period that includes the enactment date. The Company regularly reviews its deferred tax assets for recoverability and establishes a valuation allowance when it believes that such assets may not be recovered, taking into consideration historical operating results, expectations of future earnings, changes in its operations and the expected timing of the reversals of existing temporary differences.
Results of Operations
The following is a summary of our financial results (in millions, except per share amounts):
2012 2011 2010
Net sales $ 2,623 $ 2,505 $ 2,271Cost of products and services sold 1,276 1,181 1,075Gross profit 1,347 1,324 1,196Selling, general and administrative expenses 605 597 548Research and development expenses 69 72 66Restructuring costs 9 8 24Impairment charge — — 7Acquisition transaction costs 5 — —Operating income 659 647 551Interest, net 4 7 7Income before income taxes 655 640 544Provision for income taxes 195 183 160Net income $ 460 $ 457 $ 384Net income per share - Diluted $ 3.77 $ 3.72 $ 3.12
Net Sales
Sales were $2,623 in the twelve months ended December 31, 2012, up 5 percent from 2011. Acquisitions completed in 2012 contributed $136 or 5 percent to this sales growth. The effect of changes in foreign currency exchange rates decreased sales by $83 or 3 percent. Excluding the effects of acquisitions and changes in foreign currency exchange rates, sales increased organically by $65 or 3 percent. Pricing and volume contributed 2 percent and 1 percent, respectively, to the organic growth.
Sales were $2,505 in the twelve months ended December 31, 2011, up 10 percent from 2010. The effect of changes in foreign currency exchange rates increased sales by $85 or 4 percent. Acquisitions completed in 2011 contributed another $39 or 1 percent to this sales growth. Excluding the effects of changes in foreign currency exchange rates and acquisitions, sales increased organically by $110 or 5 percent. Factors contributing to the organic growth included volume which added 3 percent and pricing which added 2 percent.
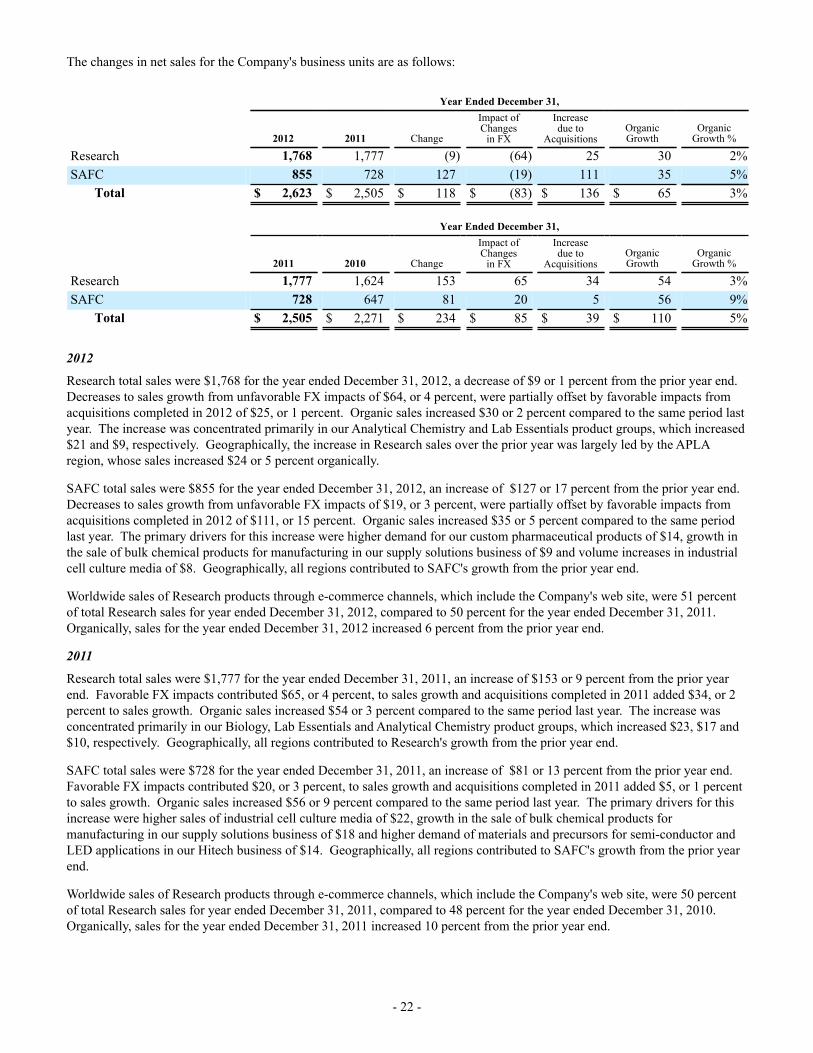
- 22 -
The changes in net sales for the Company's business units are as follows:
Year Ended December 31,
2012 2011 Change
Impact ofChanges
in FX
Increasedue to
AcquisitionsOrganicGrowth
OrganicGrowth %
Research 1,768 1,777 (9) (64) 25 30 2%SAFC 855 728 127 (19) 111 35 5%
Total $ 2,623 $ 2,505 $ 118 $ (83) $ 136 $ 65 3%
Year Ended December 31,
2011 2010 Change
Impact ofChanges
in FX
Increasedue to
AcquisitionsOrganicGrowth
OrganicGrowth %
Research 1,777 1,624 153 65 34 54 3%SAFC 728 647 81 20 5 56 9%
Total $ 2,505 $ 2,271 $ 234 $ 85 $ 39 $ 110 5%
2012
Research total sales were $1,768 for the year ended December 31, 2012, a decrease of $9 or 1 percent from the prior year end. Decreases to sales growth from unfavorable FX impacts of $64, or 4 percent, were partially offset by favorable impacts from acquisitions completed in 2012 of $25, or 1 percent. Organic sales increased $30 or 2 percent compared to the same period last year. The increase was concentrated primarily in our Analytical Chemistry and Lab Essentials product groups, which increased $21 and $9, respectively. Geographically, the increase in Research sales over the prior year was largely led by the APLA region, whose sales increased $24 or 5 percent organically.
SAFC total sales were $855 for the year ended December 31, 2012, an increase of $127 or 17 percent from the prior year end. Decreases to sales growth from unfavorable FX impacts of $19, or 3 percent, were partially offset by favorable impacts from acquisitions completed in 2012 of $111, or 15 percent. Organic sales increased $35 or 5 percent compared to the same period last year. The primary drivers for this increase were higher demand for our custom pharmaceutical products of $14, growth in the sale of bulk chemical products for manufacturing in our supply solutions business of $9 and volume increases in industrial cell culture media of $8. Geographically, all regions contributed to SAFC's growth from the prior year end.
Worldwide sales of Research products through e-commerce channels, which include the Company's web site, were 51 percent of total Research sales for year ended December 31, 2012, compared to 50 percent for the year ended December 31, 2011. Organically, sales for the year ended December 31, 2012 increased 6 percent from the prior year end.
2011
Research total sales were $1,777 for the year ended December 31, 2011, an increase of $153 or 9 percent from the prior year end. Favorable FX impacts contributed $65, or 4 percent, to sales growth and acquisitions completed in 2011 added $34, or 2 percent to sales growth. Organic sales increased $54 or 3 percent compared to the same period last year. The increase was concentrated primarily in our Biology, Lab Essentials and Analytical Chemistry product groups, which increased $23, $17 and $10, respectively. Geographically, all regions contributed to Research's growth from the prior year end.
SAFC total sales were $728 for the year ended December 31, 2011, an increase of $81 or 13 percent from the prior year end. Favorable FX impacts contributed $20, or 3 percent, to sales growth and acquisitions completed in 2011 added $5, or 1 percent to sales growth. Organic sales increased $56 or 9 percent compared to the same period last year. The primary drivers for this increase were higher sales of industrial cell culture media of $22, growth in the sale of bulk chemical products for manufacturing in our supply solutions business of $18 and higher demand of materials and precursors for semi-conductor and LED applications in our Hitech business of $14. Geographically, all regions contributed to SAFC's growth from the prior year end.
Worldwide sales of Research products through e-commerce channels, which include the Company's web site, were 50 percent of total Research sales for year ended December 31, 2011, compared to 48 percent for the year ended December 31, 2010. Organically, sales for the year ended December 31, 2011 increased 10 percent from the prior year end.
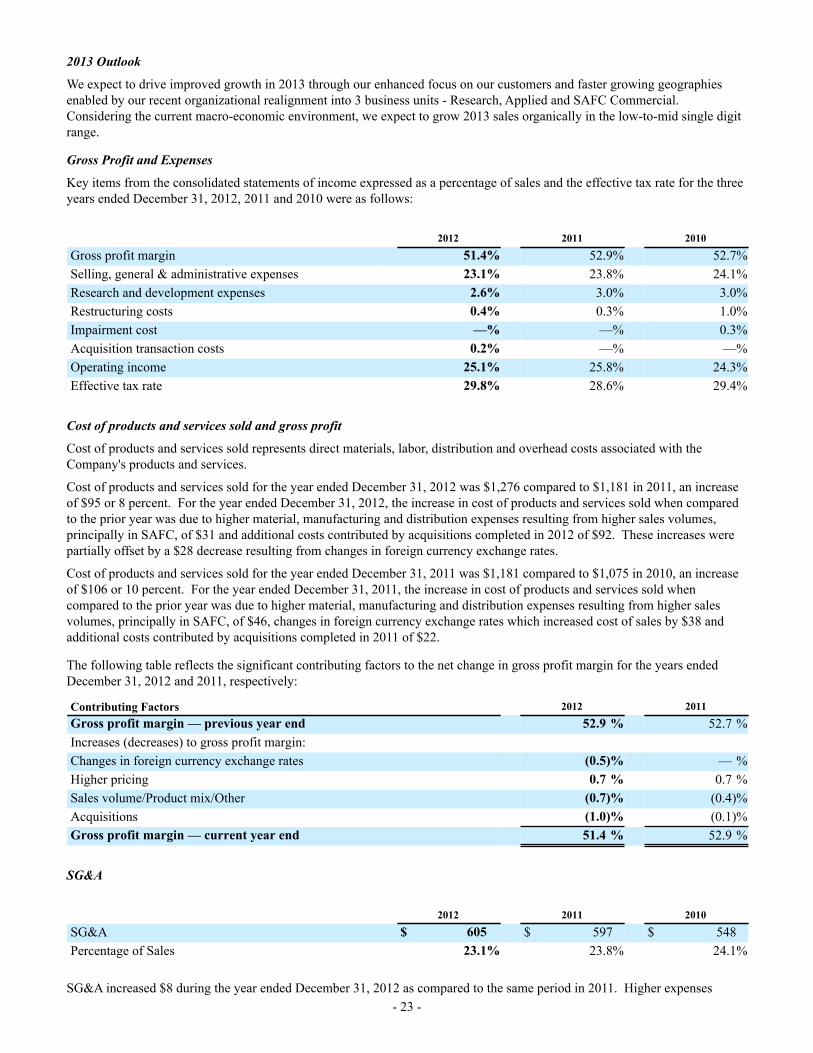
- 23 -
2013 Outlook
We expect to drive improved growth in 2013 through our enhanced focus on our customers and faster growing geographies enabled by our recent organizational realignment into 3 business units - Research, Applied and SAFC Commercial. Considering the current macro-economic environment, we expect to grow 2013 sales organically in the low-to-mid single digit range.
Gross Profit and Expenses
Key items from the consolidated statements of income expressed as a percentage of sales and the effective tax rate for the three years ended December 31, 2012, 2011 and 2010 were as follows:
2012 2011 2010
Gross profit margin 51.4% 52.9% 52.7%Selling, general & administrative expenses 23.1% 23.8% 24.1%Research and development expenses 2.6% 3.0% 3.0%Restructuring costs 0.4% 0.3% 1.0%Impairment cost —% —% 0.3%Acquisition transaction costs 0.2% —% —%Operating income 25.1% 25.8% 24.3%Effective tax rate 29.8% 28.6% 29.4%
Cost of products and services sold and gross profit
Cost of products and services sold represents direct materials, labor, distribution and overhead costs associated with the Company's products and services.
Cost of products and services sold for the year ended December 31, 2012 was $1,276 compared to $1,181 in 2011, an increase of $95 or 8 percent. For the year ended December 31, 2012, the increase in cost of products and services sold when compared to the prior year was due to higher material, manufacturing and distribution expenses resulting from higher sales volumes, principally in SAFC, of $31 and additional costs contributed by acquisitions completed in 2012 of $92. These increases were partially offset by a $28 decrease resulting from changes in foreign currency exchange rates.
Cost of products and services sold for the year ended December 31, 2011 was $1,181 compared to $1,075 in 2010, an increase of $106 or 10 percent. For the year ended December 31, 2011, the increase in cost of products and services sold when compared to the prior year was due to higher material, manufacturing and distribution expenses resulting from higher sales volumes, principally in SAFC, of $46, changes in foreign currency exchange rates which increased cost of sales by $38 and additional costs contributed by acquisitions completed in 2011 of $22.
The following table reflects the significant contributing factors to the net change in gross profit margin for the years ended December 31, 2012 and 2011, respectively:
Contributing Factors 2012 2011
Gross profit margin — previous year end 52.9 % 52.7 %Increases (decreases) to gross profit margin:Changes in foreign currency exchange rates (0.5)% — %Higher pricing 0.7 % 0.7 %Sales volume/Product mix/Other (0.7)% (0.4)%Acquisitions (1.0)% (0.1)%Gross profit margin — current year end 51.4 % 52.9 %
SG&A
2012 2011 2010
SG&A $ 605 $ 597 $ 548Percentage of Sales 23.1% 23.8% 24.1%
SG&A increased $8 during the year ended December 31, 2012 as compared to the same period in 2011. Higher expenses
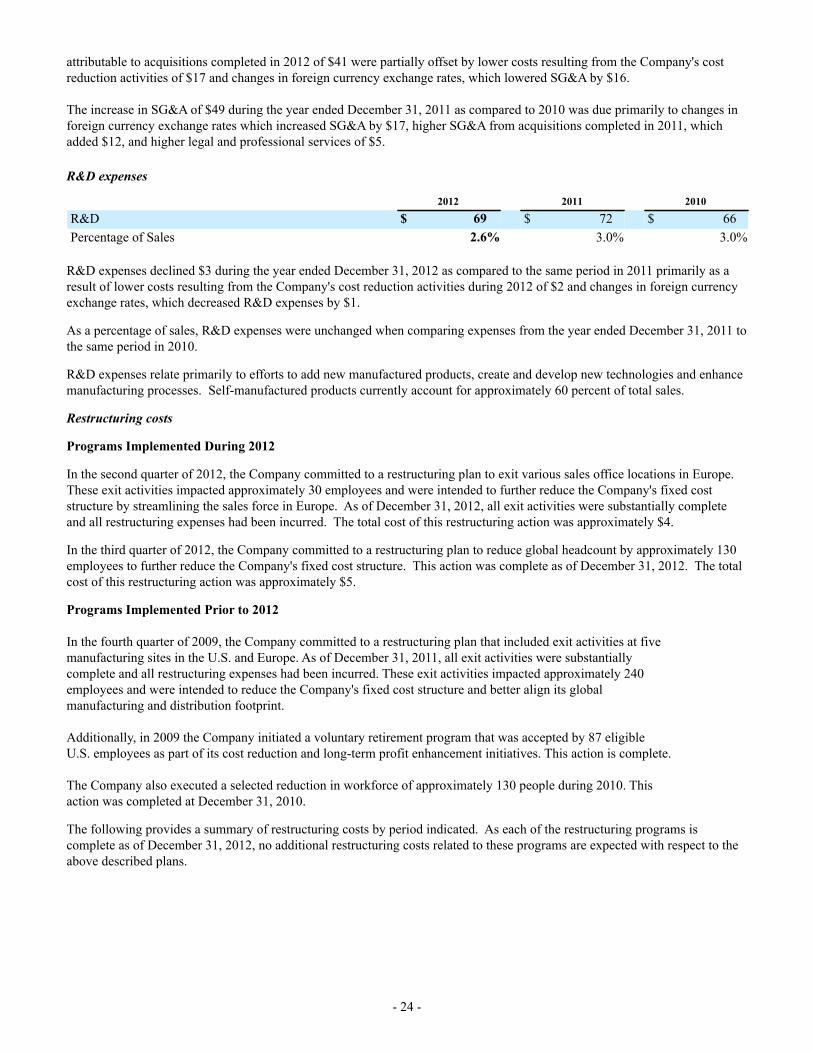
- 24 -
attributable to acquisitions completed in 2012 of $41 were partially offset by lower costs resulting from the Company's cost reduction activities of $17 and changes in foreign currency exchange rates, which lowered SG&A by $16.
The increase in SG&A of $49 during the year ended December 31, 2011 as compared to 2010 was due primarily to changes in foreign currency exchange rates which increased SG&A by $17, higher SG&A from acquisitions completed in 2011, which added $12, and higher legal and professional services of $5.
R&D expenses
2012 2011 2010
R&D $ 69 $ 72 $ 66Percentage of Sales 2.6% 3.0% 3.0%
R&D expenses declined $3 during the year ended December 31, 2012 as compared to the same period in 2011 primarily as a result of lower costs resulting from the Company's cost reduction activities during 2012 of $2 and changes in foreign currency exchange rates, which decreased R&D expenses by $1.
As a percentage of sales, R&D expenses were unchanged when comparing expenses from the year ended December 31, 2011 to the same period in 2010.
R&D expenses relate primarily to efforts to add new manufactured products, create and develop new technologies and enhance manufacturing processes. Self-manufactured products currently account for approximately 60 percent of total sales.
Restructuring costs
Programs Implemented During 2012
In the second quarter of 2012, the Company committed to a restructuring plan to exit various sales office locations in Europe. These exit activities impacted approximately 30 employees and were intended to further reduce the Company's fixed cost structure by streamlining the sales force in Europe. As of December 31, 2012, all exit activities were substantially complete and all restructuring expenses had been incurred. The total cost of this restructuring action was approximately $4.
In the third quarter of 2012, the Company committed to a restructuring plan to reduce global headcount by approximately 130 employees to further reduce the Company's fixed cost structure. This action was complete as of December 31, 2012. The total cost of this restructuring action was approximately $5.
Programs Implemented Prior to 2012
In the fourth quarter of 2009, the Company committed to a restructuring plan that included exit activities at fivemanufacturing sites in the U.S. and Europe. As of December 31, 2011, all exit activities were substantiallycomplete and all restructuring expenses had been incurred. These exit activities impacted approximately 240employees and were intended to reduce the Company's fixed cost structure and better align its globalmanufacturing and distribution footprint.
Additionally, in 2009 the Company initiated a voluntary retirement program that was accepted by 87 eligibleU.S. employees as part of its cost reduction and long-term profit enhancement initiatives. This action is complete.
The Company also executed a selected reduction in workforce of approximately 130 people during 2010. Thisaction was completed at December 31, 2010.
The following provides a summary of restructuring costs by period indicated. As each of the restructuring programs is complete as of December 31, 2012, no additional restructuring costs related to these programs are expected with respect to the above described plans.
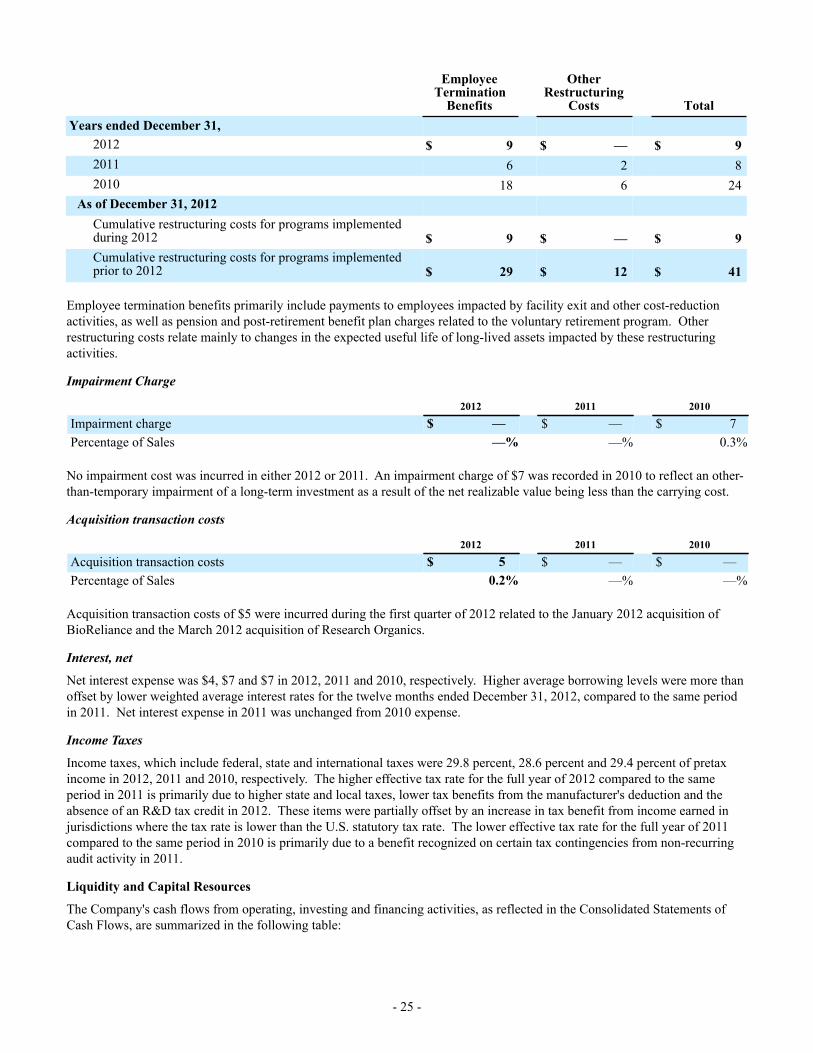
- 25 -
EmployeeTermination
Benefits
OtherRestructuring
Costs TotalYears ended December 31,
2012 $ 9 $ — $ 92011 6 2 82010 18 6 24
As of December 31, 2012Cumulative restructuring costs for programs implementedduring 2012 $ 9 $ — $ 9Cumulative restructuring costs for programs implementedprior to 2012 $ 29 $ 12 $ 41
Employee termination benefits primarily include payments to employees impacted by facility exit and other cost-reduction activities, as well as pension and post-retirement benefit plan charges related to the voluntary retirement program. Other restructuring costs relate mainly to changes in the expected useful life of long-lived assets impacted by these restructuring activities.
Impairment Charge
2012 2011 2010
Impairment charge $ — $ — $ 7Percentage of Sales —% —% 0.3%
No impairment cost was incurred in either 2012 or 2011. An impairment charge of $7 was recorded in 2010 to reflect an other-than-temporary impairment of a long-term investment as a result of the net realizable value being less than the carrying cost.
Acquisition transaction costs
2012 2011 2010
Acquisition transaction costs $ 5 $ — $ —Percentage of Sales 0.2% —% —%
Acquisition transaction costs of $5 were incurred during the first quarter of 2012 related to the January 2012 acquisition of BioReliance and the March 2012 acquisition of Research Organics.
Interest, net
Net interest expense was $4, $7 and $7 in 2012, 2011 and 2010, respectively. Higher average borrowing levels were more than offset by lower weighted average interest rates for the twelve months ended December 31, 2012, compared to the same period in 2011. Net interest expense in 2011 was unchanged from 2010 expense.
Income Taxes
Income taxes, which include federal, state and international taxes were 29.8 percent, 28.6 percent and 29.4 percent of pretax income in 2012, 2011 and 2010, respectively. The higher effective tax rate for the full year of 2012 compared to the same period in 2011 is primarily due to higher state and local taxes, lower tax benefits from the manufacturer's deduction and the absence of an R&D tax credit in 2012. These items were partially offset by an increase in tax benefit from income earned in jurisdictions where the tax rate is lower than the U.S. statutory tax rate. The lower effective tax rate for the full year of 2011 compared to the same period in 2010 is primarily due to a benefit recognized on certain tax contingencies from non-recurring audit activity in 2011.
Liquidity and Capital Resources
The Company's cash flows from operating, investing and financing activities, as reflected in the Consolidated Statements of Cash Flows, are summarized in the following table:
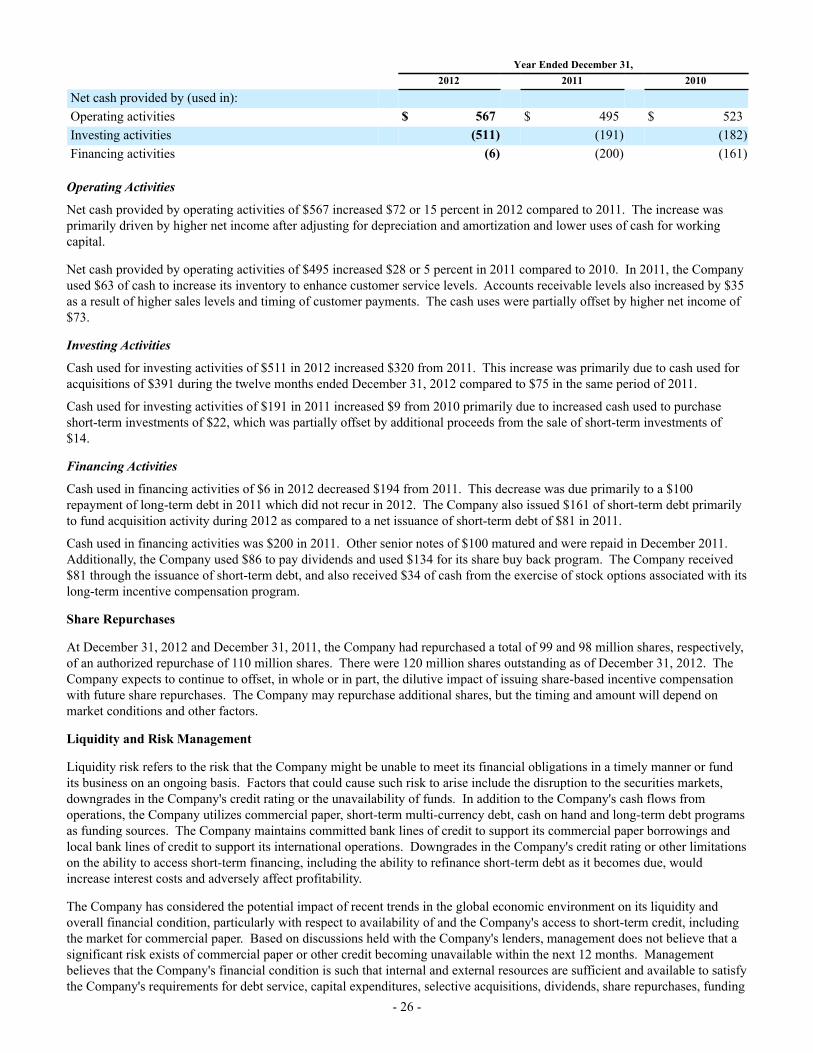
- 26 -
Year Ended December 31, 2012 2011 2010
Net cash provided by (used in):Operating activities $ 567 $ 495 $ 523Investing activities (511) (191) (182)Financing activities (6) (200) (161)
Operating Activities
Net cash provided by operating activities of $567 increased $72 or 15 percent in 2012 compared to 2011. The increase was primarily driven by higher net income after adjusting for depreciation and amortization and lower uses of cash for working capital.
Net cash provided by operating activities of $495 increased $28 or 5 percent in 2011 compared to 2010. In 2011, the Company used $63 of cash to increase its inventory to enhance customer service levels. Accounts receivable levels also increased by $35 as a result of higher sales levels and timing of customer payments. The cash uses were partially offset by higher net income of $73.
Investing Activities
Cash used for investing activities of $511 in 2012 increased $320 from 2011. This increase was primarily due to cash used for acquisitions of $391 during the twelve months ended December 31, 2012 compared to $75 in the same period of 2011.
Cash used for investing activities of $191 in 2011 increased $9 from 2010 primarily due to increased cash used to purchase short-term investments of $22, which was partially offset by additional proceeds from the sale of short-term investments of $14.
Financing Activities
Cash used in financing activities of $6 in 2012 decreased $194 from 2011. This decrease was due primarily to a $100 repayment of long-term debt in 2011 which did not recur in 2012. The Company also issued $161 of short-term debt primarily to fund acquisition activity during 2012 as compared to a net issuance of short-term debt of $81 in 2011.
Cash used in financing activities was $200 in 2011. Other senior notes of $100 matured and were repaid in December 2011. Additionally, the Company used $86 to pay dividends and used $134 for its share buy back program. The Company received $81 through the issuance of short-term debt, and also received $34 of cash from the exercise of stock options associated with its long-term incentive compensation program.
Share Repurchases
At December 31, 2012 and December 31, 2011, the Company had repurchased a total of 99 and 98 million shares, respectively, of an authorized repurchase of 110 million shares. There were 120 million shares outstanding as of December 31, 2012. The Company expects to continue to offset, in whole or in part, the dilutive impact of issuing share-based incentive compensation with future share repurchases. The Company may repurchase additional shares, but the timing and amount will depend on market conditions and other factors.
Liquidity and Risk Management
Liquidity risk refers to the risk that the Company might be unable to meet its financial obligations in a timely manner or fund its business on an ongoing basis. Factors that could cause such risk to arise include the disruption to the securities markets, downgrades in the Company's credit rating or the unavailability of funds. In addition to the Company's cash flows from operations, the Company utilizes commercial paper, short-term multi-currency debt, cash on hand and long-term debt programs as funding sources. The Company maintains committed bank lines of credit to support its commercial paper borrowings and local bank lines of credit to support its international operations. Downgrades in the Company's credit rating or other limitations on the ability to access short-term financing, including the ability to refinance short-term debt as it becomes due, would increase interest costs and adversely affect profitability.
The Company has considered the potential impact of recent trends in the global economic environment on its liquidity and overall financial condition, particularly with respect to availability of and the Company's access to short-term credit, including the market for commercial paper. Based on discussions held with the Company's lenders, management does not believe that a significant risk exists of commercial paper or other credit becoming unavailable within the next 12 months. Management believes that the Company's financial condition is such that internal and external resources are sufficient and available to satisfy the Company's requirements for debt service, capital expenditures, selective acquisitions, dividends, share repurchases, funding
- 27 -
of pension and other post-retirement benefit plan obligations and working capital presently and for the next 12 months.
On May 10, 2012, the Company entered into a new $600 five-year revolving credit facility with a syndicate of banks in the U.S. that supports the Company's commercial paper program. The new facility will mature on May 9, 2017, and replaced a $450 revolving credit facility that was scheduled to mature on December 11, 2012. At December 31, 2012 and December 31, 2011, the Company did not have any borrowings outstanding under these facilities. However, the amount available under the facilities is reduced by the amount of commercial paper outstanding. At December 31, 2012 and December 31, 2011, the Company had $381 and $221 outstanding through its commercial paper program.
The Company also has a $200 seven-year multi-currency European revolving credit facility with a syndicate of banks maturing March 13, 2014. At December 31, 2012 and December 31, 2011, the Company did not have any borrowings outstanding under this facility.
Sigma-Aldrich Korea Limited has a short-term credit facility denominated in Korean Won with a total commitment of 20 billion Korean Won ($19 U.S. Dollars) expiring June 30, 2013. No borrowings were outstanding at December 31, 2012 and December 31, 2011.
Sigma-Aldrich Japan has two credit facilities denominated in Japanese Yen having a total commitment of 2 billion Japanese Yen ($23 U.S. Dollars) with one facility due April, 30, 2013 and the other representing a line of credit with no expiration. No borrowings were outstanding at December 31, 2012 and December 31, 2011.
In addition to those mentioned above, the Company has other short-term credit facilities denominated in foreign currencies having a total commitment of $3. At December 31, 2012 and December 31, 2011, the Company had $2 and no borrowings from these facilities, respectively.
Long-term debt including current maturities was $300 at both December 31, 2012 and 2011. This liability consists of 3.375 percent fixed rate Senior Notes due November 1, 2020. Total debt as a percentage of total capitalization was 21.1 percent percent and 19.2 percent at December 31, 2012 and 2011, respectively.
Total debt at December 31, 2012 was $683 compared to $521 at December 31, 2011.
As of December 31, 2012, the Company has sufficient net worth to allow for borrowing the full capacity under each facility agreement without any restriction. For a description of the Company's material financial debt covenants, see Note 6 – Notes Payable and Note 7 – Long-Term Debt to the Company's consolidated financial statements in Item 8 – Financial Statements and Supplementary Data of Part II in this Report.
At December 31, 2012, substantially all of the Company's cash and cash equivalents was held by its subsidiaries outside of the U.S. The Company has asserted that a majority of this cash is permanently reinvested and is one of the primary liquidity sources used to support its operations and continued growth plans outside of the U.S. The Company has sufficient liquidity in the U.S. to fund its operations, capital plans, dividends and share repurchases and, accordingly, has no immediate need or plans to repatriate any of its cash held by these subsidiaries.
On October 5, 2009, the Company announced a major expansion of its existing license agreement with Sangamo to include the exclusive rights to develop and distribute ZFP-modified cell lines for commercial production of protein pharmaceuticals and ZFP-engineered transgenic animals for livestock, companion animals and therapeutic protein production. Under this agreement, the Company made initial payments of $20 to Sangamo, consisting of an upfront license payment of $15 and $5 for the purchase of shares of Sangamo common stock. Sangamo is eligible to earn additional contingent commercial license fees of up to $5 based on certain conditions and additional contingent milestone payments of up to $25 based on cumulative sales. No material amounts were paid to Sangamo under this agreement in either 2012 or 2011.
- 28 -
Other Matters
The Company is involved in legal proceedings incidental to its business, as described below:
Insurance and Other Contingent Liabilities and Commitments
The Company is a defendant in several lawsuits and claims related to the normal conduct of its business, including lawsuits and claims related to product liability and personal injury matters. The Company accrues for such liabilities when it is probable that future costs (including legal fees and expenses) will be incurred and such costs can be reasonably estimated. The Company has self-insured retention limits and has obtained insurance to provide coverage above the self-insured limits for product liability and personal injury claims, subject to certain limitations and exclusions. Reserves have been provided to cover expected payments for these self-insured amounts at December 31, 2012.
At December 31, 2012, there were no contingent liabilities that management believes are reasonably likely to have a material adverse effect on the Company's consolidated financial condition, results of operations, cash flows or liquidity and there were no material commitments outside of the normal course of business. Material commitments in the normal course of business include notes payable, long-term debt, lease commitments and pension and other post-retirement benefit obligations which are disclosed in Note 6 – Notes Payable, Note 7 – Long-Term Debt, Note 9 – Lease Commitments and Note 15 – Pension and Post-retirement Benefit Plans, respectively, to the Company's consolidated financial statements in Item 8 – Financial Statements and Supplementary Data of Part II of this Report.
Aggregate Contractual Obligations
The following table presents contractual obligations of the Company at December 31, 2012:
Payments due by period
Contractual Obligations TotalLess than
1 year 1–3 years 3–5 yearsMore than
5 years
Long-term debt $ 300 $ — $ — $ — $ 300Interest payments related to long-term debt 79 10 20 20 29Operating lease obligations 118 28 41 26 23Purchase obligations (1) 266 116 52 54 44Total $ 763 $ 154 $ 113 $ 100 $ 396
(1) Purchase obligations include open purchase orders, long-term service and supply agreements and other contractual obligations.
See Note 7 – Long-Term Debt and Note 9 – Lease Commitments to the Company's consolidated financial statements contained in Item 8 – Financial Statements and Supplementary Data of Part II of this Report for additional disclosures related to long-term debt and lease commitments, respectively.
See Note 15 – Pension and Post-retirement Benefit Plans to the Company's consolidated financial statements contained in Item 8 – Financial Statements and Supplementary Data of Part II of this Report for obligations with respect to its pension and post-retirement medical benefit plans.
The above table excludes $33 of liabilities related to uncertain tax positions. See Note 11 – Income Taxes to the Company's consolidated financial statements contained in Item 8 – Financial Statements and Supplementary Data of Part II of this Report for detail on this obligation.
- 29 -
Item 7A. Quantitative and Qualitative Disclosures About Market Risk.
Inflation
Management recognizes that inflationary pressures may have an adverse effect on the Company through higher asset replacement costs and higher material and other operating costs. The Company tries to minimize these effects through focused cost reduction programs and productivity improvements as well as price increases to its customers. It is management's view that inflation, net of customer price increases, has not had a significant impact on the consolidated financial statements during the three years ended December 31, 2012, 2011 and 2010.
Market Risk Sensitive Instruments and Positions
The market risk inherent in the Company's financial instruments and positions represents the potential loss arising from adverse changes in interest rates and foreign currency exchange rates.
Interest Rates
At December 31, 2012, the Company's outstanding debt represents 21.1 percent of total book capitalization. Approximately 44 percent of the Company's outstanding debt at December 31, 2012 is at a fixed rate. Cash flows from operations, cash on hand and available credit facilities are sufficient to meet the cash requirements of operating the business. It is management's view that market risk or variable interest rate risk, based on current conditions, will not significantly impact the Company's results of operations or financial condition, including liquidity. Interest rates are further described in Note 6 – Notes Payable and Note 7 – Long-Term Debt to the consolidated financial statements in Item 8 – Financial Statements and Supplementary Data of Part II of this Report.
Foreign Currency Exchange Rates
The functional currency of the Company's international subsidiaries is generally the currency in the respective country of residence of the subsidiary. The translation from the functional currencies to the U.S. Dollar for revenues and expenses is based on the average exchange rate during the period, and for assets and liabilities, the exchange rate at the reporting date. Changes in foreign currency exchange rates have affected and may continue to affect the Company's revenues, expenses, net income, assets, liabilities and cash flows. The impact of changes in foreign currency exchange rates decreased diluted earnings per share by $0.22 for the year ended December 31, 2012 when compared to the prior year. The impact of changes in foreign currency exchange rates increased diluted earnings per share by $0.16 and $0.12 for the years ended December 31, 2011 and 2010, respectively, when compared to their respective prior periods.
The Company transacts business in many parts of the world and is subject to risks associated with changing foreign currency exchange rates. Accordingly, the Company uses both derivative instruments designated as cash flow hedges as well as derivative instruments that are not designated as hedging instruments to mitigate this risk.
The market risk of these contracts represents the potential loss in fair value of net currency positions at period-end due to an adverse change in foreign currency exchange rates. The Company does not enter into foreign currency contracts for speculative trading purposes. The Company's policy is to manage the foreign currency risks associated with forecasted intercompany inventory purchases and existing receivables, payables and commitments.
Cash Flow Hedges
A significant portion of the Company's cost of products and services sold is denominated in the U.S. Dollar, while over 60 percent of the Company's net sales are denominated in other local currencies in which the products are sold. Intercompany inventory purchases, which are sourced primarily from subsidiaries with U.S. Dollar functional currencies, are sold to customers by international subsidiaries with other local currencies. In the third quarter of 2012, the Company implemented a program to utilize foreign currency forward exchange contracts to mitigate the foreign currency risk associated with these forecasted intercompany inventory purchases. These derivatives have been designated as cash flow hedges which qualify for hedge accounting treatment, whereby changes in fair value are deferred in accumulated other comprehensive income within stockholders' equity until the underlying hedged items are recognized in income. Accordingly, the Company records cash flow hedge gains or losses within cost of products and services sold when the related inventory is sold to a customer. As of December 31, 2012, the majority of these contracts are in established currencies such as the Euro, Japanese Yen and Canadian Dollar. See Note 8 – Financial Derivatives and Risk Management to the Company's consolidated financial statements contained in Item 8 – Financial Statements and Supplementary Data of Part II of this Report for information regarding the impact of these contracts to the consolidated financial statements for the twelve months ended December 31, 2012.
- 30 -
The market risk on the Company's cash flow hedge contracts at December 31, 2012, assuming a hypothetical 10 percent change in foreign currency exchange rates, would be approximately $23 on income before income taxes.
Derivatives Not Designated As Hedging Instruments
The Company also uses foreign currency forward exchange contracts, not designated as hedging instruments, to hedge the value of certain receivables and payables denominated in foreign currencies. The Company's objective is to minimize the impact of foreign currency exchange rate changes during the period of time between the original transaction date and its cash settlement. Gains and losses on these contracts, based on the difference in the contract rate and the spot rate at the end of each month for all contracts still in force, are typically offset either partially or completely by transaction gains and losses, with any net gains and losses included in SG&A in the Company's consolidated statements of income. As of December 31, 2012, the majority of these contracts are in established currencies such as the British Pound, Euro and Swiss Franc. The impact of these contracts was not material to the consolidated financial statements for the twelve months ended December 31, 2012.
The market risk on the Company's foreign currency forward exchange contracts at December 31, 2012, assuming a hypothetical 10 percent change in foreign currency exchange rates, would be approximately $3 on income before income taxes.
The Company continues to assess the potential impact of recent trends in the global economic environment on the availability of and its access to these contracts in the open market, as well as the ability of the counterparties to meet their obligations. While we continue to monitor the impacts of the uncertainties in the Eurozone, management does not believe that a significant risk exists of these contracts becoming unavailable in the global marketplace within the next 12 months.
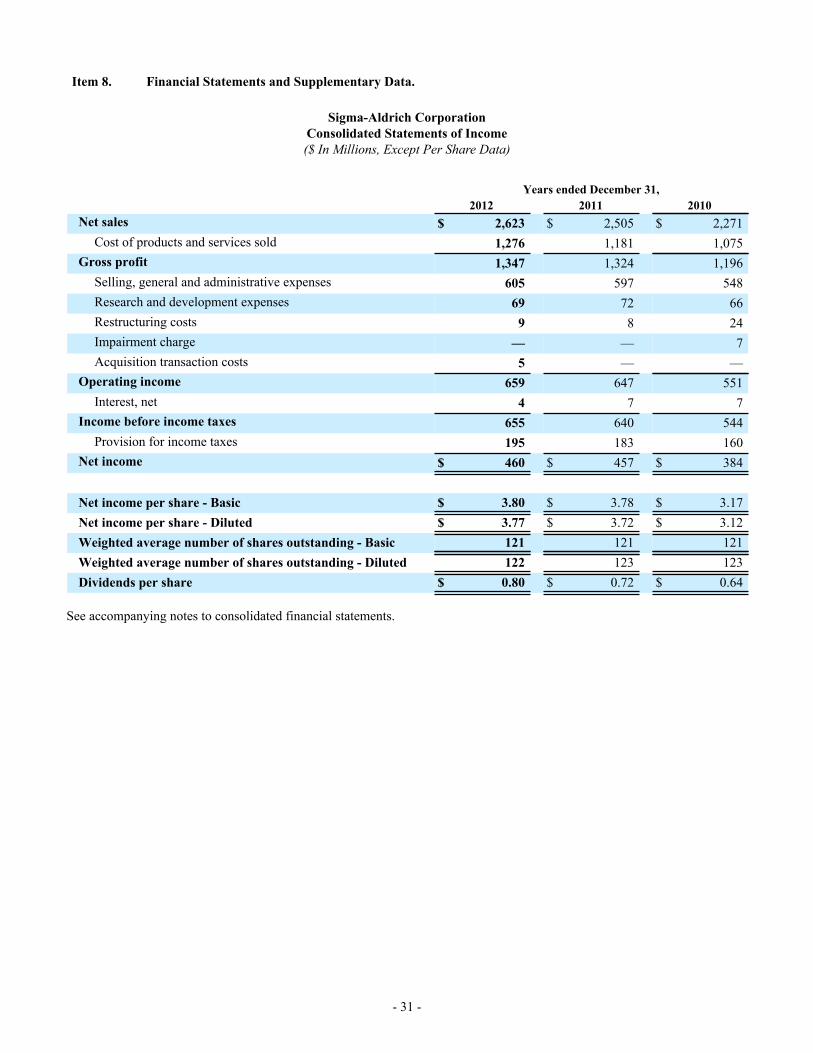
- 31 -
Item 8. Financial Statements and Supplementary Data.
Sigma-Aldrich CorporationConsolidated Statements of Income($ In Millions, Except Per Share Data)
Years ended December 31,2012 2011 2010
Net sales $ 2,623 $ 2,505 $ 2,271Cost of products and services sold 1,276 1,181 1,075
Gross profit 1,347 1,324 1,196Selling, general and administrative expenses 605 597 548Research and development expenses 69 72 66Restructuring costs 9 8 24Impairment charge — — 7Acquisition transaction costs 5 — —
Operating income 659 647 551Interest, net 4 7 7
Income before income taxes 655 640 544Provision for income taxes 195 183 160
Net income $ 460 $ 457 $ 384
Net income per share - Basic $ 3.80 $ 3.78 $ 3.17Net income per share - Diluted $ 3.77 $ 3.72 $ 3.12Weighted average number of shares outstanding - Basic 121 121 121Weighted average number of shares outstanding - Diluted 122 123 123Dividends per share $ 0.80 $ 0.72 $ 0.64
See accompanying notes to consolidated financial statements.
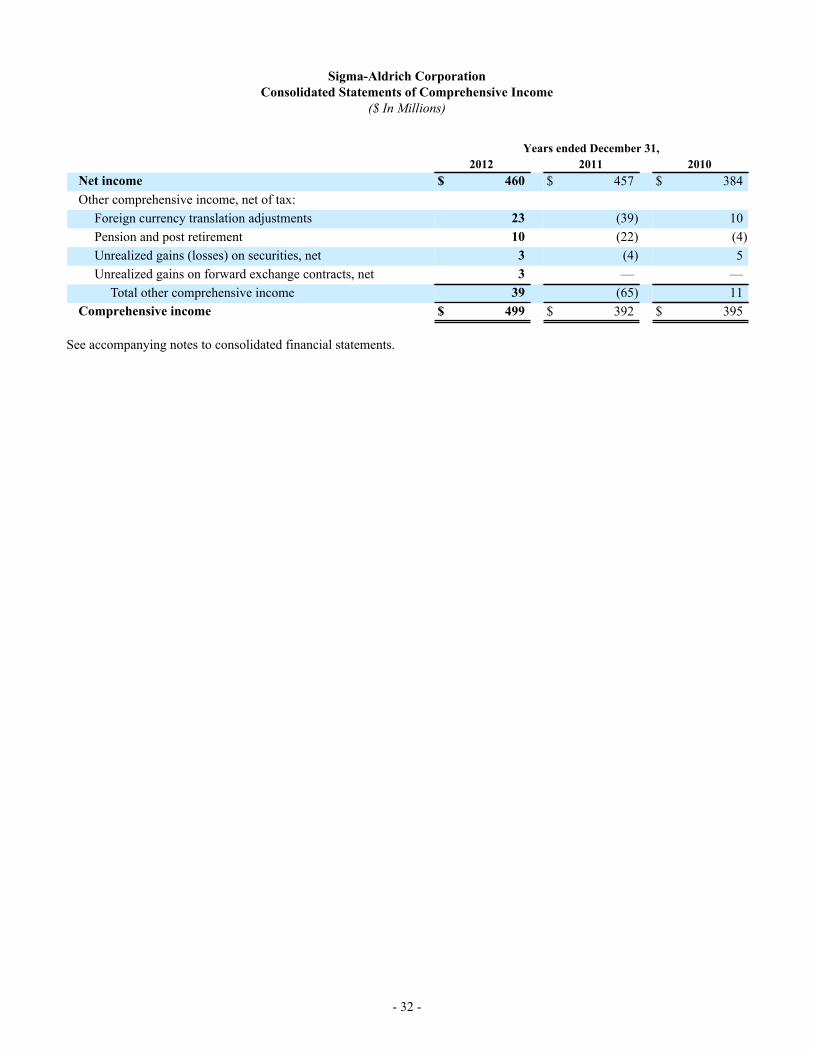
- 32 -
Sigma-Aldrich CorporationConsolidated Statements of Comprehensive Income
($ In Millions)
Years ended December 31, 2012 2011 2010
Net income $ 460 $ 457 $ 384Other comprehensive income, net of tax:
Foreign currency translation adjustments 23 (39) 10Pension and post retirement 10 (22) (4)Unrealized gains (losses) on securities, net 3 (4) 5Unrealized gains on forward exchange contracts, net 3 — —
Total other comprehensive income 39 (65) 11Comprehensive income $ 499 $ 392 $ 395
See accompanying notes to consolidated financial statements.
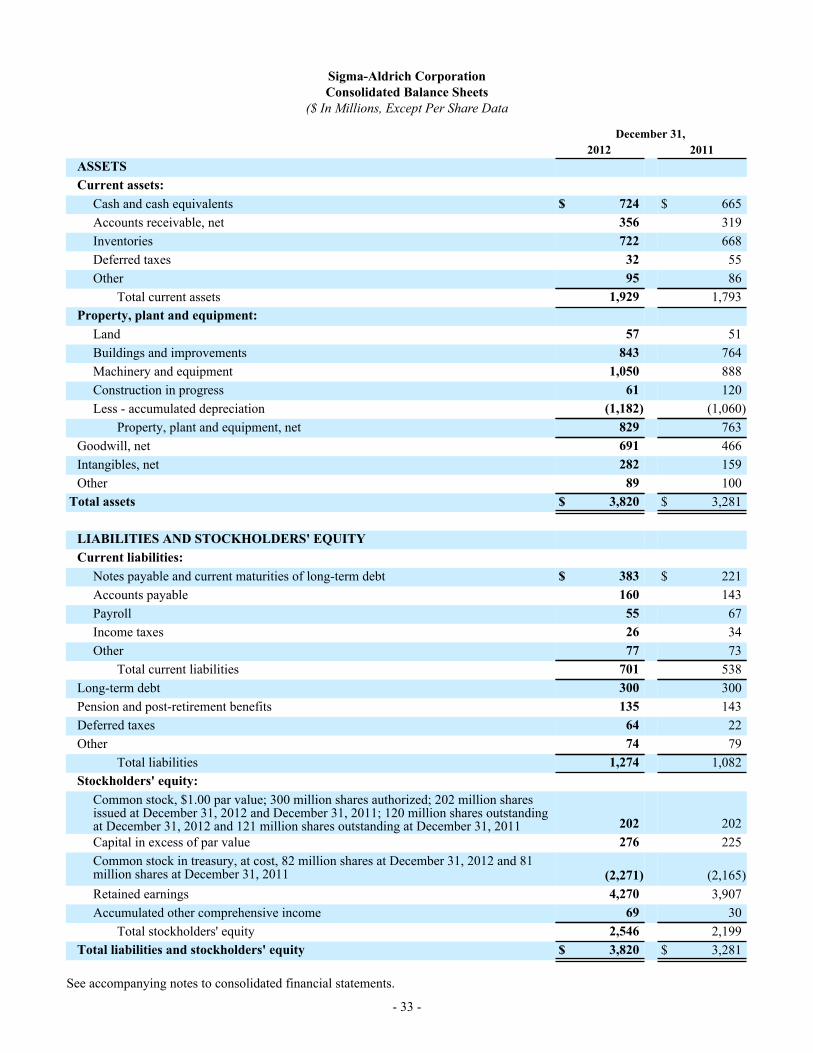
- 33 -
Sigma-Aldrich CorporationConsolidated Balance Sheets
($ In Millions, Except Per Share Data
December 31,2012 2011
ASSETSCurrent assets:
Cash and cash equivalents $ 724 $ 665Accounts receivable, net 356 319Inventories 722 668Deferred taxes 32 55Other 95 86
Total current assets 1,929 1,793Property, plant and equipment:
Land 57 51Buildings and improvements 843 764Machinery and equipment 1,050 888Construction in progress 61 120Less - accumulated depreciation (1,182) (1,060)
Property, plant and equipment, net 829 763Goodwill, net 691 466Intangibles, net 282 159Other 89 100
Total assets $ 3,820 $ 3,281
LIABILITIES AND STOCKHOLDERS' EQUITYCurrent liabilities:
Notes payable and current maturities of long-term debt $ 383 $ 221Accounts payable 160 143Payroll 55 67Income taxes 26 34Other 77 73
Total current liabilities 701 538Long-term debt 300 300Pension and post-retirement benefits 135 143Deferred taxes 64 22Other 74 79
Total liabilities 1,274 1,082Stockholders' equity:
Common stock, $1.00 par value; 300 million shares authorized; 202 million sharesissued at December 31, 2012 and December 31, 2011; 120 million shares outstandingat December 31, 2012 and 121 million shares outstanding at December 31, 2011 202 202Capital in excess of par value 276 225Common stock in treasury, at cost, 82 million shares at December 31, 2012 and 81million shares at December 31, 2011 (2,271) (2,165)Retained earnings 4,270 3,907Accumulated other comprehensive income 69 30
Total stockholders' equity 2,546 2,199Total liabilities and stockholders' equity $ 3,820 $ 3,281
See accompanying notes to consolidated financial statements.
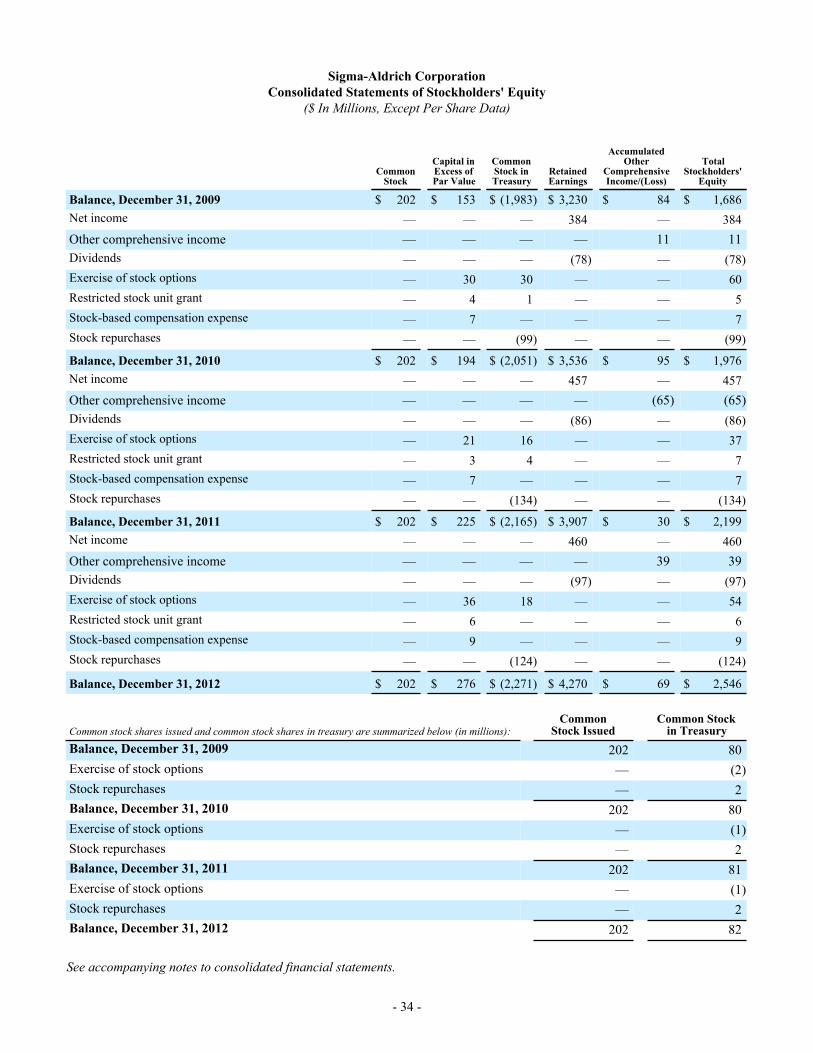
- 34 -
Sigma-Aldrich CorporationConsolidated Statements of Stockholders' Equity
($ In Millions, Except Per Share Data)
CommonStock
Capital inExcess ofPar Value
CommonStock inTreasury
RetainedEarnings
AccumulatedOther
ComprehensiveIncome/(Loss)
TotalStockholders'
Equity
Balance, December 31, 2009 $ 202 $ 153 $ (1,983) $ 3,230 $ 84 $ 1,686Net income — — — 384 — 384Other comprehensive income — — — — 11 11Dividends — — — (78) — (78)Exercise of stock options — 30 30 — — 60Restricted stock unit grant — 4 1 — — 5Stock-based compensation expense — 7 — — — 7Stock repurchases — — (99) — — (99)
Balance, December 31, 2010 $ 202 $ 194 $ (2,051) $ 3,536 $ 95 $ 1,976Net income — — — 457 — 457Other comprehensive income — — — — (65) (65)Dividends — — — (86) — (86)Exercise of stock options — 21 16 — — 37Restricted stock unit grant — 3 4 — — 7Stock-based compensation expense — 7 — — — 7Stock repurchases — — (134) — — (134)
Balance, December 31, 2011 $ 202 $ 225 $ (2,165) $ 3,907 $ 30 $ 2,199Net income — — — 460 — 460Other comprehensive income — — — — 39 39Dividends — — — (97) — (97)Exercise of stock options — 36 18 — — 54Restricted stock unit grant — 6 — — — 6Stock-based compensation expense — 9 — — — 9Stock repurchases — — (124) — — (124)
Balance, December 31, 2012 $ 202 $ 276 $ (2,271) $ 4,270 $ 69 $ 2,546
Common stock shares issued and common stock shares in treasury are summarized below (in millions):Common
Stock IssuedCommon Stock
in TreasuryBalance, December 31, 2009 202 80Exercise of stock options — (2)Stock repurchases — 2Balance, December 31, 2010 202 80Exercise of stock options — (1)Stock repurchases — 2Balance, December 31, 2011 202 81Exercise of stock options — (1)Stock repurchases — 2Balance, December 31, 2012 202 82
See accompanying notes to consolidated financial statements.
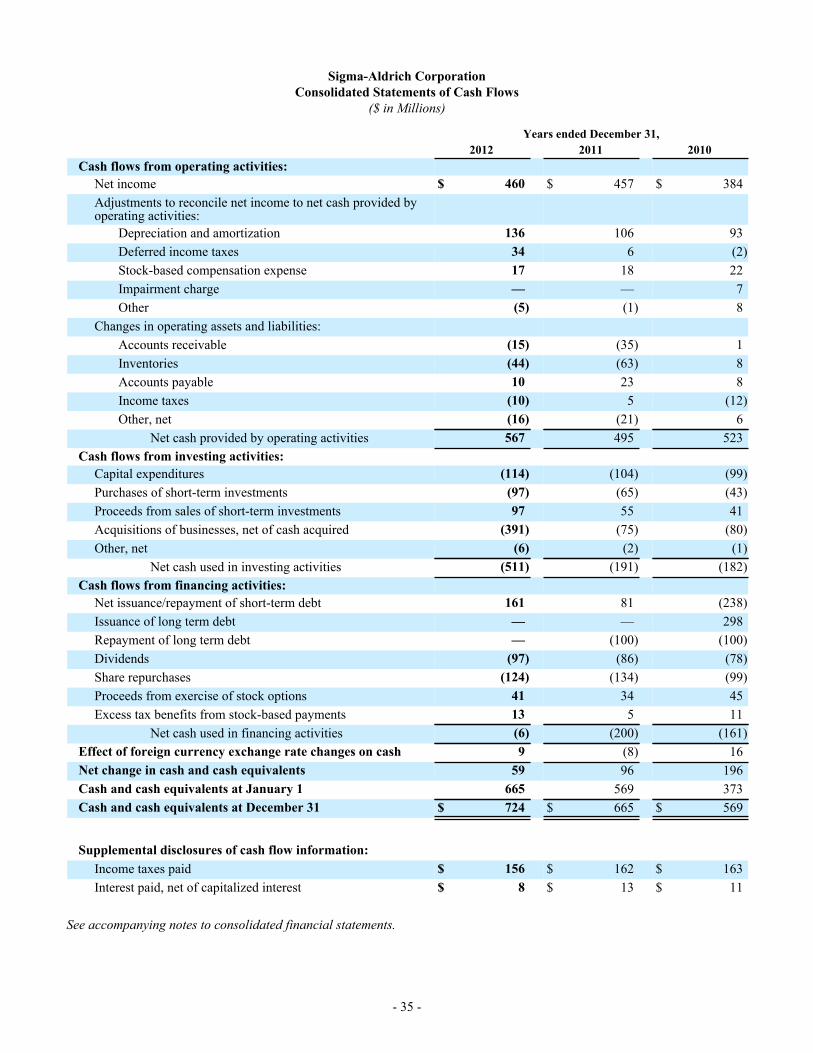
- 35 -
Sigma-Aldrich CorporationConsolidated Statements of Cash Flows
($ in Millions)
Years ended December 31,2012 2011 2010
Cash flows from operating activities:Net income $ 460 $ 457 $ 384Adjustments to reconcile net income to net cash provided byoperating activities:
Depreciation and amortization 136 106 93Deferred income taxes 34 6 (2)Stock-based compensation expense 17 18 22Impairment charge — — 7Other (5) (1) 8
Changes in operating assets and liabilities:Accounts receivable (15) (35) 1Inventories (44) (63) 8Accounts payable 10 23 8Income taxes (10) 5 (12)Other, net (16) (21) 6
Net cash provided by operating activities 567 495 523Cash flows from investing activities:
Capital expenditures (114) (104) (99)Purchases of short-term investments (97) (65) (43)Proceeds from sales of short-term investments 97 55 41Acquisitions of businesses, net of cash acquired (391) (75) (80)Other, net (6) (2) (1)
Net cash used in investing activities (511) (191) (182)Cash flows from financing activities:
Net issuance/repayment of short-term debt 161 81 (238)Issuance of long term debt — — 298Repayment of long term debt — (100) (100)Dividends (97) (86) (78)Share repurchases (124) (134) (99)Proceeds from exercise of stock options 41 34 45Excess tax benefits from stock-based payments 13 5 11
Net cash used in financing activities (6) (200) (161)Effect of foreign currency exchange rate changes on cash 9 (8) 16Net change in cash and cash equivalents 59 96 196Cash and cash equivalents at January 1 665 569 373Cash and cash equivalents at December 31 $ 724 $ 665 $ 569
Supplemental disclosures of cash flow information:Income taxes paid $ 156 $ 162 $ 163Interest paid, net of capitalized interest $ 8 $ 13 $ 11
See accompanying notes to consolidated financial statements.
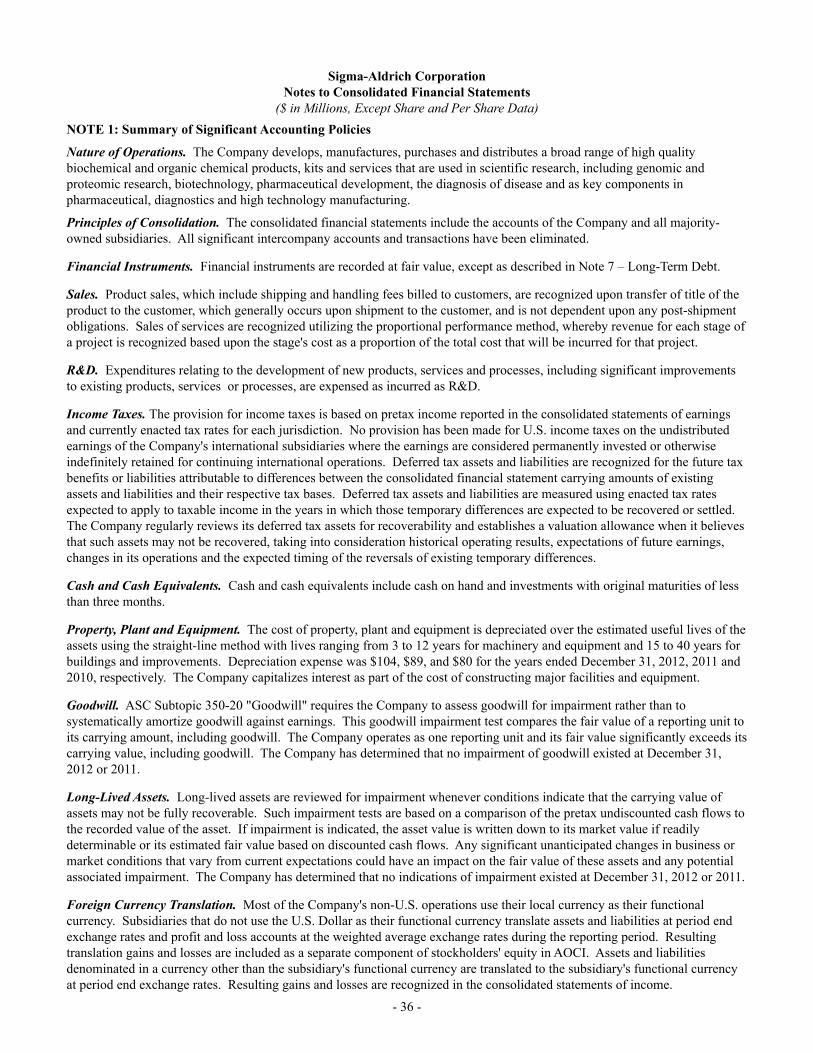
- 36 -
Sigma-Aldrich CorporationNotes to Consolidated Financial Statements
($ in Millions, Except Share and Per Share Data)NOTE 1: Summary of Significant Accounting Policies
Nature of Operations. The Company develops, manufactures, purchases and distributes a broad range of high quality biochemical and organic chemical products, kits and services that are used in scientific research, including genomic and proteomic research, biotechnology, pharmaceutical development, the diagnosis of disease and as key components in pharmaceutical, diagnostics and high technology manufacturing.
Principles of Consolidation. The consolidated financial statements include the accounts of the Company and all majority-owned subsidiaries. All significant intercompany accounts and transactions have been eliminated.
Financial Instruments. Financial instruments are recorded at fair value, except as described in Note 7 – Long-Term Debt.
Sales. Product sales, which include shipping and handling fees billed to customers, are recognized upon transfer of title of the product to the customer, which generally occurs upon shipment to the customer, and is not dependent upon any post-shipment obligations. Sales of services are recognized utilizing the proportional performance method, whereby revenue for each stage of a project is recognized based upon the stage's cost as a proportion of the total cost that will be incurred for that project.
R&D. Expenditures relating to the development of new products, services and processes, including significant improvements to existing products, services or processes, are expensed as incurred as R&D.
Income Taxes. The provision for income taxes is based on pretax income reported in the consolidated statements of earnings and currently enacted tax rates for each jurisdiction. No provision has been made for U.S. income taxes on the undistributed earnings of the Company's international subsidiaries where the earnings are considered permanently invested or otherwise indefinitely retained for continuing international operations. Deferred tax assets and liabilities are recognized for the future tax benefits or liabilities attributable to differences between the consolidated financial statement carrying amounts of existing assets and liabilities and their respective tax bases. Deferred tax assets and liabilities are measured using enacted tax rates expected to apply to taxable income in the years in which those temporary differences are expected to be recovered or settled. The Company regularly reviews its deferred tax assets for recoverability and establishes a valuation allowance when it believes that such assets may not be recovered, taking into consideration historical operating results, expectations of future earnings, changes in its operations and the expected timing of the reversals of existing temporary differences.
Cash and Cash Equivalents. Cash and cash equivalents include cash on hand and investments with original maturities of less than three months.
Property, Plant and Equipment. The cost of property, plant and equipment is depreciated over the estimated useful lives of the assets using the straight-line method with lives ranging from 3 to 12 years for machinery and equipment and 15 to 40 years for buildings and improvements. Depreciation expense was $104, $89, and $80 for the years ended December 31, 2012, 2011 and 2010, respectively. The Company capitalizes interest as part of the cost of constructing major facilities and equipment.
Goodwill. ASC Subtopic 350-20 "Goodwill" requires the Company to assess goodwill for impairment rather than to systematically amortize goodwill against earnings. This goodwill impairment test compares the fair value of a reporting unit to its carrying amount, including goodwill. The Company operates as one reporting unit and its fair value significantly exceeds its carrying value, including goodwill. The Company has determined that no impairment of goodwill existed at December 31, 2012 or 2011.
Long-Lived Assets. Long-lived assets are reviewed for impairment whenever conditions indicate that the carrying value of assets may not be fully recoverable. Such impairment tests are based on a comparison of the pretax undiscounted cash flows to the recorded value of the asset. If impairment is indicated, the asset value is written down to its market value if readily determinable or its estimated fair value based on discounted cash flows. Any significant unanticipated changes in business or market conditions that vary from current expectations could have an impact on the fair value of these assets and any potential associated impairment. The Company has determined that no indications of impairment existed at December 31, 2012 or 2011.
Foreign Currency Translation. Most of the Company's non-U.S. operations use their local currency as their functional currency. Subsidiaries that do not use the U.S. Dollar as their functional currency translate assets and liabilities at period end exchange rates and profit and loss accounts at the weighted average exchange rates during the reporting period. Resulting translation gains and losses are included as a separate component of stockholders' equity in AOCI. Assets and liabilities denominated in a currency other than the subsidiary's functional currency are translated to the subsidiary's functional currency at period end exchange rates. Resulting gains and losses are recognized in the consolidated statements of income.
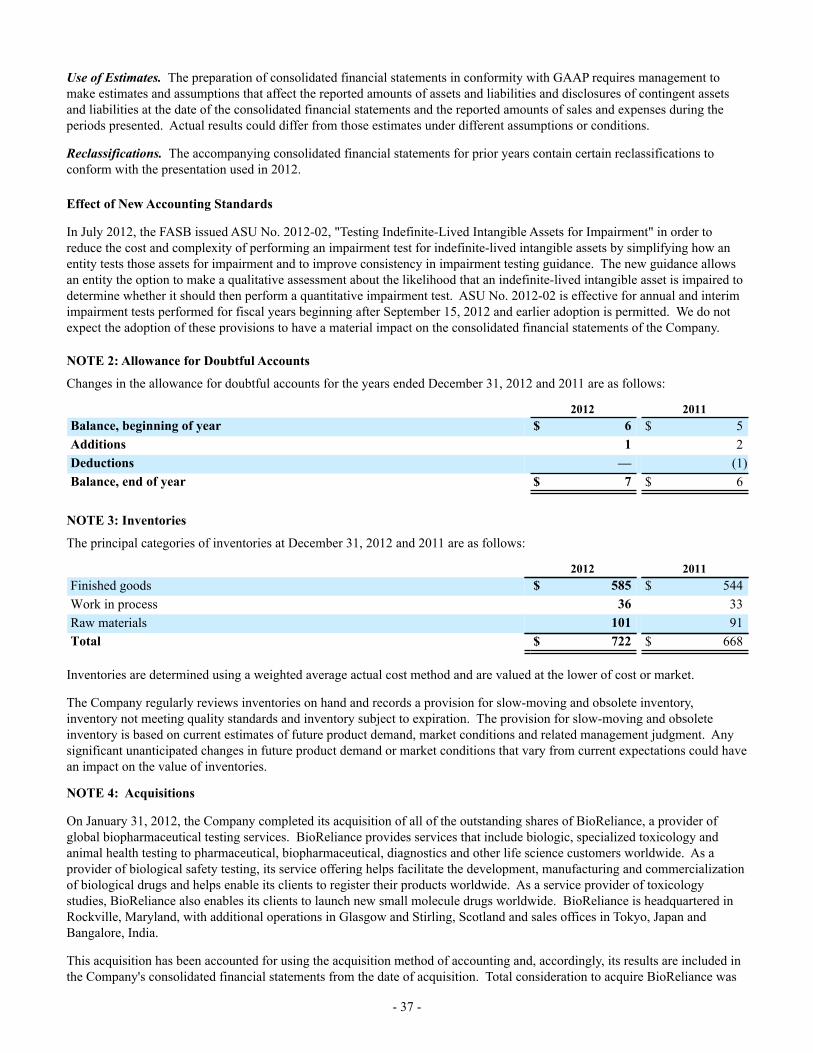
- 37 -
Use of Estimates. The preparation of consolidated financial statements in conformity with GAAP requires management to make estimates and assumptions that affect the reported amounts of assets and liabilities and disclosures of contingent assets and liabilities at the date of the consolidated financial statements and the reported amounts of sales and expenses during the periods presented. Actual results could differ from those estimates under different assumptions or conditions.
Reclassifications. The accompanying consolidated financial statements for prior years contain certain reclassifications to conform with the presentation used in 2012.
Effect of New Accounting Standards
In July 2012, the FASB issued ASU No. 2012-02, "Testing Indefinite-Lived Intangible Assets for Impairment" in order to reduce the cost and complexity of performing an impairment test for indefinite-lived intangible assets by simplifying how an entity tests those assets for impairment and to improve consistency in impairment testing guidance. The new guidance allows an entity the option to make a qualitative assessment about the likelihood that an indefinite-lived intangible asset is impaired to determine whether it should then perform a quantitative impairment test. ASU No. 2012-02 is effective for annual and interim impairment tests performed for fiscal years beginning after September 15, 2012 and earlier adoption is permitted. We do not expect the adoption of these provisions to have a material impact on the consolidated financial statements of the Company.
NOTE 2: Allowance for Doubtful Accounts
Changes in the allowance for doubtful accounts for the years ended December 31, 2012 and 2011 are as follows:
2012 2011Balance, beginning of year $ 6 $ 5Additions 1 2Deductions — (1)Balance, end of year $ 7 $ 6
NOTE 3: Inventories
The principal categories of inventories at December 31, 2012 and 2011 are as follows:
2012 2011Finished goods $ 585 $ 544Work in process 36 33Raw materials 101 91Total $ 722 $ 668
Inventories are determined using a weighted average actual cost method and are valued at the lower of cost or market.
The Company regularly reviews inventories on hand and records a provision for slow-moving and obsolete inventory, inventory not meeting quality standards and inventory subject to expiration. The provision for slow-moving and obsolete inventory is based on current estimates of future product demand, market conditions and related management judgment. Any significant unanticipated changes in future product demand or market conditions that vary from current expectations could have an impact on the value of inventories.
NOTE 4: Acquisitions
On January 31, 2012, the Company completed its acquisition of all of the outstanding shares of BioReliance, a provider of global biopharmaceutical testing services. BioReliance provides services that include biologic, specialized toxicology and animal health testing to pharmaceutical, biopharmaceutical, diagnostics and other life science customers worldwide. As a provider of biological safety testing, its service offering helps facilitate the development, manufacturing and commercialization of biological drugs and helps enable its clients to register their products worldwide. As a service provider of toxicology studies, BioReliance also enables its clients to launch new small molecule drugs worldwide. BioReliance is headquartered in Rockville, Maryland, with additional operations in Glasgow and Stirling, Scotland and sales offices in Tokyo, Japan and Bangalore, India.
This acquisition has been accounted for using the acquisition method of accounting and, accordingly, its results are included in the Company's consolidated financial statements from the date of acquisition. Total consideration to acquire BioReliance was
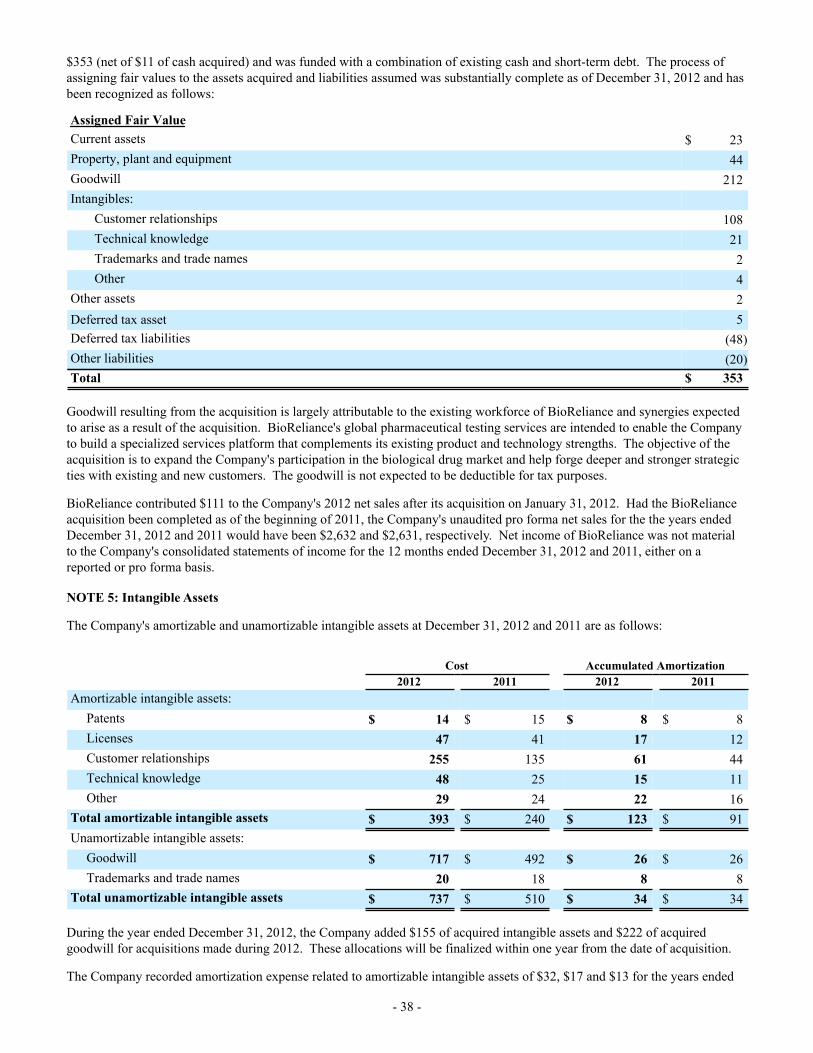
- 38 -
$353 (net of $11 of cash acquired) and was funded with a combination of existing cash and short-term debt. The process of assigning fair values to the assets acquired and liabilities assumed was substantially complete as of December 31, 2012 and has been recognized as follows:
Assigned Fair Value
Current assets $ 23Property, plant and equipment 44Goodwill 212Intangibles:
Customer relationships 108Technical knowledge 21Trademarks and trade names 2Other 4
Other assets 2Deferred tax asset 5Deferred tax liabilities (48)Other liabilities (20)Total $ 353
Goodwill resulting from the acquisition is largely attributable to the existing workforce of BioReliance and synergies expected to arise as a result of the acquisition. BioReliance's global pharmaceutical testing services are intended to enable the Company to build a specialized services platform that complements its existing product and technology strengths. The objective of the acquisition is to expand the Company's participation in the biological drug market and help forge deeper and stronger strategic ties with existing and new customers. The goodwill is not expected to be deductible for tax purposes.
BioReliance contributed $111 to the Company's 2012 net sales after its acquisition on January 31, 2012. Had the BioReliance acquisition been completed as of the beginning of 2011, the Company's unaudited pro forma net sales for the the years ended December 31, 2012 and 2011 would have been $2,632 and $2,631, respectively. Net income of BioReliance was not material to the Company's consolidated statements of income for the 12 months ended December 31, 2012 and 2011, either on a reported or pro forma basis.
NOTE 5: Intangible Assets
The Company's amortizable and unamortizable intangible assets at December 31, 2012 and 2011 are as follows:
Cost Accumulated Amortization 2012 2011 2012 2011Amortizable intangible assets:
Patents $ 14 $ 15 $ 8 $ 8Licenses 47 41 17 12Customer relationships 255 135 61 44Technical knowledge 48 25 15 11Other 29 24 22 16
Total amortizable intangible assets $ 393 $ 240 $ 123 $ 91Unamortizable intangible assets:
Goodwill $ 717 $ 492 $ 26 $ 26Trademarks and trade names 20 18 8 8
Total unamortizable intangible assets $ 737 $ 510 $ 34 $ 34
During the year ended December 31, 2012, the Company added $155 of acquired intangible assets and $222 of acquired goodwill for acquisitions made during 2012. These allocations will be finalized within one year from the date of acquisition.
The Company recorded amortization expense related to amortizable intangible assets of $32, $17 and $13 for the years ended
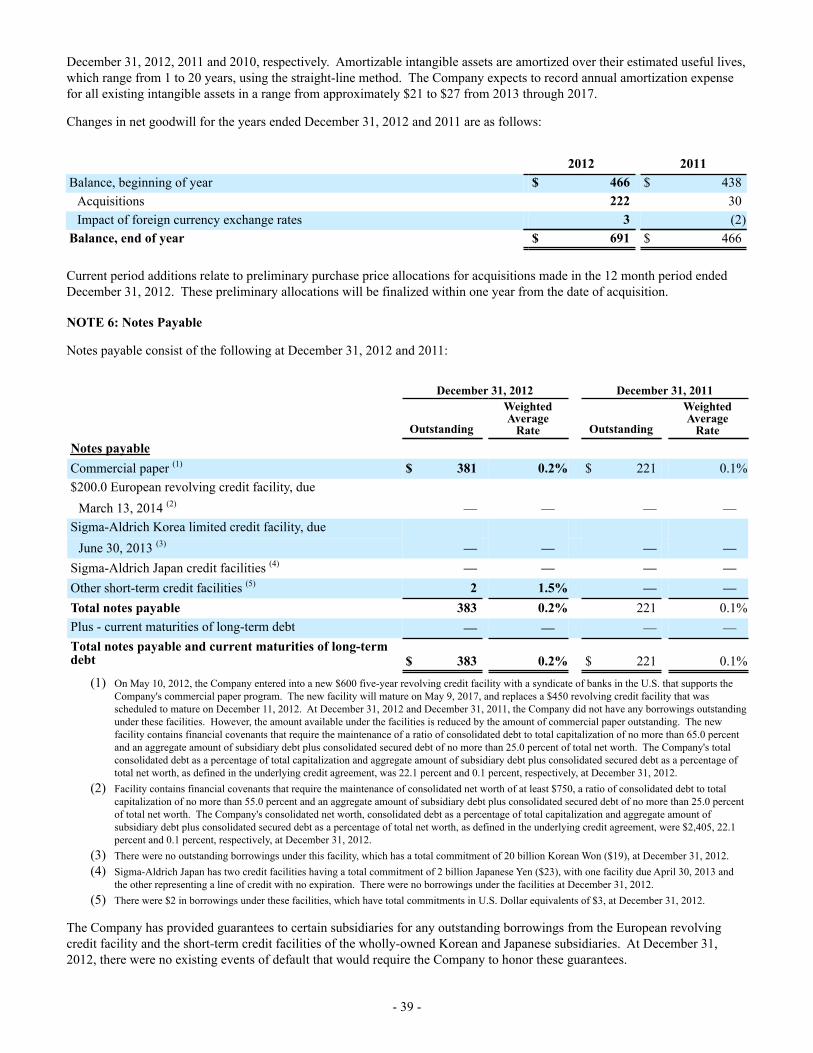
- 39 -
December 31, 2012, 2011 and 2010, respectively. Amortizable intangible assets are amortized over their estimated useful lives, which range from 1 to 20 years, using the straight-line method. The Company expects to record annual amortization expense for all existing intangible assets in a range from approximately $21 to $27 from 2013 through 2017.
Changes in net goodwill for the years ended December 31, 2012 and 2011 are as follows:
2012 2011Balance, beginning of year $ 466 $ 438
Acquisitions 222 30Impact of foreign currency exchange rates 3 (2)
Balance, end of year $ 691 $ 466
Current period additions relate to preliminary purchase price allocations for acquisitions made in the 12 month period ended December 31, 2012. These preliminary allocations will be finalized within one year from the date of acquisition.
NOTE 6: Notes Payable
Notes payable consist of the following at December 31, 2012 and 2011:
December 31, 2012 December 31, 2011
Outstanding
WeightedAverage
Rate Outstanding
WeightedAverage
RateNotes payableCommercial paper (1) $ 381 0.2% $ 221 0.1%$200.0 European revolving credit facility, due
— — — —March 13, 2014 (2)
Sigma-Aldrich Korea limited credit facility, due — — — —June 30, 2013 (3)
Sigma-Aldrich Japan credit facilities (4) — — — —Other short-term credit facilities (5) 2 1.5% — —Total notes payable 383 0.2% 221 0.1%Plus - current maturities of long-term debt — — — —Total notes payable and current maturities of long-termdebt $ 383 0.2% $ 221 0.1%
(1) On May 10, 2012, the Company entered into a new $600 five-year revolving credit facility with a syndicate of banks in the U.S. that supports the Company's commercial paper program. The new facility will mature on May 9, 2017, and replaces a $450 revolving credit facility that was scheduled to mature on December 11, 2012. At December 31, 2012 and December 31, 2011, the Company did not have any borrowings outstanding under these facilities. However, the amount available under the facilities is reduced by the amount of commercial paper outstanding. The new facility contains financial covenants that require the maintenance of a ratio of consolidated debt to total capitalization of no more than 65.0 percent and an aggregate amount of subsidiary debt plus consolidated secured debt of no more than 25.0 percent of total net worth. The Company's total consolidated debt as a percentage of total capitalization and aggregate amount of subsidiary debt plus consolidated secured debt as a percentage of total net worth, as defined in the underlying credit agreement, was 22.1 percent and 0.1 percent, respectively, at December 31, 2012.
(2) Facility contains financial covenants that require the maintenance of consolidated net worth of at least $750, a ratio of consolidated debt to total capitalization of no more than 55.0 percent and an aggregate amount of subsidiary debt plus consolidated secured debt of no more than 25.0 percent of total net worth. The Company's consolidated net worth, consolidated debt as a percentage of total capitalization and aggregate amount of subsidiary debt plus consolidated secured debt as a percentage of total net worth, as defined in the underlying credit agreement, were $2,405, 22.1 percent and 0.1 percent, respectively, at December 31, 2012.
(3) There were no outstanding borrowings under this facility, which has a total commitment of 20 billion Korean Won ($19), at December 31, 2012.(4) Sigma-Aldrich Japan has two credit facilities having a total commitment of 2 billion Japanese Yen ($23), with one facility due April 30, 2013 and
the other representing a line of credit with no expiration. There were no borrowings under the facilities at December 31, 2012.(5) There were $2 in borrowings under these facilities, which have total commitments in U.S. Dollar equivalents of $3, at December 31, 2012.
The Company has provided guarantees to certain subsidiaries for any outstanding borrowings from the European revolving credit facility and the short-term credit facilities of the wholly-owned Korean and Japanese subsidiaries. At December 31, 2012, there were no existing events of default that would require the Company to honor these guarantees.
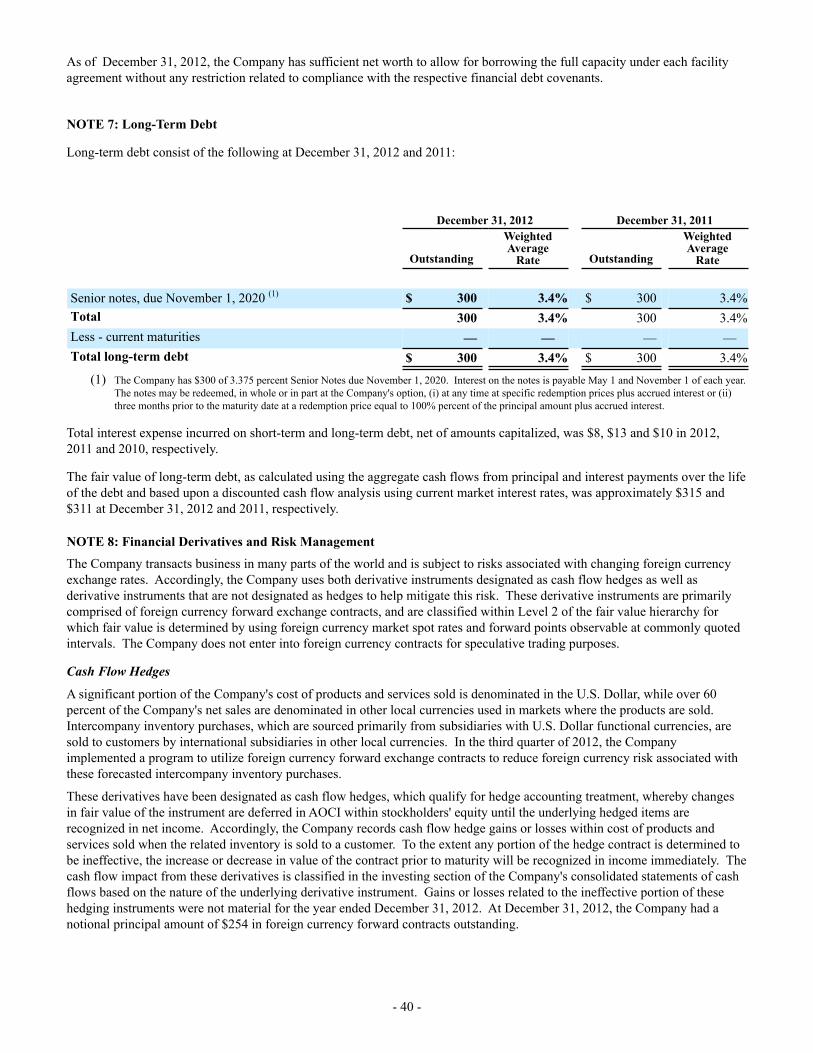
- 40 -
As of December 31, 2012, the Company has sufficient net worth to allow for borrowing the full capacity under each facility agreement without any restriction related to compliance with the respective financial debt covenants.
NOTE 7: Long-Term Debt
Long-term debt consist of the following at December 31, 2012 and 2011:
December 31, 2012 December 31, 2011
Outstanding
WeightedAverage
Rate Outstanding
WeightedAverage
Rate
Senior notes, due November 1, 2020 (1) $ 300 3.4% $ 300 3.4%Total 300 3.4% 300 3.4%Less - current maturities — — — —Total long-term debt $ 300 3.4% $ 300 3.4%
(1) The Company has $300 of 3.375 percent Senior Notes due November 1, 2020. Interest on the notes is payable May 1 and November 1 of each year. The notes may be redeemed, in whole or in part at the Company's option, (i) at any time at specific redemption prices plus accrued interest or (ii) three months prior to the maturity date at a redemption price equal to 100% percent of the principal amount plus accrued interest.
Total interest expense incurred on short-term and long-term debt, net of amounts capitalized, was $8, $13 and $10 in 2012, 2011 and 2010, respectively.
The fair value of long-term debt, as calculated using the aggregate cash flows from principal and interest payments over the life of the debt and based upon a discounted cash flow analysis using current market interest rates, was approximately $315 and $311 at December 31, 2012 and 2011, respectively.
NOTE 8: Financial Derivatives and Risk Management The Company transacts business in many parts of the world and is subject to risks associated with changing foreign currency exchange rates. Accordingly, the Company uses both derivative instruments designated as cash flow hedges as well as derivative instruments that are not designated as hedges to help mitigate this risk. These derivative instruments are primarily comprised of foreign currency forward exchange contracts, and are classified within Level 2 of the fair value hierarchy for which fair value is determined by using foreign currency market spot rates and forward points observable at commonly quoted intervals. The Company does not enter into foreign currency contracts for speculative trading purposes.
Cash Flow Hedges
A significant portion of the Company's cost of products and services sold is denominated in the U.S. Dollar, while over 60 percent of the Company's net sales are denominated in other local currencies used in markets where the products are sold. Intercompany inventory purchases, which are sourced primarily from subsidiaries with U.S. Dollar functional currencies, are sold to customers by international subsidiaries in other local currencies. In the third quarter of 2012, the Company implemented a program to utilize foreign currency forward exchange contracts to reduce foreign currency risk associated with these forecasted intercompany inventory purchases.
These derivatives have been designated as cash flow hedges, which qualify for hedge accounting treatment, whereby changes in fair value of the instrument are deferred in AOCI within stockholders' equity until the underlying hedged items are recognized in net income. Accordingly, the Company records cash flow hedge gains or losses within cost of products and services sold when the related inventory is sold to a customer. To the extent any portion of the hedge contract is determined to be ineffective, the increase or decrease in value of the contract prior to maturity will be recognized in income immediately. The cash flow impact from these derivatives is classified in the investing section of the Company's consolidated statements of cash flows based on the nature of the underlying derivative instrument. Gains or losses related to the ineffective portion of these hedging instruments were not material for the year ended December 31, 2012. At December 31, 2012, the Company had a notional principal amount of $254 in foreign currency forward contracts outstanding.
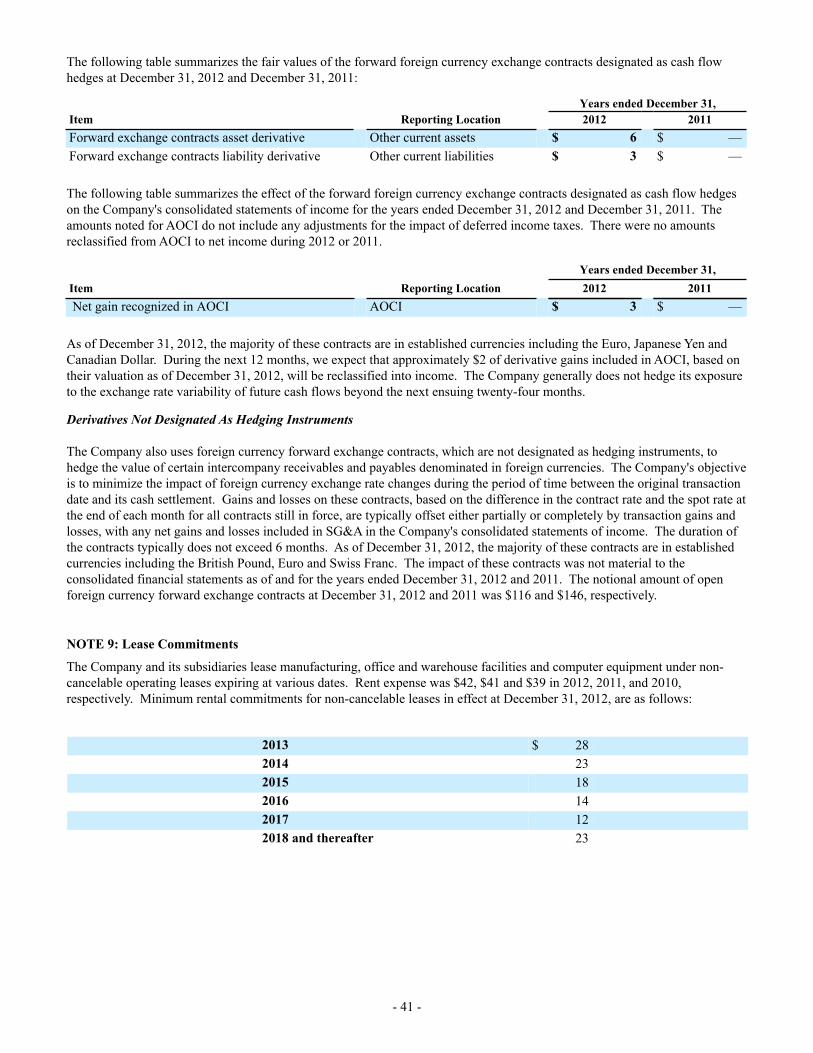
- 41 -
The following table summarizes the fair values of the forward foreign currency exchange contracts designated as cash flow hedges at December 31, 2012 and December 31, 2011:
Years ended December 31,Item Reporting Location 2012 2011Forward exchange contracts asset derivative Other current assets $ 6 $ —Forward exchange contracts liability derivative Other current liabilities $ 3 $ —
The following table summarizes the effect of the forward foreign currency exchange contracts designated as cash flow hedges on the Company's consolidated statements of income for the years ended December 31, 2012 and December 31, 2011. The amounts noted for AOCI do not include any adjustments for the impact of deferred income taxes. There were no amounts reclassified from AOCI to net income during 2012 or 2011.
Years ended December 31,Item Reporting Location 2012 2011 Net gain recognized in AOCI AOCI $ 3 $ —
As of December 31, 2012, the majority of these contracts are in established currencies including the Euro, Japanese Yen and Canadian Dollar. During the next 12 months, we expect that approximately $2 of derivative gains included in AOCI, based on their valuation as of December 31, 2012, will be reclassified into income. The Company generally does not hedge its exposure to the exchange rate variability of future cash flows beyond the next ensuing twenty-four months.
Derivatives Not Designated As Hedging Instruments
The Company also uses foreign currency forward exchange contracts, which are not designated as hedging instruments, to hedge the value of certain intercompany receivables and payables denominated in foreign currencies. The Company's objective is to minimize the impact of foreign currency exchange rate changes during the period of time between the original transaction date and its cash settlement. Gains and losses on these contracts, based on the difference in the contract rate and the spot rate at the end of each month for all contracts still in force, are typically offset either partially or completely by transaction gains and losses, with any net gains and losses included in SG&A in the Company's consolidated statements of income. The duration of the contracts typically does not exceed 6 months. As of December 31, 2012, the majority of these contracts are in established currencies including the British Pound, Euro and Swiss Franc. The impact of these contracts was not material to the consolidated financial statements as of and for the years ended December 31, 2012 and 2011. The notional amount of open foreign currency forward exchange contracts at December 31, 2012 and 2011 was $116 and $146, respectively.
NOTE 9: Lease Commitments
The Company and its subsidiaries lease manufacturing, office and warehouse facilities and computer equipment under non-cancelable operating leases expiring at various dates. Rent expense was $42, $41 and $39 in 2012, 2011, and 2010, respectively. Minimum rental commitments for non-cancelable leases in effect at December 31, 2012, are as follows:
2013 $ 282014 232015 182016 142017 122018 and thereafter 23
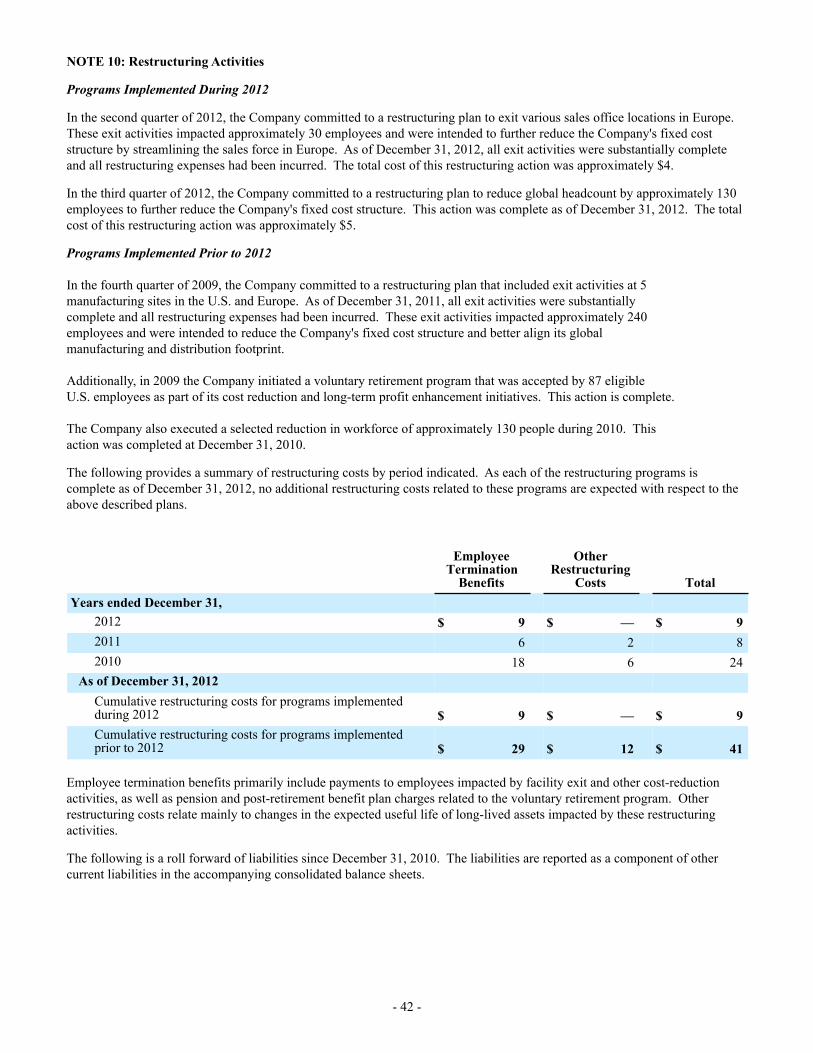
- 42 -
NOTE 10: Restructuring Activities
Programs Implemented During 2012
In the second quarter of 2012, the Company committed to a restructuring plan to exit various sales office locations in Europe. These exit activities impacted approximately 30 employees and were intended to further reduce the Company's fixed cost structure by streamlining the sales force in Europe. As of December 31, 2012, all exit activities were substantially complete and all restructuring expenses had been incurred. The total cost of this restructuring action was approximately $4.
In the third quarter of 2012, the Company committed to a restructuring plan to reduce global headcount by approximately 130 employees to further reduce the Company's fixed cost structure. This action was complete as of December 31, 2012. The total cost of this restructuring action was approximately $5.
Programs Implemented Prior to 2012
In the fourth quarter of 2009, the Company committed to a restructuring plan that included exit activities at 5 manufacturing sites in the U.S. and Europe. As of December 31, 2011, all exit activities were substantiallycomplete and all restructuring expenses had been incurred. These exit activities impacted approximately 240 employees and were intended to reduce the Company's fixed cost structure and better align its globalmanufacturing and distribution footprint.
Additionally, in 2009 the Company initiated a voluntary retirement program that was accepted by 87 eligibleU.S. employees as part of its cost reduction and long-term profit enhancement initiatives. This action is complete.
The Company also executed a selected reduction in workforce of approximately 130 people during 2010. Thisaction was completed at December 31, 2010.
The following provides a summary of restructuring costs by period indicated. As each of the restructuring programs is complete as of December 31, 2012, no additional restructuring costs related to these programs are expected with respect to the above described plans.
EmployeeTermination
Benefits
OtherRestructuring
Costs TotalYears ended December 31,
2012 $ 9 $ — $ 92011 6 2 82010 18 6 24
As of December 31, 2012Cumulative restructuring costs for programs implementedduring 2012 $ 9 $ — $ 9Cumulative restructuring costs for programs implementedprior to 2012 $ 29 $ 12 $ 41
Employee termination benefits primarily include payments to employees impacted by facility exit and other cost-reduction activities, as well as pension and post-retirement benefit plan charges related to the voluntary retirement program. Other restructuring costs relate mainly to changes in the expected useful life of long-lived assets impacted by these restructuring activities.
The following is a roll forward of liabilities since December 31, 2010. The liabilities are reported as a component of other current liabilities in the accompanying consolidated balance sheets.
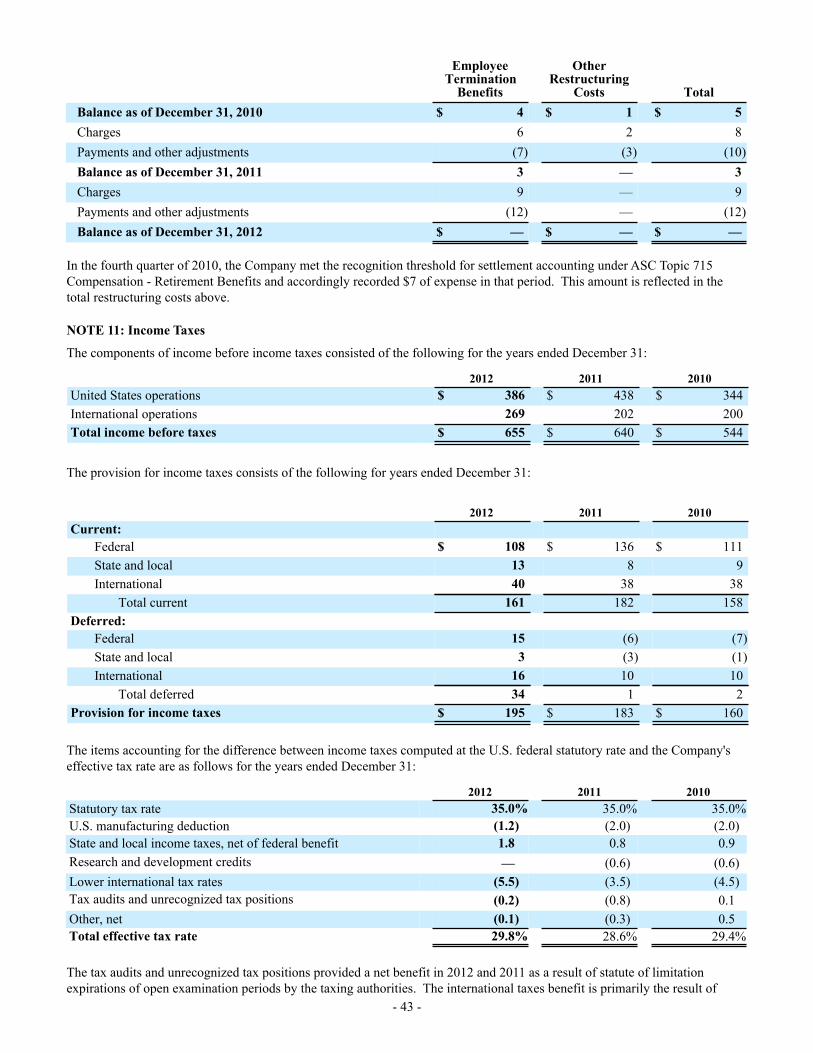
- 43 -
EmployeeTermination
Benefits
OtherRestructuring
Costs TotalBalance as of December 31, 2010 $ 4 $ 1 $ 5Charges 6 2 8Payments and other adjustments (7) (3) (10)Balance as of December 31, 2011 3 — 3Charges 9 — 9Payments and other adjustments (12) — (12)Balance as of December 31, 2012 $ — $ — $ —
In the fourth quarter of 2010, the Company met the recognition threshold for settlement accounting under ASC Topic 715 Compensation - Retirement Benefits and accordingly recorded $7 of expense in that period. This amount is reflected in the total restructuring costs above.
NOTE 11: Income Taxes
The components of income before income taxes consisted of the following for the years ended December 31:
2012 2011 2010United States operations $ 386 $ 438 $ 344International operations 269 202 200Total income before taxes $ 655 $ 640 $ 544
The provision for income taxes consists of the following for years ended December 31:
2012 2011 2010Current:
Federal $ 108 $ 136 $ 111State and local 13 8 9International 40 38 38
Total current 161 182 158Deferred:
Federal 15 (6) (7)State and local 3 (3) (1)International 16 10 10
Total deferred 34 1 2Provision for income taxes $ 195 $ 183 $ 160
The items accounting for the difference between income taxes computed at the U.S. federal statutory rate and the Company's effective tax rate are as follows for the years ended December 31:
2012 2011 2010Statutory tax rate 35.0% 35.0% 35.0%U.S. manufacturing deduction (1.2) (2.0) (2.0)State and local income taxes, net of federal benefit 1.8 0.8 0.9Research and development credits — (0.6) (0.6)Lower international tax rates (5.5) (3.5) (4.5)Tax audits and unrecognized tax positions (0.2) (0.8) 0.1Other, net (0.1) (0.3) 0.5Total effective tax rate 29.8% 28.6% 29.4%
The tax audits and unrecognized tax positions provided a net benefit in 2012 and 2011 as a result of statute of limitation expirations of open examination periods by the taxing authorities. The international taxes benefit is primarily the result of
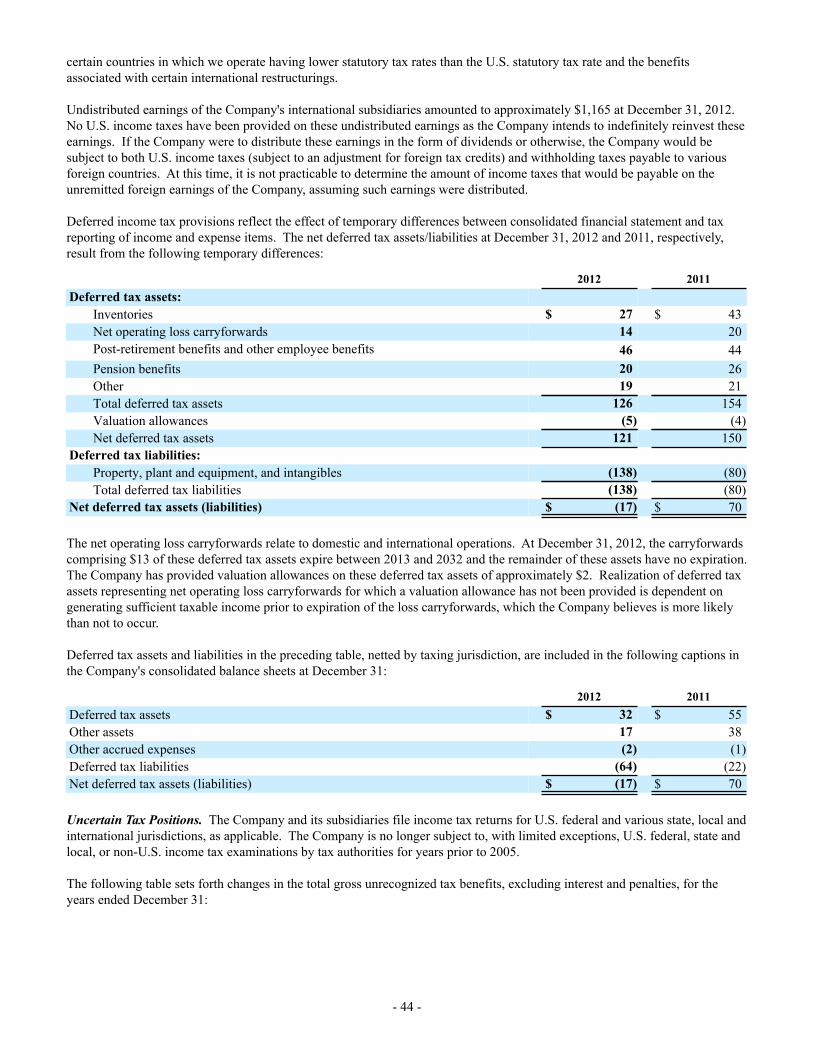
- 44 -
certain countries in which we operate having lower statutory tax rates than the U.S. statutory tax rate and the benefits associated with certain international restructurings.
Undistributed earnings of the Company's international subsidiaries amounted to approximately $1,165 at December 31, 2012. No U.S. income taxes have been provided on these undistributed earnings as the Company intends to indefinitely reinvest these earnings. If the Company were to distribute these earnings in the form of dividends or otherwise, the Company would be subject to both U.S. income taxes (subject to an adjustment for foreign tax credits) and withholding taxes payable to various foreign countries. At this time, it is not practicable to determine the amount of income taxes that would be payable on the unremitted foreign earnings of the Company, assuming such earnings were distributed.
Deferred income tax provisions reflect the effect of temporary differences between consolidated financial statement and tax reporting of income and expense items. The net deferred tax assets/liabilities at December 31, 2012 and 2011, respectively, result from the following temporary differences:
2012 2011Deferred tax assets:
Inventories $ 27 $ 43Net operating loss carryforwards 14 20Post-retirement benefits and other employee benefits 46 44Pension benefits 20 26Other 19 21Total deferred tax assets 126 154Valuation allowances (5) (4)Net deferred tax assets 121 150
Deferred tax liabilities:Property, plant and equipment, and intangibles (138) (80)Total deferred tax liabilities (138) (80)
Net deferred tax assets (liabilities) $ (17) $ 70
The net operating loss carryforwards relate to domestic and international operations. At December 31, 2012, the carryforwards comprising $13 of these deferred tax assets expire between 2013 and 2032 and the remainder of these assets have no expiration. The Company has provided valuation allowances on these deferred tax assets of approximately $2. Realization of deferred tax assets representing net operating loss carryforwards for which a valuation allowance has not been provided is dependent on generating sufficient taxable income prior to expiration of the loss carryforwards, which the Company believes is more likely than not to occur.
Deferred tax assets and liabilities in the preceding table, netted by taxing jurisdiction, are included in the following captions in the Company's consolidated balance sheets at December 31:
2012 2011Deferred tax assets $ 32 $ 55Other assets 17 38Other accrued expenses (2) (1)Deferred tax liabilities (64) (22)Net deferred tax assets (liabilities) $ (17) $ 70
Uncertain Tax Positions. The Company and its subsidiaries file income tax returns for U.S. federal and various state, local and international jurisdictions, as applicable. The Company is no longer subject to, with limited exceptions, U.S. federal, state and local, or non-U.S. income tax examinations by tax authorities for years prior to 2005.
The following table sets forth changes in the total gross unrecognized tax benefits, excluding interest and penalties, for the years ended December 31:
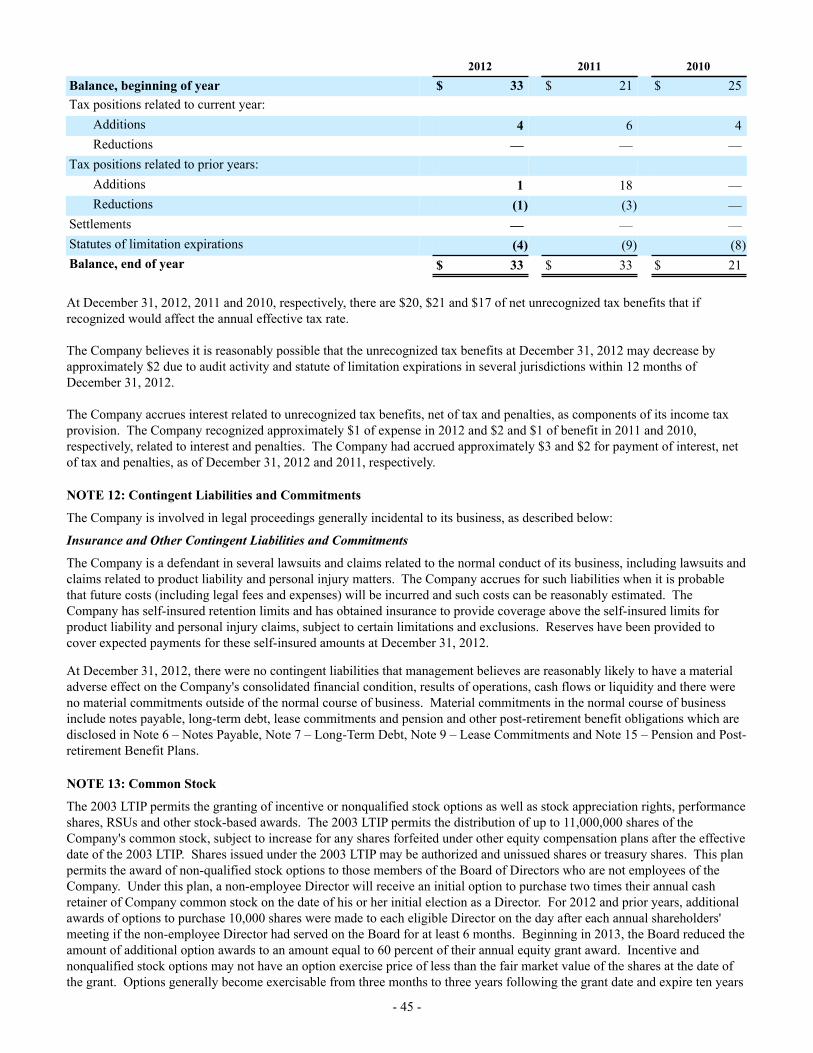
- 45 -
2012 2011 2010Balance, beginning of year $ 33 $ 21 $ 25Tax positions related to current year:
Additions 4 6 4Reductions — — —
Tax positions related to prior years:Additions 1 18 —Reductions (1) (3) —
Settlements — — —Statutes of limitation expirations (4) (9) (8)Balance, end of year $ 33 $ 33 $ 21
At December 31, 2012, 2011 and 2010, respectively, there are $20, $21 and $17 of net unrecognized tax benefits that if recognized would affect the annual effective tax rate.
The Company believes it is reasonably possible that the unrecognized tax benefits at December 31, 2012 may decrease by approximately $2 due to audit activity and statute of limitation expirations in several jurisdictions within 12 months of December 31, 2012.
The Company accrues interest related to unrecognized tax benefits, net of tax and penalties, as components of its income tax provision. The Company recognized approximately $1 of expense in 2012 and $2 and $1 of benefit in 2011 and 2010, respectively, related to interest and penalties. The Company had accrued approximately $3 and $2 for payment of interest, net of tax and penalties, as of December 31, 2012 and 2011, respectively.
NOTE 12: Contingent Liabilities and Commitments
The Company is involved in legal proceedings generally incidental to its business, as described below:
Insurance and Other Contingent Liabilities and Commitments
The Company is a defendant in several lawsuits and claims related to the normal conduct of its business, including lawsuits and claims related to product liability and personal injury matters. The Company accrues for such liabilities when it is probable that future costs (including legal fees and expenses) will be incurred and such costs can be reasonably estimated. The Company has self-insured retention limits and has obtained insurance to provide coverage above the self-insured limits for product liability and personal injury claims, subject to certain limitations and exclusions. Reserves have been provided to cover expected payments for these self-insured amounts at December 31, 2012.
At December 31, 2012, there were no contingent liabilities that management believes are reasonably likely to have a material adverse effect on the Company's consolidated financial condition, results of operations, cash flows or liquidity and there were no material commitments outside of the normal course of business. Material commitments in the normal course of business include notes payable, long-term debt, lease commitments and pension and other post-retirement benefit obligations which are disclosed in Note 6 – Notes Payable, Note 7 – Long-Term Debt, Note 9 – Lease Commitments and Note 15 – Pension and Post-retirement Benefit Plans.
NOTE 13: Common Stock
The 2003 LTIP permits the granting of incentive or nonqualified stock options as well as stock appreciation rights, performance shares, RSUs and other stock-based awards. The 2003 LTIP permits the distribution of up to 11,000,000 shares of the Company's common stock, subject to increase for any shares forfeited under other equity compensation plans after the effective date of the 2003 LTIP. Shares issued under the 2003 LTIP may be authorized and unissued shares or treasury shares. This plan permits the award of non-qualified stock options to those members of the Board of Directors who are not employees of the Company. Under this plan, a non-employee Director will receive an initial option to purchase two times their annual cash retainer of Company common stock on the date of his or her initial election as a Director. For 2012 and prior years, additional awards of options to purchase 10,000 shares were made to each eligible Director on the day after each annual shareholders' meeting if the non-employee Director had served on the Board for at least 6 months. Beginning in 2013, the Board reduced the amount of additional option awards to an amount equal to 60 percent of their annual equity grant award. Incentive and nonqualified stock options may not have an option exercise price of less than the fair market value of the shares at the date of the grant. Options generally become exercisable from three months to three years following the grant date and expire ten years
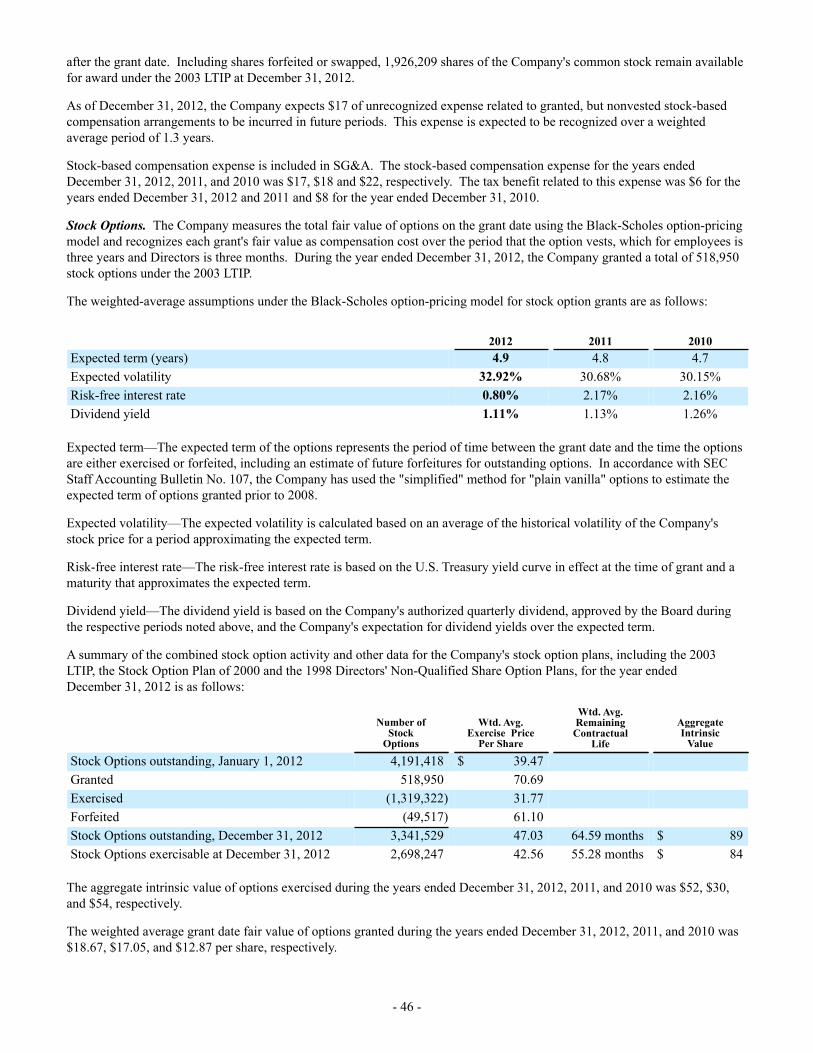
- 46 -
after the grant date. Including shares forfeited or swapped, 1,926,209 shares of the Company's common stock remain available for award under the 2003 LTIP at December 31, 2012.
As of December 31, 2012, the Company expects $17 of unrecognized expense related to granted, but nonvested stock-based compensation arrangements to be incurred in future periods. This expense is expected to be recognized over a weighted average period of 1.3 years.
Stock-based compensation expense is included in SG&A. The stock-based compensation expense for the years ended December 31, 2012, 2011, and 2010 was $17, $18 and $22, respectively. The tax benefit related to this expense was $6 for the years ended December 31, 2012 and 2011 and $8 for the year ended December 31, 2010.
Stock Options. The Company measures the total fair value of options on the grant date using the Black-Scholes option-pricing model and recognizes each grant's fair value as compensation cost over the period that the option vests, which for employees is three years and Directors is three months. During the year ended December 31, 2012, the Company granted a total of 518,950 stock options under the 2003 LTIP.
The weighted-average assumptions under the Black-Scholes option-pricing model for stock option grants are as follows:
2012 2011 2010Expected term (years) 4.9 4.8 4.7Expected volatility 32.92% 30.68% 30.15%Risk-free interest rate 0.80% 2.17% 2.16%Dividend yield 1.11% 1.13% 1.26%
Expected term—The expected term of the options represents the period of time between the grant date and the time the options are either exercised or forfeited, including an estimate of future forfeitures for outstanding options. In accordance with SEC Staff Accounting Bulletin No. 107, the Company has used the "simplified" method for "plain vanilla" options to estimate the expected term of options granted prior to 2008.
Expected volatility—The expected volatility is calculated based on an average of the historical volatility of the Company's stock price for a period approximating the expected term.
Risk-free interest rate—The risk-free interest rate is based on the U.S. Treasury yield curve in effect at the time of grant and a maturity that approximates the expected term.
Dividend yield—The dividend yield is based on the Company's authorized quarterly dividend, approved by the Board during the respective periods noted above, and the Company's expectation for dividend yields over the expected term.
A summary of the combined stock option activity and other data for the Company's stock option plans, including the 2003 LTIP, the Stock Option Plan of 2000 and the 1998 Directors' Non-Qualified Share Option Plans, for the year ended December 31, 2012 is as follows:
Number ofStock
Options
Wtd. Avg.Exercise Price
Per Share
Wtd. Avg.RemainingContractual
Life
AggregateIntrinsic
Value
Stock Options outstanding, January 1, 2012 4,191,418 $ 39.47Granted 518,950 70.69Exercised (1,319,322) 31.77Forfeited (49,517) 61.10Stock Options outstanding, December 31, 2012 3,341,529 47.03 64.59 months $ 89Stock Options exercisable at December 31, 2012 2,698,247 42.56 55.28 months $ 84
The aggregate intrinsic value of options exercised during the years ended December 31, 2012, 2011, and 2010 was $52, $30, and $54, respectively.
The weighted average grant date fair value of options granted during the years ended December 31, 2012, 2011, and 2010 was $18.67, $17.05, and $12.87 per share, respectively.
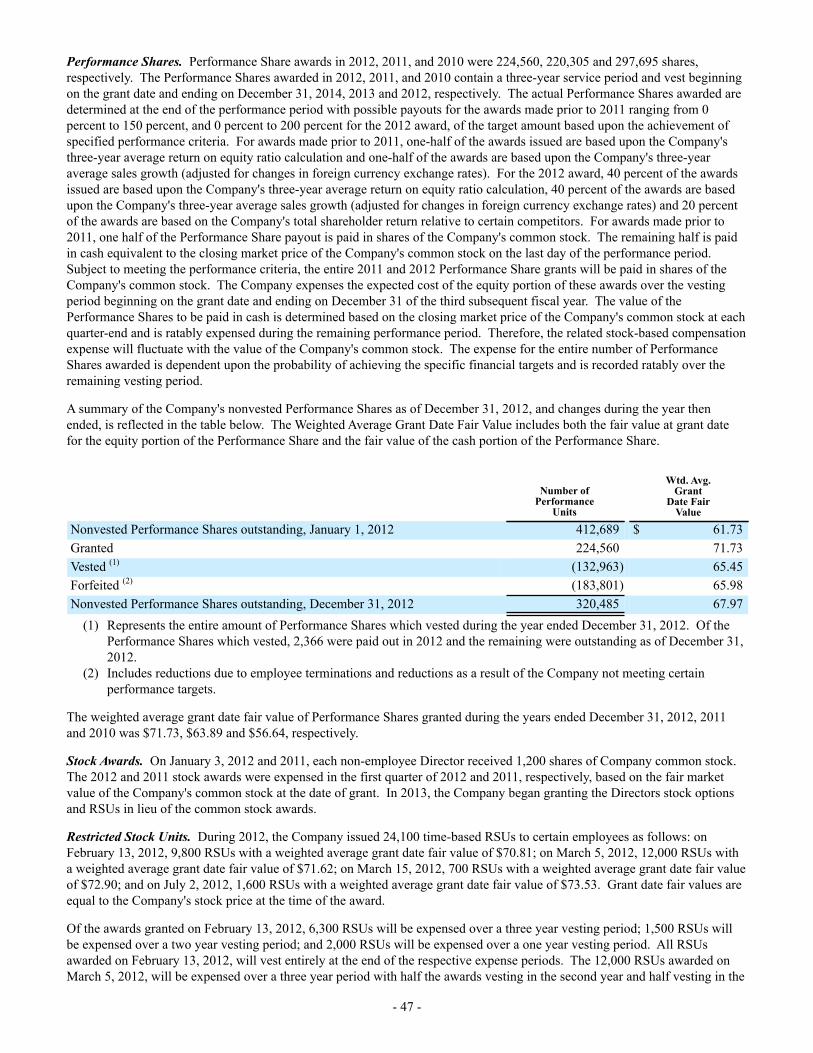
- 47 -
Performance Shares. Performance Share awards in 2012, 2011, and 2010 were 224,560, 220,305 and 297,695 shares, respectively. The Performance Shares awarded in 2012, 2011, and 2010 contain a three-year service period and vest beginning on the grant date and ending on December 31, 2014, 2013 and 2012, respectively. The actual Performance Shares awarded are determined at the end of the performance period with possible payouts for the awards made prior to 2011 ranging from 0 percent to 150 percent, and 0 percent to 200 percent for the 2012 award, of the target amount based upon the achievement of specified performance criteria. For awards made prior to 2011, one-half of the awards issued are based upon the Company's three-year average return on equity ratio calculation and one-half of the awards are based upon the Company's three-year average sales growth (adjusted for changes in foreign currency exchange rates). For the 2012 award, 40 percent of the awards issued are based upon the Company's three-year average return on equity ratio calculation, 40 percent of the awards are based upon the Company's three-year average sales growth (adjusted for changes in foreign currency exchange rates) and 20 percent of the awards are based on the Company's total shareholder return relative to certain competitors. For awards made prior to 2011, one half of the Performance Share payout is paid in shares of the Company's common stock. The remaining half is paid in cash equivalent to the closing market price of the Company's common stock on the last day of the performance period. Subject to meeting the performance criteria, the entire 2011 and 2012 Performance Share grants will be paid in shares of the Company's common stock. The Company expenses the expected cost of the equity portion of these awards over the vesting period beginning on the grant date and ending on December 31 of the third subsequent fiscal year. The value of the Performance Shares to be paid in cash is determined based on the closing market price of the Company's common stock at each quarter-end and is ratably expensed during the remaining performance period. Therefore, the related stock-based compensation expense will fluctuate with the value of the Company's common stock. The expense for the entire number of Performance Shares awarded is dependent upon the probability of achieving the specific financial targets and is recorded ratably over the remaining vesting period.
A summary of the Company's nonvested Performance Shares as of December 31, 2012, and changes during the year then ended, is reflected in the table below. The Weighted Average Grant Date Fair Value includes both the fair value at grant date for the equity portion of the Performance Share and the fair value of the cash portion of the Performance Share.
Number ofPerformance
Units
Wtd. Avg.Grant
Date FairValue
Nonvested Performance Shares outstanding, January 1, 2012 412,689 $ 61.73Granted 224,560 71.73Vested (1) (132,963) 65.45Forfeited (2) (183,801) 65.98Nonvested Performance Shares outstanding, December 31, 2012 320,485 67.97
(1) Represents the entire amount of Performance Shares which vested during the year ended December 31, 2012. Of the Performance Shares which vested, 2,366 were paid out in 2012 and the remaining were outstanding as of December 31, 2012.
(2) Includes reductions due to employee terminations and reductions as a result of the Company not meeting certain performance targets.
The weighted average grant date fair value of Performance Shares granted during the years ended December 31, 2012, 2011 and 2010 was $71.73, $63.89 and $56.64, respectively.
Stock Awards. On January 3, 2012 and 2011, each non-employee Director received 1,200 shares of Company common stock. The 2012 and 2011 stock awards were expensed in the first quarter of 2012 and 2011, respectively, based on the fair market value of the Company's common stock at the date of grant. In 2013, the Company began granting the Directors stock options and RSUs in lieu of the common stock awards.
Restricted Stock Units. During 2012, the Company issued 24,100 time-based RSUs to certain employees as follows: on February 13, 2012, 9,800 RSUs with a weighted average grant date fair value of $70.81; on March 5, 2012, 12,000 RSUs with a weighted average grant date fair value of $71.62; on March 15, 2012, 700 RSUs with a weighted average grant date fair value of $72.90; and on July 2, 2012, 1,600 RSUs with a weighted average grant date fair value of $73.53. Grant date fair values are equal to the Company's stock price at the time of the award.
Of the awards granted on February 13, 2012, 6,300 RSUs will be expensed over a three year vesting period; 1,500 RSUs will be expensed over a two year vesting period; and 2,000 RSUs will be expensed over a one year vesting period. All RSUs awarded on February 13, 2012, will vest entirely at the end of the respective expense periods. The 12,000 RSUs awarded on March 5, 2012, will be expensed over a three year period with half the awards vesting in the second year and half vesting in the
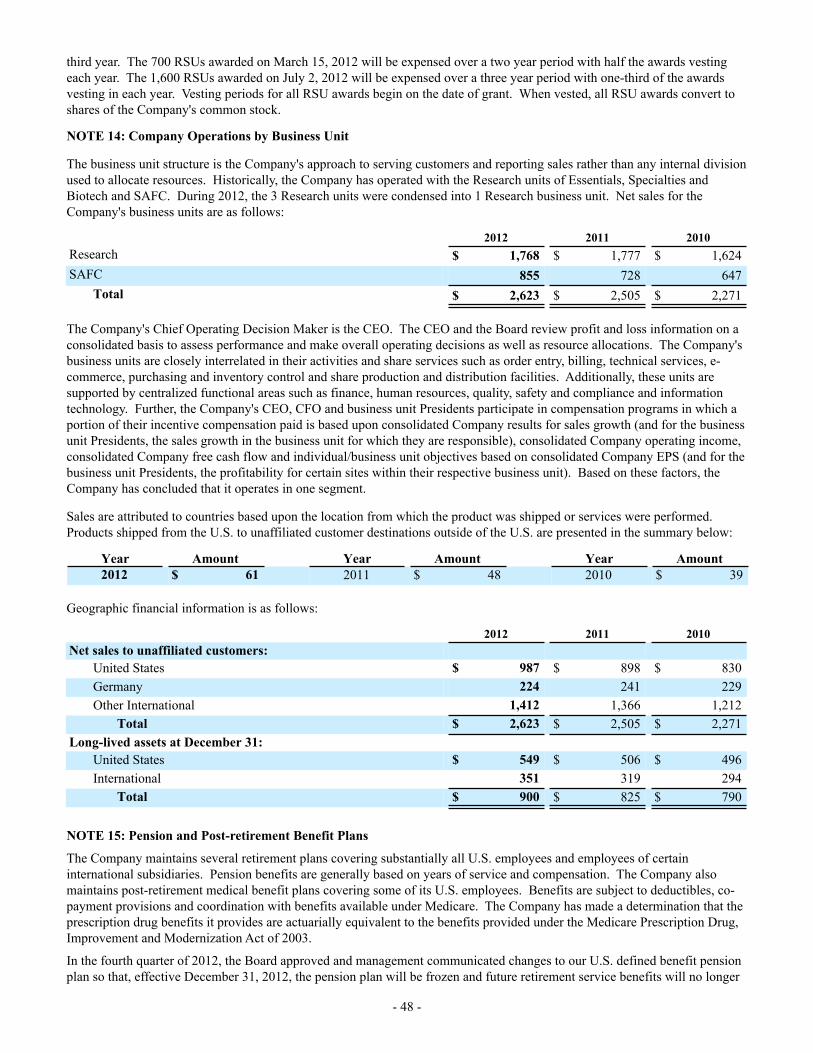
- 48 -
third year. The 700 RSUs awarded on March 15, 2012 will be expensed over a two year period with half the awards vesting each year. The 1,600 RSUs awarded on July 2, 2012 will be expensed over a three year period with one-third of the awards vesting in each year. Vesting periods for all RSU awards begin on the date of grant. When vested, all RSU awards convert to shares of the Company's common stock.
NOTE 14: Company Operations by Business Unit
The business unit structure is the Company's approach to serving customers and reporting sales rather than any internal division used to allocate resources. Historically, the Company has operated with the Research units of Essentials, Specialties and Biotech and SAFC. During 2012, the 3 Research units were condensed into 1 Research business unit. Net sales for the Company's business units are as follows:
2012 2011 2010Research $ 1,768 $ 1,777 $ 1,624SAFC 855 728 647
Total $ 2,623 $ 2,505 $ 2,271
The Company's Chief Operating Decision Maker is the CEO. The CEO and the Board review profit and loss information on a consolidated basis to assess performance and make overall operating decisions as well as resource allocations. The Company's business units are closely interrelated in their activities and share services such as order entry, billing, technical services, e-commerce, purchasing and inventory control and share production and distribution facilities. Additionally, these units are supported by centralized functional areas such as finance, human resources, quality, safety and compliance and information technology. Further, the Company's CEO, CFO and business unit Presidents participate in compensation programs in which a portion of their incentive compensation paid is based upon consolidated Company results for sales growth (and for the business unit Presidents, the sales growth in the business unit for which they are responsible), consolidated Company operating income, consolidated Company free cash flow and individual/business unit objectives based on consolidated Company EPS (and for the business unit Presidents, the profitability for certain sites within their respective business unit). Based on these factors, the Company has concluded that it operates in one segment.
Sales are attributed to countries based upon the location from which the product was shipped or services were performed. Products shipped from the U.S. to unaffiliated customer destinations outside of the U.S. are presented in the summary below:
Year Amount Year Amount Year Amount2012 $ 61 2011 $ 48 2010 $ 39
Geographic financial information is as follows:
2012 2011 2010Net sales to unaffiliated customers:
United States $ 987 $ 898 $ 830Germany 224 241 229Other International 1,412 1,366 1,212
Total $ 2,623 $ 2,505 $ 2,271Long-lived assets at December 31:
United States $ 549 $ 506 $ 496International 351 319 294
Total $ 900 $ 825 $ 790
NOTE 15: Pension and Post-retirement Benefit Plans
The Company maintains several retirement plans covering substantially all U.S. employees and employees of certain international subsidiaries. Pension benefits are generally based on years of service and compensation. The Company also maintains post-retirement medical benefit plans covering some of its U.S. employees. Benefits are subject to deductibles, co-payment provisions and coordination with benefits available under Medicare. The Company has made a determination that the prescription drug benefits it provides are actuarially equivalent to the benefits provided under the Medicare Prescription Drug, Improvement and Modernization Act of 2003.
In the fourth quarter of 2012, the Board approved and management communicated changes to our U.S. defined benefit pension plan so that, effective December 31, 2012, the pension plan will be frozen and future retirement service benefits will no longer
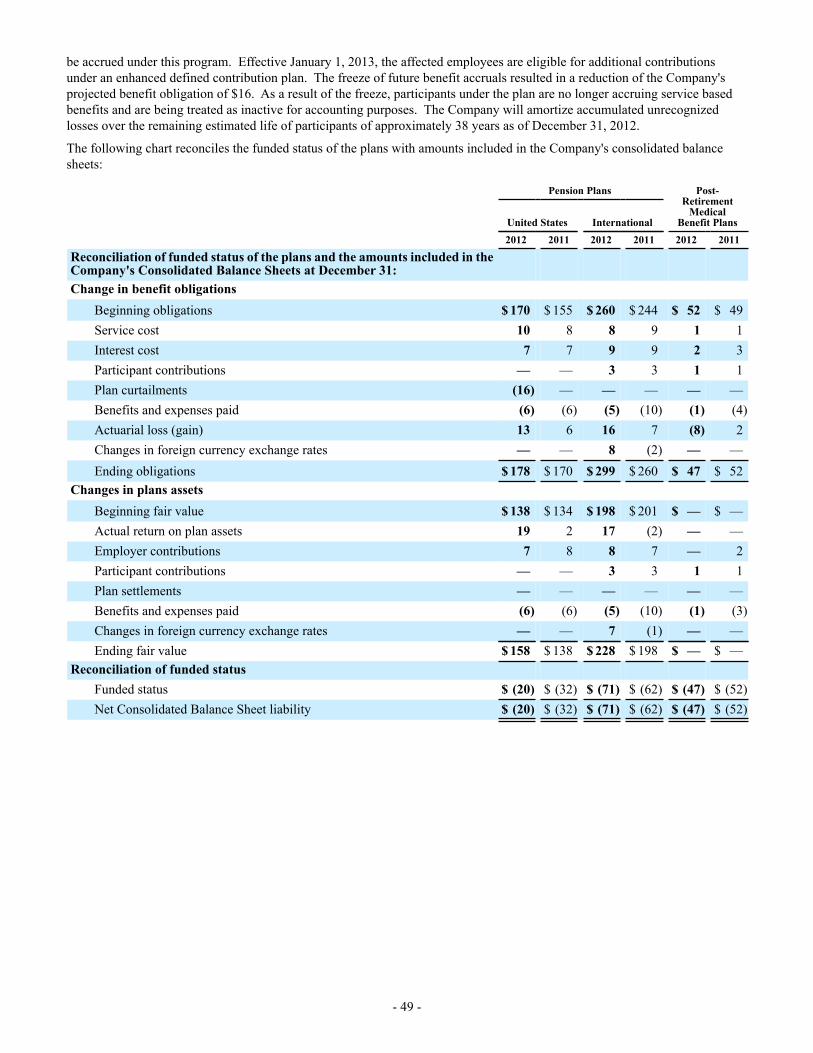
- 49 -
be accrued under this program. Effective January 1, 2013, the affected employees are eligible for additional contributions under an enhanced defined contribution plan. The freeze of future benefit accruals resulted in a reduction of the Company's projected benefit obligation of $16. As a result of the freeze, participants under the plan are no longer accruing service based benefits and are being treated as inactive for accounting purposes. The Company will amortize accumulated unrecognized losses over the remaining estimated life of participants of approximately 38 years as of December 31, 2012.
The following chart reconciles the funded status of the plans with amounts included in the Company's consolidated balance sheets:
Pension Plans Post-Retirement
Medical Benefit Plans United States International
2012 2011 2012 2011 2012 2011
Reconciliation of funded status of the plans and the amounts included in the Company's Consolidated Balance Sheets at December 31:Change in benefit obligations
Beginning obligations $ 170 $ 155 $ 260 $ 244 $ 52 $ 49Service cost 10 8 8 9 1 1Interest cost 7 7 9 9 2 3Participant contributions — — 3 3 1 1Plan curtailments (16) — — — — —Benefits and expenses paid (6) (6) (5) (10) (1) (4)Actuarial loss (gain) 13 6 16 7 (8) 2Changes in foreign currency exchange rates — — 8 (2) — —Ending obligations $ 178 $ 170 $ 299 $ 260 $ 47 $ 52
Changes in plans assetsBeginning fair value $ 138 $ 134 $ 198 $ 201 $ — $ —Actual return on plan assets 19 2 17 (2) — —Employer contributions 7 8 8 7 — 2Participant contributions — — 3 3 1 1Plan settlements — — — — — —Benefits and expenses paid (6) (6) (5) (10) (1) (3)Changes in foreign currency exchange rates — — 7 (1) — —Ending fair value $ 158 $ 138 $ 228 $ 198 $ — $ —
Reconciliation of funded statusFunded status $ (20) $ (32) $ (71) $ (62) $ (47) $ (52)Net Consolidated Balance Sheet liability $ (20) $ (32) $ (71) $ (62) $ (47) $ (52)
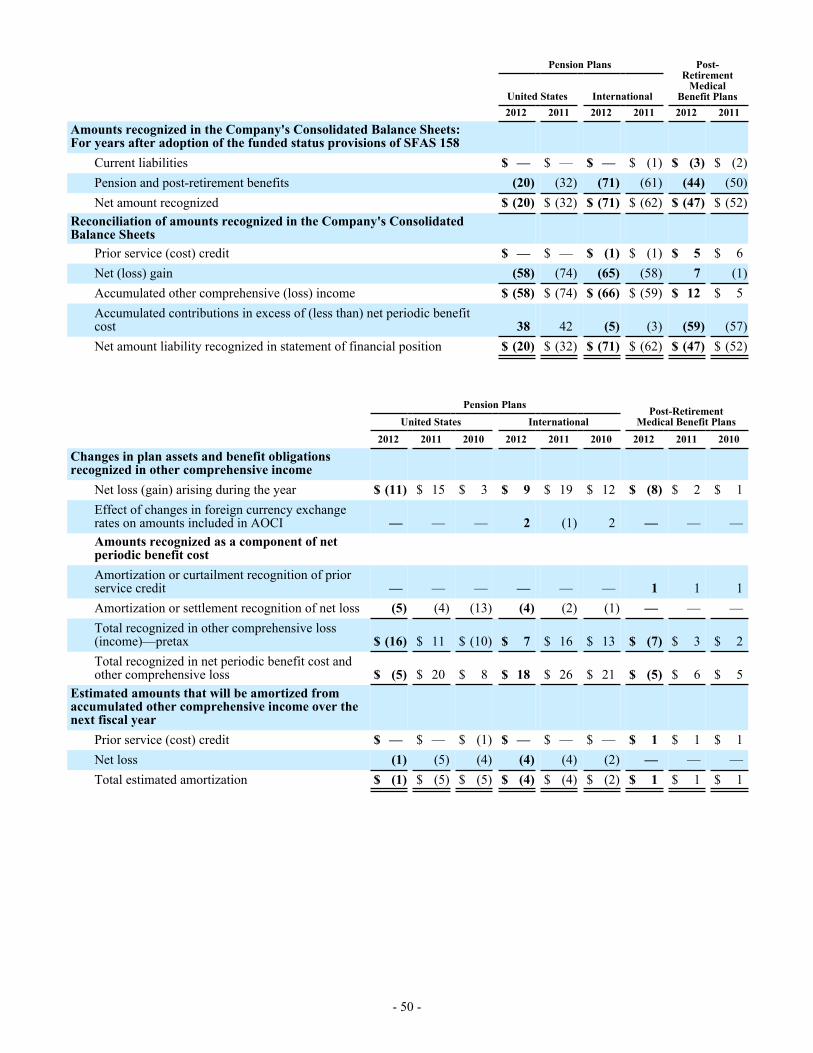
- 50 -
Pension Plans Post-Retirement
Medical Benefit Plans United States International
2012 2011 2012 2011 2012 2011
Amounts recognized in the Company's Consolidated Balance Sheets:For years after adoption of the funded status provisions of SFAS 158
Current liabilities $ — $ — $ — $ (1) $ (3) $ (2)Pension and post-retirement benefits (20) (32) (71) (61) (44) (50)Net amount recognized $ (20) $ (32) $ (71) $ (62) $ (47) $ (52)
Reconciliation of amounts recognized in the Company's ConsolidatedBalance Sheets
Prior service (cost) credit $ — $ — $ (1) $ (1) $ 5 $ 6Net (loss) gain (58) (74) (65) (58) 7 (1)Accumulated other comprehensive (loss) income $ (58) $ (74) $ (66) $ (59) $ 12 $ 5Accumulated contributions in excess of (less than) net periodic benefitcost 38 42 (5) (3) (59) (57)Net amount liability recognized in statement of financial position $ (20) $ (32) $ (71) $ (62) $ (47) $ (52)
Pension Plans Post-RetirementMedical Benefit Plans United States International
2012 2011 2010 2012 2011 2010 2012 2011 2010
Changes in plan assets and benefit obligationsrecognized in other comprehensive income
Net loss (gain) arising during the year $ (11) $ 15 $ 3 $ 9 $ 19 $ 12 $ (8) $ 2 $ 1Effect of changes in foreign currency exchangerates on amounts included in AOCI — — — 2 (1) 2 — — —Amounts recognized as a component of netperiodic benefit costAmortization or curtailment recognition of priorservice credit — — — — — — 1 1 1Amortization or settlement recognition of net loss (5) (4) (13) (4) (2) (1) — — —Total recognized in other comprehensive loss(income)—pretax $ (16) $ 11 $ (10) $ 7 $ 16 $ 13 $ (7) $ 3 $ 2Total recognized in net periodic benefit cost andother comprehensive loss $ (5) $ 20 $ 8 $ 18 $ 26 $ 21 $ (5) $ 6 $ 5
Estimated amounts that will be amortized fromaccumulated other comprehensive income over thenext fiscal year
Prior service (cost) credit $ — $ — $ (1) $ — $ — $ — $ 1 $ 1 $ 1Net loss (1) (5) (4) (4) (4) (2) — — —Total estimated amortization $ (1) $ (5) $ (5) $ (4) $ (4) $ (2) $ 1 $ 1 $ 1
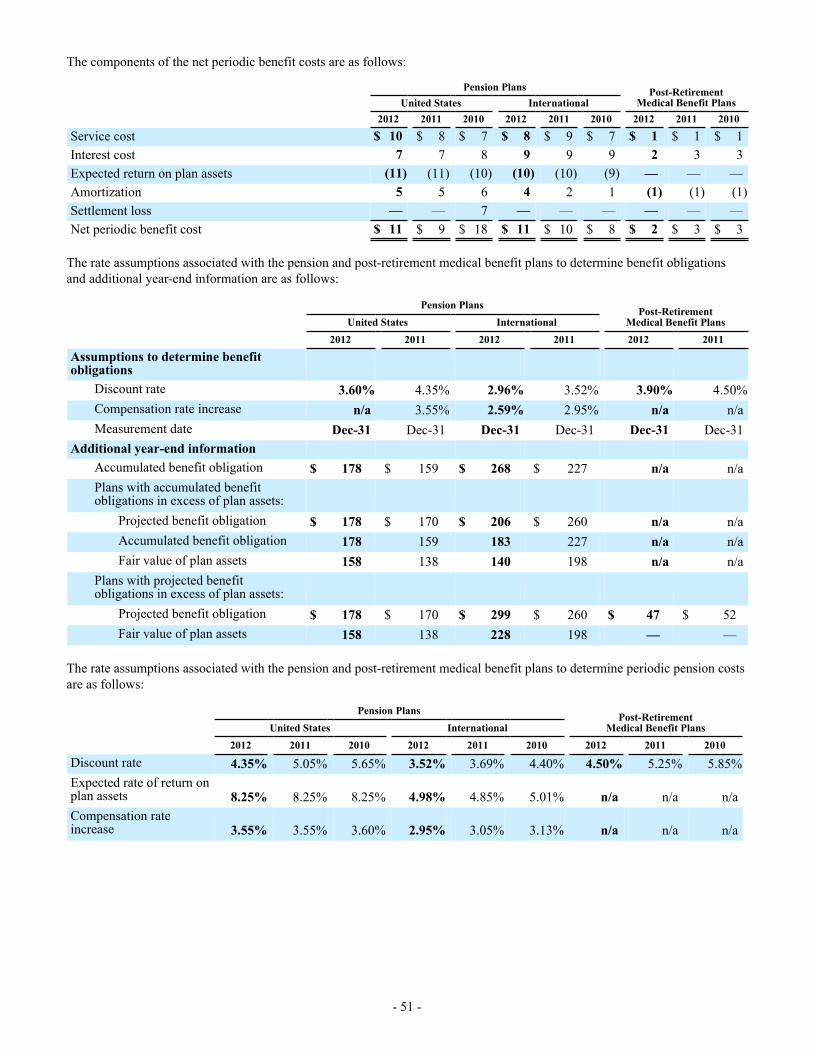
- 51 -
The components of the net periodic benefit costs are as follows:
Pension Plans Post-RetirementMedical Benefit Plans United States International
2012 2011 2010 2012 2011 2010 2012 2011 2010
Service cost $ 10 $ 8 $ 7 $ 8 $ 9 $ 7 $ 1 $ 1 $ 1Interest cost 7 7 8 9 9 9 2 3 3Expected return on plan assets (11) (11) (10) (10) (10) (9) — — —Amortization 5 5 6 4 2 1 (1) (1) (1)Settlement loss — — 7 — — — — — —Net periodic benefit cost $ 11 $ 9 $ 18 $ 11 $ 10 $ 8 $ 2 $ 3 $ 3
The rate assumptions associated with the pension and post-retirement medical benefit plans to determine benefit obligations and additional year-end information are as follows:
Pension Plans Post-RetirementMedical Benefit Plans United States International
2012 2011 2012 2011 2012 2011
Assumptions to determine benefitobligations
Discount rate 3.60% 4.35% 2.96% 3.52% 3.90% 4.50%Compensation rate increase n/a 3.55% 2.59% 2.95% n/a n/aMeasurement date Dec-31 Dec-31 Dec-31 Dec-31 Dec-31 Dec-31
Additional year-end informationAccumulated benefit obligation $ 178 $ 159 $ 268 $ 227 n/a n/aPlans with accumulated benefitobligations in excess of plan assets:
Projected benefit obligation $ 178 $ 170 $ 206 $ 260 n/a n/aAccumulated benefit obligation 178 159 183 227 n/a n/aFair value of plan assets 158 138 140 198 n/a n/a
Plans with projected benefitobligations in excess of plan assets:
Projected benefit obligation $ 178 $ 170 $ 299 $ 260 $ 47 $ 52Fair value of plan assets 158 138 228 198 — —
The rate assumptions associated with the pension and post-retirement medical benefit plans to determine periodic pension costs are as follows:
Pension Plans Post-RetirementMedical Benefit Plans United States International
2012 2011 2010 2012 2011 2010 2012 2011 2010
Discount rate 4.35% 5.05% 5.65% 3.52% 3.69% 4.40% 4.50% 5.25% 5.85%Expected rate of return onplan assets 8.25% 8.25% 8.25% 4.98% 4.85% 5.01% n/a n/a n/aCompensation rateincrease 3.55% 3.55% 3.60% 2.95% 3.05% 3.13% n/a n/a n/a
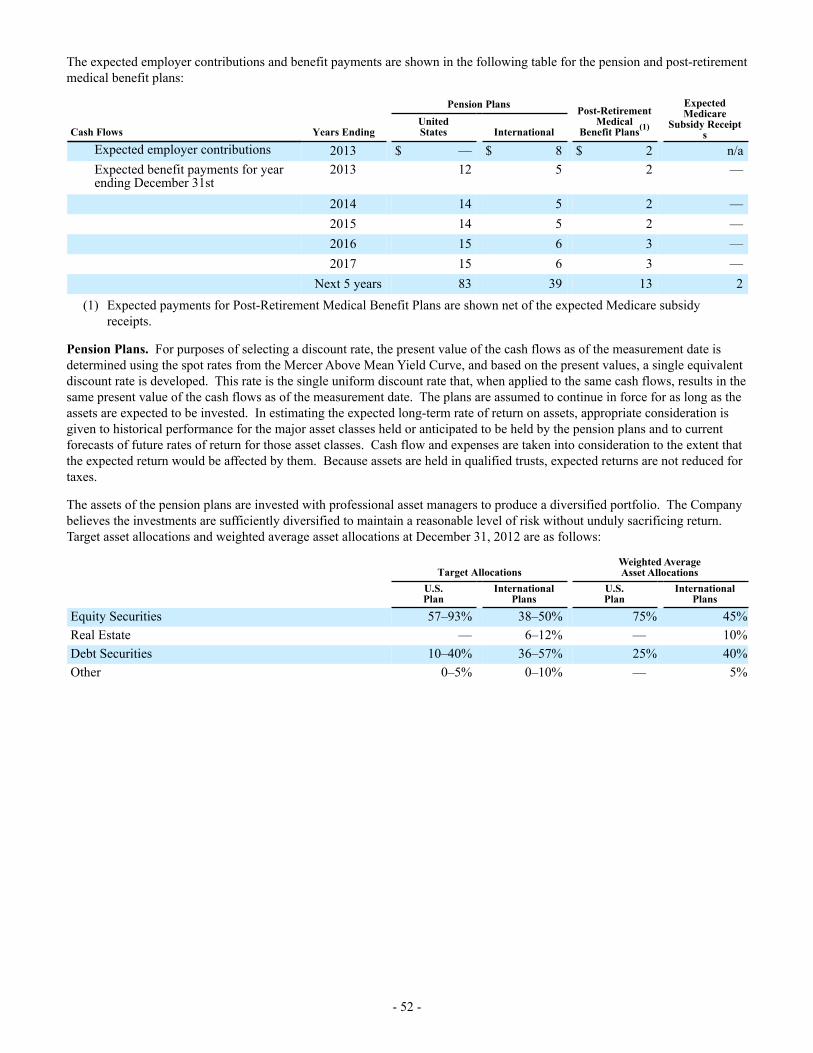
- 52 -
The expected employer contributions and benefit payments are shown in the following table for the pension and post-retirement medical benefit plans:
Pension Plans Post-RetirementMedical
Benefit Plans(1)
ExpectedMedicare
Subsidy ReceiptsCash Flows Years Ending
UnitedStates International
Expected employer contributions 2013 $ — $ 8 $ 2 n/aExpected benefit payments for yearending December 31st
2013 12 5 2 —
2014 14 5 2 —2015 14 5 2 —2016 15 6 3 —2017 15 6 3 —
Next 5 years 83 39 13 2(1) Expected payments for Post-Retirement Medical Benefit Plans are shown net of the expected Medicare subsidy
receipts.
Pension Plans. For purposes of selecting a discount rate, the present value of the cash flows as of the measurement date is determined using the spot rates from the Mercer Above Mean Yield Curve, and based on the present values, a single equivalent discount rate is developed. This rate is the single uniform discount rate that, when applied to the same cash flows, results in the same present value of the cash flows as of the measurement date. The plans are assumed to continue in force for as long as the assets are expected to be invested. In estimating the expected long-term rate of return on assets, appropriate consideration is given to historical performance for the major asset classes held or anticipated to be held by the pension plans and to current forecasts of future rates of return for those asset classes. Cash flow and expenses are taken into consideration to the extent that the expected return would be affected by them. Because assets are held in qualified trusts, expected returns are not reduced for taxes.
The assets of the pension plans are invested with professional asset managers to produce a diversified portfolio. The Company believes the investments are sufficiently diversified to maintain a reasonable level of risk without unduly sacrificing return. Target asset allocations and weighted average asset allocations at December 31, 2012 are as follows:
Target AllocationsWeighted AverageAsset Allocations
U.S.Plan
InternationalPlans
U.S.Plan
InternationalPlans
Equity Securities 57–93% 38–50% 75% 45%Real Estate — 6–12% — 10%Debt Securities 10–40% 36–57% 25% 40%Other 0–5% 0–10% — 5%
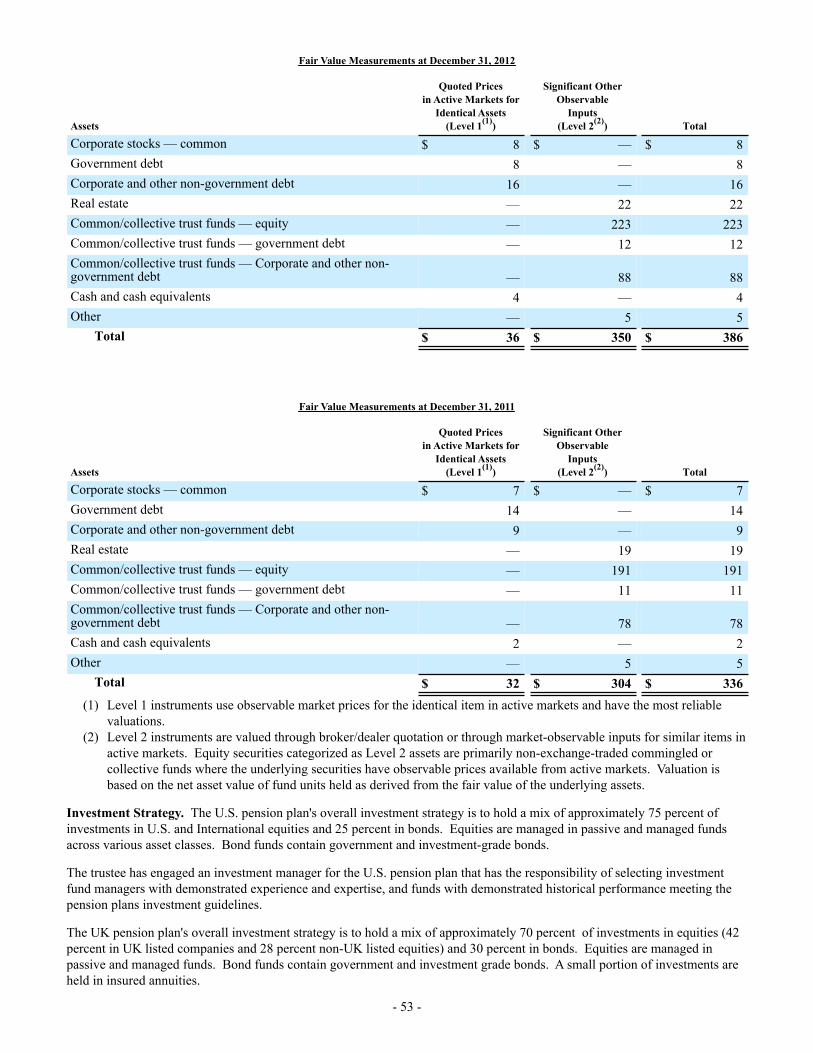
- 53 -
Fair Value Measurements at December 31, 2012
Assets
Quoted Pricesin Active Markets for
Identical Assets(Level 1(1))
Significant OtherObservable
Inputs(Level 2(2)) Total
Corporate stocks — common $ 8 $ — $ 8Government debt 8 — 8Corporate and other non-government debt 16 — 16Real estate — 22 22Common/collective trust funds — equity — 223 223Common/collective trust funds — government debt — 12 12Common/collective trust funds — Corporate and other non-government debt — 88 88Cash and cash equivalents 4 — 4Other — 5 5
Total $ 36 $ 350 $ 386
Fair Value Measurements at December 31, 2011
Assets
Quoted Pricesin Active Markets for
Identical Assets(Level 1(1))
Significant OtherObservable
Inputs(Level 2(2)) Total
Corporate stocks — common $ 7 $ — $ 7Government debt 14 — 14Corporate and other non-government debt 9 — 9Real estate — 19 19Common/collective trust funds — equity — 191 191Common/collective trust funds — government debt — 11 11Common/collective trust funds — Corporate and other non-government debt — 78 78Cash and cash equivalents 2 — 2Other — 5 5
Total $ 32 $ 304 $ 336(1) Level 1 instruments use observable market prices for the identical item in active markets and have the most reliable
valuations.(2) Level 2 instruments are valued through broker/dealer quotation or through market-observable inputs for similar items in
active markets. Equity securities categorized as Level 2 assets are primarily non-exchange-traded commingled or collective funds where the underlying securities have observable prices available from active markets. Valuation is based on the net asset value of fund units held as derived from the fair value of the underlying assets.
Investment Strategy. The U.S. pension plan's overall investment strategy is to hold a mix of approximately 75 percent of investments in U.S. and International equities and 25 percent in bonds. Equities are managed in passive and managed funds across various asset classes. Bond funds contain government and investment-grade bonds.
The trustee has engaged an investment manager for the U.S. pension plan that has the responsibility of selecting investment fund managers with demonstrated experience and expertise, and funds with demonstrated historical performance meeting the pension plans investment guidelines.
The UK pension plan's overall investment strategy is to hold a mix of approximately 70 percent of investments in equities (42 percent in UK listed companies and 28 percent non-UK listed equities) and 30 percent in bonds. Equities are managed in passive and managed funds. Bond funds contain government and investment grade bonds. A small portion of investments are held in insured annuities.
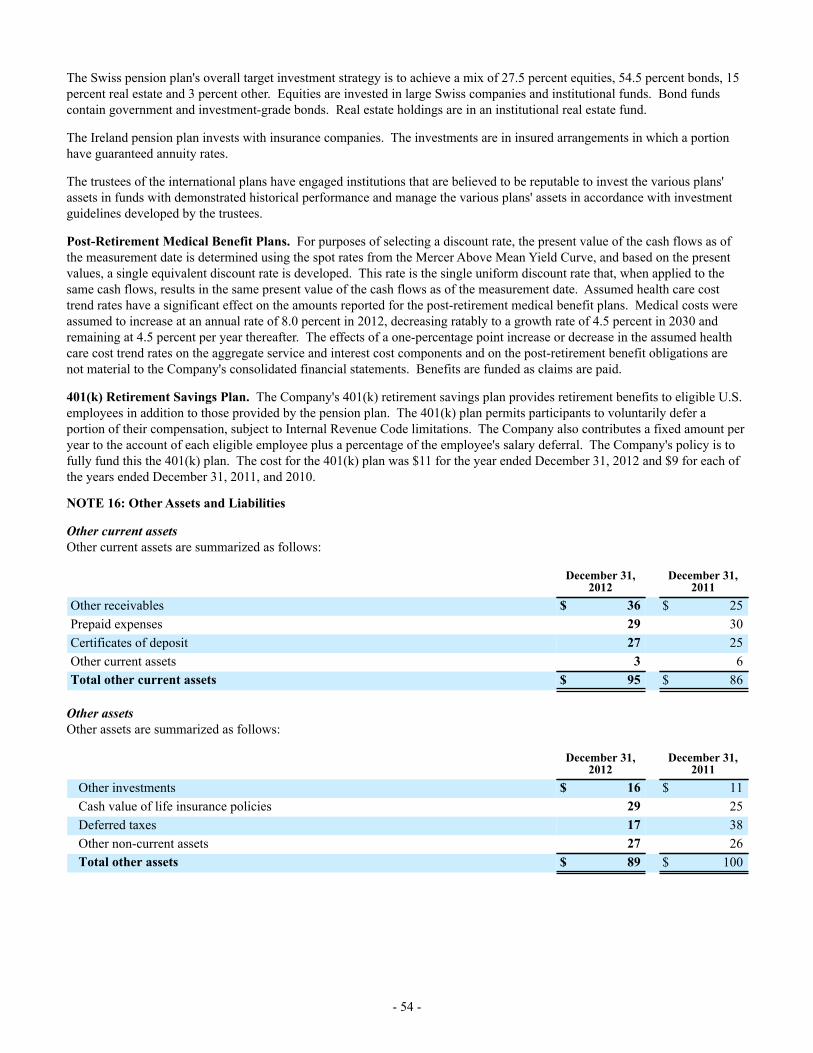
- 54 -
The Swiss pension plan's overall target investment strategy is to achieve a mix of 27.5 percent equities, 54.5 percent bonds, 15 percent real estate and 3 percent other. Equities are invested in large Swiss companies and institutional funds. Bond funds contain government and investment-grade bonds. Real estate holdings are in an institutional real estate fund.
The Ireland pension plan invests with insurance companies. The investments are in insured arrangements in which a portion have guaranteed annuity rates.
The trustees of the international plans have engaged institutions that are believed to be reputable to invest the various plans' assets in funds with demonstrated historical performance and manage the various plans' assets in accordance with investment guidelines developed by the trustees.
Post-Retirement Medical Benefit Plans. For purposes of selecting a discount rate, the present value of the cash flows as of the measurement date is determined using the spot rates from the Mercer Above Mean Yield Curve, and based on the present values, a single equivalent discount rate is developed. This rate is the single uniform discount rate that, when applied to the same cash flows, results in the same present value of the cash flows as of the measurement date. Assumed health care cost trend rates have a significant effect on the amounts reported for the post-retirement medical benefit plans. Medical costs were assumed to increase at an annual rate of 8.0 percent in 2012, decreasing ratably to a growth rate of 4.5 percent in 2030 and remaining at 4.5 percent per year thereafter. The effects of a one-percentage point increase or decrease in the assumed health care cost trend rates on the aggregate service and interest cost components and on the post-retirement benefit obligations are not material to the Company's consolidated financial statements. Benefits are funded as claims are paid.
401(k) Retirement Savings Plan. The Company's 401(k) retirement savings plan provides retirement benefits to eligible U.S. employees in addition to those provided by the pension plan. The 401(k) plan permits participants to voluntarily defer a portion of their compensation, subject to Internal Revenue Code limitations. The Company also contributes a fixed amount per year to the account of each eligible employee plus a percentage of the employee's salary deferral. The Company's policy is to fully fund this the 401(k) plan. The cost for the 401(k) plan was $11 for the year ended December 31, 2012 and $9 for each of the years ended December 31, 2011, and 2010.
NOTE 16: Other Assets and Liabilities
Other current assetsOther current assets are summarized as follows:
December 31,2012
December 31,2011
Other receivables $ 36 $ 25Prepaid expenses 29 30Certificates of deposit 27 25Other current assets 3 6Total other current assets $ 95 $ 86
Other assetsOther assets are summarized as follows:
December 31,2012
December 31,2011
Other investments $ 16 $ 11Cash value of life insurance policies 29 25Deferred taxes 17 38Other non-current assets 27 26Total other assets $ 89 $ 100
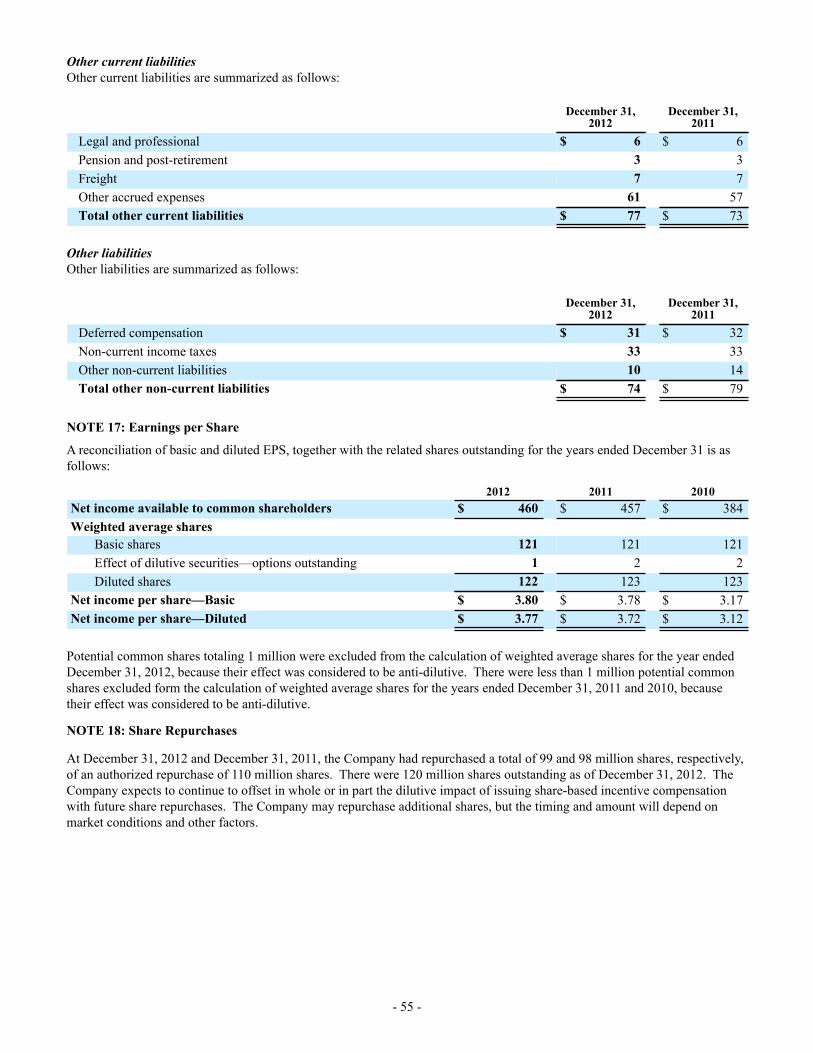
- 55 -
Other current liabilitiesOther current liabilities are summarized as follows:
December 31,2012
December 31,2011
Legal and professional $ 6 $ 6Pension and post-retirement 3 3Freight 7 7Other accrued expenses 61 57Total other current liabilities $ 77 $ 73
Other liabilitiesOther liabilities are summarized as follows:
December 31,2012
December 31,2011
Deferred compensation $ 31 $ 32Non-current income taxes 33 33Other non-current liabilities 10 14Total other non-current liabilities $ 74 $ 79
NOTE 17: Earnings per Share
A reconciliation of basic and diluted EPS, together with the related shares outstanding for the years ended December 31 is as follows:
2012 2011 2010Net income available to common shareholders $ 460 $ 457 $ 384Weighted average shares
Basic shares 121 121 121Effect of dilutive securities—options outstanding 1 2 2Diluted shares 122 123 123
Net income per share—Basic $ 3.80 $ 3.78 $ 3.17Net income per share—Diluted $ 3.77 $ 3.72 $ 3.12
Potential common shares totaling 1 million were excluded from the calculation of weighted average shares for the year ended December 31, 2012, because their effect was considered to be anti-dilutive. There were less than 1 million potential common shares excluded form the calculation of weighted average shares for the years ended December 31, 2011 and 2010, because their effect was considered to be anti-dilutive.
NOTE 18: Share Repurchases
At December 31, 2012 and December 31, 2011, the Company had repurchased a total of 99 and 98 million shares, respectively, of an authorized repurchase of 110 million shares. There were 120 million shares outstanding as of December 31, 2012. The Company expects to continue to offset in whole or in part the dilutive impact of issuing share-based incentive compensation with future share repurchases. The Company may repurchase additional shares, but the timing and amount will depend on market conditions and other factors.
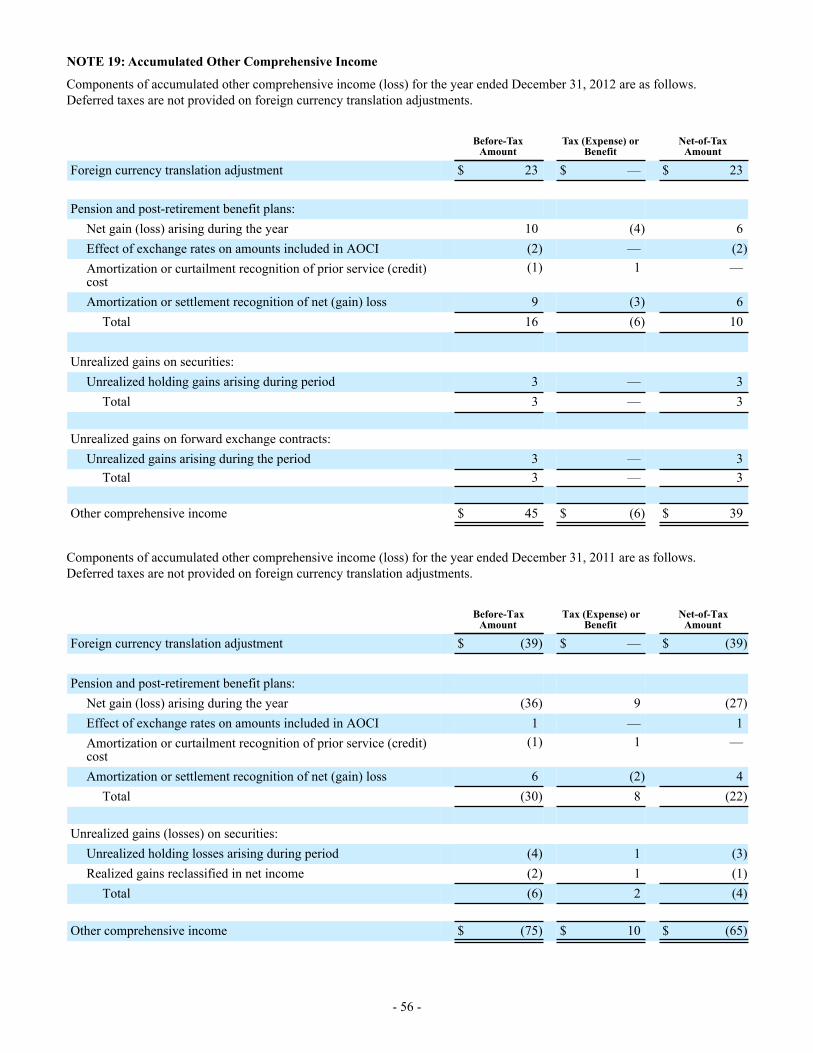
- 56 -
NOTE 19: Accumulated Other Comprehensive Income
Components of accumulated other comprehensive income (loss) for the year ended December 31, 2012 are as follows. Deferred taxes are not provided on foreign currency translation adjustments.
Before-Tax Amount
Tax (Expense) or Benefit
Net-of-Tax Amount
Foreign currency translation adjustment $ 23 $ — $ 23
Pension and post-retirement benefit plans:Net gain (loss) arising during the year 10 (4) 6Effect of exchange rates on amounts included in AOCI (2) — (2)Amortization or curtailment recognition of prior service (credit)cost
(1) 1 —
Amortization or settlement recognition of net (gain) loss 9 (3) 6Total 16 (6) 10
Unrealized gains on securities:Unrealized holding gains arising during period 3 — 3
Total 3 — 3
Unrealized gains on forward exchange contracts:Unrealized gains arising during the period 3 — 3
Total 3 — 3
Other comprehensive income $ 45 $ (6) $ 39
Components of accumulated other comprehensive income (loss) for the year ended December 31, 2011 are as follows. Deferred taxes are not provided on foreign currency translation adjustments.
Before-TaxAmount
Tax (Expense) orBenefit
Net-of-TaxAmount
Foreign currency translation adjustment $ (39) $ — $ (39)
Pension and post-retirement benefit plans:Net gain (loss) arising during the year (36) 9 (27)Effect of exchange rates on amounts included in AOCI 1 — 1Amortization or curtailment recognition of prior service (credit)cost
(1) 1 —
Amortization or settlement recognition of net (gain) loss 6 (2) 4Total (30) 8 (22)
Unrealized gains (losses) on securities:Unrealized holding losses arising during period (4) 1 (3)Realized gains reclassified in net income (2) 1 (1)
Total (6) 2 (4)
Other comprehensive income $ (75) $ 10 $ (65)
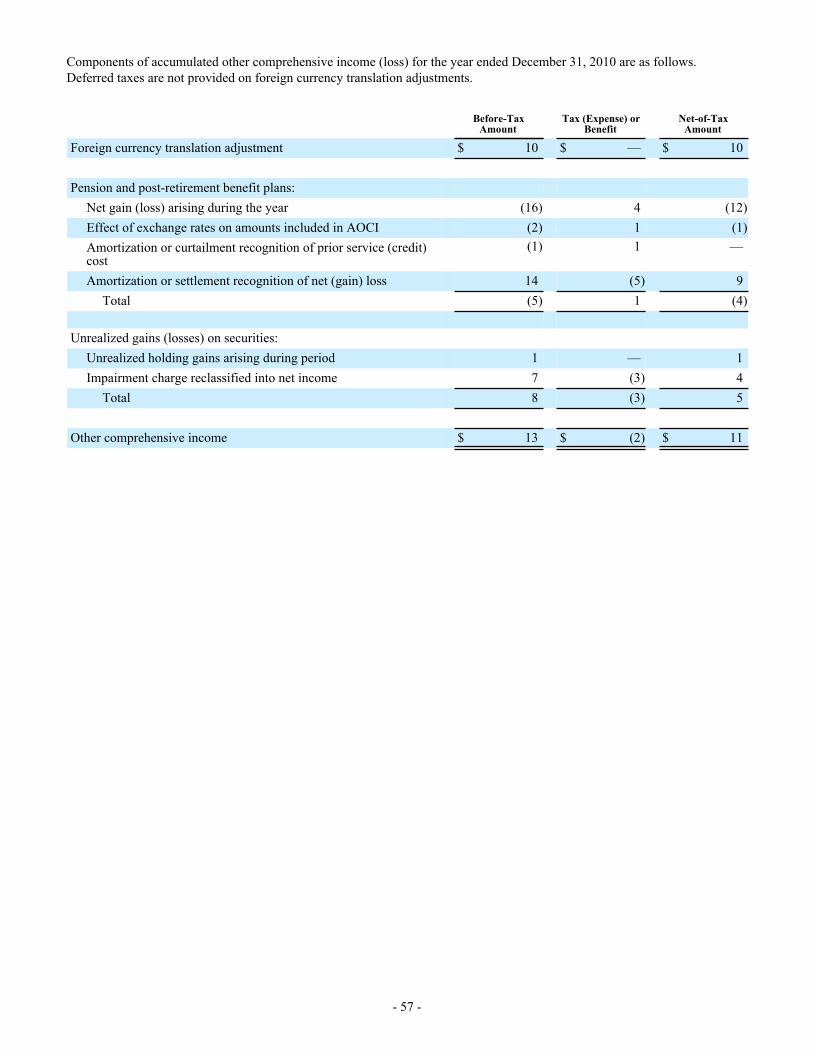
- 57 -
Components of accumulated other comprehensive income (loss) for the year ended December 31, 2010 are as follows. Deferred taxes are not provided on foreign currency translation adjustments.
Before-TaxAmount
Tax (Expense) orBenefit
Net-of-TaxAmount
Foreign currency translation adjustment $ 10 $ — $ 10
Pension and post-retirement benefit plans:Net gain (loss) arising during the year (16) 4 (12)Effect of exchange rates on amounts included in AOCI (2) 1 (1)Amortization or curtailment recognition of prior service (credit)cost
(1) 1 —
Amortization or settlement recognition of net (gain) loss 14 (5) 9Total (5) 1 (4)
Unrealized gains (losses) on securities:Unrealized holding gains arising during period 1 — 1Impairment charge reclassified into net income 7 (3) 4
Total 8 (3) 5
Other comprehensive income $ 13 $ (2) $ 11
- 58 -
Report of Independent Registered Public Accounting FirmThe Board of Directors and Stockholders
Sigma-Aldrich Corporation:
We have audited the accompanying consolidated balance sheets of Sigma-Aldrich Corporation and subsidiaries (the Company) as of December 31, 2012 and 2011, and the related consolidated statements of income, comprehensive income, stockholders' equity, and cash flows for each of the years in the three-year period ended December 31, 2012. We also have audited the Company's internal control over financial reporting as of December 31, 2012, based on criteria established in Internal Control - Integrated Framework issued by the Committee of Sponsoring Organizations of the Treadway Commission (COSO). The Company's management is responsible for these consolidated financial statements, for maintaining effective internal control over financial reporting, and for its assessment of the effectiveness of internal control over financial reporting, included in the accompanying Management's Report on Internal Control over Financial Reporting. Our responsibility is to express an opinion on these consolidated financial statements and an opinion on the Company's internal control over financial reporting based on our audits.
We conducted our audits in accordance with the standards of the Public Company Accounting Oversight Board (United States). Those standards require that we plan and perform the audits to obtain reasonable assurance about whether the financial statements are free of material misstatement and whether effective internal control over financial reporting was maintained in all material respects. Our audits of the consolidated financial statements included examining, on a test basis, evidence supporting the amounts and disclosures in the financial statements, assessing the accounting principles used and significant estimates made by management, and evaluating the overall financial statement presentation. Our audit of internal control over financial reporting included obtaining an understanding of internal control over financial reporting, assessing the risk that a material weakness exists, and testing and evaluating the design and operating effectiveness of internal control based on the assessed risk. Our audits also included performing such other procedures as we considered necessary in the circumstances. We believe that our audits provide a reasonable basis for our opinions.
A company's internal control over financial reporting is a process designed to provide reasonable assurance regarding the reliability of financial reporting and the preparation of financial statements for external purposes in accordance with generally accepted accounting principles. A company's internal control over financial reporting includes those policies and procedures that (1) pertain to the maintenance of records that, in reasonable detail, accurately and fairly reflect the transactions and dispositions of the assets of the company; (2) provide reasonable assurance that transactions are recorded as necessary to permit preparation of financial statements in accordance with generally accepted accounting principles, and that receipts and expenditures of the company are being made only in accordance with authorizations of management and directors of the company; and (3) provide reasonable assurance regarding prevention or timely detection of unauthorized acquisition, use, or disposition of the company's assets that could have a material effect on the financial statements.
Because of its inherent limitations, internal control over financial reporting may not prevent or detect misstatements. Also, projections of any evaluation of effectiveness to future periods are subject to the risk that controls may become inadequate because of changes in conditions, or that the degree of compliance with the policies or procedures may deteriorate.
In our opinion, the consolidated financial statements referred to above present fairly, in all material respects, the financial position of Sigma-Aldrich Corporation and subsidiaries as of December 31, 2012 and 2011, and the results of their operations and their cash flows for each of the years in the three-year period ended December 31, 2012, in conformity with U.S. generally accepted accounting principles. Also in our opinion, the Company maintained, in all material respects, effective internal control over financial reporting as of December 31, 2012, based on criteria established in Internal Control - Integrated Framework issued by the Committee of Sponsoring Organizations of the Treadway Commission.
The scope of management's assessment of internal control over financial reporting as of December 31, 2012, included all of the Company's subsidiaries except BioReliance Holdings, Inc. (BioReliance), which was acquired by the Company on January 31, 2012. Total assets related to BioReliance of $413 million and revenues for the 11-month period subsequent to the acquisition (February 1 - December 31, 2012) of $111 million were included in the consolidated financial statements of Sigma-Aldrich Corporation and subsidiaries as of and for the year ended December 31, 2012. Our audit of internal control over financial reporting of the Company also excluded an evaluation of the internal control over financial reporting of BioReliance as of December 31, 2012.
/s/ KPMG LLP
St. Louis, MissouriFebruary 7, 2013

- 59 -
Selected Quarterly Financial Data ($ In Millions, except per share data) (Unaudited):
The following tables present certain unaudited consolidated quarterly financial information for each quarter of 2012 and 2011. Year-to-date EPS amounts may be different than the sum of the applicable quarters due to differences in weighted average shares outstanding for the respective periods.
2012 Quarter Ended March 31 June 30 Sept. 30 Dec. 31
Net sales $ 665 $ 664 $ 639 $ 655Gross profit 355 340 324 328Net income 117 115 112 116Net income per share—Basic 0.97 0.95 0.93 0.97Net income per share—Diluted 0.96 0.94 0.92 0.96
Amounts impacting comparability include pretax transaction cost related to recent acquisitions of $5 for the quarter ended March 31, 2012, and pretax restructuring charges of $0, $4, $4 and $1 for the quarters ended March 31, June 30, September 30, and December 31, 2012, respectively.
2011 Quarter Ended March 31 June 30 Sept. 30 Dec. 31
Net sales $ 632 $ 637 $ 626 $ 610Gross profit 336 331 333 324Net income 119 113 117 108Net income per share—Basic 0.98 0.93 0.97 0.89Net income per share—Diluted 0.97 0.91 0.95 0.89
Amounts impacting comparability include pretax restructuring charges of $3, $2, $3 and $0 for the quarters ended March 31, June 30, September 30, and December 31, 2011, respectively.
- 60 -
Item 9. Changes in and Disagreements With Accountants on Accounting and Financial Disclosure.
None.
Item 9A. Controls and Procedures.
Controls and Procedures
The Company's management, under the supervision and with the participation of the Company's CEO and CFO, carried out an evaluation of the effectiveness of the design and operation of the Company's disclosure controls and procedures as of December 31, 2012. Based upon their evaluation, the CEO and CFO concluded that the Company's disclosure controls and procedures (as defined in Rule 13a-15(e) under the Exchange Act) are effective as of that date to provide reasonable assurance that the information required to be disclosed by the Company in the reports it files or submits under the Exchange Act is recorded, processed, summarized and reported within the time periods specified in the rules and forms of the SEC and that information required to be disclosed by the Company in the reports it files or submits under the Exchange Act is accumulated and communicated to the Company's management, including the CEO and the CFO, as appropriate to allow timely decisions regarding required disclosure. They have also determined in their evaluation that there was no change in the Company's internal controls over financial reporting during the quarter ended December 31, 2012 that has materially affected or is reasonably likely to materially affect the Company's internal control over financial reporting.
Management's Report On Internal Control Over Financial Reporting
Management is responsible for establishing and maintaining adequate internal control over financial reporting (as defined in Exchange Act Rule 13a–15(f)). Under the supervision of and with the participation of management, including our principal executive officer and principal financial officer, we assessed the effectiveness of our internal control over financial reporting as of December 31, 2012. In making this assessment, management used the criteria set forth by the Committee of Sponsoring Organizations of the Treadway Commission (COSO) in the Internal Control-Integrated Framework. Management has concluded that, as of December 31, 2012, our internal control over financial reporting is effective based on these criteria.
The scope of management's assessment of the effectiveness of internal control over financial reporting included all of the Company's subsidiaries except BioReliance, which was acquired by the Company on January 31, 2012. Total assets related to BioReliance of $413 million and revenues for the 11-month period subsequent to the acquisition (February 1 - December 31, 2012) of $111 million were included in our consolidated financial statements as of and for the year ended December 31, 2012.
KPMG LLP, our independent registered public accounting firm, has issued a report of the effectiveness of internal control over financial reporting which also excluded an evaluation of the internal control over financial reporting of BioReliance as of December 31, 2012. That report appears on page 58.
Item 9B. Other Information.
None.
- 61 -
PART III
Item 10. Directors, Executive Officers and Corporate Governance.
Additional information can be found under the captions "Board of Directors Nominees, Qualifications and Diversity," "Shareholder Proposal" and "Section 16(a) Beneficial Ownership Reporting Compliance" of the Company's Definitive Proxy Statement on Schedule 14A for the Annual Meeting of Shareholders to be held on May 7, 2013, which will be filed within 120 days after December 31, 2012 (the "2013 Proxy Statement"), and is incorporated herein by reference. For information with respect to executive officers of the Company, see "Executive Officers of the Registrant" included in Item 1- Business of Part I of this Report.
Audit Committee and Audit Committee Financial Expert
Information under the caption "Directors Meetings and Committees—Audit Committee" of the 2013 Proxy Statement is incorporated herein by reference.
Code of Ethics
Information under the caption "Related Party Disclosure" of the 2013 Proxy Statement is incorporated herein by reference.
Item 11. Executive Compensation.
Information under the captions "Director Compensation," "Compensation Discussion and Analysis," "Compensation Committee Report" and "Information Concerning Executive Compensation" of the 2013 Proxy Statement is incorporated herein by reference.
Item 12. Security Ownership of Certain Beneficial Owners and Management and Related StockholderMatters.
Information under the captions "Security Ownership of Directors, Executive Officers and Principal Beneficial Owners" and "Equity Compensation Plan Information" of the 2013 Proxy Statement is incorporated herein by reference.
Item 13. Certain Relationships and Related Transactions, and Director Independence.
Information under the captions "Board of Directors Nominees, Qualifications and Diversity" and "Related Party Disclosure" of the 2013 Proxy Statement is incorporated herein by reference.
Item 14. Principal Accounting Fees and Services.
Information under the caption "Audit Firm Fee Summary" of the 2013 Proxy Statement is incorporated herein by reference.
- 62 -
PART IV
Item 15. Exhibits, Financial Statement Schedules.(a) Documents Filed as Part of this Report
1 Financial Statements.See Item 8 - Financial Statements and Supplementary Data of Part II of this Report.
2 Financial Statement Schedules.
All schedules are omitted as they are not applicable, not required or the information is included in the consolidated financial statements or related notes to the consolidated financial statements.
3 Exhibits.See Index to Exhibits on page F-1 of this Report.
- 63 -
SIGNATURES
Pursuant to the requirements of Section 13 or 15(d) of the Securities Exchange Act of 1934, the registrant has duly caused this report to be signed on its behalf by the undersigned, thereunto duly authorized.
SIGMA-ALDRICH CORPORATION(Registrant)
By /s/ Michael F. Kanan February 7, 2013
Michael F. Kanan, Vice President and CorporateController
Date
Pursuant to the requirements of the Securities Exchange Act of 1934, this report has been signed below by the following persons on behalf of the registrant and in the capacities and on the dates indicated.
By /s/ Rakesh Sachdev February 7, 2013
Rakesh Sachdev, President, ChiefExecutive Officer and Director (Principal Executive Officer)
Date
By /s/ Jan A. Bertsch February 7, 2013
Executive Vice President, Chief Financial Officer and Treasurer (Principal Financial Officer)
Date
By /s/ Michael F. Kanan February 7, 2013
Michael F. Kanan, Vice President and CorporateController (Principal Accounting Officer)
Date
By /s/ Rebecca M. Bergman February 7, 2013 Rebecca M. Bergman, Director Date
By /s/ George M. Church February 7, 2013 George M. Church, Director Date
By /s/ Michael L. Marberry February 7, 2013 Michael L. Marberry, Director Date
By /s/ W. Lee McCollum February 7, 2013 W. Lee McCollum, Director Date
By /s/ Avi M. Nash February 7, 2013 Avi M. Nash, Director Date
By /s/ Steven M. Paul February 7, 2013 Steven M. Paul, Director Date
By /s/ J. Pedro Reinhard February 7, 2013 J. Pedro Reinhard, Director Date
By /s/ D. Dean Spatz February 7, 2013 D. Dean Spatz, Director Date
By /s/ Barrett A. Toan February 7, 2013 Barrett A. Toan, Chairman and Director Date
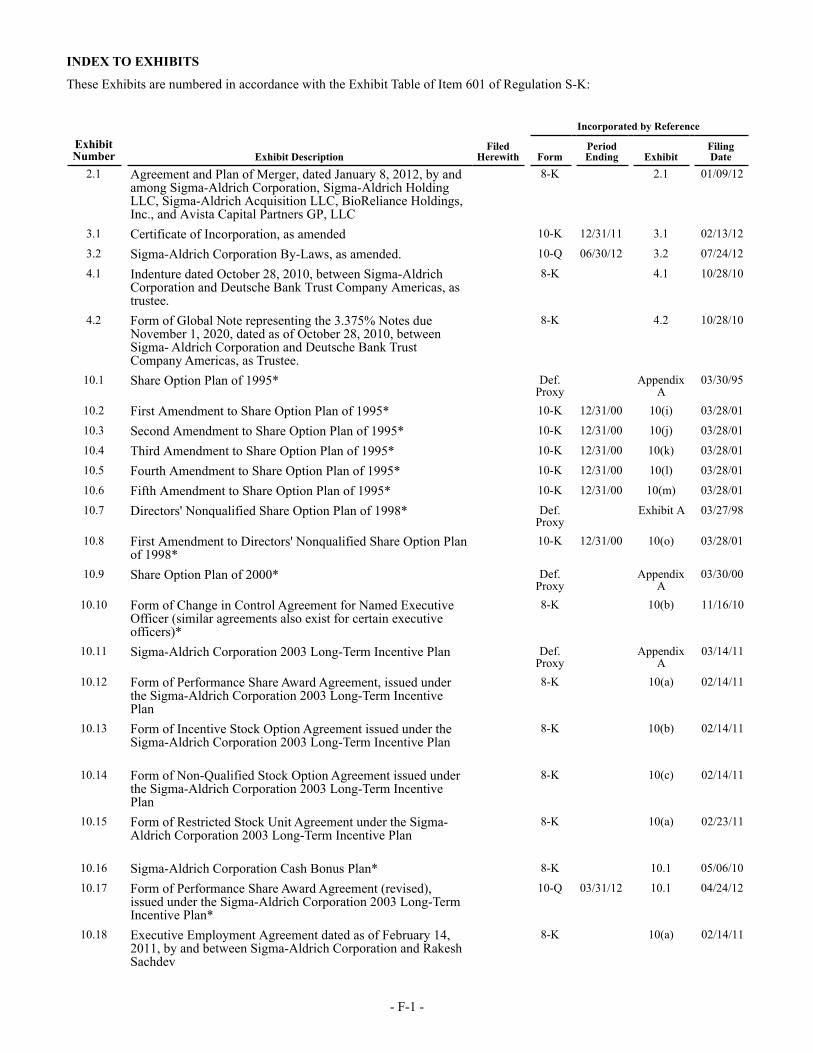
- F-1 -
INDEX TO EXHIBITS
These Exhibits are numbered in accordance with the Exhibit Table of Item 601 of Regulation S-K:
Incorporated by Reference
ExhibitNumber Exhibit Description
FiledHerewith Form
PeriodEnding Exhibit
FilingDate
2.1 Agreement and Plan of Merger, dated January 8, 2012, by andamong Sigma-Aldrich Corporation, Sigma-Aldrich HoldingLLC, Sigma-Aldrich Acquisition LLC, BioReliance Holdings,Inc., and Avista Capital Partners GP, LLC
8-K 2.1 01/09/12
3.1 Certificate of Incorporation, as amended 10-K 12/31/11 3.1 02/13/12
3.2 Sigma-Aldrich Corporation By-Laws, as amended. 10-Q 06/30/12 3.2 07/24/12
4.1 Indenture dated October 28, 2010, between Sigma-AldrichCorporation and Deutsche Bank Trust Company Americas, astrustee.
8-K 4.1 10/28/10
4.2 Form of Global Note representing the 3.375% Notes due November 1, 2020, dated as of October 28, 2010, between Sigma- Aldrich Corporation and Deutsche Bank Trust Company Americas, as Trustee.
8-K 4.2 10/28/10
10.1 Share Option Plan of 1995* Def.Proxy
AppendixA
03/30/95
10.2 First Amendment to Share Option Plan of 1995* 10-K 12/31/00 10(i) 03/28/01
10.3 Second Amendment to Share Option Plan of 1995* 10-K 12/31/00 10(j) 03/28/01
10.4 Third Amendment to Share Option Plan of 1995* 10-K 12/31/00 10(k) 03/28/01
10.5 Fourth Amendment to Share Option Plan of 1995* 10-K 12/31/00 10(l) 03/28/01
10.6 Fifth Amendment to Share Option Plan of 1995* 10-K 12/31/00 10(m) 03/28/01
10.7 Directors' Nonqualified Share Option Plan of 1998* Def.Proxy
Exhibit A 03/27/98
10.8 First Amendment to Directors' Nonqualified Share Option Planof 1998*
10-K 12/31/00 10(o) 03/28/01
10.9 Share Option Plan of 2000* Def.Proxy
AppendixA
03/30/00
10.10 Form of Change in Control Agreement for Named Executive Officer (similar agreements also exist for certain executive officers)*
8-K 10(b) 11/16/10
10.11 Sigma-Aldrich Corporation 2003 Long-Term Incentive Plan Def.Proxy
AppendixA
03/14/11
10.12 Form of Performance Share Award Agreement, issued under the Sigma-Aldrich Corporation 2003 Long-Term Incentive Plan
8-K 10(a) 02/14/11
10.13 Form of Incentive Stock Option Agreement issued under the Sigma-Aldrich Corporation 2003 Long-Term Incentive Plan
8-K 10(b) 02/14/11
10.14 Form of Non-Qualified Stock Option Agreement issued under the Sigma-Aldrich Corporation 2003 Long-Term Incentive Plan
8-K 10(c) 02/14/11
10.15 Form of Restricted Stock Unit Agreement under the Sigma-Aldrich Corporation 2003 Long-Term Incentive Plan
8-K 10(a) 02/23/11
10.16 Sigma-Aldrich Corporation Cash Bonus Plan* 8-K 10.1 05/06/10
10.17 Form of Performance Share Award Agreement (revised), issued under the Sigma-Aldrich Corporation 2003 Long-Term Incentive Plan*
10-Q 03/31/12 10.1 04/24/12
10.18 Executive Employment Agreement dated as of February 14,2011, by and between Sigma-Aldrich Corporation and RakeshSachdev
8-K 10(a) 02/14/11
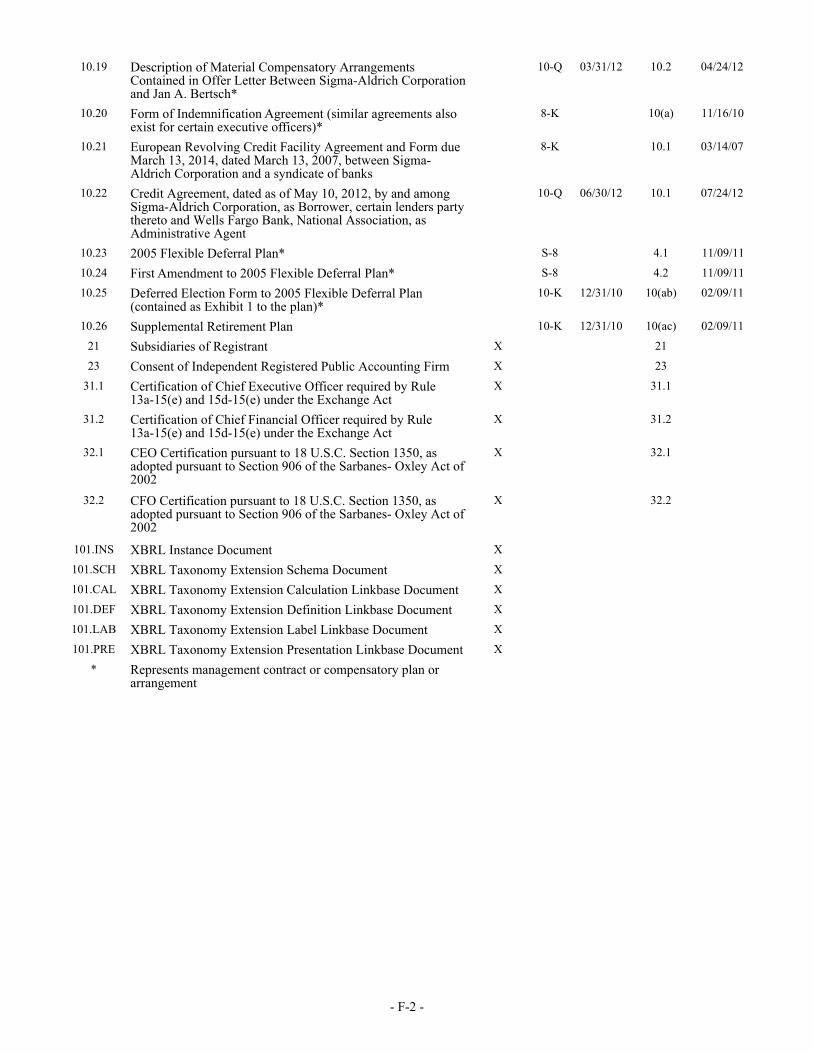
- F-2 -
10.19 Description of Material Compensatory ArrangementsContained in Offer Letter Between Sigma-Aldrich Corporationand Jan A. Bertsch*
10-Q 03/31/12 10.2 04/24/12
10.20 Form of Indemnification Agreement (similar agreements also exist for certain executive officers)*
8-K 10(a) 11/16/10
10.21 European Revolving Credit Facility Agreement and Form dueMarch 13, 2014, dated March 13, 2007, between Sigma-Aldrich Corporation and a syndicate of banks
8-K 10.1 03/14/07
10.22 Credit Agreement, dated as of May 10, 2012, by and amongSigma-Aldrich Corporation, as Borrower, certain lenders partythereto and Wells Fargo Bank, National Association, asAdministrative Agent
10-Q 06/30/12 10.1 07/24/12
10.23 2005 Flexible Deferral Plan* S-8 4.1 11/09/11
10.24 First Amendment to 2005 Flexible Deferral Plan* S-8 4.2 11/09/11
10.25 Deferred Election Form to 2005 Flexible Deferral Plan (contained as Exhibit 1 to the plan)*
10-K 12/31/10 10(ab) 02/09/11
10.26 Supplemental Retirement Plan 10-K 12/31/10 10(ac) 02/09/11
21 Subsidiaries of Registrant X 21
23 Consent of Independent Registered Public Accounting Firm X 23
31.1 Certification of Chief Executive Officer required by Rule13a-15(e) and 15d-15(e) under the Exchange Act
X 31.1
31.2 Certification of Chief Financial Officer required by Rule13a-15(e) and 15d-15(e) under the Exchange Act
X 31.2
32.1 CEO Certification pursuant to 18 U.S.C. Section 1350, asadopted pursuant to Section 906 of the Sarbanes- Oxley Act of2002
X 32.1
32.2 CFO Certification pursuant to 18 U.S.C. Section 1350, asadopted pursuant to Section 906 of the Sarbanes- Oxley Act of2002
X 32.2
101.INS XBRL Instance Document X
101.SCH XBRL Taxonomy Extension Schema Document X
101.CAL XBRL Taxonomy Extension Calculation Linkbase Document X
101.DEF XBRL Taxonomy Extension Definition Linkbase Document X
101.LAB XBRL Taxonomy Extension Label Linkbase Document X
101.PRE XBRL Taxonomy Extension Presentation Linkbase Document X
* Represents management contract or compensatory plan or arrangement
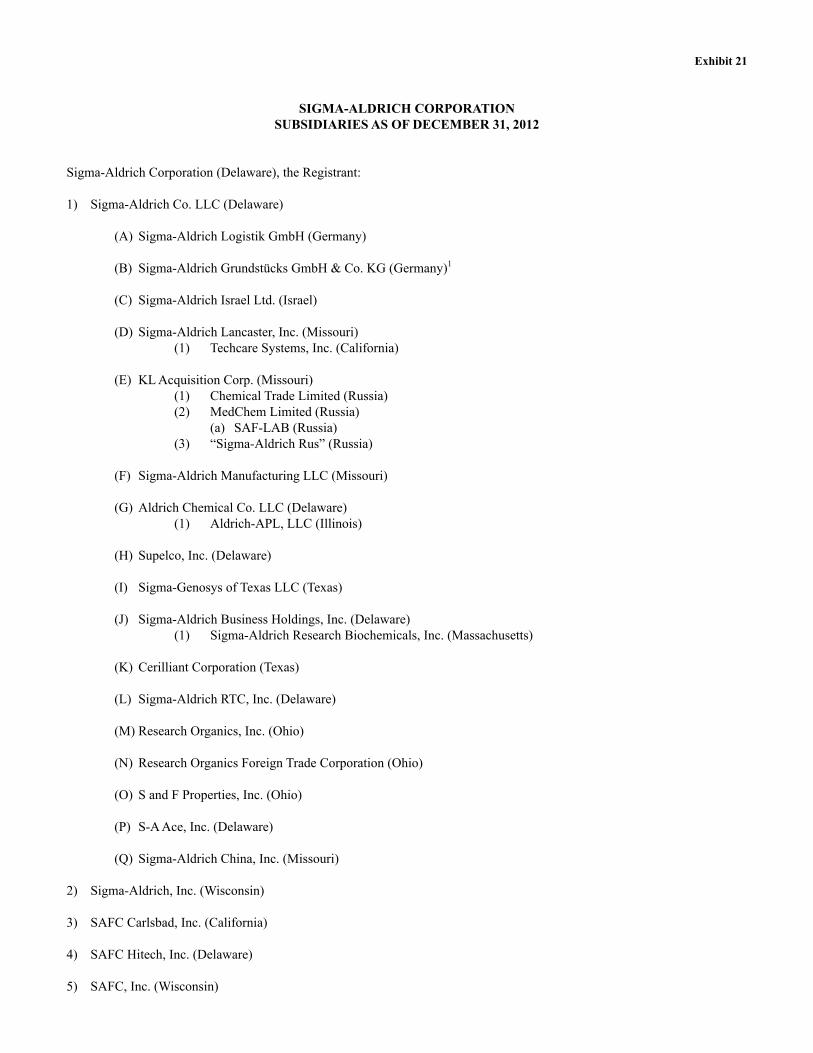
Exhibit 21
SIGMA-ALDRICH CORPORATIONSUBSIDIARIES AS OF DECEMBER 31, 2012
Sigma-Aldrich Corporation (Delaware), the Registrant:
1) Sigma-Aldrich Co. LLC (Delaware)
(A) Sigma-Aldrich Logistik GmbH (Germany)
(B) Sigma-Aldrich Grundstücks GmbH & Co. KG (Germany)1
(C) Sigma-Aldrich Israel Ltd. (Israel)
(D) Sigma-Aldrich Lancaster, Inc. (Missouri)(1) Techcare Systems, Inc. (California)
(E) KL Acquisition Corp. (Missouri)(1) Chemical Trade Limited (Russia)(2) MedChem Limited (Russia)
(a) SAF-LAB (Russia)(3) “Sigma-Aldrich Rus” (Russia)
(F) Sigma-Aldrich Manufacturing LLC (Missouri)
(G) Aldrich Chemical Co. LLC (Delaware)(1) Aldrich-APL, LLC (Illinois)
(H) Supelco, Inc. (Delaware)
(I) Sigma-Genosys of Texas LLC (Texas)
(J) Sigma-Aldrich Business Holdings, Inc. (Delaware)(1) Sigma-Aldrich Research Biochemicals, Inc. (Massachusetts)
(K) Cerilliant Corporation (Texas)
(L) Sigma-Aldrich RTC, Inc. (Delaware)
(M) Research Organics, Inc. (Ohio)
(N) Research Organics Foreign Trade Corporation (Ohio)
(O) S and F Properties, Inc. (Ohio)
(P) S-A Ace, Inc. (Delaware)
(Q) Sigma-Aldrich China, Inc. (Missouri)
2) Sigma-Aldrich, Inc. (Wisconsin)
3) SAFC Carlsbad, Inc. (California)
4) SAFC Hitech, Inc. (Delaware)
5) SAFC, Inc. (Wisconsin)
6) SAFC-JRH Holding Company, Inc. (Delaware)(A) SAFC Biosciences, Inc. (Delaware)
7) Sigma-Aldrich Holding LLC (Delaware)(A) BioReliance Holdings, Inc. (Delaware)
(1) BioReliance Intermediate, Inc. (Delaware)(a) BioReliance Corporation (Delaware)(b) BioReliance UK Acquisition Limited (UK)
i. BioReliance Limited (Scotland, UK)i. BioReliance KK (Japan)
8) Sigma-Aldrich Finance Co. (Missouri)
9) Sigma-Aldrich Insurance Company Ltd. (Bermuda)
10) Sigma-Aldrich Verwaltungs GmbH (Germany)
11) Sigma-Aldrich Foreign Holding Co. (Missouri)(A) Sigma-Aldrich (OM) Ltd. (Greece)
(B) Sigma-Aldrich Brasil Ltda. (Brazil)2
(1) Vetec Quimica Fina Ltda. (Brazil)
(C) Sigma-Aldrich (Thailand) Co., Ltd. (Thailand)8
12) Sigma-Aldrich (Switzerland) Holding AG (Switzerland)7
(A) Sigma-Aldrich International GmbH (Switzerland)(1) Sigma-Aldrich Oceania Pty. Limited (Australia)
(a) Sigma-Aldrich Pty. Limited (Australia)i. SAFC Biosciences Pty. Ltd. (Australia)
(b) Sigma-Aldrich Australia General Partnership (Australia)9
(c) Sigma-Aldrich New Zealand Co. (New Zealand)
(2) Sigma-Aldrich (Pty.) Ltd. (South Africa)
(3) Sigma-Aldrich Quimica Ltda. (Chile)5
(4) Sigma-Aldrich Japan GK (Japan)
(5) Sigma-Aldrich (Shanghai) Trading Co. Ltd. (China)
(6) Sigma-Aldrich Hong Kong Holding Limited (Hong Kong)(a) Sigma-Aldrich (Wuxi) Life Science & Technology Co., Ltd. (China)
(7) Sigma-Aldrich Pte. Ltd. (Singapore)(a) Sigma-Aldrich (M) Sdn. Bhd. (Malaysia)(b) Sigma-Aldrich Chemicals Private Ltd. (India)10
(c) Sigma-Aldrich Holding Ltd. (Korea)i. Sigma-Aldrich Korea Ltd. (Korea)
(d) Sigma-Aldrich Quimica, S. de R.L. de C.V. (Mexico)11
(8) Sigma-Aldrich Production GmbH (Switzerland)
(9) Sigma-Aldrich Chemie GmbH (Switzerland)
(10) Sigma-Aldrich Belgium BVBA/SPRL (Belgium)3
(a) Sigma-Aldrich Chemie BV (Netherlands)
(11) Sigma-Aldrich BV (Netherlands)(a) Sigma-Aldrich Global S.a.r.l. (Luxembourg)(b) Sigma-Aldrich Chemie Holding GmbH (Germany)
i. Sigma-Aldrich Chemie GmbH (Germany)ii. Sigma-Aldrich Producktions GmbH (Germany)iii. Sigma-Aldrich Biochemie GmbH (Germany)
i. Sigma-Aldrich Laborchemikalien GmbH (Germany)
(12) Sigma-Aldrich S.a.r.l. (Luxembourg)(a) Sigma-Aldrich Canada Co. (Canada)
(13) Sigma-Aldrich Denmark ApS (Denmark)
(14) Sigma-Aldrich Finland OY (Finland)
(15) Sigma-Aldrich Kft (Hungary)
(16) Sigma-Aldrich Italia S.r.l. (Italy)(a) Sigma-Aldrich S.r.l. (Italy)(b) Sigma-Aldrich Handels GmbH (Austria)
(17) Sigma-Aldrich Holding S.a.r.l. (France)(a) Aldrich Chemical Foreign Holding LLC (Missouri)
i. Sigma-Aldrich Chimie SNC (France)4
i. Sigma-Aldrich Chimie S.a.r.l.(b) Sigma Chemical Foreign Holding LLC (Missouri)
(18) Silverberry Limited (Ireland)(a) Shrawdine Limited (Ireland)
i. Sigma-Aldrich Ireland Ltd. (Ireland)
(19) Sigma-Aldrich Financial Services Limited (United Kingdom)
(20) Sigma-Aldrich Norway AS (Norway)
(21) Sigma-Aldrich Sp. z.o.o. (Poland)
(22) Sigma-Aldrich Quimica S.L. (Spain)
(23) Sigma-Aldrich spol. s.r.o. (Czech Republic)12
(24) Sigma-Aldrich Sweden AB (Sweden)(a) Sigma-Aldrich de Argentina S.A. (Argentina)6
(B) Sigma-Aldrich Company Limited (United Kingdom)(1) SAFC Biosciences Limited (United Kingdom)
(2) Epichem Group Limited (United Kingdom)(a) SAFC Hitech Ltd. (United Kingdom)(b) SAFC Hitech Taiwan Co. Ltd. (Taiwan)(c) SAFC Hitech (Shanghai) Chemical Co. Ltd. (China)
1 Ownership interest in Sigma-Aldrich Grundstücks GmbH & Co. KG (Germany) is Sigma-Aldrich Co. LLC- 94% and Sigma-Aldrich Verwaltungs GmbH- 6%.
2Ownership interest in Sigma-Aldrich Brasil Ltda. (Brazil) is Sigma-Aldrich Foreign Holding Co. - 76.7% and Sigma-Aldrich, Inc. - 23.3%.
3Ownership interest in Sigma-Aldrich BVBA/SPRL (Belgium) - Sigma-Aldrich International GmbH - 99.96%, Sigma-Aldrich Italia S.r.l. - .04%.
4Ownership interest in Sigma-Aldrich Chimie SNC (France) is Aldrich Chemical Foreign Holding LLC - 77% and Sigma Chemical Foreign Holding LLC- 23%.
5Ownership interest in Sigma-Aldrich Quimica Ltda. (Chile) is Sigma-Aldrich International GmbH - 99.99% and Sigma-Aldrich Sweden AB - 0.01%.
6Ownership interest in Sigma-Aldrich de Argentina SA (Argentina) is Sigma-Aldrich Sweden AB - 51.49% and Sigma-Aldrich International GmbH - 48.51%.
7Ownership interest in Sigma-Aldrich (Switzerland) Holding AG is Sigma-Aldrich Corporation - 73.94%, Sigma-Aldrich Co. LLC - 13.69% and Sigma-Aldrich Foreign Holding Co. - 12.37%.
8Ownership interest in Sigma-Aldrich (Thailand) Co., Ltd. (Thailand) is Sigma-Aldrich Foreign Holding Co. - 98%, Sigma-Aldrich Corporation - 1% and Sigma-Aldrich, Inc. - 1%.
9Ownership interest in Sigma-Aldrich Australia General Partnership (Australia) is Sigma-Aldrich Oceania Pty. Ltd.(Australia) - 99% and Sigma-Aldrich Pty. Ltd.(Australia) - 1%.
10Sigma-Aldrich Pte. Ltd. (Singapore) owns a nominal interest in Sigma-Aldrich Chemicals Private Limited (India) that is “held in trust” by Sigma-Aldrich (Switzerland) Holding AG.
11Ownership interest in Sigma-Aldrich Quimica, S. de R.L. de C.V. (Mexico) is Sigma-Aldrich Pte. Ltd. (Singapore) - 99.998% and Sigma-Aldrich International GmbH (Switzerland) - .002%.
12Ownership in Sigma-Aldrich spol. s.r.o. (Czech Republic) is Sigma-Aldrich International GmbH (Switzerland) - 99.683% and Sigma-Aldrich Pte. Ltd. (Singapore) - .317%.
Exhibit 23Consent of Independent Registered Public Accounting Firm
The Board of DirectorsSigma-Aldrich Corporation:
We consent to the incorporation by reference in the registration statements and 333-170109) on Form S-3 and the registration statements (Nos. 333-49912, 333-62541, 333-64661, 333-30528, 333-105033, 333-177866 and 333-183247) on Form S-8 of Sigma-Aldrich Corporation (the Company) of our report dated February 7, 2013, with respect to the consolidated balance sheets of Sigma-Aldrich Corporation as of December 31, 2012 and 2011, and the related consolidated statements of income, comprehensive income, stockholders' equity and cash flows for each of the years in the three-year period ended December 31, 2012, and the effectiveness of internal control over financial reporting as of December 31, 2012, which report appears in the December 31, 2012 annual report on Form of Sigma-Aldrich Corporation.
Our report dated February 7, 2013 contains an explanatory paragraph that states the scope of management's assessment of the effectiveness of internal control over financial reporting includes all of the Company's subsidiaries except BioReliance Holdings, Inc. (BioReliance), which was acquired by the Company on January 31, 2012. Our audit of internal control over financial reporting of the Company also excluded an evaluation of the internal control over financial reporting of BioReliance as of December 31, 2012.
/s/ KPMG LLP
St. Louis, MissouriFebruary 7, 2013
Exhibit 31.1CEO FORM 10-K CERTIFICATION
I, Rakesh Sachdev, certify that:
1. I have reviewed this Annual Report on Form 10-K of Sigma-Aldrich Corporation;
2. Based on my knowledge, this report does not contain any untrue statement of a material fact or omit to state a material fact necessary to make the statements made, in light of the circumstances under which such statements were made, not misleading with respect to the period covered by this report;
3. Based on my knowledge, the financial statements, and other financial information included in this report, fairly present in all material respects the financial condition, results of operations and cash flows of the registrant as of, and for, the periods presented in this report;
4. The registrant’s other certifying officer and I are responsible for establishing and maintaining disclosure controls and procedures (as defined in Exchange Act Rules 13a-15(e) and 15d-15(e)) and internal control over financial reporting (as defined in Exchange Act Rules 13a-15(f) and 15d-15(f)) for the registrant and have:
a) Designed such disclosure controls and procedures, or caused such disclosure controls and procedures to be designed under our supervision, to ensure that material information relating to the registrant, including its consolidated subsidiaries, is made known to us by others within those entities, particularly during the period in which this report is being prepared;
b) Designed such internal control over financial reporting, or caused such internal control over financial reporting to be designed under our supervision, to provide reasonable assurance regarding the reliability of financial reporting and the preparation of financial statements for external purposes in accordance with generally accepted accounting principles;
c) Evaluated the effectiveness of the registrant’s disclosure controls and procedures and presented in this report our conclusions about the effectiveness of the disclosure controls and procedures, as of the end of the period covered by this report based on such evaluation; and
d) Disclosed in this report any change in the registrant’s internal control over financial reporting that occurred during the registrant’s most recent fiscal quarter (the registrant’s fourth fiscal quarter in the case of an annual report) that has materially affected, or is reasonably likely to materially affect, the registrant’s internal control over financial reporting.
5. The registrant’s other certifying officer and I have disclosed, based on our most recent evaluation of internal control over financial reporting, to the registrant’s auditors and the audit committee of the registrant’s board of directors (or persons performing the equivalent functions):
a) All significant deficiencies and material weaknesses in the design or operation of internal control over financial reporting which are reasonably likely to adversely affect the registrant’s ability to record, process, summarize and report financial information; and
b) Any fraud, whether or not material, that involves management or other employees who have a significant role in the registrant’s internal control over financial reporting.
Date: February 7, 2013
/s/ Rakesh SachdevRakesh SachdevPresident and Chief Executive Officer
Exhibit 31.2CFO FORM 10-K CERTIFICATION
I, Jan A. Bertsch, certify that:
1. I have reviewed this Annual Report on Form 10-K of Sigma-Aldrich Corporation;
2. Based on my knowledge, this report does not contain any untrue statement of a material fact or omit to state a material fact necessary to make the statements made, in light of the circumstances under which such statements were made, not misleading with respect to the period covered by this report;
3. Based on my knowledge, the financial statements, and other financial information included in this report, fairly present in all material respects the financial condition, results of operations and cash flows of the registrant as of, and for, the periods presented in this report;
4. The registrant’s other certifying officer and I are responsible for establishing and maintaining disclosure controls and procedures (as defined in Exchange Act Rules 13a-15(e) and 15d-15(e)) and internal control over financial reporting (as defined in Exchange Act Rules 13a-15(f) and 15d-15(f)) for the registrant and have:
a) Designed such disclosure controls and procedures, or caused such disclosure controls and procedures to be designed under our supervision, to ensure that material information relating to the registrant, including its consolidated subsidiaries, is made known to us by others within those entities, particularly during the period in which this report is being prepared;
b) Designed such internal control over financial reporting, or caused such internal control over financial reporting to be designed under our supervision, to provide reasonable assurance regarding the reliability of financial reporting and the preparation of financial statements for external purposes in accordance with generally accepted accounting principles;
c) Evaluated the effectiveness of the registrant’s disclosure controls and procedures and presented in this report our conclusions about the effectiveness of the disclosure controls and procedures, as of the end of the period covered by this report based on such evaluation; and
d) Disclosed in this report any change in the registrant’s internal control over financial reporting that occurred during the registrant’s most recent fiscal quarter (the registrant’s fourth fiscal quarter in the case of an annual report) that has materially affected, or is reasonably likely to materially affect, the registrant’s internal control over financial reporting.
5. The registrant’s other certifying officer and I have disclosed, based on our most recent evaluation of internal control over financial reporting, to the registrant’s auditors and the audit committee of the registrant’s board of directors (or persons performing the equivalent functions):
a) All significant deficiencies and material weaknesses in the design or operation of internal control over financial reporting which are reasonably likely to adversely affect the registrant’s ability to record, process, summarize and report financial information; and
b) Any fraud, whether or not material, that involves management or other employees who have a significant role in the registrant’s internal control over financial reporting.
Date: February 7, 2013
/s/ Jan A. BertschJan A. BertschExecutive Vice President, Chief Financial Officer and Treasurer
Exhibit 32.1CERTIFICATION PURSUANT TO
18 U.S.C. SECTION 1350,AS ADOPTED PURSUANT TO
SECTION 906 OF THE SARBANES-OXLEY ACT OF 2002
In connection with the annual report of Sigma-Aldrich Corporation (the “Company”) on Form 10-K for the period ending December 31, 2012, as filed with the Securities and Exchange Commission on the date hereof (the “Report”), I, Rakesh Sachdev, President and Chief Executive Officer of the Company, certify, to the best of my knowledge, pursuant to 18 U.S.C. §1350, as adopted pursuant to § 906 of the Sarbanes-Oxley Act of 2002, that:
(1) The Report fully complies with the requirements of Section 13(a) or 15(d) of the Securities Exchange Act of 1934; and
(2) The information contained in the Report fairly presents, in all material respects, the financial condition and results of operations of the Company.
/s/ Rakesh SachdevRakesh SachdevPresident and Chief Executive OfficerSigma-Aldrich CorporationFebruary 7, 2013
Exhibit 32.2CERTIFICATION PURSUANT TO
18 U.S.C. SECTION 1350,AS ADOPTED PURSUANT TO
SECTION 906 OF THE SARBANES-OXLEY ACT OF 2002
In connection with the annual report of Sigma-Aldrich Corporation (the “Company”) on Form 10-K for the period ending December 31, 2012 as filed with the Securities and Exchange Commission on the date hereof (the “Report”), I, Jan A. Bertsch, Executive Vice President, Chief Financial Officer and Treasurer of the Company, certify, to the best of my knowledge, pursuant to 18 U.S.C. § 1350, as adopted pursuant to § 906 of the Sarbanes-Oxley Act of 2002, that:
(1) The Report fully complies with the requirements of Section 13(a) or 15(d) of the Securities Exchange Act of 1934; and
(2) The information contained in the Report fairly presents, in all material respects, the financial condition and results of operations of the Company.
/s/ Jan A. BertschJan A. BertschExecutive Vice President, Chief Financial Officer and TreasurerSigma-Aldrich CorporationFebruary 7, 2013
Jason T. Apter Vice President & Managing Director, Asia Pacific
Jan A. Bertsch Executive Vice President, Chief Financial Officer & Treasurer
Gilles A. Cottier Executive Vice President & President, SAFC Commercial
Eric M. Green Executive Vice President & President, Research
Michael F. Kanan Vice President & Corporate Controller
George L. Miller Sr. Vice President, General Counsel & Secretary
Karen J. Miller Sr. Vice President, Corporate Development & Corporate Communications
Douglas W. Rau Vice President, Human Resources
Rakesh Sachdev President & Chief Executive Officer
Gerrit J.C. van den Dool Vice President & Managing Director, Europe, Middle East & Africa
Franklin D. Wicks Executive Vice President & President, Applied
Executive Leadership Team
Rebecca M. Bergman Vice President, New Therapies & Diagnostics, Cardiac Rhythm Disease Management, Medtronic, Inc.
George M. Church, Ph.D. Professor of Genetics at the Harvard Medical School & Director of the Center for Computational Genetics in Cambridge, Massachusetts
Michael L. Marberry President & CEO, J.M. Huber Corporation
W. Lee McCollum Former Executive Vice President & Chief Financial Officer S.C. Johnson & Son, Inc.
Avi M. Nash Managing Director of Avi Nash LLC (Former partner, Goldman Sachs)
Steven M. Paul, M.D. Director of the Appel Alzheimer’s Disease Research Institute & Professor of Neurology, Psychiatry & Pharmacology at Weill Cornell Medical College
J. Pedro Reinhard President of Reinhard and Associates (Former CFO, Dow Chemical Company)
Rakesh Sachdev President & Chief Executive Officer
D. Dean Spatz Former Chairman & CEO, Osmonics, Inc.
Barrett A. Toan Former Chairman & CEO, Express Scripts, Inc.
Board of Directors
Annual Meeting Date: May 7, 2013 Time: 11:00 a.m. CDT Place: Sigma-Aldrich Life Science and High Technology Center, 2909 Laclede Avenue St. Louis, Missouri 63103
General Information Shares traded on NASDAQ Global Select Market Trading symbol: SIAL
Corporate Offices Sigma-Aldrich Corporation 3050 Spruce Street St. Louis, Missouri 63103 800-521-8956 Fax: 314-286-7874 Email: [email protected] Website: sigma-aldrich.com
Transfer Agent American Stock Transfer and Trust Company New York, NY 800-937-5449
Corporate Information
The Form 10-K and other sections of this Annual Report are deemed to include forward-looking statements and are subject to the discussion regarding such forward-looking statements that appear on page iii of the Form 10-K included herein.
Forward-Looking Statements
For the most up-to-date information about our Company visit our Investor Relations website at sigma-aldrich.com
©2013 Sigma-Aldrich Co. LLC. All rights reserved. Sigma, SAFC, Sigma-Aldrich, Aldrich, Cerilliant, Supelco, SAFC Hitech, BioReliance, Fluka, Isotec and Ascentis are trademarks of Sigma-Aldrich Co. LLC, or its affiliates, registered in the US and other countries. Vetec is a trademark of Sigma-Aldrich Co. LLC. KiCqStart is a trademark of Quanta Biosciences, Inc., registered in the U.S. and other countries.
Sigma-Aldrich Corporation3050 Spruce Street St. Louis, Missouri 63103 sigma-aldrich.com
PJZ 80421-506038 1033